Abstract
Polyetheretherketone (PEEK), as the most promising implant material for orthopedics and dental applications, has bone-like stiffness, excellent fatigue resistance, X-ray transparency, and near absence of immune toxicity. However, due to biological inertness, its bone conduction and bone ingrowth performance is limited. The surface modification of PEEK is an option to overcome these shortcomings and retain most of its favorable properties, especially when excellent osseointegration is desired. In this study, a simple reaction procedure was employed to bind the osteogenic growth peptide (OGP) on the surface of PEEK materials by covalent chemical grafting to construct a bioactive interface. The PEEK surface was activated by N,N′-disuccinimidyl carbonate (DSC) after hydroxylation, and then OGP was covalently grafted with amino groups. The functionalized surface of PEEK samples were characterized by X-ray photoelectron spectroscopy (XPS), Fourier-transform infrared spectroscopy (FT-IR), water contact angle measurement and biological evaluation in vitro. OGP-functionalized PEEK surface significantly promoted the attachment, proliferation, alkaline phosphatase (ALP) activity and mineralization of pre-osteoblast cells (MC3T3-E1). The in vivo rat tibia implantation model is adopted and micro-CT analyses demonstrated that the OGP coating significantly promoted new bone formation around the samples. The in vitro and in vivo results reveal that the modification by covalent chemical functionalization with OGP on PEEK surface can augment new bone formation surrounding implants compared to bare PEEK and PEEK implant modified by covalently attached OGP is promising in orthopedic and dental applications.
Polyetheretherketone (PEEK), as the most promising implant material for orthopedics and dental applications, has bone-like stiffness, excellent fatigue resistance, X-ray transparency, and near absence of immune toxicity.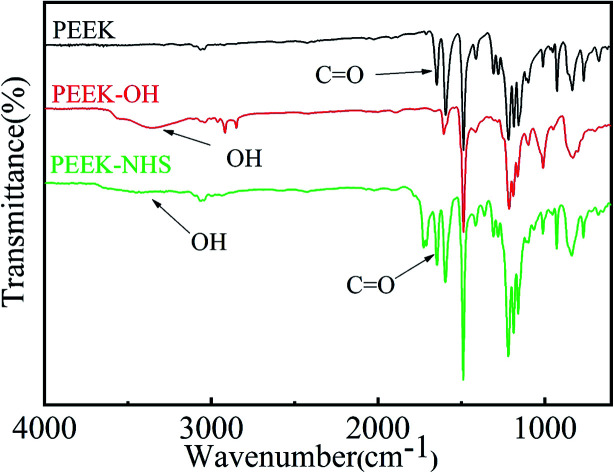
1. Introduction
The prevalence of orthopaedic or bone implants has greatly increased worldwide.1 For several decades, traditional metallic implants made of titanium alloys have been widely used as orthopaedic implants owing to their excellent corrosion resistance, high mechanical strength, and biocompatibility.2 However, the release of harmful metal ions and stress shielding effect caused by the mismatch of elastic modulus between metal and cortical bone may eventually lead to implant failure,3 which is the defect of the metal implant itself. Polymeric materials are not generally strong enough to support repetitive loading without plastic deformation,4 The exception is poly(etheretherketone) (PEEK), which has bone-like stiffness, excellent fatigue resistance, high chemical resistance and near absence of immune toxicity. Moreover, the radiolucency of PEEK helps clinicians clearly assess osseointegration.5,6 The bioinert nature of PEEK strongly limit its clinical applications to biomedical devices in situations where osseointegration is critical.7 Currently, in order to overcome the bio-inertness of PEEK, a large number of researches have been carried out and multiple strategies were found.7–10 It has been demonstrated that the surface chemistry and structures are prime factors governing cell adhesion and growth.11 One of the most important methods is the biofunctionalization of PEEK by surface modification with bioactive molecules, peptide or growth factors.9,10,12
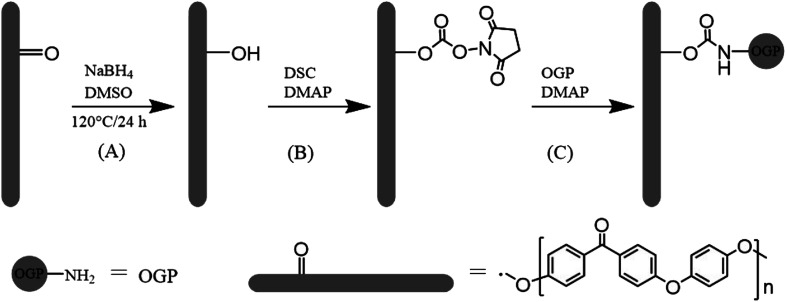
The osteogenic growth peptide (OGP, isoelectric point = 11.4, Mw = 1.5 kDa, Ala-Leu-Lys-Arg-Gln-Gly-Arg-Thr-Leu-Tyr-Gly-Phe-Gly-Gly) is a naturally occurring tetradecapeptide identical to the C-terminal amino acid sequence 89–102 of histone H4 (H4).13 OGP in high abundance occurs physiologically in human and rodent serum and in serum-free medium of osteoblastic and fibroblastic cells.14,15 Several studies have reported that, OGP and its active fragment acted similarly as soluble OGP in vitro, when immobilized on surfaces.16 To translate these findings to biomaterial applications, OGP has been immobilized into polymer scaffolds17–19 and on titanium substrates20–22 to observe its effects on osteoblast cell lines. Previous studies have indicated that immobilization of OGP could accelerate the osseointegration process. Hence, as shown in Scheme 1, in this study, we attempted to enhance cell adhesion, spreading, proliferation and osteogenic differentiation of mouse pre-osteoblasts (MC3T3-E1) on the modified PEEK films with covalently grafted OGP.
Scheme 1. Schematic representation of (A) keto group reduction on the PEEK surface, (B) activation of hydroxyl group with N,N′-disuccinimidyl carbonate and (C) immobilization of OGP.
2. Experimental part
2.1. Materials
The PEEK samples were purchased from Victrex (England). It was cut into disk sample with a diameter of 15 mm and a thickness of 0.5 mm for modification, characterization and in vitro assessment in 24-well tissue culture plates. In order to obtain pristine surface, the PEEK sheets were immersed in refluxing acetone for 48 h, rinsed twice with acetone, and dried under vacuum at 60 °C for 3 h. The OGP peptide (ALKRQGRTLYGFGG, 95% purity) was obtained from GL Biochem (Shanghai) Ltd. (China). Alizarin red-S, calcein-AM, and CCK-8 were purchased from Sigma-Aldrich (St. Louis, MO, USA). Sodium borohydride, N,N′-disuccinimidyl carbonate (DSC), sodium phosphate, ethanolamine hydrochloride, and 4-dimethylaminopyridine (DMAP) were obtained from Aladdin Reagent Co., Ltd (Shanghai, China). DMSO was purified with distillation from calcium hydride before use. All other chemicals and solvents were of analytical grade or higher and used as received. MC3T3-E1 cells were purchased from the Institute of Biochemistry and Cell Biology, Shanghai Institutes for Biological Sciences, Chinese Academy of Sciences.
2.2. Hydroxylation on PEEK surface (PEEK–OH)
A protocol reported by Noiset23et al. was used herein to selectively reduce PEEK surface carbonyl groups to hydroxyl groups (Scheme 1). The hydroxylation of PEEK films was achieved according to the protocol reported by the literature.24 In brief, DMSO had been distilled to remove water and oxygen prior to use. DMSO (70 mL) and sodium borohydride (140 mg) were introduced in a 150 mL round bottomed flask equipped with reflux condenser and heated at 120 °C under stirring until dissolution occurred. PEEK sheets were immersed in the reaction mixture at 120 °C for 24 h under nitrogen, then removed from reaction solution and successively rinsed in stirred methanol for 15 min, distilled water for 10 min, 0.5 M HCl for 10 min, deionized water for 10 min, and ethanol for 10 min, respectively. The sheets were subsequently dried at 60 °C under vacuum for 3 h and stored under N2. The PEEK sheet with surface hydroxyl groups was abbreviated as PEEK–OH.
2.3. Immobilization of OGP peptide on PEEK surface (PEEK–OGP)
N,N′-Disuccinimidyl carbonate was used for activation of hydroxyl group of PEEK–OH. The procedure was performed as previously described.25 In brief, PEEK–OH sheets were immersed in 20 mL of anhydrous DMSO and N,N′-disuccinimidyl carbonate (7 mmol dissolved in 10 mL anhydrous DMSO) was added. 4-Dimethylaminopyridine (7 mmol in 5 mL anhydrous DMSO) was added slowly under magnetic stirring. Activation proceeded for 6 h at room temperature. The activated PEEK–NHS (Scheme 1) was then transferred to a new beaker followed by washing thrice with anhydrous DMSO.
Then, the samples were immersed in 10 mL deionized water containing 1 mg OGP (Scheme 1), and stirred at room temperature for 24 h. PEEK–OGP specimens were then rinsed in ethanolamine hydrochloride solution (0.05 M in deionized water) at room temperature for 4 h in order to eliminate the unreacted NHS groups. The prepared substrates were thoroughly washed with PBS, ultrasonically treated with 1 M sodium chloride for 10 min each to remove weakly bounded peptides.26 And then it was rinsed with distilled water and acetone for 10 min, respectively. The sheets were subsequently dried under vacuum for 3 h and stored under N2. The finally obtained PEEK sheet was designated as PEEK–OGP.
2.4. Surface characterization
FT-IR (Bio-Rad Win-IR spectrometer, UK) was used to detect chemical groups. The FT-IR spectra were carried out in the wavelength range between 600 and 4000 cm−1 with a resolution of 2 cm−1. X-ray photoelectron spectroscopy (XPS) (Thermo) was used to detect the surface chemical constituents and to confirm the presence of OGP on PEEK surfaces. Surface hydrophilicity of the specimens was assessed using the sessile drop method on a contact angle system (VCA 2000, AST) by placing 2 μL of distilled water on the PEEK surface. Each different substrate was measured at three separate points and the final values were an average of these measurements with the standard deviation.
2.5. Biological response
2.5.1. Cell culture
In vitro experiments were performed to assess the ability of different samples to support MC3T3-E1 cell adhesion, spreading, proliferation, extracellular matrix secretion, and to further induce osteogenic differentiation. MC3T3-E1 cells have been frequently used for elucidating the responses of bone cells to biomaterials. The cells were incubated in Dulbecco's modified Eagle medium (DMEM, Gibco) supplement with 10% fetal bovine serum (FBS, Gibco), and 100 U mL−1 penicillin (Sigma) and 100 mg L−1 streptomycin (Sigma) in a humidified atmosphere of 5% CO2 at 37 °C. The cell culture medium was refreshed every other day. Prior to cell culture, all samples were sterilized with 75% alcohol for 40 min and rinsed thrice with sterile PBS and rinsed with the cell culture medium for 5 min.
2.5.2. Cell adhesion and spreading
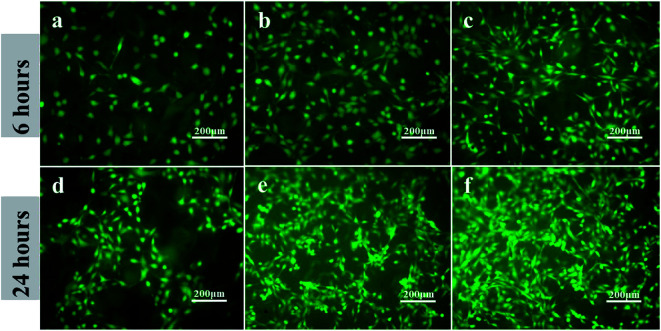
To investigate the effect of surface modification on cell adhesion and spreading, MC3T3-E1 cells were seeded on the samples in 24-well tissue culture plates at a density of 2 × 10⁴ cells per well and incubated for 6 h and 24 h, respectively (n = 3). The seeded samples were washed three times with PBS in order to remove the unattached cells. At each time interval, the samples were washed with PBS and fixed with 4% paraformaldehyde (PFA) after being stained with 2 μM calcein-AM (green fluorescence for live cells). Images were captured by fluorescence microscopy (TE2000U, Nikon, JPN).
Cell spreading morphology was also visualized by scanning electron microscope (SEM). After cultured for 24 h, the medium was removed, and the samples were rinsed with PBS and then fixed in 4% PFA solution for 30 min. The PFA solution was then removed, and the samples were washed thrice with PBS and dehydrated using a graded series of ethanol aqueous solutions from 50% to 100% v/v. The samples were kept in each solution for 30 min. Finally, the critically dried samples were sputtered with gold and examined under SEM.
2.5.3. Cell proliferation
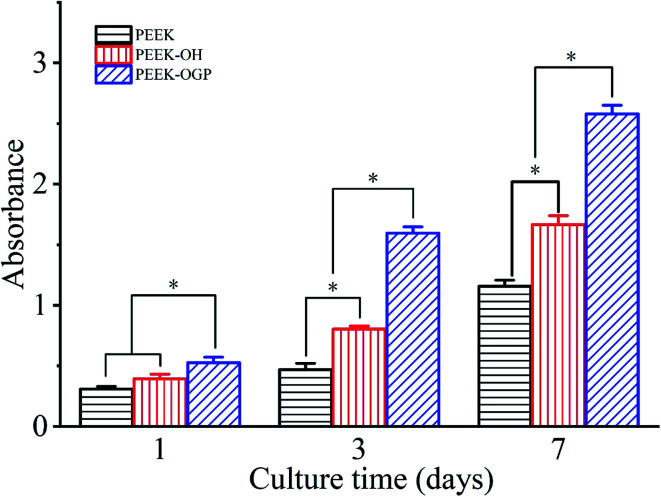
The CCK-8 assay was employed to determine the proliferation of MC3T3-E1 cells on the samples. MC3T3-E1 cells were seeded only on the samples in 24-well tissue culture plates at a density of 2 × 10⁴ cells per well and cultured for 1, 3 and 7 days. At the prescribed time points, 100 μL per well of CCK-8 was added to the medium. After 2 h of incubation, the absorbance values at 450 nm were measured on a multifunctional micro-plate scanner (Tecan Infinite M200).
2.5.4. Alkaline phosphate activity (ALP) assay
Intracellular alkaline phosphatase (ALP) activities were measured using a previously established protocol.9 Briefly, MC3T3-E1 cells were cultured on the different substrates with an initial seeding density of 2 × 10⁴ cells per well for 7 and 14 days, respectively. The medium in each well was carefully removed, and the cells were rinsed thrice with PBS at these time points. Afterwards, the cells were lysed in RIPA buffer, followed by freezing and thawing repeatedly twice. Next, 50 μL of cell lysis solution was incubated with 200 μL of pNPP liquid substrate at 37 °C for 30 min. Absorbance at 405 nm was measured on a multifunction micro-plate scanner. The average absorbance values were used to reflect the level of ALP activity. The BCA assay kit was used to measure the total protein quantity for normalization.
2.5.5. Mineralization of MC3T3-E1 cells
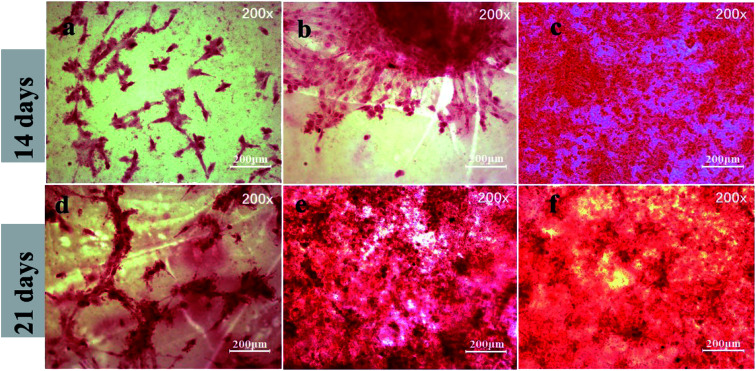
Alizarin red staining was used to detect the mineralization of MC3T3-E1 cells. The staining assay was performed as described in a previous study.9 Briefly, MC3T3-E1 cells were cultured on the different samples at a density of 2 × 10⁴ cells per well for 14 and 21 days, respectively. At the prescribed time points, samples were washed three times in PBS and fixed in 4% PFA solution for 30 min. Then, 40 mM Alizarin red stain was added to the cell culture plates and incubated for 30 min. After washing three times in PBS, the different samples were observed under a light microscope. For quantitative analysis, the adsorbed Alizarin red was dissolved with 10% cetylpyridinium chloride in 10 mM sodium phosphate (pH = 7.0) and the absorbance was measured using a microplate reader at a wavelength of 540 nm.
2.6. In vivo studies
2.6.1. Surgical procedures
The experimental protocol was performed in strict accordance with the NIH guidelines for the care and use of laboratory animals (NIH publication no. 85-23 rev. 1985) and was approved by the Laboratory Animal Welfare & Ethics Committee, College of Basic Medical Sciences, Jilin University (Changchun, China). The PEEK samples were inserted into the proximal tibia of rat.27 Briefly, under general anesthesia via intraperitoneal injection of 4% chloral hydrate (0.9 mL per 100 g rat weight), surgery on Sprague Dawley rats (10 SD rats, 12 weeks old, male) was performed under sterile conditions. The hind leg was shaved thoroughly and disinfected, and a sterile sheet was used to cover the rat body while the area under operation remained exposed. For implantation, the proximal tibia was exposed by a 1.5 cm longitudinal incision through the skin. Muscle was separated using blunt dissection. Using a 2 mm diameter drill bit, a hole was made approximately 2–5 mm distal from the tibial metaphysis. The sterile implants (2 mm in diameter and 6 mm in length) were inserted and the wound was closed carefully. Each rat received one implant per tibia (two per rat) with each animal receiving uncoated and OGP-coated implant, implant coating group randomized between left and right leg. After surgery, the rats were allowed to bear weight immediately after surgery in separate cages without any restrictions and underwent ad libitum feeding.
2.6.2. Sample preparation
The rats were sacrificed by carbon dioxide euthanasia at 2 and 4 weeks post-surgery (5 rats at each time point). The tibias with the implants were harvested and fixed in 10% buffered formaldehyde for further analysis.
2.6.3. Micro-CT analysis
The newly grown bone was evaluated using micro-CT (Skyscan 1172, Bruker micro CT, German) and scanned at 80 kV without filter with a resolution of 13.6 μm. Two-dimensional (2D) and three-dimensional (3D) models were reconstructed and generated using NRecon software (Skyscan, USA) and CTvol program (Skyscan). The percentage of new bone (bone volume/total volume, BV/TV) was calculated.
2.7. Statistical analysis
All experiments were performed at least in triplicate. Quantitative data are expressed as the mean ± standard deviation (SD). Statistically significant differences (p) among groups were measured using one-way analysis of variance (ANOVA) followed by Tukey's multiple-comparison analysis using SPSS 19.0 software. Paired t-test for in vivo evaluation was used to determine the statistical significance of observed differences. p < 0.05 was considered statistically significant.
3. Results and discussion
3.1. Carbonyl reduction on PEEK surface
Fig. 1 shows the ATR-FTIR spectra of PEEK and PEEK–OH. Compared to PEEK, the broad stretching band for hydroxyl groups was observed around 3400 cm−1 and a diminution in the intensity of the carbonyl band at 1648 cm−1 was clearly visible in the PEEK–OH spectra corroborated the conversion from carbonyl groups to hydroxyl groups.28 In order to quantitatively track the reduction process, the ratio between the absorbance of the carbonyl peak at 1648 cm−1 and the absorbance of the reference band (almost unchanging) at 1490 cm−1 due to the aromatic rings was calculated for PEEK and PEEK–OH. The value decreased from 0.306 for PEEK to 0.002 for PEEK–OH suggesting that the carbonyl group was successfully reduced.
Fig. 1. ATR-FTIR spectra of PEEK, PEEK–OH, and PEEK–NHS.
The static water contact angles (CAwater) were evaluated to analyse the hydrophilicity of the modified surface. The measured water contact angles are summarized as a histogram in Fig. 2, and the images of the water droplets on the samples are presented in the top right of each column in Fig. 2. Pure PEEK surfaces exhibited water contact angles of 71.22° ± 5.17°. Furthermore, after hydroxylation of PEEK, the existence of surface hydroxyl groups improved the surface wettability, and then the contact angle of the surface decreased to 49.78° ± 2.43° (Fig. 2). On the basis of these observations, it can be safely concluded that surface hydroxylation of PEEK sheet was successfully achieved through selective carbonyl reduction.10
Fig. 2. Contact angle of PEEK after surface treatment. Statistical significance is indicated by *p < 0.05.
3.2. Immobilization of OGP on PEEK surface
The immobilization of OGP accompanied by the degradation of NHS active groups which was used to activate PEEK surfaces reacting with the amino group of OGP as depicted in Fig. 1. After OGP modification, the water contact angle of PEEK–OGP was significantly decreased to 40.39° ± 2.15° (Fig. 2). These results could be attributed to the OGP peptide molecule layer and the introduction of OGP can elevate the hydrophilicity of the modified PEEK.
XPS analysis was carried out to explore the chemical element changes in the samples at each step of the modification, and the results are presented in (Fig. 3). N peaks were identified on the PEEK–OGP spectra, indicating that OGP was successfully immobilized on the surface of PEEK.
Fig. 3. Composition and distribution of different elements in different samples revealed by XPS.
3.3. Biological response
3.3.1. Cell adhesion
Cellular biological responses to osteoblastic functions include cell adhesion, spreading, proliferation, relevant enzyme (ALP) activity, calcium deposition and expression of osteogenesis-related genes.29 Cell adhesion is a critical factor to reflect the biocompatibility of implants and a prerequisite for cell proliferation and differentiation.30,31 Furthermore, surface modification plays a most important role in determining the initial success of a bioengineered implant. In this study, calcein-AM staining method was chosen to evaluate the adhesion of MC3T3-E1 cells on the different PEEK substrates under fluorescent microscopy. SEM images showed the spreading morphology of MC3T3-E1 cells after 24 h culture in different samples.
As shown in Fig. 4, after cultured for 6 and 24 h, PEEK with the immobilization of OGP (Fig. 4c and f) showed significantly higher cell density compared to the PEEK without OGP immobilization (Fig. 4a and d). Besides, as shown in Fig. 4b, the hydroxylated PEEK surface also improved cell adhesion to some extent. Although the pre-osteoblasts on the samples exhibited spindle-shaped or rounded morphologies after incubation for 6 h, the attached pre-osteoblasts on the PEEK–OH and PEEK–OGP were elongated and the rounded pre-osteoblasts on the PEEK–OGP had more pseudopods extensions than that on the PEEK and PEEK–OH (Fig. 4). In addition, more better cell spreading was observed on the PEEK substrates with immobilization of OGP instead of that on the untreated PEEK which remained as isolated single cells.
Fig. 4. Adhesion of MC3T3-E1 cells on various samples after 6 h and 24 h incubation. PEEK (a and d), PEEK–OH (b and e), PEEK–OGP (c and f).
As shown in Fig. 5, the cell spreading morphology differed greatly on various sample surfaces. The MC3T3-E1 cells attached on pure PEEK showed a spheroid shape and cells on the PEEK–OH samples were found to be transformed from spheroid shape to thread spindles, the MC3T3-E1 spreading on PEEK–OGP stretched more and exhibited more filopodia than in the PEEK control.
Fig. 5. Cell spreading morphologies of MC3T3-E1 detected by SEM at low and high magnifications after 24 hours of culture on different samples.
Thus, these results suggested that the immobilization of OGP on the PEEK films would be more favourable for cell adhesion and spreading.
3.3.2. Cell proliferation
Cell proliferation measured by the CCK-8 assay is shown in Fig. 6. The cell proliferation of MC3T3-E1 cells on the PEEK–OH and PEEK–OGP was significantly increased than that on the PEEK in time-dependent manner, revealing the improved cytocompatibility after treatment. In addition, significantly increased cell proliferation can be observed on the PEEK–OGP at the end of day 3 and 7 compared to PEEK–OH and PEEK. These results indicated that the OGP peptide immobilized PEEK surface had a beneficial effect on osteoblasts spreading and proliferation. The results showed that the cell adhesion and proliferation were significantly enhanced on PEEK–OGP compared to the PEEK and no cytotoxic effects was found from the MC3T3-E1 cells.
Fig. 6. Cell proliferation of MC3T3-E1 pre-osteoblasts cultured on the PEEK, PEEK–OH and PEEK–OGP for 1, 3 and 7 days. Statistical significance is indicated by *p < 0.05.
Cell adhesion is correlated with the cellular ability to survive and initiate proliferation on the substrate surface, with consequently increased cell spreading, increased cell survival, and cell cycling. Cell proliferation is closely correlated with the amount of new bone formation. Hence, better cell adhesion, spreading, and proliferation probably results in a larger amount of bone tissue around the implants and robust bone-implant bonding in vivo.
3.3.3. Alkaline phosphate activity assay
Alkaline phosphate activity (ALP) plays a crucial role during the differentiation stage and is recognized as an indicator of early interim-osteoblast differentiation.32 Therefore, we evaluated the osteoblast differentiation of MC3T3-E1 cells cultured on the different samples by measuring ALP activity. Fig. 7 shows the ALP activity of MC3T3-E1 cells cultured on the different substrates for 7 and 14 days. After culturing for 7 and 14 days, the ALP activity of MC3T3-E1 cells cultured on the PEEK–OH was slightly higher than that on PEEK. This might be because the hydroxyl group and improved hydrophilicity has positive correlation with osteogenesis. Significantly higher ALP activities were detected in cells cultured on PEEK–OGP, indicating that OGP immobilized samples could effectively enhance MC3T3-E1 cells osteo-differentiation.
Fig. 7. Alkaline phosphatase activity (ALP) of MC3T3-E1 cells grown on different samples after incubation for 7 and 14 days, which was detected using the pNPP method. *p < 0.05, n = 3.
3.3.4. Mineralization of MC3T3-E1 cells
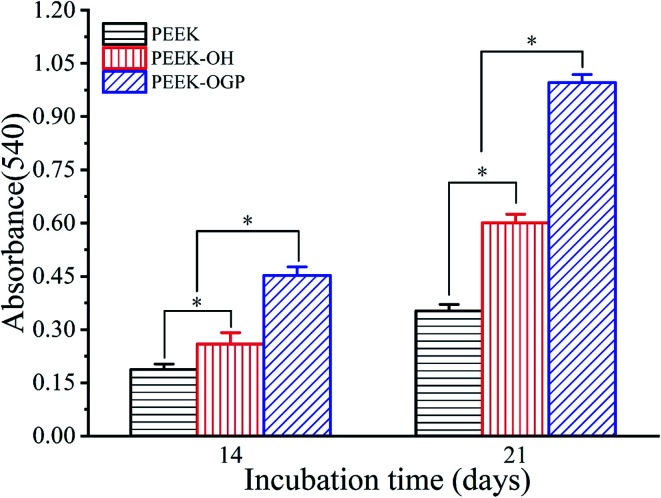
In order to evaluate the capacity of different samples to induce osteogenesis at late stages of differentiation, ARS staining was used to detect calcium deposition after incubation for 14 and 21 days. Fig. 8 shows the microscopic images after incubation for 14 days. ARS staining showed some mineral nodular deposits on PEEK–OH (Fig. 8(b)), whereas almost no positive staining was observed on pure PEEK (Fig. 8(a)), demonstrating that the PEEK–OH could facilitate calcium mineralization of MC3T3-E1 cells. Moreover, Fig. 8(c and f) indicated that the quantity of calcium minerals on the PEEK–OGP samples was higher than that on PEEK–OH, which was corresponded with the results of our ALP activity study, indicating that OGP coating could enhance osteo-differentiation of MC3T3-E1 cells.
Fig. 8. Alizarin red staining for mineralization of MC3T3-E1 cells cultured on various samples after 14 day incubation is shown in the images (a–c) and the results after incubation for 21 days are shown in the images (d–f).
ARS staining was also performed after 21 day incubation, and the microscopic images are displayed in Fig. 8(d–f). These showed more significant differences in the calcium minerals between each group after 21 day incubation. Among all the groups, the most enhanced mineral nodules were observed for the PEEK–OGP, which was corresponded with the 14 day analysis. The results demonstrated that the OGP could significantly enhance cell differentiation compared to that observed with the PEEK–OH. Moreover, Fig. 9 indicates that the quantity of calcium minerals on PEEK–OH and PEEK–OGP was higher than that on PEEK, which corresponded with the results of our ALP activity study. The samples modified with OGP showed significantly higher calcium deposition than those of PEEK and PEEK–OH as shown in Fig. 9, indicating that immobilization of OGP on the PEEK surface could enhance osteodifferentiation of MC3T3-E1 cells.
Fig. 9. Quantitative analysis of calcium minerals on different samples. *p < 0.05, n = 3.
It is widely accepted that the initial interactions between the cells and implant surface are crucial to clinical success and improvement can lead to faster bone formation.33 In this investigation, the results show that cell adhesion and proliferation are significantly enhanced on PEEK–OGP compared to the PEEK and no cytotoxic effects can be found from the MC3T3-E1 cells. Therefore, PEEK modified with OGP on its surface may produce more bone tissues around the implants and more robust bone-implant integration is also expected in vivo.
3.4. Osteogenic properties in vivo
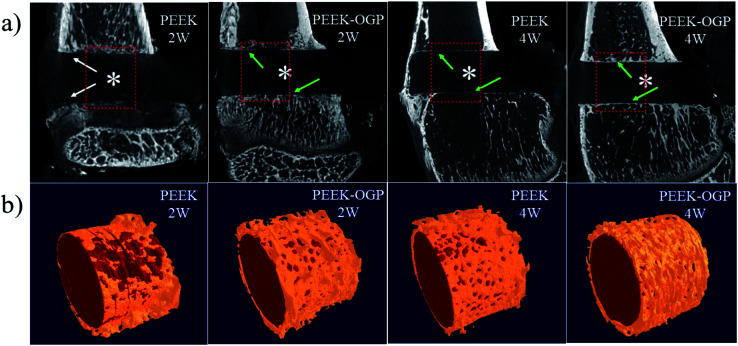
At 2 weeks and 4 weeks post-implantation, the new bone formations are detected by micro-CT. The 2D and 3D reconstructed micro-CT images of the two groups are displayed in Fig. 10. Fig. 10a shows representative 2D micro-CT images of transverse sections of rat tibial metaphysis implanted with different samples. The white asterisks mark the position of the implanted samples. As observed generally, two weeks after implantation, obvious gap could be seen around PEEK (white arrows), but the newly formed bone was obviously surrounding the latter.
Fig. 10. (a) Characterization of local tibial metaphysis surrounding different samples detected by micro-CT. The white asterisks marked the location of different samples, the white arrows mark the gap and the green arrows mark the new bone formation between bone implant interface. (b) Corresponding 3D reconstruction of different samples (red) and their surrounding new bone (yellow).
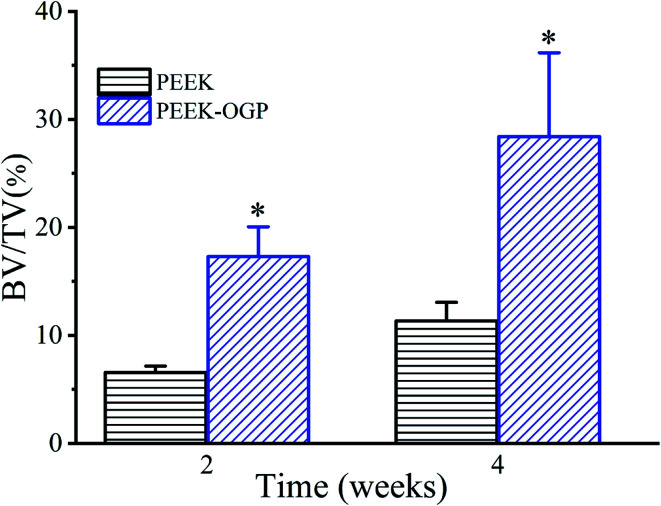
More new bone can be observed around PEEK–OGP implants compared to bare PEEK, indicating that PEEK–OGP possessed superior osteoconduction in vivo. Fig. 10b shows the 3D reconstruction of different samples (red) and their surrounding new bone (yellow). There was negligible bone around PEEK, but a lot of bone were observed around the PEEK–OGP. The bone volume fraction (bone volume/total volume, BV/TV) of the new bone were respectively shown in Fig. 11, and the values of PEEK–OGP were obviously higher at all the different time points.
Fig. 11. Corresponding values of new bone volume/total volume (BV/TV) for various samples, respectively; *p < 0.05.
Previous studies have shown that osseointegration direct osteoblast colonization on an implant surface, synthesizing extracellular bone matrix and finally forming new bone.12,18,34 The results above indicate that PEEK with the OGP coating significantly enhanced new bone formation compared with the pristine PEEK control, which corresponded to the proliferation and osteogenic differentiation of MC3T3-E1 in vitro. Previous studies reported that OGP modification of nanoparticles or polymers yielded higher osteo-related protein expression and calcified bone formation.17,18 Hence, functionalized PEEK, after modification with OGP, enhanced new bone formation around the implant and further promoted ossification between the implant and the bone. These findings confirm that the OGP-decorated PEEK favoured the improvement of in vivo osteoconduction.
4. Conclusions
OGP was successfully immobilized on the PEEK surface by covalent bond. As the in vitro results shown, the samples with immobilized OGP exhibited excellent osteogenic activity. In addition, the in vitro results show that the samples immobilized with OGP can promote the bone related proteins expression. The in vivo results agree well with the in vitro results, the newly formed bone around the samples loaded with OGP is more than the pristine substrate in the rat tibias. Revealing that PEEK sample with the covalently bonded OGP could have huge potential for orthopaedic and dental applications.
Conflicts of interest
There are no conflicts to declare.
Supplementary Material
Acknowledgments
This research was financially supported by the National Natural Science Foundation of China (Projects. 51473164 and 51673186), the joint funded program of Chinese Academy of Sciences and Japan Society for the Promotion of Science (GJHZ1519), Achievement Transformation Fund of the First Hospital of Jilin University (JDYYZH-1902043), Jilin Medical and Health Talents Special project (JLSCZD2019-023), and the Special Fund for Industrialization of Science and Technology Cooperation between Jilin Province and Chinese Academy of Sciences (2017SYHZ0021).
Electronic supplementary information (ESI) available. See DOI: 10.1039/d0ra00103a
Notes and references
- Stewart C. Akhavan B. Wise S. G. Bilek M. M. M. Prog. Mater. Sci. 2019;106:40. doi: 10.1016/j.pmatsci.2019.100588. [DOI] [Google Scholar]
- Liu X. Chu P. K. Ding C. Mater. Sci. Eng., R. 2004;47:49–121. doi: 10.1016/j.mser.2004.11.001. [DOI] [Google Scholar]
- Chen Q. Thouas G. A. Mater. Sci. Eng., R. 2015;87:1–57. doi: 10.1016/j.mser.2014.10.001. [DOI] [Google Scholar]
- Pruitt L. Furmanski J. Jom. 2009;61:14–20. doi: 10.1007/s11837-009-0126-3. [DOI] [Google Scholar]
- Kurtz S. M. Devine J. N. Biomaterials. 2007;28:4845–4869. doi: 10.1016/j.biomaterials.2007.07.013. [DOI] [PMC free article] [PubMed] [Google Scholar]
- Toth J. M. Wang M. Estes B. T. Scifert J. L. Seim H. B. Turner A. S. Biomaterials. 2006;27:324–334. doi: 10.1016/j.biomaterials.2005.07.011. [DOI] [PubMed] [Google Scholar]
- Ren Y. Sikder P. Lin B. Bhaduri S. B. Mater. Sci. Eng. C. 2018;85:107–113. doi: 10.1016/j.msec.2017.12.025. [DOI] [PubMed] [Google Scholar]
- Sui J.-L. Li M.-S. Lü Y.-P. Yin L.-W. Song Y.-J. Surf. Coat. Technol. 2004;176:188–192. doi: 10.1016/S0257-8972(03)00646-7. [DOI] [Google Scholar]
- Wan T. Li L. Guo M. Jiao Z. Wang Z. Ito Y. Wan Y. Zhang P. Liu Q. J. Mater. Sci. 2019;54:11179–11196. doi: 10.1007/s10853-018-03264-z. [DOI] [Google Scholar]
- Zheng Y. Xiong C. Li X. Zhang L. Appl. Surf. Sci. 2014;320:93–101. doi: 10.1016/j.apsusc.2014.09.091. [DOI] [Google Scholar]
- Zhu X. Chen J. Scheideler L. Reichl R. Geis-Gerstorfer J. Biomaterials. 2004;25:4087–4103. doi: 10.1016/j.biomaterials.2003.11.011. [DOI] [PubMed] [Google Scholar]
- Zheng Y. Liu L. Xiao L. Zhang Q. Liu Y. Colloids Surf., B. 2019;173:591–598. doi: 10.1016/j.colsurfb.2018.10.031. [DOI] [PubMed] [Google Scholar]
- Bab I. Gazit D. Chorev M. Muhlrad A. Shteyer A. Greenberg Z. Namdar M. Kahn A. EMBO J. 1992;11:1867–1873. doi: 10.1002/j.1460-2075.1992.tb05238.x. [DOI] [PMC free article] [PubMed] [Google Scholar]
- Greenberg Z. Chorev M. Muhlrad A. Shteyer A. Namdar-Attar M. Casap N. Tartakovsky A. Vidson M. Bab I. J. Clin. Endocrinol. Metab. 1995;80:2330–2335. doi: 10.1210/jcem.80.8.7629225. [DOI] [PubMed] [Google Scholar]
- Greenberg Z. Gavish H. Muhlrad A. Chorev M. Shteyer A. Attar-Namdar M. Tartakovsky A. Bab I. J. Cell. Biochem. 1997;65:359–367. doi: 10.1002/(SICI)1097-4644(19970601)65:3<359::AID-JCB6>3.0.CO;2-R. [DOI] [PubMed] [Google Scholar]
- Gabet Y. Müller R. Regev E. Sela J. Shteyer A. Salisbury K. Chorev M. Bab I. Bone. 2004;35:65–73. doi: 10.1016/j.bone.2004.03.025. [DOI] [PubMed] [Google Scholar]
- Pigossi S. C. de Oliveira G. J. P. L. Finoti L. S. Nepomuceno R. Spolidorio L. C. Rossa Jr C. Ribeiro S. J. L. Saska S. Scarel-Caminaga R. M. J. Biomed. Mater. Res., Part A. 2015;103:3397–3406. doi: 10.1002/jbm.a.35472. [DOI] [PubMed] [Google Scholar]
- Policastro G. M. Lin F. Smith Callahan L. A. Esterle A. Graham M. Sloan Stakleff K. Becker M. L. Biomacromolecules. 2015;16:1358–1371. doi: 10.1021/acs.biomac.5b00153. [DOI] [PubMed] [Google Scholar]
- Stakleff K. S. Lin F. Smith Callahan L. A. Wade M. B. Esterle A. Miller J. Graham M. Becker M. L. Acta Biomater. 2013;9:5132–5142. doi: 10.1016/j.actbio.2012.08.035. [DOI] [PubMed] [Google Scholar]
- Chen C. Kong X. Zhang S.-M. Lee I.-S. Appl. Surf. Sci. 2015;334:62–68. doi: 10.1016/j.apsusc.2014.08.041. [DOI] [Google Scholar]
- Chen C. Li H. Kong X. Zhang S.-M. Lee I.-S. Int. J. Nanomed. 2014;10:283–295. doi: 10.2147/IJN.S74746. [DOI] [PMC free article] [PubMed] [Google Scholar]
- Tang W. Policastro G. M. Hua G. Guo K. Zhou J. Wesdemiotis C. Doll G. L. Becker M. L. J. Am. Chem. Soc. 2014;136:16357–16367. doi: 10.1021/ja508946h. [DOI] [PubMed] [Google Scholar]
- Noiset O. Henneuse C. Schneider Y.-J. Marchand-Brynaert J. Macromolecules. 1997;30:540–548. doi: 10.1021/ma960368+. [DOI] [Google Scholar]
- Wu J. Li L. Fu C. Yang F. Jiao Z. Shi X. Ito Y. Wang Z. Liu Q. Zhang P. Colloids Surf., B. 2018;169:233–241. doi: 10.1016/j.colsurfb.2018.05.027. [DOI] [PubMed] [Google Scholar]
- Sawayama T. Tsukamoto M. Sasagawa T. Nishimura K. Deguchi T. Takeyama K. Hosoki K. Chem. Pharm. Bull. 1990;38:110–115. doi: 10.1248/cpb.38.110. [DOI] [PubMed] [Google Scholar]
- Dee K. C. Andersen T. T. Bizios R. Tissue Eng. 1995;1:135–145. doi: 10.1089/ten.1995.1.135. [DOI] [PubMed] [Google Scholar]
- Agarwal R. González-García C. Torstrick B. Guldberg R. E. Salmerón-Sánchez M. García A. J. Biomaterials. 2015;63:137–145. doi: 10.1016/j.biomaterials.2015.06.025. [DOI] [PMC free article] [PubMed] [Google Scholar]
- Díez-Pascual A. M. Martínez G. Gómez M. A. Macromolecules. 2009;42:6885–6892. doi: 10.1021/ma901208e. [DOI] [Google Scholar]
- Scotchford C. A. Ball M. Winkelmann M. Vörös J. Csucs C. Brunette D. M. Danuser G. Textor M. Biomaterials. 2003;24:1147–1158. doi: 10.1016/S0142-9612(02)00488-X. [DOI] [PubMed] [Google Scholar]
- DeLise A. M. Fischer L. Tuan R. S. Osteoarthr. Cartil. 2000;8:309–334. doi: 10.1053/joca.1999.0306. [DOI] [PubMed] [Google Scholar]
- Hu X. Neoh K. G. Shi Z. Kang E. T. Poh C. Wang W. Biomaterials. 2010;31:8854–8863. doi: 10.1016/j.biomaterials.2010.08.006. [DOI] [PubMed] [Google Scholar]
- Ni P. Xie J. Chen C. Jiang Y. Zhao Z. Zhang Y. Lu Y. Yu J. Microchim. Acta. 2019;186:320. doi: 10.1007/s00604-019-3423-8. [DOI] [PubMed] [Google Scholar]
- Zhao Y. Wong H. M. Wang W. Li P. Xu Z. Chong E. Y. W. Yan C. H. Yeung K. W. K. Chu P. K. Biomaterials. 2013;34:9264–9277. doi: 10.1016/j.biomaterials.2013.08.071. [DOI] [PubMed] [Google Scholar]
- Sun Z. J. Ouyang L. P. Ma X. H. Qiao Y. Q. Liu X. Y. Colloids Surf., B. 2018;171:668–674. doi: 10.1016/j.colsurfb.2018.08.012. [DOI] [PubMed] [Google Scholar]
Associated Data
This section collects any data citations, data availability statements, or supplementary materials included in this article.


