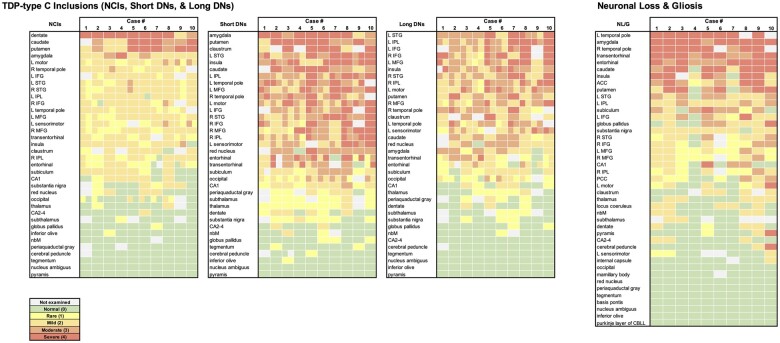
Figure 2.
Heat maps of TDP-type C inclusions (NCIs, short DNs, and long DNs) and neuronal loss and gliosis in 10 cases. Each colour block indicates the severity of the disease burden according to the semiquantitative rating scale; 0 = absent, 1 = rare, 2 = mild, 3 = moderate, and 4 = severe; grey shading indicates that the region was not available for pathological inspection. Heat maps were arranged by the highest to lowest average score across all 10 cases for each inclusion type or NL/G. At the group level, we observed an overall positive correlation (Spearman) across all regions between NL/G and NCIs (r = 0.654, P < 0.0001), short DNs (r = 0.662, P < 0.0001) and long DNs (r = 0.537, P < 0.001).

