

Abstract
Amyotrophic lateral sclerosis is a relatively common and rapidly progressive neurodegenerative disease that, in the majority of cases, is thought to be determined by a complex gene–environment interaction. Exponential growth in the number of performed genome-wide association studies combined with the advent of Mendelian randomization is opening significant new opportunities to identify environmental exposures that increase or decrease the risk of amyotrophic lateral sclerosis. Each of these discoveries has the potential to shape new therapeutic interventions. However, to do so, rigorous methodological standards must be applied in the performance of Mendelian randomization. We have reviewed Mendelian randomization studies performed in amyotrophic lateral sclerosis to date. We identified 20 Mendelian randomization studies, including evaluation of physical exercise, adiposity, cognitive performance, immune function, blood lipids, sleep behaviours, educational attainment, alcohol consumption, smoking and type 2 diabetes mellitus. We have evaluated each study using gold standard methodology supported by the Mendelian randomization literature and the STROBE–Mendelian randomization checklist. Where discrepancies exist between Mendelian randomization studies, we suggest the underlying reasons. A number of studies conclude that there is a causal link between blood lipids and risk of amyotrophic lateral sclerosis; replication across different datasets and even different populations adds confidence. For other putative risk factors, such as smoking and immune function, Mendelian randomization studies have provided cause for doubt. We highlight the use of positive control analyses in choosing exposure single nucleotide polymorphisms (SNPs) to make up the Mendelian randomization instrument, use of SNP clumping to avoid false positive results due to SNPs in linkage and the importance of multiple testing correction. We discuss the implications of survival bias for study of late age of onset diseases such as amyotrophic lateral sclerosis and make recommendations to mitigate this potentially important confounder. For Mendelian randomization to be useful to the amyotrophic lateral sclerosis field, high methodological standards must be applied to ensure reproducibility. Mendelian randomization is already an impactful tool, but poor-quality studies will lead to incorrect interpretations by a field that includes non-statisticians, wasted resources and missed opportunities.
Keywords: Mendelian randomization, amyotrophic lateral sclerosis, epidemiology
Amyotrophic lateral sclerosis is the result of a complex interaction between genes and environment, but environmental risk factors remain poorly understood. Julian et al. review the use of Mendelian randomization to try to identify these factors, summarising key findings and proposing methodological improvements for future studies.
See Farrimond and Talbot (https://doi.org/10.1093/brain/awac063) for a scientific commentary on this article.
Introduction
Amyotrophic lateral sclerosis (ALS) is a rapidly progressive and universally fatal late age of onset neurodegenerative disease. ALS is relatively common with a lifetime risk of ∼1/350.1 ALS is also an archetypal complex disease in which 10% of patients suffer monogenic disease but the majority of disease, known as sporadic, is determined by an interaction of multiple environmental and genetic risk factors.2 Recent years have brought significant progress in delineating the genetic architecture of ALS.3 However, efforts to understand environmental risk factors and the gene–environment interaction in particular, are in their infancy. To date the only established risk factors for the development of ALS are male sex and increasing age.4 Our ability to profile and classify specific combinations of genetic and environmental risk factors will determine the future of personalized medicine interventions for the majority of ALS patients.
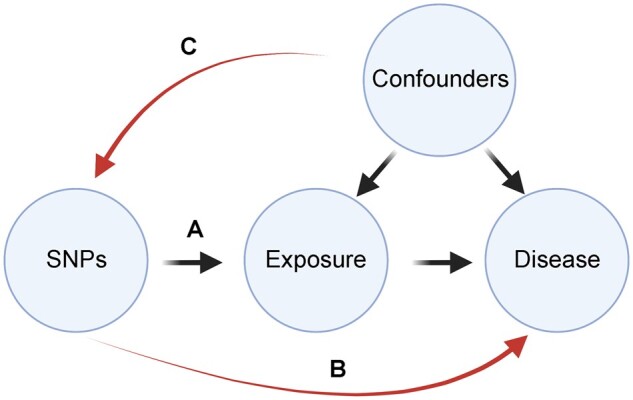
Mendelian randomization (MR) is a method whereby genetic variation within a population serves as a natural experimental instrument to study the effect of environmental modifiers on an outcome such as risk of a specific disease.5,6 At meiosis, alleles are randomly assorted according to Mendel’s second law. Importantly, this process is independent of disease risk and is not vulnerable to ascertainment bias. In MR, this is exploited to determine whether the risk of developing a specific disease is contingent on genetic liability to be exposed to a risk factor of interest. The randomized nature of allele assortment makes this comparison analogous to a randomized controlled trial (Figure 1). It should be noted that the outcome does not have to be a disease state; for example, positioning a disease as an exposure and measurable clinical variables as outcomes has been used effectively for biomarker discovery.7
Figure 1.

MR is analogous to a randomized control trial. Individuals with and without genetic liability to exposure to a risk factor (A) are compared against each other with respect to disease outcome (B). Causation is implied when there is a linear relationship between the effect of a SNP on an exposure and the effect of that SNP on an outcome (C), provided that the assumptions detailed in Fig. 2 are not violated.
MR has opened a gateway for analysis of causal relationships in ALS because it avoids many of the challenges that have plagued observational research in this field, in particular ascertainment bias and problems with small sample sizes. Sample size is not a problem because the exposure is typically measured in an independent cohort to the outcome (ALS), providing the cohorts have comparable genetic structure (usually population-matched). As a result, there is no requirement to obtain two separate data-points (exposure and outcome) in every patient, which is often a critical bottleneck for observational studies. The use of two independent sample sets is known as two-sample MR.
The most common means of performing MR is to use summary statistics from genome-wide association studies (GWAS). These have become exponentially more accessible for multiple and diverse traits with the advent of large biobanks which incorporate publicly available data, such as UK Biobank, FINNGEN and BioBank Japan. Single nucleotide polymorphisms (SNPs) associated with a proposed risk factor are identified in an exposure GWAS. These SNPs are used as instruments for measuring genetic liability to the exposure of interest. Instrumental SNPs are then measured in a separate outcome GWAS to determine the relationship between the exposure and disease risk. A causal relationship is inferred if there is a linear relationship between the exposure, as measured by the instrument, and the risk of the disease outcome (Fig. 1).
A valid MR analysis rests upon three key assumptions (Fig. 2). First, the instrumental SNPs must be robustly associated with the exposure. Second, the SNPs must be associated with the disease risk outcome only through the exposure of interest, rather than affecting the outcome via multiple pathways or exposures (known as horizontal pleiotropy). Third, the SNPs must not be associated with confounders. The strength of association between instrumental SNPs and the exposure (first assumption) is usually quantified as an F-statistic, which is a measure of bias, i.e. the difference between the SNP-derived estimate of the exposure and the actual exposure value. An F-statistic > 10 corresponds to a SNP-derived estimate for which the bias is <10% of the intragroup variability in the measured exposure.8 Evidence of violation of the assumptions related to alternative SNP associations (second and third assumptions) is gained through examination of heterogeneity between SNPs, in which the effect on the exposure is not proportional to the effect on the outcome; this forms the basis of a number of sensitivity measures including the MR-PRESSO and Cochran’s Q test.9 An informative paper from Burgess et al. summarises gold-standard methodology to test these assumptions.10
Figure 2.
Conditions for a valid genetic instrument in MR. In a valid MR analysis, SNPs must be significantly related to the exposure of interest (A). However, the SNPs must not be significantly associated with the disease/outcome in question other than through the exposure of interest (B). Finally, SNPs should not be associated with potential confounders which are associated with both the exposure and the disease (C).
In this review we have identified 20 MR studies relating to ALS. As such studies become common practice, it becomes necessary for methodological standards to be identified and upheld by the field to facilitate interpretation of results. Currently there is significant variability in methodology utilized by authors, which has led to certain conflicting results. The STROBE-MR checklist has been developed with a view to improving the quality of reporting of MR studies,11 but at present is not widely used. In this review, we aim to provide interpretation of findings to allow readers to evaluate past and future MR studies of ALS.
Included studies
This review was prospectively registered to PROSPERO. The registration number for this review is CRD42020221080. A systematic search was performed on 17.11.2020. The search was performed using the PubMed, Scopus and Web of Science electronic databases. For the search, two medical subject heading terms were used. Term A was ‘motor neuron disease’ OR ‘motor neurone disease’ OR ‘MND’ OR ‘ALS’ OR ‘amyotrophic lateral sclerosis’. Term B was ‘Mendelian randomisation’ OR ‘Mendelian randomization’. The search terms applied to the title, abstract and keyword fields. No further filters were applied in our search. In order to capture further studies excluded from the aforementioned electronic databases, we searched the references of included studies for further relevant articles and remained vigilant to publications beyond our search date. Articles eligible to be included in this review were required to meet the following criteria: (i) MR study design; and (ii) use of outcome SNP data associated with ALS. Articles were excluded for the following reasons: non-original articles, non-human studies, duplicate studies, study protocols, letters, conference proceedings. Rayyan software was utilized to assist with the inclusion/exclusion process.12
Our literature search identified a total of 287 studies. During abstract screening, articles were excluded for the following reasons: non-ALS study population (n = 158); non-original study, letter or conference proceeding (n = 40); does not detail causal inferences using MR (n = 17); duplicated study (n = 51). Twenty-one studies were therefore reviewed as full-text articles. During full-paper screening, articles were excluded for the following reasons: non-original study (n = 1); does not detail causal inferences using MR (n = 3); non-ALS study population (n = 1). Four further studies meeting the inclusion criteria were identified after the initial search was conducted. Twenty studies were therefore included in our final review. Headline results and a methodology checklist are provided for every exposure measured across all of 20 studies in Supplementary Table 1.
The discussion in our manuscript is centred on areas of consensus and controversy between MR studies focused on risk of ALS. Our aim is to explain disagreements in terms of the underlying methodology and draw attention to recurring issues. Moreover, we aim to draw out biological insights that have been gained from using MR to study ALS. Our approach and findings are summarized in Fig. 3.
Figure 3.

Summary of MR studies of ALS including measured exposures. Important aspects of methodology which have led to consensus or controversy are highlighted. T2DM = type 2 diabetes mellitus.
What do we know? Findings with some consensus
In some instances there is agreement where multiple MR studies have reached the same conclusions regarding an association between ALS risk and a specific environmental exposure. Perhaps the strongest consensus exists regarding a positive relationship between blood lipid levels [low-density lipoprotein (LDL) cholesterol and total cholesterol] and ALS risk. In this section we also consider related traits linked to blood lipids, such as type 2 diabetes, adiposity, physical exercise and smoking, so that we can discuss evidence for a link between ALS and the ‘metabolic syndrome’.13 The ‘metabolic syndrome’ is defined as interconnected physiological, biochemical, clinical and metabolic factors that directly increase the risk of cardiovascular disease, type 2 diabetes and all-cause mortality. There is a long literature linking metabolic syndrome to neurodegenerative disease, particularly Alzheimer’s disease.14 ALS has been linked to both hyperlipidaemia and insulin resistance.15 However, ALS has also been linked to physical exercise,16 which is thought to be protective against metabolic syndrome.13 Epidemiological studies of physical exercise in ALS have largely relied on questionnaire-based quantification of exercise where selection and recall bias have led to inconclusive results. MR is ideally placed to address these limitations.
Blood lipids
Bandres-Ciga et al. performed an unbiased MR screen of environmental modifiers of ALS risk using 345 published and 290 unpublished GWAS.17 Only three exposures were causally linked to ALS risk: LDL cholesterol level [inverse-variance weighted (IVW) odds ratio (OR) 1.12, 95% CI = 1.03–1.20, P = 0.003]; coronary heart disease (IVW OR 1.06, 95% CI = 1.0–1.13, P = 0.02); and self-reported high cholesterol (IVW OR 2.39, 95% CI = 1.48–3.84, P = 0.0003). The authors then used multivariable MR analysis to show that the associations with coronary heart disease and self-reported high cholesterol are underpinned by SNPs linked to LDL cholesterol. Multivariable MR is a means of conditioning between alternative exposures in an MR study to determine which exposure is more closely linked to the disease outcome. Where two or more exposures are correlated this can be a powerful technique to elucidate underlying biological mechanisms.
MR analyses typically report the P-value from the IVW measure as the headline result because this has the most statistical power.18 The IVW is effectively a weighted mean estimate derived from the total set of instrumental SNPs. However, like any mean value, the IVW is vulnerable to outliers, and it is also disproportionately dependent on the assumption that each of the SNPs offers an independent estimate (see discussion of clumping below). Consequently, it is good practice to supplement the IVW estimate for a particular association, with several robust measures which are relatively underpowered but are less vulnerable to outliers. Robust measures include MR robust adjusted profile score,19 weighted median,20 weighted mode21 and the MR-Egger.22 Furthermore, a leave-one-out analysis can be applied to ensure that no single SNP is disproportionately responsible for the headline result. In the study of Bandres-Ciga et al., the results remained significant with deployment of robust measures and were not altered by removing individual SNPs (leave-one-out analysis). The weakness of this study is that there is no correction applied for the multiple testing problem posed by the large unbiased screen that has been employed.
The role of LDL cholesterol and total cholesterol were also assessed by Chen et al.,23 who combined SNPs associated with either exposure to generate a single measure of genetic liability to cholesterol. Of note, this study used different exposure and outcome GWAS to Bandres-Ciga et al. Chen and colleagues discovered a statistically significant relationship between increasing levels of LDL cholesterol/total cholesterol and ALS (IVW OR = 1.2, P ≤ 0.001). Notably no robust measures were reported. Zeng and Zhou performed a comprehensive MR study evaluating the roles of high-density lipoprotein (HDL) cholesterol, triglycerides, LDL cholesterol and total cholesterol in ALS.24 The major strength of this study is that the results were validated in both European and East Asian populations. In the European population, when the authors applied a stringent Bonferroni correction for multiple testing, only LDL cholesterol was causally linked to ALS risk (IVW OR = 1.14, 95% CI = 1.05–1.24, P = 1.38 × 10⁻³). LDL cholesterol was also significantly related to ALS risk in the East Asian population (IVW OR = 1.06, 95% CI = 1.00–1.12, P = 0.04), including in robust measures: MR Egger (P = 2.41 × 10⁻⁴) and weighted median (P = 6.29 × 10⁻⁴). Neither triglycerides or HDL cholesterol showed a significant relationship with ALS. Finally, van Rheenen et al.,25 using a new larger GWAS (29 612 ALS patients and 122 656 controls), concluded that total cholesterol was positively associated with ALS risk (IVW P = 0.02), including significance in several robust measures, namely the weighted mode, weighted median and MR Egger. However, only the weighted median remained positive following a stringent Bonferroni multiple testing correction. The authors considered years of schooling a potential confounder and controlled for it using multivariable MR, but the result remained significant. In this study LDL cholesterol was also significantly related to ALS risk (IVW P = 0.03), but this result did not remain significant in robust measures. Again, no causal relationship was demonstrated for triglycerides and HDL cholesterol.
Overall, there is compelling MR evidence for a relationship between both increased LDL cholesterol and total cholesterol and genetic liability to ALS; but not for triglycerides or HDL cholesterol. We can make this conclusion despite lack of significance in some robust measures because by definition robust measures are relatively unpowered and should be interpreted with caution. The convergence between different studies, correction for potential confounders (such as years of education) and outlier SNPs, and significance in a proportion of the robust measures, is good evidence for a causal relationship. Exploration of the link between lipid metabolism and ALS is a promising area for future research and potentially represents a factor amenable to therapeutic intervention.
Type 2 diabetes mellitus
Observational studies have suggested a protective effect of type 2 diabetes mellitus on ALS risk.26 Zeng et al. investigated this relationship using MR in both European and East Asian populations27 and concluded that type 2 diabetes mellitus was protective against ALS in Europeans (IVW OR = 0.93, 95% CI = 0.88–0.99, P = 0.02). However, none of the robust measures showed significance. Moreover, the authors used MR-PRESSO to test for SNP heterogeneity and identified a single outlier SNP; exclusion of this SNP produced a non-significant relationship in all measures including the IVW (P = 0.06). Finally, the leave-one-out analysis demonstrated that removal of several individual SNPs invalidated the result. Overall, we conclude that there is no evidence from MR to support type 2 diabetes mellitus as protective against ALS.
Adiposity
Body mass index (BMI) and adiposity have long been proposed to modify ALS risk. It has been observed that ALS patients typically present with normal-low BMI premorbidly and a raised BMI has been suggested to be protective.28 The direction of causation is a key question. For example, ALS is associated with hypermetabolic phenotype,29 which could reduce BMI as a by-product of the disease process. MR is well placed to address this question because of the ability to differentiate upstream assignment at conception from downstream consequences of disease.
Zhang et al. used several measures of adiposity in their MR study30 including body fat percentage, childhood BMI, BMI, birth weight and waist–hip ratio. Therefore, the authors applied a Bonferroni multiple testing correction. There was evidence that genetically predicted increase in body fat percentage is associated with a reduced risk of ALS (IVW OR = 0.67, 95% CI = 0.54–0.83, P = 3.25 × 10⁻⁴). Importantly, a leave-one-out analysis indicated that the relationship between body fat percentage and ALS was driven by two SNPs in particular, which suggests that the IVW estimate may have been biased by SNP outliers. BMI, waist–hip ratio and birthweight were not significantly linked to ALS. Higher childhood BMI was significantly linked to ALS in both the IVW (P = 0.03) and MR-Egger (P = 0.04) estimates, but did not pass the multiple testing correction.
In a different study, Zeng et al. also explored the relationship between ALS and BMI. Using a number of robust MR measures they concluded that increasing BMI is not significantly protective for ALS in cohorts from Europe (IVW P = 0.28) or East Asia (IVW P = 0.65). Similarly, van Rheenen et al. did not identify a significant relationship between ALS and BMI25; and in a letter to the editor, Aziz did not find a significant relationship between body fat percentage and ALS risk, although these findings cannot be appraised extensively due to limited description of employed methodology.31
At this point we draw attention to another important methodological consideration in MR analysis known as ‘clumping’. Common SNPs, such as those employed in GWAS studies and used to create MR instruments, are not independent, but are co-inherited in a process known as linkage disequilibrium (LD). The coinheritance of any two SNPs in a population can be measured and used to estimate the probability that the presence of both SNPs in an individual genome represents one or multiple inheritance events. The process of clumping refers to the grouping of significantly correlated SNPs into one independent signal to reduce the risk of measuring the same signal multiple times. Although there is no mandated method of clumping in MR, it is worth noting that relative to other studies in the ALS literature, Zhang et al. implement a relatively liberal clumping procedure (R2 < 0.05), which allows for inclusion of SNPs in higher LD with each other compared to other studies and therefore a higher probability of type 1 error (Supplementary Table 1). On this basis, and for the other reasons outlined above, we believe that the positive relationship between body fat percentage and ALS identified by Zhang et al. should be interpreted with caution. In our own study, we concluded that there is no significant relationship between body fat percentage and ALS risk.32 We utilized a more stringent clumping criterion (R2 < 0.001) than Zhang et al. to remove SNPs in significant LD.
Overall, MR studies do not consistently support a causal role for adiposity in ALS, which may suggest that there is a confounder unaccounted for in the observational literature.
Physical exercise
The role of physical exercise as a risk factor for ALS has historically been controversial.16 With a view to resolving this conflict, we performed a MR study under the hypothesis that intense and frequent exercise increases the risk of ALS.32 To test this hypothesis, an instrument capturing frequent participation in strenuous sport and other exercise (SSOE,33 defined as spending two or more days per week performing SSOE for a duration of 15–30 min or greater) was used as the exposure variable. Of note, the control group in the SSOE GWAS was individuals who reported no time spent performing SSOE in the past 4 weeks.
An important choice in the design of an MR study is the P-value threshold (for the association between genetic variation and the exposure of interest) used to identify instrumental SNPs used to measure the exposure. A stringent P-value can lead to too few SNPs and an underpowered test. A liberal P-value increases the risk of including invalid SNPs that violate the assumptions underpinning MR. To avoid these pitfalls, we used a positive control (body fat percentage) to show that a conservative measure of SSOE consisting of only genome-wide significant (P < 5 × 10⁻⁸) SNPs is underpowered to detect a causal effect, but a more liberal threshold (P < 5 × 10⁻⁶) performs as expected (SSOE is shown to reduce body fat percentage). A liberal threshold was then used to select instrumental SNPs to show that genetic liability to participation in SSOE is associated with increased risk of ALS (IVW P = 0.01). This result was consistent in multiple robust measures including MR robust adjusted profile score, weighted median and weighted mode.
Our findings have been contested in an analysis by Zhang et al., who utilized a conservative (P < 5 × 10⁻⁸) P-value threshold for selection of instrumental SNPs to measure SSOE and a different ALS GWAS.34 In this study, Zhang et al. found no significant relationship between SSOE and ALS (IVW P = 0.49). As described above, our positive control analysis of the SSOE exposure suggests that this instrument is underpowered.
A further study evaluated the effect of ‘days per week moderate activity’ and ‘days per week vigorous activity’.25 Despite use of both a liberal (P < 5 × 10⁻⁵) and a conservative (P < 5 × 10⁻⁸) P-value threshold to select instrumental SNPs, neither measure was significantly linked to ALS risk (IVW P = 0.89 and 0.19, respectively). However, neither of these exposures included a consideration of time spent exercising, unlike the SSOE measure. Moreover, it is interesting that SSOE has been shown to be negatively associated with workplace activity, unlike other UK Biobank measures such as ‘moderate to vigorous physical activity’ and ‘vigorous physical activity’.33 This is an important distinction, given that occupational and leisure time activities are dissimilar in their respiratory and neuromuscular requirements.32 Zhang et al. showed that neither vigorous physical activity or moderate to vigorous physical activity are significantly linked to ALS risk (IVW P = 0.17 and 0.19, respectively). Leisure-time activity more often includes the kind of dynamic and anaerobic activity,35 which selectively recruits motor neurons supplying type IIb fast twitch muscle fibres; the same motor neurons which degenerate early in the pathogenesis of ALS.36
Our study32 is in agreement with Zhang et al. that overall physical activity (i.e. not quantified as being strenuous or frequent) alone is not a risk factor for ALS. Specifically, Zhang et al. showed a non-significant relationship between overall activity and ALS (IVW P = 0.45), and we discovered that average accelerations were not associated with ALS risk in either liberal or conservative analysis (IVW P = 0.31 and 0.37, respectively). Similarly, both studies agree that sedentary behaviour is not protective for ALS (IVW P = 0.29–0.81).
Overall, the MR evidence is clear that sedentary behaviour is not protective for ALS and that lower intensity or infrequent exercise does not increase risk. There is conflict between studies with respect to the role of activity which is both strenuous and frequent activity in development of ALS. A key point from this discussion is the importance of the precise measure used to quantify the exposure of interest. Subtly different measures, such as workplace versus leisure-time physical activity, can be associated with non-overlapping or even anticorrelated instrumental SNPs.33 Each measure must be evaluated to determine relative advantages and disadvantages; for example, average accelerations measured by accelerometer is likely to be the most objective, but there is no way of knowing if subjects performed their usual behaviour during the short testing period. We would recommend the use of a positive control to optimize the choice of instrumental SNPs as a means of increasing confidence in both negative and positive results.10
Smoking
Cigarette smoking is among few risk factors confidently depicted as a causative factor in the development of ALS.37 Despite this assertion, studies continue to produce contradictory findings and it has been suggested by some investigators that the relationship is a result of confounding factors such as military service, education, exercise participation and socioeconomic status.38 Moreover, because smoking is known to have a large effect on life expectancy, there is the potential for a spurious protective effect because smokers may be significantly less likely to reach the age at which disease manifests.39 This effect, known as survival bias, is a potential problem for performing MR in any disease population with late age of onset, such as ALS. Various corrections have been proposed for this issue,40 but all risk a loss of power. An obvious solution is to measure the disease outcome in a birth cohort where survival cannot have impacted selection. The use of unaffected family members of deceased patients has also been proposed as a method for reducing survival bias in sample recruitment.41
Using MR, Zhan and Fang presented weak evidence that ‘ever smokers’ have a higher risk of genetic liability to ALS than non-smokers (IVW OR = 1.25; 95% CI = 1.01–1.55; P = 0.04).42 The relationship between smoking and ALS did not persist in robust measures. Similarly, Opie-Martin et al. concluded that ‘ever smoker’ was weakly associated with ALS (IVW OR = 1.10, 95% CI = 1.00–1.23, P-value = 0.05), but this result was also non-significant in all robust analyses.43 Van Rheenen et al. tested for an effect of both ‘age of smoking initiation’ and ‘cigarettes per day’, but concluded that neither were significantly linked to ALS using a conservative or liberal P-value threshold to choose instrumental SNPs (IVW P-value = 0.78 and 0.33, respectively).25 Overall, the current MR literature does not support a causal role for smoking in the development of ALS.
Although there is consensus that LDL cholesterol and total cholesterol are positively linked to risk of ALS, there is more controversy or even negative findings for the related traits of type 2 diabetes, adiposity, physical exercise and smoking. The evidence does not support a simple correlation between ALS and a metabolic syndrome; for example, strenuous and frequent physical exercise should reduce risk of the metabolic syndrome but appears to increase risk of ALS. It seems likely that multiple pathogenic pathways exist leading to neurotoxicity and perhaps different pathways are relevant for different subgroups of patients.44 Currently it is not clear whether patients vulnerable to high cholesterol are the same patients who are vulnerable to strenuous physical exercise; it could be that these groups are distinct, perhaps determined by genetic background. Lifestyle recommendations to reduce ALS risk may need to be individually tailored, rather than uniform.
What don’t we know? Negative studies and lack of power
A number of reported MR studies did not identify a relationship between an exposure of interest and ALS risk and set this forth as evidence regarding the underlying biology. The problem with this assertion is that it is difficult to distinguish between lack of power and a true negative result. This is another example where a positive control can be helpful; for example, genetic instruments for smoking earn confidence because they have been used to show a significant effect on other diseases such as coronary artery disease.45 The power problem is illustrated by discussion of a series of MR studies considering a link between various immune exposures and ALS including blood leucocyte count and blood levels of soluble receptors for various interleukins: IL-1, IL-2 and IL-6. For total leucocyte count a smaller study reports a positive association and a larger study reports a negative finding; we consider whether the larger study should always take precedence because of theoretical superior power.
Leucocyte count
Dysregulated immunity is considered to be a common feature of neurodegenerative diseases.46 Li et al. explored the relationship between peripheral leucocytes and ALS using MR.47 Exposures tested were monocyte count, neutrophil count, eosinophil count, basophil count, lymphocyte count and total leucocyte count. The authors used a conservative P-value threshold to choose instrumental SNPs (P < 5 × 10⁻⁸), removed potentially pleiotropic SNPs which were associated with BMI or smoking, and used stringent clumping criteria (R2 < 0.001). It should be noted that no information is provided regarding the use of proxy SNPs, and this is a potential weakness in the methodology of this study. Proxy SNPs are utilized when matching between exposure and disease outcome GWAS experiments leads to loss of SNPs, simply because of differences in the experimental design, i.e. different GWAS experiments often measure slightly different sets of SNPs. This can lead to loss of important information, but can be partially overcome by use of a ‘proxy’, defined as a SNP present in bothdata sets that is in LD with the SNP which cannot be matched.
Li et al. suggested that there is a causal relationship between genetic liability to increased total leucocyte count and reduced risk of ALS (IVW OR: 0.9, 95% CI: 0.84–0.97, P = 0.007). Of note, this result would remain significant after a Bonferroni multiple testing correction and was supported by the MR-Egger analysis, whereas the weighted median showed the same direction of effect with a borderline non-significant P-value (P = 0.06). Increasing neutrophil count was also shown to decrease ALS risk using the IVW (OR: 0.93, 95% CI: 0.86–1.00, P = 0.049) but not with any robust measures.
These findings were not replicated by van Rheenen et al., who used a new and larger GWAS for both ALS and blood cell traits.25,48 In this analysis, no significant relationship was identified between ALS and eosinophil, lymphocyte, monocyte, neutrophil or total leucocyte counts. Although total leucocyte count was near-significant in IVW analysis (P = 0.06), this did not persist in robust measures (weighted mode P = 0.76, weighted median P = 0.23 and simple mode P = 0.76), with the exception of the MR-Egger (P = 0.04), and the relationship remained non-significant when using a more liberal P-value threshold to choose instrumental SNPs (P < 1 × 10⁻⁵).
It is tempting to suppose that the negative result reported by van Rheenen et al. represents the true underlying biology because of the larger sample size in both exposure and outcome GWAS. A larger exposure GWAS should deliver more powerful instrumental SNPs that can account for a greater proportion of variability in the exposure of interest. Underpowered instruments have led to false positive conclusions in the past. For example, small-scale MR studies using limited instrumental SNPs confined to a single locus suggested that plasma urate was protective against Parkinson’s disease, but this was not reproducible. A larger MR study, using instrumental SNPs across multiple loci with more collective power to measure variability in urate, did not show a protective effect and moreover, a clinical trial of intervention to elevate urate in Parkinson’s disease patients was terminated due to lack of efficacy.49 Similarly, a larger outcome GWAS should provide a more precise estimate of SNP-effect size on disease risk. However, we argue that the result reported by Li et al. meets gold-standard methodological criteria including robust tests and sensitivity analyses and should not be dismissed entirely, particularly when the total leucocyte measure was actually close to significance in both studies. Complexity can result when a larger GWAS is derived from a more heterogeneous population structure. Measurement of genetic liability rests upon portability of genetic instruments between exposure and outcome GWAS. Instrumental SNPs and even LD structure vary significantly across population groups.50
Interleukins
Inflammatory responses mediated by interleukin-1 and interleukin-2 (IL-1 and IL-2) have been suggested to have a role in the development of ALS.51 Consequently, Yuan et al. used MR to test for a causal relationship between circulating levels of IL-1 receptor antagonist (IL1-Ra) and IL-2 receptor antagonist (IL-2Ra) and ALS risk.52 The authors chose to use a conservative P-value threshold (P < 5 × 10⁻⁸), which resulted in a very small number of instrumental SNPs: two SNPs for IL-1Ra and one SNP for IL-2Ra. In this study, it was shown that for a 1‐SD increase in circulating IL‐1Ra levels, the OR of ALS was 0.64 (95% CI, 0.46–0.88; IVW P= 0.005). A borderline significant effect was found for an inverse relationship between circulating IL-2Ra levels and ALS (Wald ratio, OR, 0.91; 95% CI 0.83–1.00; P = 0.06). As so few genome-wide significant SNPs are available in this analysis, robust measures do not serve a role and therefore only the IVW and Wald ratio are presented. Further, the two genome-wide significant SNPs for IL-1Ra were in LD (R2 = 0.11), and had only the most significant of these two SNPs been analysed then no significant relationship would have been identified (Wald ratio, P = 0.08).
Similarly, Zhang et al. investigated the relationship between soluble IL-6 receptor (s-IL-6R) level and ALS using a single genome-wide significant SNP derived from a small GWAS of 1650 individuals.53 This study found that there was no significant relationship between s-IL-6R levels and ALS (IVW OR = 1.00; 95% CI 0.92–1.10; P = 0.94). However, the small number of SNPs suggests that this study, like that of Yuan et al., may be underpowered.
In conclusion, there is not currently any MR evidence to support an association between inflammatory exposures, particularly interleukins, and ALS. Reported positive findings rest upon underpowered instruments and have not been validated in larger, better-powered studies. However, we have some concern over population matching in the largest study of total leucocyte count, which would benefit from future study. We note that a recent genome-wide study of DNA methylation in ALS discovered a significant association between ALS and white blood cell proportions.54 Underpowered instruments mean that even negative findings should be interpreted cautiously. A larger concern is that the immune response is a complex derivative of interaction between multiple cells and cytokines; the suggestion is that the simple measures used in the studies described here are not an accurate measure of immune function.
Controversies: where Mendelian randomization studies disagree
We have discussed several MR studies where the headline results disagree and have outlined possible reasons based on the methodology. Alcohol intake and cognitive performance represent two important and modifiable environmental risk factors that have been consistently linked to ALS. For both exposures there is disagreement in the MR literature, which remains unresolved and highlights a need for more work.
Alcohol consumption
Studies in the observational literature detailing the relationship between alcohol consumption and ALS risk have produced directly contradictory findings.55 Yu et al. explored the relationship between gram per day intake of alcohol and risk of ALS in an MR study.56 The authors carefully controlled for a potential confounding effect of smoking using MVMR57 and discovered a significant relationship between alcohol consumption and ALS risk (IVW OR = 2.48 for each ∼10 g/day increase in alcohol consumption, 95% CI 1.38–4.44, P = 0.002). Robust measures were performed but were not significant. In contrast van Rheenen et al. did not discover a relationship between ‘alcoholic drinks per week’ and ALS in their study,25 in which neither the IVW (P = 1.00) nor robust measures are significant. Although this finding contradicts the conclusions of Yu et al., it is important to recognize that van Rheenen tested ‘alcoholic drinks per week’ without quantification of units/grams of ethanol, which is a less-precise measure of actual ethanol consumption.
Cognitive performance
Zhang et al. explored the relationship between ALS and genetic liability to a range of academic and cognitive performance measures including educational attainment (educational attainment), highest mathematics class, self-reported mathematics ability, intelligence and cognitive performance.58 SNPs were selected from large GWAS at a conservative P-value threshold of P < 5 × 10⁻⁸, but clumped using a relatively liberal threshold of R2 < 0.1. Following a Bonferroni correction for multiple testing, this study concluded that there was a significant protective effect on ALS risk of higher educational attainment (IVW OR = 0.79 per year of education completed, 95% CI 0.73–0.86; P = 8.46 × 10⁻⁸) and higher mathematics class (IVW OR = 0.81, 95% CI 0.72–0.91; P = 3.76 × 10⁻⁴). Both results were supported by robust tests in the form of MR-Egger, weighted median and simple median for educational attainment and weighted median and simple median for highest mathematics class. Mode-based estimation was not performed in this analysis, although this is generally considered a core measure.10
The potential weakness of the above analysis is highlighted by our own study,32 which did not show a significant relationship between educational attainment and ALS (P = 0.68). In this study, the same educational attainment GWAS59 was used, but a more stringent clumping criterion of R2 < 0.001 was employed to ensure independence between instrumental SNPs. Stringent clumping dramatically reduced the number of SNPs included in the exposure instrument (298 versus 1271 SNPs), suggesting that the instrument employed by Zhang et al. may have contained non-independent signals.
Finally, van Rheenen et al. explored the relationship between ‘years of schooling’ and ALS risk.25 They identified a significant protective relationship by the IVW method (P = 0.01), but this was not supported by any robust measures. Further, the instrumental SNPs were significantly heterogeneous (Cochran’s QP = 3.90 × 10⁻⁹), suggesting that the underlying assumptions of MR may have been violated. As discussed above, the IVW measure is particularly vulnerable to instrument heterogeneity and outlier SNPs.20
In summary, while there is evidence to support a protective role for educational factors in ALS, there are weaknesses and conflicts in the available evidence that urge caution in interpretation.
Larger Mendelian randomization studies lead to more multiple testing problems
The advent of large biobanks releasing huge numbers of GWAS studies relating to diverse phenotypes has brought the opportunity for ever larger MR studies addressing multiple phenotypes simultaneously. This opportunity for unbiased, data-driven work is likely to lead to significant advances, but requires proper multiple testing correction. It has been argued that less-stringent requirements for multiple testing should be applied in MR due to the relative lack of power of the tests used.10 However, we point to the early days of genetic association testing where similar arguments led to irreproducible results and a significant waste of resources.60 We have already discussed several studies where this has been an issue, notably the work of Bandres-Ciga et al. Nonetheless, findings with respect to blood lipids have been validated in independent datasets. For other exposures a lack of proper multiple testing correction means that no firm conclusions can currently be drawn. In relation to this we discuss serum metabolites and sleep behaviours.
Metabolites that make up the metabolome are the intermediates and end products of cellular regulatory processes. Changes in the levels of metabolites are influenced by both genetic background and environmental stimuli and therefore an MR study of the metabolome is an effective integrator of multiple exposures. For example, the serum concentration of a given metabolite may be lower because of genetic mutations within enzymes responsible for key steps in metabolite synthesis, or because of a limited supply of substrates from the diet. ALS has been associated with a number of metabolic defects including deficits in production of nicotinamide61 and inosine.62 Indeed, metabolites such as branched chain amino acids63,64 and vitamin B1265 have been administered to ALS patients as part of experimental medicine trials.
ALS has a strong association with sleep disorders, primarily as a result of muscle weakness leading to hypoventilation or other dysfunction which can disturb sleep. However, there is also evidence that ALS is associated with non-motor sleep disorders including insomnia and REM parasomnia.66 There is some suggestion that such disturbances may be causal; for example, sleep–wake disturbances are more common in patients with a known genetic cause of ALS.67 MR is an ideal tool to disentangle this question and reveal whether or not sleep disturbance contributes to the risk of ALS.
Serum metabolites
Yang et al. performed an unbiased screen of the human metabolome using a GWAS of high-throughput metabolic profiling performed by Shin et al.68,69 The authors use a liberal P-value threshold for choosing instrumental SNPs (P < 1E–05) and relatively loose clumping criteria (R2 < 0.1). A total of 18 metabolites were significantly linked to ALS in the IVW analysis including 6 lipids, 4 amino acids, 3 peptides, 2 xenobiotics, an energy metabolite and 2 unknown metabolites. However, just one metabolite remained significant in robust tests: gamma-glutamylphenylalanine (IVW OR 1.94, 95% CI OR 1.03–3.74, P = 0.048, MR Egger P = 0.04; weighted-median P = 0.01, and MR-PRESSO P = 0.04). Other metabolites that did not withstand all robust tests but did show promising results were gamma-glutamylleucine (IVW OR 1.98, 95% CI 1.04–3.75, P = 0.04), gamma-glutamylthreonine (IVW OR 0.50, 95% CI 0.26–0.99, P = 0.05), lathosterol (IVW OR = 1.43, 95% CI = 1.05–1.93, P = 0.02) 1-stearoylglycerophosphoethanolamine (IVW OR= 0.54, 95% CI = 0.35–0.83, P = 0.005), 2-methylbutyroylcarnitine (IVW OR = 1.96, 95% CI = 1.06–3.64, P = 0.03), 4-acetamidobutanoate (IVW OR = 0.48, 95% CI = 0.24–0.94, P = 0.03) and 2-methoxyacetaminophen sulphate (IVW OR = 0.98, 95% CI = 0.96–0.99, P = 0.0009). The authors comment that their results may indicate that dysfunction of glutathione metabolism plays a role in the development of ALS. Although the results of this paper are interesting, none of the results would have passed a Bonferroni multiple testing correction. In total, 486 metabolites were tested, which would require a corrected P-value threshold of 0.0001; the smallest P-value reported in the study was 0.0009. Moreover, closely linked metabolites, such as those within the same metabolic pathway, may be tightly correlated, in which case it can be difficult to determine the biological basis of an observed causal inference. In such cases further experimental validation may be necessary, but we note the utility of multivariable MR for determining dependence between traits and estimating the direct causal effect of each exposure on the outcome of interest.57 We conclude that further validation is required to interpret the metabolic date reported to date.
Sleep behaviours
Cullell et al. performed an MR study investigating the hypothesis that sleep/wake cycles are implicated in neurodegenerative disease.70 As such, the authors identified instrumental variables for a large number of traits including insomnia, daytime sleepiness, subjective and objective (using accelerometer device measures) chronotype, sleep duration and obstructive sleep apnoea. It should be noted that the obstructive sleep apnoea measure is derived from individuals of diverse ancestries, which may invalidate the measurement of ALS risk with this instrument. Only daytime sleepiness was significantly linked to risk of ALS (IVW beta = 1.17, P = 0.02). The study demonstrated that there was not significant heterogeneity between SNPs in the instrument, and the relationship remained significant in the weighted median (P = 0.04) and a leave-one-out analysis. The result was not significant in MR-Egger or mode-based estimate. Importantly, the relationship would not have remained significant if any kind of multiple testing correction had been applied (Bonferroni corrected P-value threshold would be 0.008) and should be interpreted with caution.
Conclusion
MR is a powerful method capable of addressing many of the confounding factors that have previously limited study of environmental risk factors for ALS including ascertainment bias and small sample sizes. Our review of the present literature illustrates several examples where MR has delivered clarity including a causal links between blood lipids and ALS. Replication across multiple studies using different instrumental SNPs and/or different outcome ALS GWAS adds confidence. Further, despite some difficulty in interpreting negative studies, MR studies have provided cause for doubt concerning some putative risk factors including smoking. The potential is that MR studies, combined with genetic segregation of ALS patients, could lead to individualized predictions and personalized medicine for the majority of ALS patients.
Where MR studies disagree, we have identified key methodological discrepancies, most often involving the choice of instrumental SNPs with which to measure an exposure. Inadequate clumping of SNPs in particular appears to have led to what we conclude are unreliable results. In future we would recommend that a stringent threshold of R2 < 0.001 is maintained to ensure that truly independent signals are measured. We have observed that relaxing this threshold is a key determinant of discrepancy between studies. An alternative is to incorporate a population-specific LD matrix to correct for correlated SNPs but, while such methods have been proposed,71 they are not widely used currently. To overcome the arbitrary nature of choosing SNPs for an instrument, we advocate for the use of a positive control where one is available, in order to measure instrument power and performance. We32 and others72 have successfully used this method to achieve an adequately powered measure of genetic liability.
In addition to these specific concerns, there are certain general problems that apply to MR results in general. We have already referred to the possibility that MR measurements may be invalidated by mismatch between exposure and outcome GWAS populations; this will be even more of a concern as future GWAS study cohorts become larger and more heterogeneous. This issue also illustrates a general principle, because MR relies on instrumental SNPs, which are themselves a function of population-specific LD structure; then instrumental SNPs may not be applicable in multiple populations. It is noteworthy that a focus on Europeans in GWAS studies has limited tools available for causal inference in other population groups and is a potential source of ongoing health inequality. A way to counter this and to simultaneously add confidence to an MR result is to perform a trans-ancestry study whereby the same exposure and outcome are tested in different populations using population-specific GWAS data; examples of this practice are described above.24,27
Another general issue is that of time-varying exposures: MR is usually used to infer the effect of lifetime exposure. However, instrumental SNPs are derived from a GWAS performed at a fixed time point in a specific set of individuals. SNPs correlated with an exposure may be different for individuals of different ages.73 The implication is that instrumental SNPs used to measure a time-varying exposure may not be relevant over the entire lifetime of an individual. Instead, the MR measurement will be biased by the age distribution of the cohort used to construct the exposure GWAS. Moreover, behaviours change over time in response to changes in the environment. For example, SNPs that correlate with smoking behaviour may have changed significantly before and after the introduction of widespread indoor smoking bans. This is particularly true when one considers that there is evidence that smoking behaviour interacts intimately with personality.74
MR has immense potential for interrogating complex diseases such as ALS. However, for MR to be useful, particularly in a field that includes non-experts in MR, high methodological standards must be applied in peer review to prevent publication of false positive and false negative results. The alternative is irreproducible results, wasted resources and missed opportunities.
Funding
This work was supported by the National Institutes of Health (CEGS 5P50HG00773504, 1P50HL083800, 1R01HL101388, 1R01-HL122939, S10OD025212, P30DK116074, and UM1HG009442 to M.P.S.), the Wellcome Trust (216596/Z/19/Z to J.C.-K.) and NIHR (NF-SI-0617–10077 to P.J.S.). We also acknowledge support from a Kingsland fellowship (T.M.) and the NIHR Sheffield Biomedical Research Centre for Translational Neuroscience (IS-BRC1215-20017).
Competing interests
M.P.S. is a cofounder of Personalis, Qbio, Sensomics, Filtricine, Mirvie and January. He is on the scientific advisory of these companies and Genapsys. No other authors have competing interests.
Supplementary material
Supplementary material is available at Brain online.
Supplementary Material
Abbreviations
- ALS
amyotrophic lateral sclerosis
- BMI
body mass index
- GWAS
genome-wide association studies
- HDL
high-density lipoprotein
- IVR
inverse-variance weighted
- LD
linkage disequilibrium
- LDL
low-density lipoprotein
- MR
Mendelian randomization
- SNP
single nucleotide polymorphism
- SSOE
strenuous sport and other exercise
References
- 1. Kiernan MC, Vucic S, Cheah BC, et al. Amyotrophic lateral sclerosis. Lancet. 2011;377(9769):942–955. [DOI] [PubMed] [Google Scholar]
- 2. Brown RH, Al-Chalabi A. Amyotrophic lateral sclerosis. N Engl J Med. 2017;377(2):162–172. [DOI] [PubMed] [Google Scholar]
- 3. Cooper-Knock J, Harvey C, Zhang S, et al. Advances in the genetic classification of amyotrophic lateral sclerosis. Curr Opin Neurol. Published online August 2, 2021; doi: 10.1097/WCO.0000000000000986 [DOI] [PMC free article] [PubMed] [Google Scholar]
- 4. Ingre C, Roos PM, Piehl F, Kamel F, Fang F. Risk factors for amyotrophic lateral sclerosis. Clin Epidemiol. 2015;7:181–193. [DOI] [PMC free article] [PubMed] [Google Scholar]
- 5. Davies NM, Holmes MV, Davey Smith G. Reading Mendelian randomisation studies: A guide, glossary, and checklist for clinicians. BMJ. 2018;362:k601. [DOI] [PMC free article] [PubMed] [Google Scholar]
- 6. Davey Smith G, Ebrahim S. ‘Mendelian randomization’: Can genetic epidemiology contribute to understanding environmental determinants of disease? Int J Epidemiol. 2003;32(1):1–22. [DOI] [PubMed] [Google Scholar]
- 7. Mohammadi-Shemirani P, Sjaarda J, Gerstein HC, et al. A Mendelian randomization-based approach to identify early and sensitive diagnostic biomarkers of disease. Clin Chem. 2019;65(3):427–436. [DOI] [PubMed] [Google Scholar]
- 8. Burgess S, Thompson SG; CRP CHD Genetics Collaboration. Avoiding bias from weak instruments in Mendelian randomization studies. Int J Epidemiol. 2011;40(3):755–764. [DOI] [PubMed] [Google Scholar]
- 9. Bowden J, Hemani G, Smith GD. Invited commentary: Detecting individual and global horizontal pleiotropy in Mendelian randomization—A job for the humble heterogeneity statistic? Am J Epidemiol. 2018;187:2681–2685. 10.1093/aje/kwy185. [DOI] [PMC free article] [PubMed] [Google Scholar]
- 10. Burgess S, Smith GD, Davies NM, et al. Guidelines for performing Mendelian randomization investigations. Wellcome Open Res. 2019;4:186. [DOI] [PMC free article] [PubMed] [Google Scholar]
- 11. Smith GD, Davies NM, Dimou Net al. STROBE-MR: Guidelines for strengthening the reporting of Mendelian randomization studies. PeerJ Preprints 7:e27857v1. 10.7287/peerj.preprints.27857v1. [DOI] [Google Scholar]
- 12. Ouzzani M, Hammady H, Fedorowicz Z, Elmagarmid A. Rayyan—A web and mobile app for systematic reviews. Syst Rev. 2016;5(1):210. [DOI] [PMC free article] [PubMed] [Google Scholar]
- 13. Kaur J. A comprehensive review on metabolic syndrome. Cardiol Res Pract. 2014;2014:943162. [DOI] [PMC free article] [PubMed] [Google Scholar] [Retracted]
- 14. Jha SK, Jha NK, Kumar D, Ambasta RK, Kumar P. Linking mitochondrial dysfunction, metabolic syndrome and stress signaling in neurodegeneration. Biochim Biophys Acta Mol Basis Dis. 2017;1863(5):1132–1146. [DOI] [PubMed] [Google Scholar]
- 15. Ngo ST, Steyn FJ. The interplay between metabolic homeostasis and neurodegeneration: Insights into the neurometabolic nature of amyotrophic lateral sclerosis. Cell Regen. 2015;4(1):5. [DOI] [PMC free article] [PubMed] [Google Scholar]
- 16. Lacorte E, Ferrigno L, Leoncini E, Corbo M, Boccia S, Vanacore N. Physical activity, and physical activity related to sports, leisure and occupational activity as risk factors for ALS: A systematic review. Neurosci Biobehav Rev. 2016;66:61–79. [DOI] [PubMed] [Google Scholar]
- 17. Bandres-Ciga S, Noyce AJ, Hemani G, et al. ; International ALS Genomics Consortium. Shared polygenic risk and causal inferences in amyotrophic lateral sclerosis. Ann Neurol. 2019;85(4):470–481. [DOI] [PMC free article] [PubMed] [Google Scholar]
- 18. Borenstein M, Hedges LV, Higgins JPT, Rothstein HR. Introduction to meta-analysis. 2009. doi: 10.1002/9780470743386. [DOI]
- 19. Zhao Q, Wang J, Hemani G, Bowden J, Small DS. Statistical inference in two-sample summary-data Mendelian randomization using robust adjusted profile score. Ann Statst. 2020;48(3):1742–1769. [Google Scholar]
- 20. Bowden J, Davey Smith G, Haycock PC, Burgess S. Consistent estimation in Mendelian randomization with some invalid instruments using a weighted median estimator. Genet Epidemiol. 2016;40(4):304–314. [DOI] [PMC free article] [PubMed] [Google Scholar]
- 21. Hartwig FP, Smith GD, Bowden J. Robust inference in summary data Mendelian randomisation via the zero modal pleiotropy assumption. Int J Epidemiol. 2017;46:1985–1998. 10.1093/ije/dyx102. [DOI] [PMC free article] [PubMed] [Google Scholar]
- 22. Bowden J, Davey Smith G, Burgess S. Mendelian randomization with invalid instruments: Effect estimation and bias detection through Egger regression. Int J Epidemiol. 2015;44(2):512–525. [DOI] [PMC free article] [PubMed] [Google Scholar]
- 23. Chen X, Yazdani S, Piehl F, Magnusson PKE, Fang F. Polygenic link between blood lipids and amyotrophic lateral sclerosis. Neurobiol Aging. 2018;67:202.e1–e202.e6. [DOI] [PubMed] [Google Scholar]
- 24. Zeng P, Zhou X. Causal effects of blood lipids on amyotrophic lateral sclerosis: A Mendelian randomization study. Hum Mol Genet. 2019;28(4):688–697. [DOI] [PMC free article] [PubMed] [Google Scholar]
- 25. van Rheenen W, van der Spek RAA, Bakker MK, et al. Common and rare variant association analyses in Amyotrophic Lateral Sclerosis identify 15 risk loci with distinct genetic architectures and neuron-specific biology. bioRxiv. 2021;53:1636–1648. 10.1038/s41588-021-00973-1. [DOI] [PMC free article] [PubMed] [Google Scholar]
- 26. Mariosa D, Kamel F, Bellocco R, Ye W, Fang F. Association between diabetes and amyotrophic lateral sclerosis in Sweden. Eur J Neurol. 2015;22(11):1436–1442. [DOI] [PMC free article] [PubMed] [Google Scholar]
- 27. Zeng P, Wang T, Zheng J, Zhou X. Causal association of type 2 diabetes with amyotrophic lateral sclerosis: New evidence from Mendelian randomization using GWAS summary statistics. BMC Med. 2019;17(1):225. [DOI] [PMC free article] [PubMed] [Google Scholar]
- 28. Gallo V, Wark PA, Jenab M, et al. Prediagnostic body fat and risk of death from amyotrophic lateral sclerosis: The EPIC cohort. Neurology. 2013;80(9):829–838. [DOI] [PMC free article] [PubMed] [Google Scholar]
- 29. Dupuis L, Pradat P-F, Ludolph AC, Loeffler J-P. Energy metabolism in amyotrophic lateral sclerosis. Lancet Neurol. 2011;10(1):75–82. [DOI] [PubMed] [Google Scholar]
- 30. Zhang L, Tang L, Huang T, Fan D. Life course adiposity and amyotrophic lateral sclerosis: A Mendelian randomization study. Ann Neurol. 2020;87(3):434–441. [DOI] [PubMed] [Google Scholar]
- 31. Aziz NA. Life course adiposity and amyotrophic lateral sclerosis: A Mendelian randomization study. Ann Neurol. 2020;88(1):203. [DOI] [PubMed] [Google Scholar]
- 32. Julian TH, Glascow N, Barry ADF, et al. Physical exercise is a risk factor for amyotrophic lateral sclerosis: Convergent evidence from Mendelian randomisation, transcriptomics and risk genotypes. EBioMedicine. 2021;68:103397. [DOI] [PMC free article] [PubMed] [Google Scholar]
- 33. Klimentidis YC, Raichlen DA, Bea J, et al. Genome-wide association study of habitual physical activity in over 377,000 UK Biobank participants identifies multiple variants including CADM2 and APOE. Int J Obes. 2018;42(6):1161–1176. [DOI] [PMC free article] [PubMed] [Google Scholar]
- 34. Zhang G, Zhang L, Tang L, Xia K, Huang T, Fan D. Physical activity and amyotrophic lateral sclerosis: A Mendelian randomization study. Neurobiol Aging. 2021;105:374.e1–374.e4. 10.1016/j.neurobiolaging.2021.04.010. [DOI] [PubMed] [Google Scholar]
- 35. Clays E, De Bacquer D, Van Herck K, De Backer G, Kittel F, Holtermann A. Occupational and leisure time physical activity in contrasting relation to ambulatory blood pressure. BMC Public Health. 2012;12:1002. [DOI] [PMC free article] [PubMed] [Google Scholar]
- 36. Ragagnin AMG, Shadfar S, Vidal M, Jamali MS, Atkin JD. Motor neuron susceptibility in ALS/FTD. Front Neurosci. 2019;13:532. [DOI] [PMC free article] [PubMed] [Google Scholar]
- 37. Armon C. Smoking may be considered an established risk factor for sporadic ALS. Neurology. 2009;73(20):1693–1698. [DOI] [PMC free article] [PubMed] [Google Scholar]
- 38. Opie-Martin S, Jones A, Iacoangeli A, et al. UK case control study of smoking and risk of amyotrophic lateral sclerosis. Amyotroph Lateral Scler Frontotemporal Degener. 2020;21(3-4):222–227. [DOI] [PMC free article] [PubMed] [Google Scholar]
- 39. Schooling CM, Lopez PM, Yang Z, Zhao JV, Au Yeung SL, Huang JV. Use of multivariable Mendelian randomization to address biases due to competing risk before recruitment. Front Genet. 2020;11:610852. [DOI] [PMC free article] [PubMed] [Google Scholar]
- 40. Smit RAJ, Trompet S, Dekkers OM, Jukema JW, Le Cessie S. Survival bias in Mendelian randomization studies: A threat to causal inference. Epidemiology. 2019;30(6):813–816. [DOI] [PMC free article] [PubMed] [Google Scholar]
- 41. Chen L, Weinberg CR, Chen J. Using family members to augment genetic case-control studies of a life-threatening disease. Stat Med. 2016;35(16):2815–2830. [DOI] [PMC free article] [PubMed] [Google Scholar]
- 42. Zhan Y, Fang F. Smoking and amyotrophic lateral sclerosis: A Mendelian randomization study. Ann Neurol. 2019;85(4):482–484. [DOI] [PubMed] [Google Scholar]
- 43. Opie-Martin S, Wootton RE, Budu-Aggrey A, et al. Relationship between smoking and ALS: Mendelian randomisation interrogation of causality. J Neurol Neurosurg Psychiatry. 2020;91(12):1312–1315. [DOI] [PubMed] [Google Scholar]
- 44. Beghi E, Mennini T, Bendotti C, et al. The heterogeneity of amyotrophic lateral sclerosis: A possible explanation of treatment failure. Curr Med Chem. 2007;14(30):3185–3200. [DOI] [PubMed] [Google Scholar]
- 45. Larsson SC, Mason AM, Bäck M, et al. ; Million Veteran Program. Genetic predisposition to smoking in relation to 14 cardiovascular diseases. Eur Heart J. 2020;41(35):3304–3310. [DOI] [PMC free article] [PubMed] [Google Scholar]
- 46. Doty KR, Guillot-Sestier M-V, Town T. The role of the immune system in neurodegenerative disorders: Adaptive or maladaptive? Brain Res. 2015;1617:155–173. [DOI] [PMC free article] [PubMed] [Google Scholar]
- 47. Li C, Yang W, Wei Q, Shang H. Causal association of leukocytes count and amyotrophic lateral sclerosis: A Mendelian randomization study. Mol Neurobiol. 2020;57(11):4622–4627. [DOI] [PubMed] [Google Scholar]
- 48. Vuckovic D, Bao EL, Akbari P, et al. ; VA Million Veteran Program. The polygenic and monogenic basis of blood traits and diseases. Cell. 2020;182(5):1214–1231.e11. [DOI] [PMC free article] [PubMed] [Google Scholar]
- 49. Storm CS, Kia DA, Almramhi M, Wood NW. Using Mendelian randomization to understand and develop treatments for neurodegenerative disease. Brain Commun. 2020;2(1):fcaa031. [DOI] [PMC free article] [PubMed] [Google Scholar]
- 50. Weiss KM, Clark AG. Linkage disequilibrium and the mapping of complex human traits. Trends Genet. 2002;18(1):19–24. [DOI] [PubMed] [Google Scholar]
- 51. Lu C-H, Allen K, Oei F, et al. Systemic inflammatory response and neuromuscular involvement in amyotrophic lateral sclerosis. Neurol Neuroimmunol Neuroinflamm. 2016;3(4):e244. [DOI] [PMC free article] [PubMed] [Google Scholar]
- 52. Yuan S, Roos PM, Larsson SC. Interleukin-1 receptor antagonist, interleukin-2 receptor alpha subunit and amyotrophic lateral sclerosis. Eur J Neurol. 2020;27(10):1913–1917. [DOI] [PubMed] [Google Scholar]
- 53. Zhang H, Wang T, Han Z, Liu G. Mendelian randomization study to evaluate the effects of interleukin-6 signaling on four neurodegenerative diseases. Neurol Sci. 2020;41(10):2875–2882. [DOI] [PubMed] [Google Scholar]
- 54. Hop PJ, Zwamborn RAJ, Hannon E, et al. Genome-wide study of DNA methylation in Amyotrophic Lateral Sclerosis identifies differentially methylated loci and implicates metabolic, inflammatory and cholesterol pathways. medRxiv. 2021;https://www.medrxiv.org/content/10.1101/2021.03.12.21253115v1.full-text [Google Scholar]
- 55. D’Ovidio F, Manera U, Chiò A. Alcohol consumption and the risk of amyotrophic lateral sclerosis. In: Neuroscience of Alcohol: Mechanisms and Treatment. Elsevier; 2019:207–216. [Google Scholar]
- 56. Yu X, Wang T, Chen Y, et al. Alcohol drinking and amyotrophic lateral sclerosis: An instrumental variable causal inference. Ann Neurol. 2020;88(1):195–198. [DOI] [PubMed] [Google Scholar]
- 57. Sanderson E, Davey Smith G, Windmeijer F, Bowden J. An examination of multivariable Mendelian randomization in the single-sample and two-sample summary data settings. Int J Epidemiol. 2019;48(3):713–727. [DOI] [PMC free article] [PubMed] [Google Scholar]
- 58. Zhang L, Tang L, Xia K, Huang T, Fan D. Education, intelligence, and amyotrophic lateral sclerosis: A Mendelian randomization study. Ann Clin Transl Neurol. 2020;7(9):1642–1647. [DOI] [PMC free article] [PubMed] [Google Scholar]
- 59. Lee JJ, Wedow R, Okbay A, et al. ; Social Science Genetic Association Consortium. Gene discovery and polygenic prediction from a genome-wide association study of educational attainment in 1.1 million individuals. Nat Genet. 2018;50(8):1112–1121. [DOI] [PMC free article] [PubMed] [Google Scholar]
- 60. Border R, Johnson EC, Evans LM, et al. No support for historical candidate gene or candidate gene-by-interaction hypotheses for major depression across multiple large samples. Am J Psychiatry. 2019;176(5):376–387. [DOI] [PMC free article] [PubMed] [Google Scholar]
- 61. Blacher E, Bashiardes S, Shapiro H, et al. Potential roles of gut microbiome and metabolites in modulating ALS in mice. Nature. 2019;572(7770):474–480. [DOI] [PubMed] [Google Scholar]
- 62. Allen SP, Hall B, Castelli LM, et al. Astrocyte adenosine deaminase loss increases motor neuron toxicity in amyotrophic lateral sclerosis. Brain. 2019;142(3):586–605. [DOI] [PMC free article] [PubMed] [Google Scholar]
- 63. Group IAS, Others. Branched-chain amino acids and amyotrophic lateral sclerosis: A treatment failure? Neurology. 1993;43(12):2466–2466. [DOI] [PubMed] [Google Scholar]
- 64. Tandan R, Bromberg MB, Forshew D, et al. A controlled trial of amino acid therapy in amyotrophic lateral sclerosis: I. Clinical, functional, and maximum isometric torque data. Neurology. 1996;47(5):1220–1226. [DOI] [PubMed] [Google Scholar]
- 65. Izumi Y, Kaji R. Clinical trials of ultra-high-dose methylcobalamin in ALS. Brain Nerve. 2007;59(10):1141–1147. [PubMed] [Google Scholar]
- 66. Boentert M. Sleep disturbances in patients with amyotrophic lateral sclerosis: Current perspectives. Nat Sci Sleep. 2019;11:97–111. [DOI] [PMC free article] [PubMed] [Google Scholar]
- 67. Sun X, Zhao X, Liu Q, et al. Study on sleep–wake disorders in patients with genetic and non-genetic amyotrophic lateral sclerosis. J Neurol Neurosurg Psychiatry. 2020;92(1):96–102. [DOI] [PubMed] [Google Scholar]
- 68. Shin S-Y, Fauman EB, Petersen A-K, et al. ; Multiple Tissue Human Expression Resource (MuTHER) Consortium. An atlas of genetic influences on human blood metabolites. Nat Genet. 2014;46(6):543–550. [DOI] [PMC free article] [PubMed] [Google Scholar]
- 69. Yang L, Lv X, Du H, Wu D, Wang M. Causal effects of serum metabolites on amyotrophic lateral sclerosis: A Mendelian randomization study. Prog Neuropsychopharmacol Biol Psychiatry. 2020;97:109771. [DOI] [PubMed] [Google Scholar]
- 70. Cullell N, Cárcel-Márquez J, Gallego-Fábrega C, et al. Sleep/wake cycle alterations as a cause of neurodegenerative diseases: A Mendelian randomization study. Neurobiol Aging. 2021;106:320.e1–320.e12. 10.1016/j.neurobiolaging.2021.05.008. [DOI] [PubMed] [Google Scholar]
- 71. Burgess S, Scott RA, Timpson NJ, Davey Smith G, Thompson SG.; EPIC-InterAct Consortium. Using published data in Mendelian randomization: A blueprint for efficient identification of causal risk factors. Eur J Epidemiol. 2015;30(7):543–552. [DOI] [PMC free article] [PubMed] [Google Scholar]
- 72. Burgess S, Labrecque JA. Mendelian randomization with a binary exposure variable: Interpretation and presentation of causal estimates. Eur J Epidemiol. 2018;33(10):947–952 [DOI] [PMC free article] [PubMed] [Google Scholar]
- 73. Labrecque JA, Swanson SA. Interpretation and potential biases of Mendelian randomization estimates with time-varying exposures. Am J Epidemiol. 2019;188(1):231–238. [DOI] [PubMed] [Google Scholar]
- 74. Sallis HM, Davey Smith G, Munafò MR. Cigarette smoking and personality: Interrogating causality using Mendelian randomisation. Psychol Med. 2019;49(13):2197–2205. [DOI] [PMC free article] [PubMed] [Google Scholar]
- 75. Burgess S, Bowden J, Fall T, Ingelsson E, Thompson SG. Sensitivity analyses for robust causal inference from Mendelian randomization analyses with multiple genetic variants. Epidemiology. 2017;28(1):30–42. [DOI] [PMC free article] [PubMed] [Google Scholar]
- 76. Hartwig FP, Davey Smith G, Bowden J. Robust inference in summary data Mendelian randomization via the zero modal pleiotropy assumption. Int J Epidemiol. 2017;46(6):1985–1998. [DOI] [PMC free article] [PubMed] [Google Scholar]
- 77. Verbanck M, Chen C-Y, Neale B, Do R. Detection of widespread horizontal pleiotropy in causal relationships inferred from Mendelian randomization between complex traits and diseases. Nat Genet. 2018;50(5):693–698. [DOI] [PMC free article] [PubMed] [Google Scholar]
Associated Data
This section collects any data citations, data availability statements, or supplementary materials included in this article.