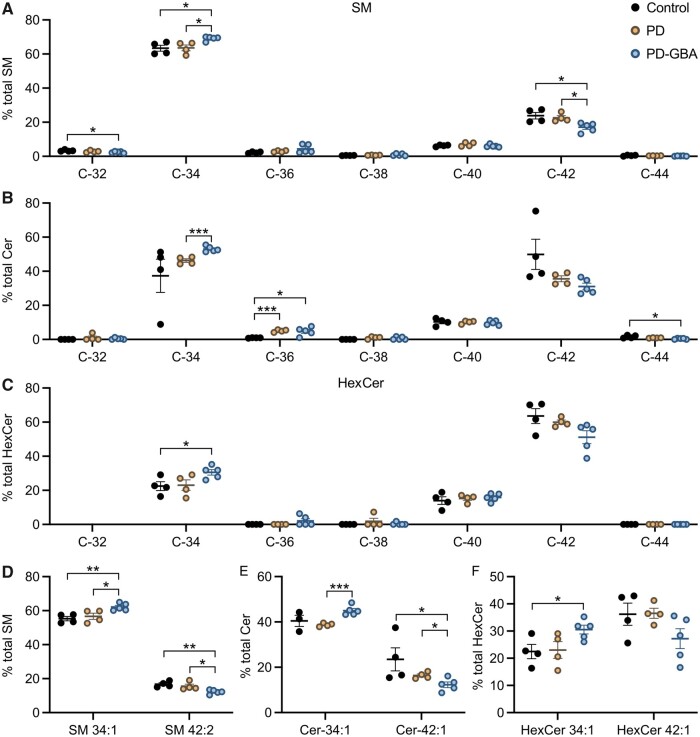
Figure 4.
Levels of sphingolipid molecules with different acyl chain length. Measurements of SM, Cer and HexCer molecules were made in fibroblast lipid extracts from control subjects (n = 4) and idiopathic Parkinson’s disease (PD; n = 4) and PD-GBA (n = 5) patients (one replicate per cell line). (A–C) Levels of SM, Cer and HexCer with different hydrocarbon chain lengths (C32 to C44) are shown as per cent of the respective SM, Cer and HexCer total content. Data are shown as individual values and mean ± SEM. Multiple t-test was performed to compare means between two groups, control versus idiopathic Parkinson’s disease, control versus PD-GBA and idiopathic Parkinson’s disease versus PD-GBA. Control versus PD-GBA: SM C32 (P = 0.0269), SM C34 (P = 0.0113), SM C42 (P = 0.0154), Cer C36 (P = 0.0188), Cer C44 (P = 0.0197), HexCer C34 (P = 0.0285). Idiopathic Parkinson’s disease versus PD-GBA: SM C34 (P = 0.0124), SM C42 (P = 0.0144), Cer C34 (P < 0.001). Control versus idiopathic Parkinson’s disease: Cer C36 (P < 0.001). (D) Levels of the two main SM molecules, SM 34:1 and SM 42:2, are shown as percentage of the total SM content. Control versus PD-GBA: SM 34:1 (P = 0.0034), SM 42:2 (P = 0.0024). Idiopathic Parkinson’s disease versus PD-GBA: SM 34:1 (P = 0.0258), SM 42:2 (P = 0.0282). (E) Levels of the two main Cer molecules, Cer 34:1 and Cer 42:1, are shown as percentage of the total Cer content. Control versus PD-GBA: Cer 42:1 (P = 0.0477). Idiopathic Parkinson’s disease versus PD-GBA: Cer 34:1 (P < 0.001), Cer 42:1 (P = 0.0329). (F) Levels of the two main HexCer molecules, HexCer 34:1 and HexCer 42:1, are shown as percentage of the total HexCer content. Control versus PD-GBA: HexCer 34:1 (P = 0.029). *P < 0.05, **P < 0.01, ***P < 0.001.

