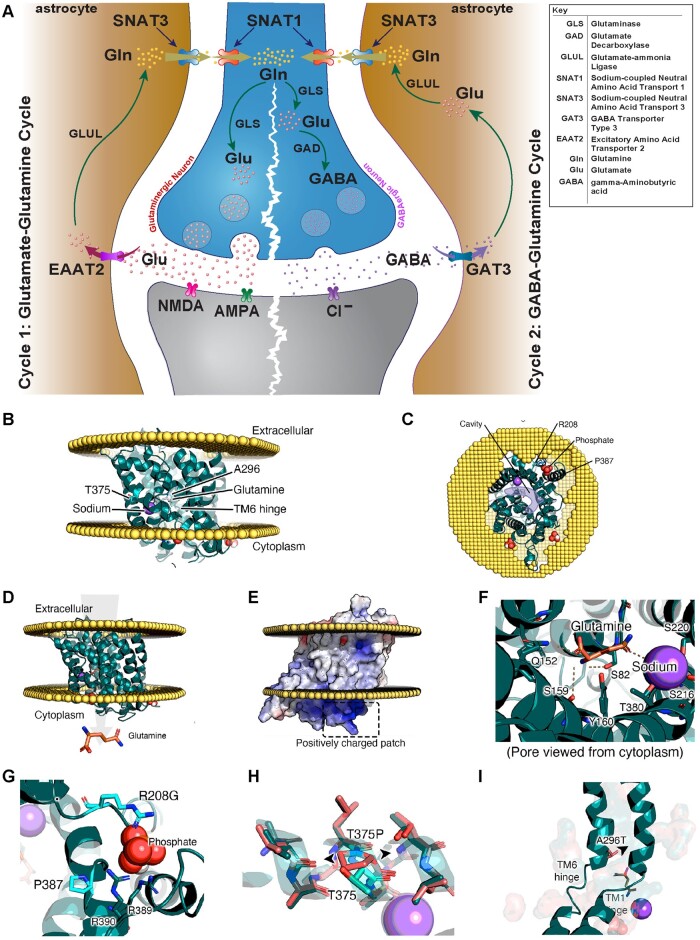
Figure 2.
An illustration of the glutamate/GABA-glutamine cycle, SNAT3 protein modelling and effect of amino acid change of identified SLC38A3 variants. (A) An illustration of the glutamate/GABA-glutamine cycle which takes place between neurons and astrocytes to replenish the glutamate [Glu] in the glutaminergic neurons (cycle 1) and GABA pool in the GABAergic neurons (cycle 2). In both cycles, the cycle starts with the synthesis of glutamate from glutamine in the neurons via glutaminase (GLS). In cycle 1 (glutamate-glutamine cycle), glutamate is packed into synaptic vesicles and is transported and released into the synaptic cleft upon neuronal activation. Glutamate then acts on the postsynaptic glutamate receptors (NMDA, AMPA or KAR) before it is taken up to the astrocytes (via excitatory amino acid transporter 2; EAAT2) to be recycled back into glutamine via glutamate-ammonia ligase (GLUL). In cycle 2, glutamate is a converted into GABA via glutamate decarboxylase (GAD) in an additional step. Similarly, GABA is then packed into synaptic vesicles and is released into synaptic cleft upon activating signal. GABA is then taken up by neighbouring astrocytes through GABA transporter 3 (GAT3) to be recycled back into glutamine (Gln). In both cycles, sodium-coupled neural (system N) amino-acid transporter 3 (SNAT3) is then responsible for the transport of glutamine into the extracellular fluid for uptake into neurons via system A transporter 1 (SNAT1) to replenish the glutamate or GABA pools. Loss-of-function of SNAT3 is thus expected to result in depletion of glutamate and GABA neurotransmitter pools in neurons. Note that defects in GAD1, EAAT2, GLS, and GLUL as part of this cycle are known to cause developmental and epileptic encephalopathy. (B–I) show protein modelling SNAT3 and effect of implicated SLC38A3 variants. (B and C) Model of SNAT3 with direction of glutamine transport displayed in arrow. (D) Model of SNAT3 and its embedding in a membrane. (E) Example of one of the positively charged regions at the membrane interface with the cytosol, which may be an organophosphate pocket (see G). (F) Glutamine and sodium added to the model and their interacting residues. (G) Residues P387Q and R208G in the suspected organophosphate pocket. (H) Distortion created in the transmembrane helix caused by T375P (wild-type in teal, mutant in coral). (I) A296T is near the TM1 and TM6 hinges, which shift to allow the channel to open on the other side, even the slightest reduction in this pocket will likely affect the dynamic behaviour.

