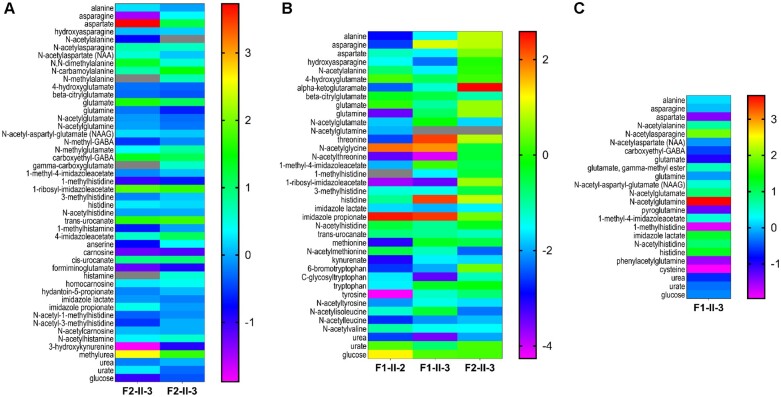
Figure 4.
Metabolomic analysis reveals altered glutamine, histidine, asparagine, and tryptophan metabolism. Metabolites of amino acids transported by SNAT3 transporter: glutamine, glutamate, aspartate, asparagine, and histidine are depicted. Also shown are altered metabolites of tryptophan, alanine, tyrosine, methionine, proline, threonine, leucine, valine, isoleucine, urea, urate, and glucose. (A) Urine metabolomic assays of Family 2, Individual II-3 (two independent samples collected at different intervals from same subject). (B) Plasma assays of patients Family 1, Individuals II-2 and II-3, Family 2, Individual II-3; and (C) CSF assay of patient Family 1, Individual II-3. The z-scores illustrate whether a given metabolite is significantly increased (positive z-score) relative to the control reference population. In general, a z-score greater than +2 or lower than −2 is considered significantly different from the control. Higher z-scores are yellow to red in colour, lower z-scores are blue to purple in colour, as shown in legend bar. Analytes which were not detected are depicted in grey.

