

Abstract
Melanogenesis (melanin pigment production) in melanocytes is canonically stimulated by the alpha-melanocyte stimulating hormone (αMSH), which activates the cyclic-AMP-mediated expression of the melanocyte inducing transcription factor (MITF) and its downstream melanogenic genes, including the principal rate-limiting melanogenic enzyme tyrosinase (TYR). Here we report that interferon-gamma (IFNG; type II interferon), but not interferon-alpha (a type I interferon), induces a noncanonical melanogenic pathway in mouse and human melanocytic cells. Inhibition of IFNG pathway by the JAK1/2 inhibitor ruxolitinib or knocking out Stat1 gene abrogated the IFNG-induced melanogenesis. Interestingly, IFNG-induced melanogenesis was independent of MITF. IFNG markedly increased the TYR protein expression but did not affect the mRNA expression, suggesting a post-translational regulatory mechanism. In contrast, IFNG had no effect on the expression of other melanogenesis-related proteins, e.g. tyrosinase-related protein 1 (TYRP1) and dopachrome tautomerase (DCT). Glycosidase digestion assays revealed that IFNG treatment increased the mature glycosylated form of TYR, but not its de novo synthesis. Moreover, cycloheximide chase assay showed that degradation of TYR was decreased in IFNG-treated cells. These results suggest that the IFNG-STAT1 pathway regulates melanogenesis via regulation of the post-translational processing and protein stability of TYR.
Keywords: Interferon-gamma signaling, IFNG, Melanin, Melanogenesis, Post-translational Modification, Tyrosinase, Melanoma
1. INTRODUCTION
Melanin is the principal contributor to the mammalian skin and hair pigmentation. It is synthesized in melanosomes, which are lysosome-related cellular organelles within melanocytes. Melanosomes are transported to the adjacent keratinocytes leading to skin pigmentation, which serves as a key physiological defense against the genotoxic effects of ultraviolet radiation (UVR) (Mo et al., 2019). Inflammatory cytokines secreted by keratinocytes and infiltrated lymphocytes in the skin microenvironment after UV irradiation or other dermatological damages have been implicated in regulating proliferation, differentiation, and melanogenesis in melanocytes via direct or indirect mechanisms (Choi et al., 2013; Wang et al., 2013). The most well-studied and potent inducer of melanogenesis is alpha-melanocyte-stimulating hormone (αMSH), which is synthesized in keratinocytes following exposure to UVR, secreted into the skin microenvironment, and stimulates melanogenesis in melanocytes. αMSH activates melanocyte-inducing transcription factor (MITF), which is considered to be the principal regulator of melanin biosynthesis (Nguyen and Fisher, 2019). MITF initiates transcription of numerous genes coding for melanogenesis-associated proteins, including tyrosinase (TYR), tyrosinase-related protein 1 (TYRP1), and dopachrome tautomerase (DCT) (Kawakami and Fisher, 2017; Sturm, 2006). Tyrosinase catalyzes the tyrosine oxidation to dopaquinone, which is the first and rate-limiting step of melanogenesis (Chang, 2009). TYRP1 and DCT are involved in later steps of melanin synthesis and also play important roles in regulating the melanogenic apparatus (Slominski et al., 2004).
Tyrosinase (TYR) is a type I membrane-bound glycoprotein (Jagirdar et al., 2014). The nascent TYR protein is cotranslationally translocated into the lumen of the endoplasmic reticulum (ER) and undergoes initial asparagine-linked (N-linked) glycosylation (Negroiu et al., 1999). The essentiality of glycosylation to the enzymatic function of TYR has been demonstrated, as inhibition of glycosylation with tunicamycin or glucosamine abolishes the maturation, trafficking, and the enzymatic activity of TYR (Halaban et al., 1997; Wang et al., 2006). Furthermore, mutations of the TYR N-linked glycosylation sites cause hypopigmentation phenotype by obstructing tyrosinase maturation (Branza-Nichita et al., 2000). The core-glycosylated TYR (~70kD) is transported to the trans-Golgi network (TGN), where it undergoes further modifications of additional mannose residues after passing the quality control in the ER. Mature TYR (~ 80kD) is then transported out of the TGN to the melanosomes where melanin synthesis occurs (Wang et al., 2006). Aberrant disruption of tyrosinase trafficking also affects melanin production. Regulation of melanogenesis via alteration of tyrosinase occurs at both transcriptional and post-transcriptional levels.
Interferon-gamma (IFNG) has long been known as the principal proinflammatory cytokine that plays the role of the central orchestrator of inflammation and autoimmune disease (Schroder et al., 2004). IFNG is predominantly produced by the NK cells, NK-T cells, and macrophages of the innate immune system, as well as the CD4+ Th1 and CD8+ cytotoxic T lymphocytes of the adaptive immune system (Schroder et al., 2004; Zaidi, 2019; Zaidi and Merlino, 2011). IFNG is directly involved in almost all types of skin inflammatory conditions, e.g., those caused by pathogenic infections, tissue injury, tissue stress, and/or malfunction (Dries and Perry, 2002; Xiao et al., 2009). IFNG signaling pathway is a well-established regulator of the classical activation of macrophages, and thus controls the synthesis and secretion of cytokines and enzymes important for tissue remodeling and wound healing (Fujiwara and Kobayashi, 2005; Schroder et al., 2004).
UVR induces an inflammatory response in the skin in which IFNG plays an important orchestrating role. IFNG receptors, IFNGR1 and IFNGR2, transduce IFNG signaling from the extracellular environment to the cellular signaling machinery. The IFNGR1 is associated with one member of the Janus activated kinase family, JAK1, whereas IFNGR2 is associated with JAK2 (Avalle et al., 2012). The canonical IFNG signaling is mediated by JAK/STAT (signal transducer and activator of transcription) pathway. The receptors are rearranged and dimerized upon binding of IFNG, followed by the autophosphorylation and activation of receptor associated JAK1 and JAK2. The activated JAKs phosphorylate the tyrosine residue at position 701 (Tyr701) in STAT1, leading to the formation and activation of STAT1 homodimers (Wenta et al., 2008), which translocate to the nucleus and bind to the IFNG-activated site (GAS) elements on their target loci and initiate transcription of IFNG-stimulated genes to mediate numerous biological responses (Zaidi, 2019). Here we present evidence that IFNG signaling pathway is a regulator of melanogenesis via post-translational regulation of TYR activity and protein stability.
2. MATERIALS AND METHODS
2.1. Cell culture
B16 mouse melanoma cell line was the B16-F1 subline and was obtained from Dr. Vincent J. Hearing (National Cancer Institute, NIH, USA) (Hearing et al., 1985; Jimenez et al., 1988). B16N is a subline of B16 cell line, generated in the laboratory of Dr. Glenn Merlino (National Cancer Institute, NIH, USA). Hs936.T human melanoma cell line was obtained from American Type Culture Collection (ATCC Cat. No. CRL-7687). All of these cell lines were cultured in Dulbecco’s Modified Eagle Medium (DMEM) supplemented with 10% fetal bovine serum (FBS), L-alanyl-L-Glutamine (2 mM) and Gentamycin (50 ug/ml). HEMn-MP are mildly pigmented neonatal human epidermal melanocyte primary cells obtained from ThermoFisher (Cat. No. C1025C) and were grown in Medium 254 supplemented with Human Melanocyte Growth Supplement (ThermoFisher Cat. No. S-002–5). All cells were grown at 37°C in a humidified incubator under 5% CO2.
2.2. Cytokine and hormone treatments
Mouse recombinant interferon-gamma (IFNG) was purchased from Cell Signaling Technology (Cat. No. 5222) or BioLegend (Cat. No. 575304). Human recombinant IFNG was purchased from Cell Signaling Technology (Cat. No. 8901) or BioLegend (Cat. No. 575304). Mouse interferon-alpha 2 (IFNA2) recombinant protein was purchased from Affymetrix eBioscience (Cat. No. 14–8312). The typical cytokine specific activity was 1×10⁷ IU/mg. All cytokine treatments were performed at a media concentration of 10 ng/ml (equivalent to 100 IU/ml), as used by others previously (Natarajan et al., 2014; Son et al., 2014). Alpha melanocyte-stimulating hormone (αMSH) was purchased from Sigma-Aldrich (Cat. No. 581–05-5). The concentration used for mouse and human melanoma/melanocyte cells were 10 nM and 100 nM, respectively. The culture media and cytokines/hormone were refreshed every other day.
2.3. Melanin content assay
Melanocytes and melanoma cells were collected after the treatment with different cytokines for indicated time periods. The pellets were lysed in NP-40 lysis buffer containing 1x protease inhibitors. Melanin was separated from lysates by centrifugation for 15 min, then dissolved in 1 M NaOH for 1 h at 100º C. The melanin content was determined by measuring the absorbance at 490 nm using a microplate reader. The synthetic melanin standard (Sigma) curve was generated to calculate the melanin content of each sample. The protein concentration of each sample was measured with the Bio-Rad Protein Assay following the manufacturer’s protocol. The melanin content was obtained by normalization of melanin amount to protein input.
2.4. Ruxolitinib treatment
B16N cells were pretreated without or with 5 μM ruxolitinib (Selleckchem Cat. No. S1378) for 4 h, then cultured in the presence or absence of indicated cytokines. After 2 d of cytokine treatments, cells were washed with sterile Dulbecco’s Phosphate Buffered Saline (Gibco) and continued to culture in regular DMEM medium for another two days before measurement of melanin content.
2.5. Western blotting
Whole-cell extracts were lysed using Pierce RIPA buffer (Thermo Scientific) or NP-40 buffer supplemented with 1x Halt protease inhibitor cocktail (ThermoFisher) and 1x Halt phosphatase inhibitor cocktail (ThermoFisher). The concentration of cell extracts was measured by the Bio-Rad Protein Assay following manufacturer’s protocol. The same amounts of protein extracts were separated on the 4%−20% Mini-Protean TGX gel system (Bio-Rad) and transferred to PVDF (0.45 μm pore size, Millipore) membranes. Membranes were then incubated with the following primary antibodies: STAT1 (D1K9Y, 1:1000, Cell Signaling Technology), p-STAT1 (Y701, 58D6, 1:1000, Cell Signaling Technology), STAT3 (124H6, 1:1000, Cell Signaling Technology), p-STAT3 (Y705, D3A7, 1:2000, Cell Signaling Technology), IRF1 (D5E4, 1:1000, Cell Signaling Technology), TYR (PEP7h, 1:5000; gift from Vincent J. Hearing), TYRP1 (PEP1, 1:5000; gift from VJH), DCT (PEP8, 1:5000; gift from VJH), MITF (D5G7V, 1:1000, Cell Signaling Technology), PMEL/gp100 (EP4863(2), 1:1000, Abcam), and GAPDH-HRP (D16H11, 1:1000, Cell Signaling Technology). The secondary antibodies used for detection were HRP-conjugated goat anti-mouse and goat anti-rabbit IgG (1:5000, ThermoFisher). Band intensities of TIFF images were quantified by using Image J software.
2.6. CRISPR-Cas9-mediated knockout of Stat1 and Stat3
We designed two guide RNAs targeting different exons of Stat1 and Stat3 loci by online CRISPR Design Tool. Plasmid construction and molecular cloning were done by following the previously published protocol (Ran et al., 2013).
The Cas9 expression construct pSpCas9(BB)-2A-GFP was purchased from Addgene (Plasmid ID 44758). Stat1 (NM_001205313.1) and Stat3 (NM_213659) were used to search gRNA using the online CRISPR Design Tool (http://tools.genome-engineering.org) (Ran et al., 2013).Two different gRNA targeting different exons were used for both Stat1 and Stat3. The sequence of gRNA_Stat1_#1: GGAAACTGTCATCGTACAGC. The sequence of gRNA_Stat1_#2: GGTCGCAAACGAGACATCAT. The sequence of gRNA_Stat3_#1: GCAGCTGGACACACGCTACC. The sequence of gRNA_Stat3_#2: TTCTTCACTAAGCCGCCAAT. Plasmid construction and molecular cloning were done by following the previously published protocol (Ran et al., 2013). B16N cells were transfected with each construct using Lipofectamine 3000 (Invitrogen) following the manufacturer’s protocol. Single GFP+ cell was sorted into each well of multiple 96-well plates by BD Influx Cell Sorter 48 h post-transfection. Selected clones were screened for expression of either STAT1 or STAT3 by quantitative real-time PCR, western blot analysis, and Surveyor mutation detection assay.
2.7. Quantitative Real-Time PCR
Cells were lysed by Trizol reagent (Invitrogen) and RNA was purified by RNeasy Mini Kit with DNase I digestion (Qiagen) following the manufacturer’s protocol. Generation of cDNA was performed by GoTaq 2-step RT system (Qiagen). Real-time PCR reactions were measured by ABI StepOnePlus system using SYBR green qPCR master mix (ThermoFisher). The sequence of primers for amplification of different genes were: Mitf-M (Forward 5’-GCCTTGTTTATGGTGCCTTC −3’, Reverse 5’GTCCTCCTCCCTCTACTTTCTGT-3’); Dct (Forward 5’ CTTCCTAACCGCAGAGCAAC-3’, Reverse 5’ CAGGTAGGAGCATGCTAGGC-3’); Tyrp1 (Forward 5’ TCTCTTCGGGCAATTAACAG-3’, Reverse: 5’-GGGGAGGACGTTGTAAGATT −3’); 18s rRNA (Forward 5’-CTTAGAGGGACAAGTGGCG-3’, Reverse 5’-ACGCTGAGCCAGTCAGTGTA-3’). 18s rRNA was used as the reference control. The ΔΔCT method was used to calculate relative expression level.
2.8. Tyrosinase activity assay
Tyrosinase activity was determined by measuring the rate of oxidation of 3, 4-Dihydroxy-L-phenylalanine (L-DOPA) as previously described (Newton et al., 2007) with some modifications. Cells were collected and washed with ice-cold DPBS after treatment of indicated cytokines for 4 d. Cell pellets were lysed in 0.1 M phosphate buffer (pH 6.8) containing 1% Triton X-100 and 1x Halt protease inhibitor cocktail. The lysates were centrifuged at 13,000xg at 4ºC for 10 min. 100 μL samples in triplicates of tyrosinase-containing supernatants were incubated with 100 μl of 3 mg/mL L-DOPA solution (Sigma) that were dissolved in 0.1 M phosphate buffer (pH 6.8) at 37ºC for 2 h. Absorbance was measured at 490 nm at 0 h and 2 h using a multi-well spectrophotometer. The tyrosinase activity was calculated as ΔOD490 (OD4902h- OD4900h)/min/mg of protein lysate used.
2.9. Glycosidase digestion
Cells were collected after culturing for 4 d in the presence or absence of indicated cytokines. 20 μg of protein lysates of each condition was treated with either Endo H (New England Biolabs) or PNGase F for 1 h at 37ºC, following the manufacturer’s protocol. After digestion, the same amount of protein digestion products was subjected to western blotting analysis probing with PEP7h antibody (1:5000) or GAPDH-HRP (D16H11, 1:5000, Cell Signaling Technology).
2.10. Cycloheximide pulse-chase assay and proteasome inhibitor treatment
After 4 d treatment of indicated cytokines, B16N cells were washed with DPBS, followed by culturing in medium containing 50 μM cycloheximide (Sigma) for the indicated time periods. Cells were collected at 0 h, 3 h, and 6 h post-cycloheximide treatment. Protein lysates were collected and analyzed for tyrosinase abundance by western blotting as described before. The tyrosinase degradation rates were determined by linear regression analysis by GraphPad Prism software.
For the analysis of proteasome-mediated degradation of TYR, B16 cells were treated with IFNG (10 ng/ml for 4 d) followed by treatment with the proteasome inhibitor MG132 (10 µM) for 3 h before lysate preparation.
2.11. Statistical analyses
All experiments were performed a minimum of three times or more in triplicate to provide adequate statistical power. All bar graphs were generated by GraphPad Prism software. Two-tailed unpaired Student’s t-test was used to determine the statistical difference between two groups. For more than two groups, ANOVA test with post-hoc Tukey analysis was used. For tyrosinase degradation rates, an analysis of covariance (ANCOVA) was used to determine whether the slopes and intercepts are significantly different. P<0.05 was considered as statistically significant.
3. RESULTS
3.1. IFNG induces melanogenesis in melanoma cells and primary melanocytes
To evaluate the effect of interferon cytokines on melanin synthesis, B16 and B16N mouse melanoma cell lines were cultured continuously in medium containing either type I interferon (IFNA2), type II interferon (IFNG), or alpha melanocyte stimulating hormone (αMSH) as a positive control for the indicated time periods (Figure 1a-d). Treatment of B16 and B16N cells with IFNG for a short period of time (up to 2 d) did not increase melanin synthesis that could be visualized in the cell pellets (Figure 1a, c) or measurable by melanin content assay (Figure 1b, d). As expected, treatment with αMSH elicited a rapid increase in melanin synthesis, as early as 1 d. Intriguingly, melanin content of B16 and B16N cells was significantly increased after treatment with IFNG for a longer period of time (at least 3 d) (Figure 1a-d). However, type I interferon IFNA2 failed to affect melanin content in these two cell lines at any time point (Figure 1a-d). In addition, recombinant human IFNG also increased melanin synthesis in human melanoma cell line Hs936.T after a relatively prolonged treatment (at least 6 d), but not after short treatment (Figure 1e, f). Surprisingly, αMSH inhibited melanogenesis in this cell line (Figure 1e, f).
Figure 1.
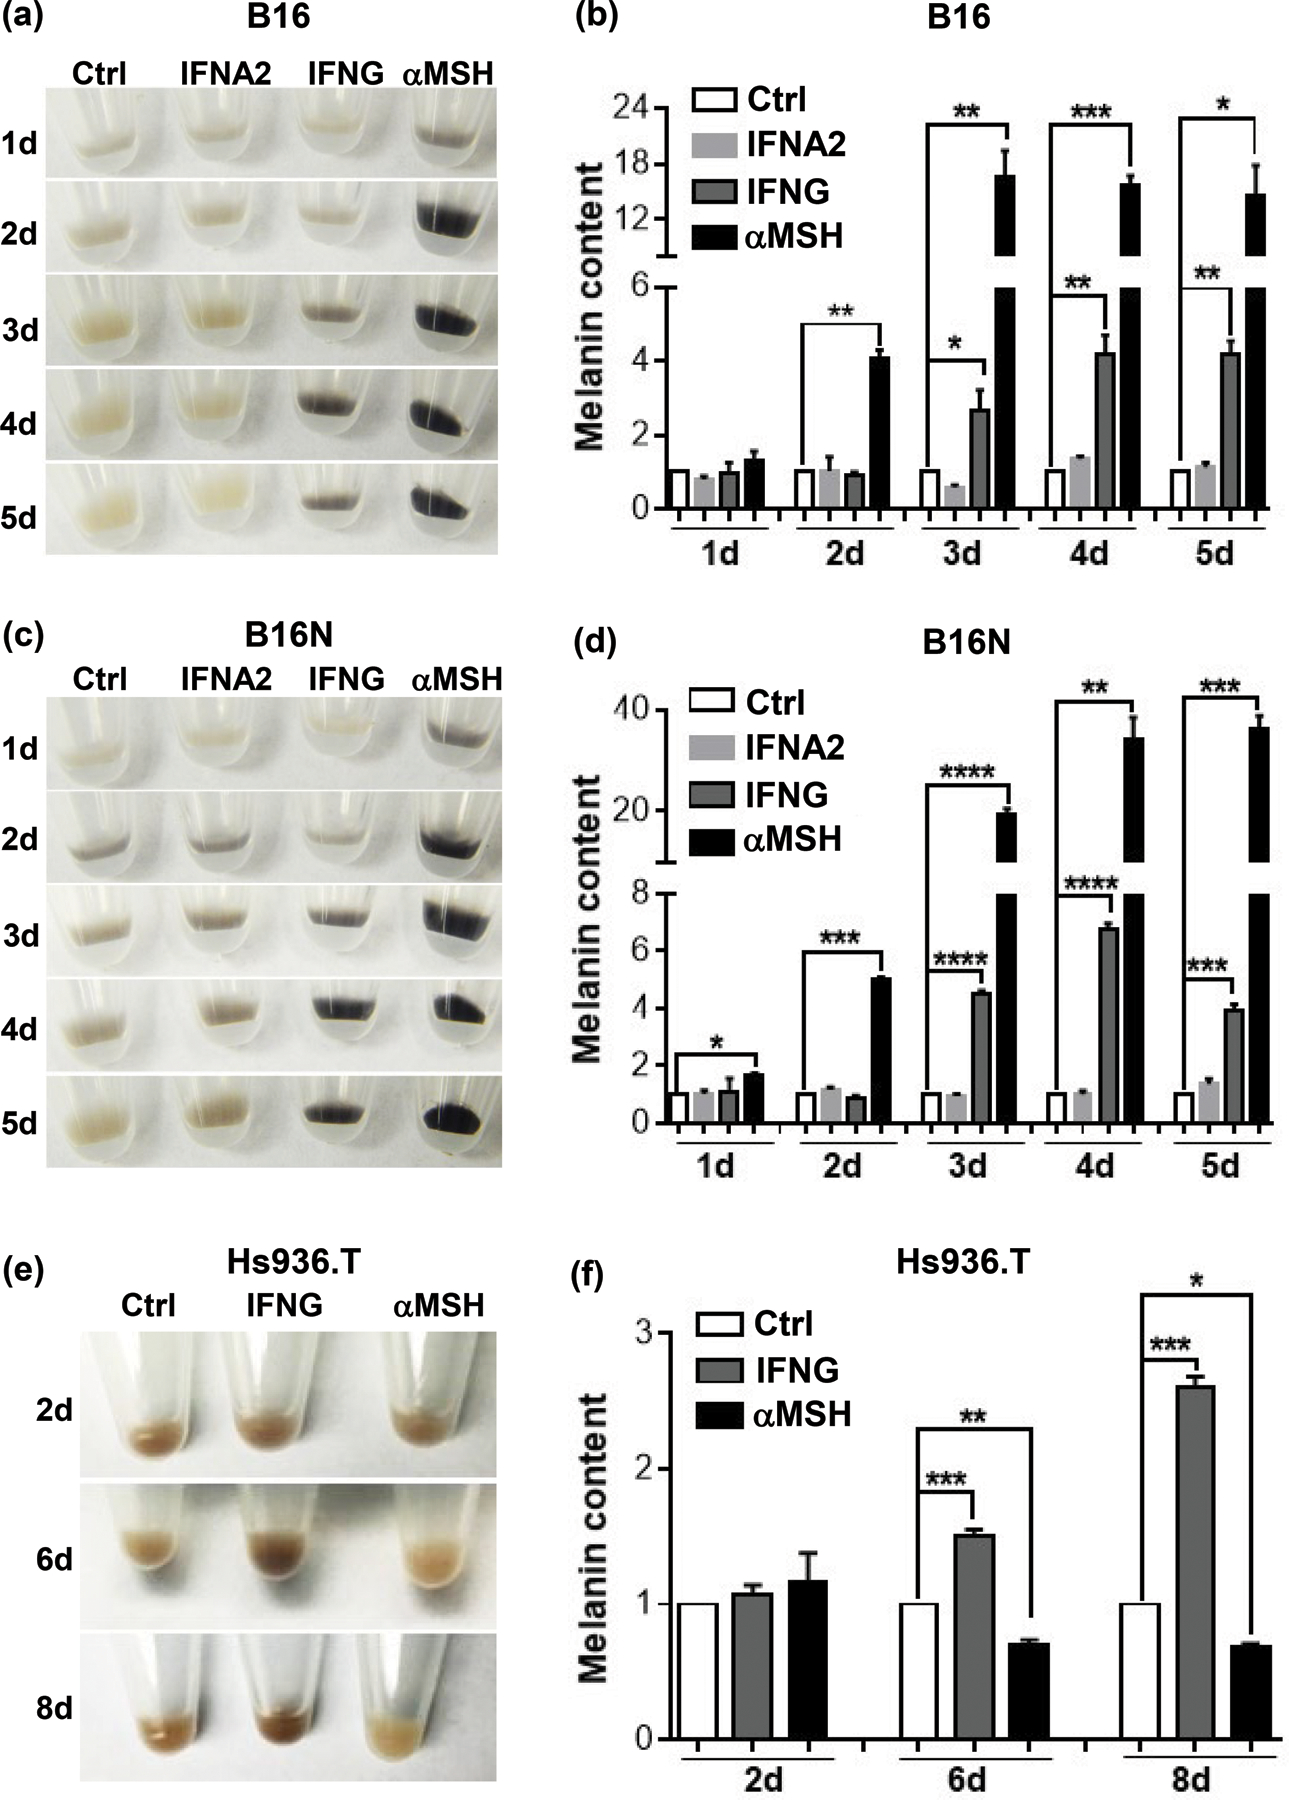
Effects of cytokines on melanin synthesis. (a), (c), (e) Images of cell pellets of B16, B16N, and Hs936.T cells, respectively, following cytokine or hormone treatments for indicated time periods. (b), (d), (f) Quantification of melanin content in melanoma cells in the presence or absence of cytokine or hormone treatments for indicated time periods. IFNG and IFNA2 both were used at 10 ng/ml and αMSH at 10 nM (for mouse cells) or 100 nM (for human cells) concentration. Images are representative of at least 3 independent experiments. All graphed data are presented as mean ± SEM of three biological replicate experiments, relative to the Ctrl group of each indicated time period. *P<0.05; **P<0.01; ***P<0.001; ****P<0.0001.
To test if prolonged and continuous IFNG signaling is necessary for inducing melanogenesis, we discontinued IFNG treatment at the indicated time points, as low as 1 h, but continued to culture the B16, B16N, and Hs936.T cells in regular media, followed by measurement of melanin content at 4 d (for B16 and B16N cells) (Figure 2a, b) or 8 d (for Hs936.T) (Figure 2c). A visible elevation in melanin content was apparent in melanoma cells by exposure to IFNG for as short as 1 d (for B16 and B16N cells) (Figure 2a, b) or 2 d (for Hs936.T) (Figure 2c) , which demonstrated that IFNG-induced melanogenesis did not require continuous prolonged treatment.
Figure 2.
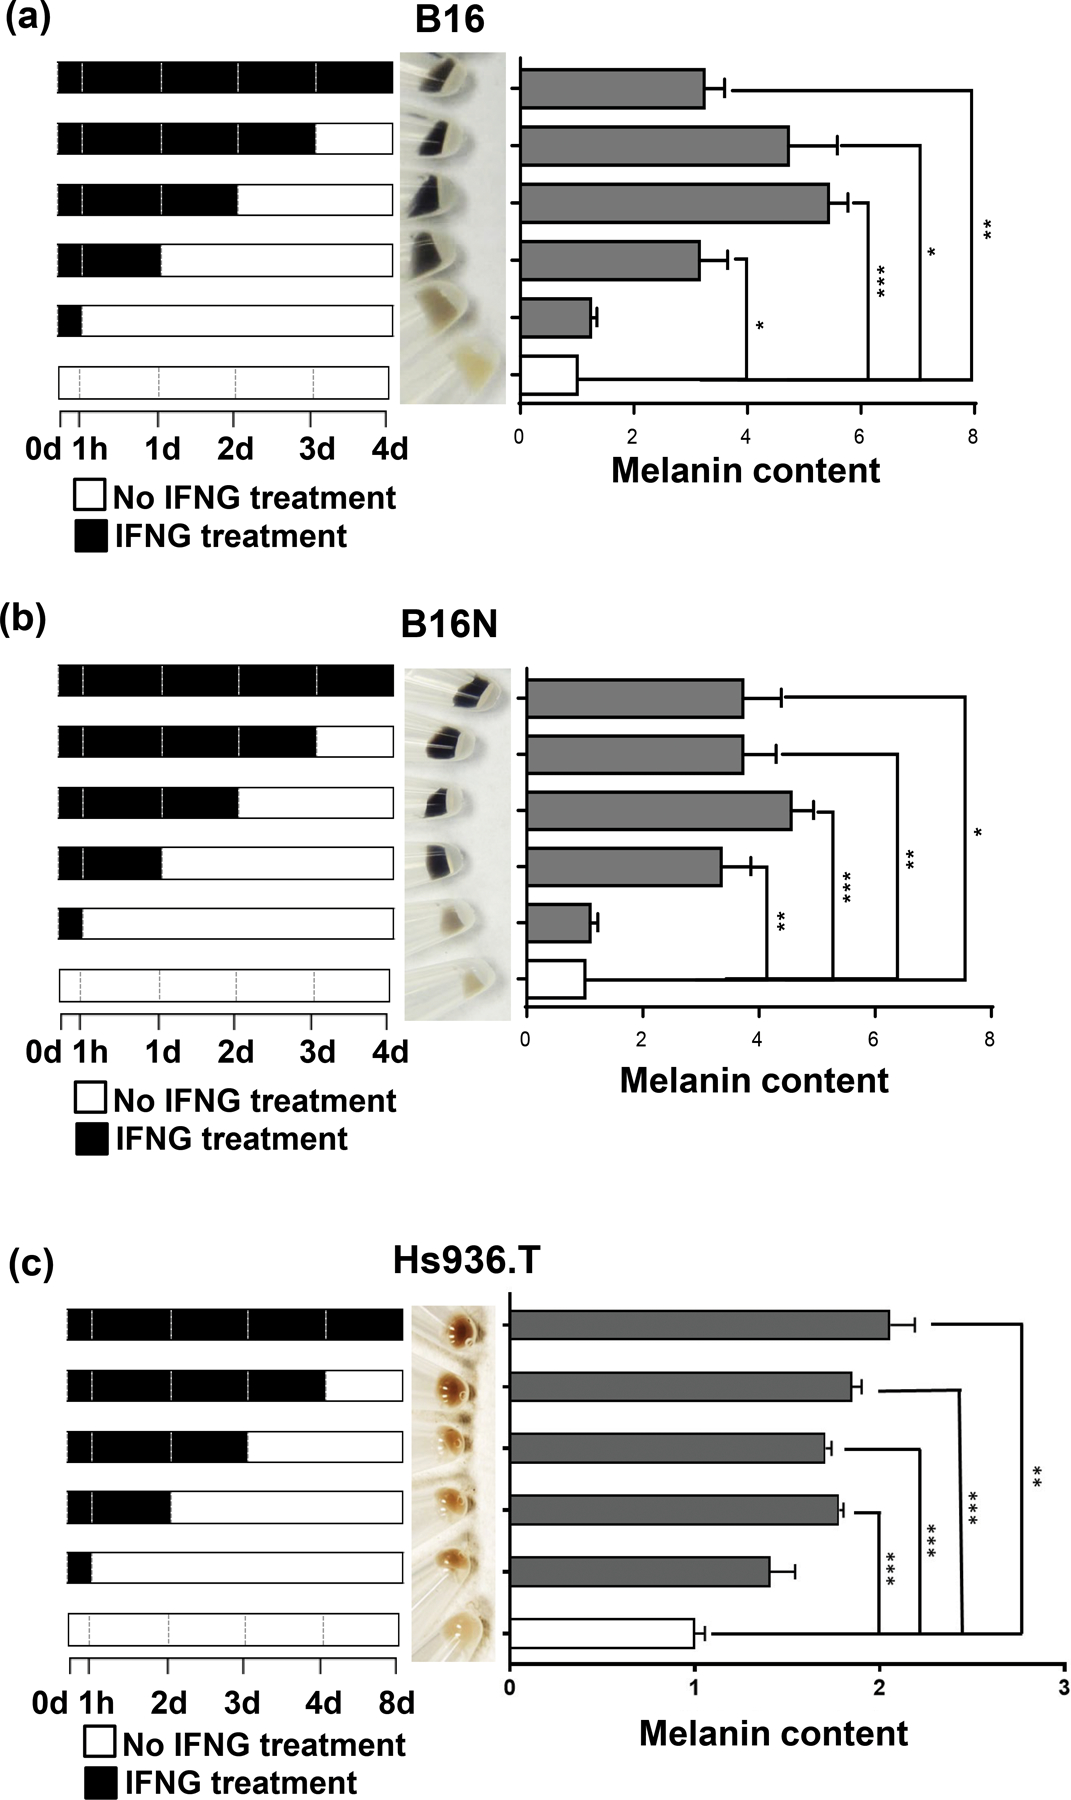
Temporal effects of IFNG treatment on melanogenesis. Each panel shows a schematic of IFNG treatment schedule (left panels). (a) and (b) B16 and B16N mouse melanoma cells were collected after 4 d of culture in the presence or absence of 10 ng/ml IFNG for indicated time periods. Images of cell pellets collected after 4 d of treatment (middle panels) and melanin content quantification (right panels) in B16 and B16N cells are shown. (c) Hs936.T human melanoma cells were collected after 8 d of culture in the presence or absence of 10 ng/ml IFNG for indicated time periods. Images of cell pellets collected after 8 d of treatment (middle panel) and melanin content quantification (right panel) are shown. All the graphed data are presented as mean ± SEM of three biological replicate experiments, relative to the Ctrl group of each indicated time period. *P<0.05; **P<0.01; ***P<0.001.
In order to test whether the IFNG-mediated melanogenesis seen in mouse and human melanoma cells can be replicated in primary melanocytes, we treated commercially available mildly pigmented neonatal human epidermal melanocytes (HEMn-MP) with IFNG. Indeed, statistically significant elevation in melanogenesis was observed after 6 d of IFNG treatment that was readily visible under light microscopic analysis (Figure 3a) as well as with melanin content assay (Figure 3b). αMSH treatment also induced robust melanogenesis, which was greater than that with IFNG treatment, in congruence with B16 and B16N mouse melanoma cells, but in contrast to Hs936.T human melanoma cells (Figure 3a, b).
Figure 3.
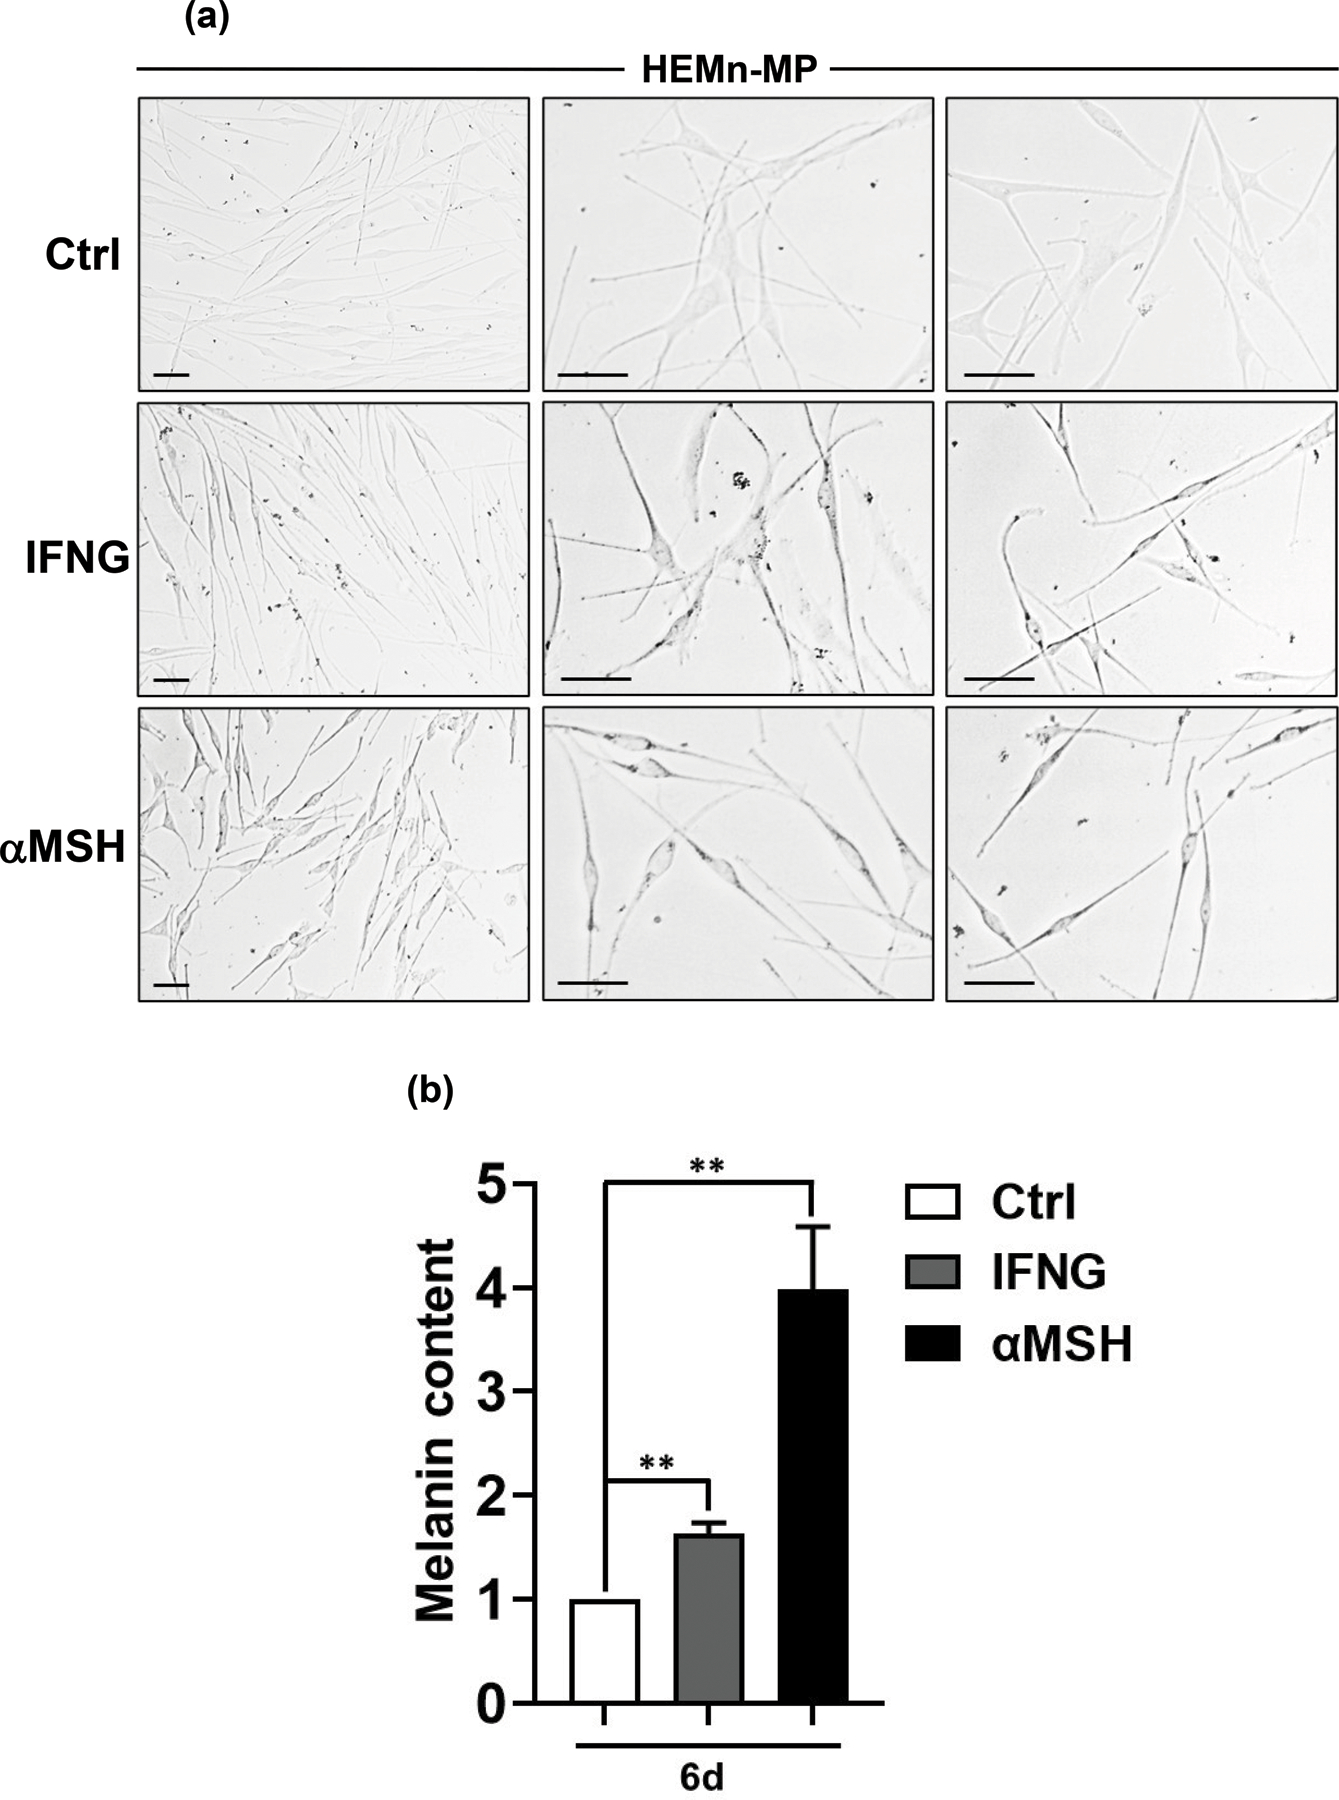
IFNG induces melanogenesis in human primary melanocytes. HEMn-MP human neonatal epidermal melanocytes (mildly pigmented) were treated with 10 ng/ml human recombinant IFNG or 100 nM αMSH. (a) Representative light microscopy images are shown from three biological replicates each. The left column shows low magnification, while the middle and right columns include higher magnification photomicrographs. (b) Melanin content assay was performed on the three groups. The graphed data are plotted as mean ± SEM of three biological replicate experiments, relative to the Ctrl group at 6 d post-treatment. **P<0.01.
3.2. JAK-STAT1 mediate IFNG-induced melanogenesis
The JAK-STAT cascade is the major mediator of IFNG signaling to perform its downstream biological effects. However, upon IFNG binding to its receptors, several other pathways, such as MAP kinase and PI3K pathways, are activated independently in addition to the canonical JAK-STAT axis to maximize the biological functions of IFNG (Gough et al., 2008). To test the requirement of the JAK1/2 route for IFNG-induced melanin synthesis, we pretreated the cells with the potent JAK1/2 inhibitor ruxolitinib. Ruxolitinib (5 μM) pre-treatment completely abolished IFNG-induced melanogenesis in B16N cells (Figure 4a). In contrast, ruxolitinib treatment did not affect the basal melanin content or αMSH-induced melanogenesis (Figure 4a). Interestingly, we observed a significant synergistic effect of IFNG and αMSH in enhancing melanogenesis (Figure 4a).
Figure 4.
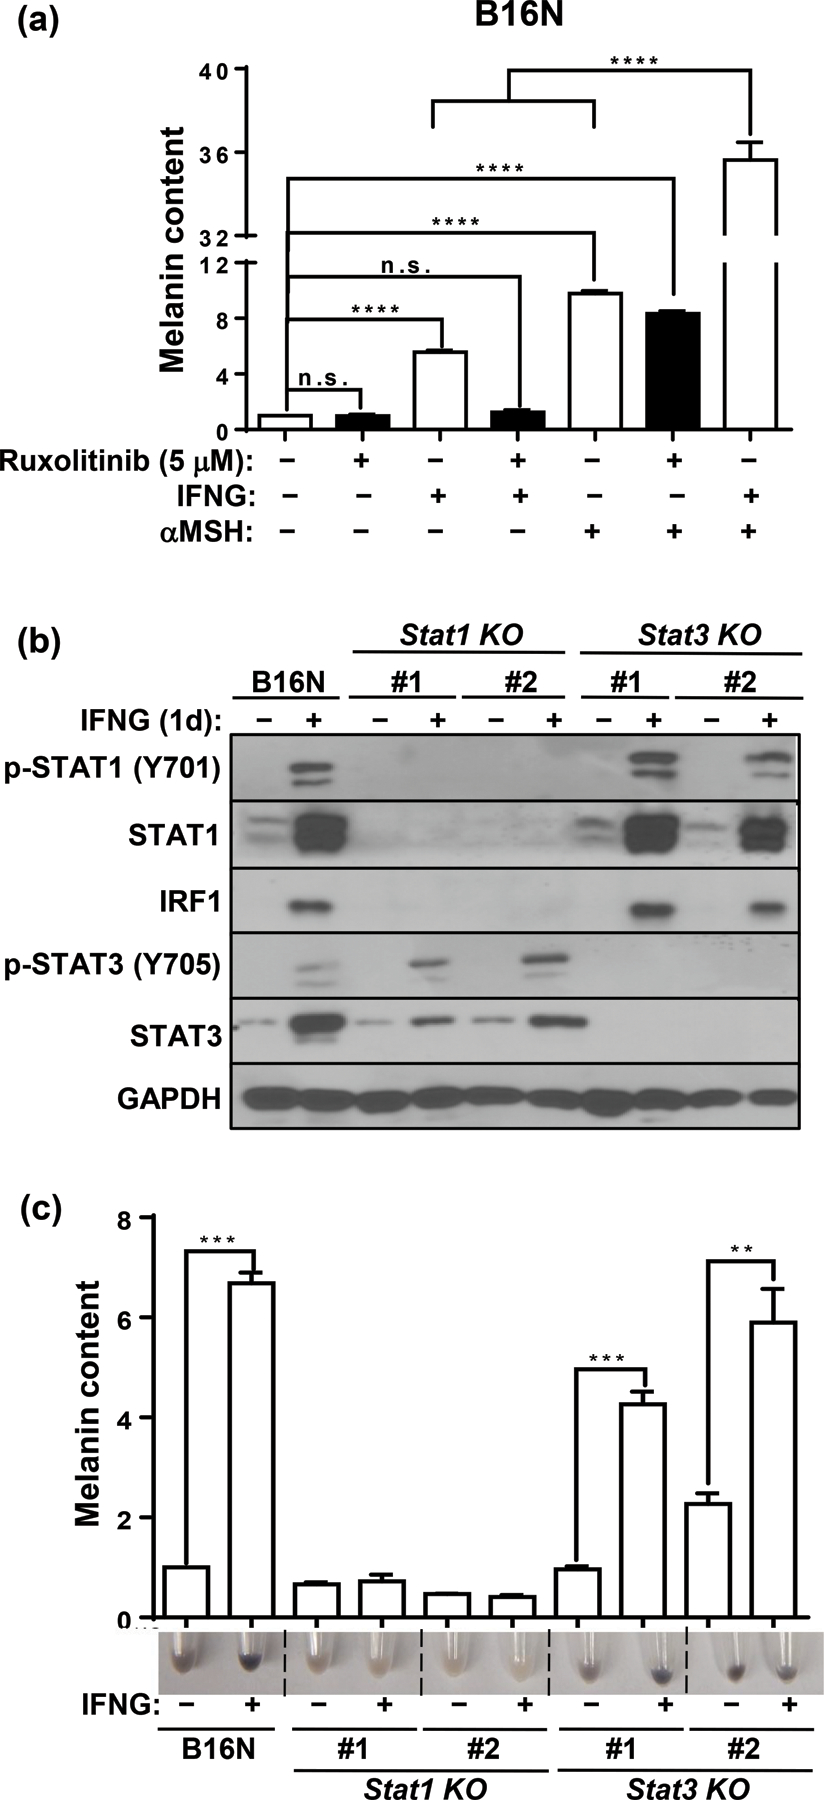
JAK1/2-STAT1 mediates IFNG-induced melanogenesis. (a) Melanin content quantification in B16N cells cultured with indicated cytokine or hormone in the presence or absence of JAK1/2 inhibitor drug ruxolitinib (5 μM). B16N cells were pretreated with ruxolitinib for 1 h followed by treatment with or without indicated cytokine or hormone for 2 d and collected at 4 d. (b) Western blot of p-STAT1 (Y701), STAT1, IRF1, p-STAT3 (Y705), STAT3, and GAPDH expressions in parental B16N cells and STAT-KO clones in response to IFNG treatment. (c) Image of pellets and melanin content quantification of B16N and STAT-KO clones collected after 4 d of treatment with or without IFNG. Immunoblotting images are representative of three independent experiments in (b). Data are presented as mean ± SEM of three biological replicates in (a) and (c). **P<0.01; ***P<0.001; ****P<0.0001; n.s. not significant.
STAT1 is the predominant downstream transcription factor that mediates IFNG signaling. Accumulating evidence suggests that STAT3 is also activated directly upon IFNG treatment (Qing and Stark, 2004; Zaidi and Merlino, 2011) and its activity is important in maintaining melanogenesis in B16 cells (Yang et al., 2010). Indeed, We observed that both p-STAT1 (Y701) and p-STAT3 (Y705) were activated in response to IFNG treatment (Figure 4b). To evaluate which transcription factor mediates the IFNG-induced melanogenesis, we generated individual STAT1- or STAT3-knockout (KO) clones of B16N cells by CRISPR-Cas9 gene editing. The upregulation of the transcription factor IRF1 upon IFNG treatment was completely blocked in the STAT1-KO clones, while its activation in STAT3-KO clones remained intact (Figure 4b). Interestingly, IFNG treatment increased STAT3 protein level, which was partially inhibited by loss of STAT1, which suggests that the upregulation of STAT3 is at least partially dependent on STAT1 (Figure 4b). In contrast, activation of pSTAT1 by IFNG was unaffected in STAT3-KO cells (Figure 4b). Melanin content assay showed that IFNG failed to increase melanin synthesis in STAT1-KO clones but not in STAT3-KO clones (Figure 4c). These data provide evidence that IFNG-induced melanogenesis is mediated by the JAK1/2-STAT1 signaling axis.
3.3. Effects of IFNG on melanogenesis-associated gene expression
The MITF-M isoform of MITF is exclusively expressed in the melanocyte compartment and acts as a master regulator of melanogenesis (Wang et al., 2010). In contrast to the rapid upregulation of Mitf-M mRNA by αMSH as expected, IFNG and IFNA2 decreased the mRNA of Mitf-M after 2 h treatment of B16N cells (Figure 5a). MITF is known to regulate the transcription of melanogenic enzymes including tyrosinase (Tyr), tyrosinase-related protein 1 (Tyrp1), and dopachrome tautomerase (Dct) genes (Kawakami and Fisher, 2017; Sturm, 2006). However, despite the increasing MITF expression after treatment with IFNG for 1 d, the mRNA expression levels of Tyr, Tyrp1, and Dct were not upregulated by either short or prolonged treatment with IFNG (Figure 5b, c, d). Protein levels of TYR, TYRP1, and DCT were unchanged by treatment of IFNG for 1 d (Figure 5e, f), and melanin production did not increase during this time frame. However, TYR protein was significantly increased with 4 d treatment with IFNG; while the protein levels of TYRP1, DCT, and PMEL remained unaffected (Figure 5g, h). The significantly increased TYR protein level was in accordance with the increasing melanin content. We confirmed this by measuring tyrosinase activity, which is a more sensitive indicator of melanogenesis than measurement of total melanin content (Newton et al., 2007). Treatment with IFNG profoundly increased TYR activity in both B16N (Figure 6a) and HEMn-MP cells (Figure 6b). This increased TYR activity was closely correlated with the melanin content and TYR protein levels. In addition, we found that the increase in TYR protein was dependent on STAT1, as the Stat1-KO clones, but not Stat3-KO clones, failed to show increased TYR protein in response to IFNG treatment (Figure 6c). IFNA2 had no effect on the expression of melanogenesis-associated gene expression, including TYR activity (Figure 5a-h and Figure 6a). These data suggest that IFNG/STAT1-induced melanogenesis is not dependent on the upregulation of MITF or mRNA level of Tyr; rather, it is dependent on the increase in the TYR protein abundance.
Figure 5.
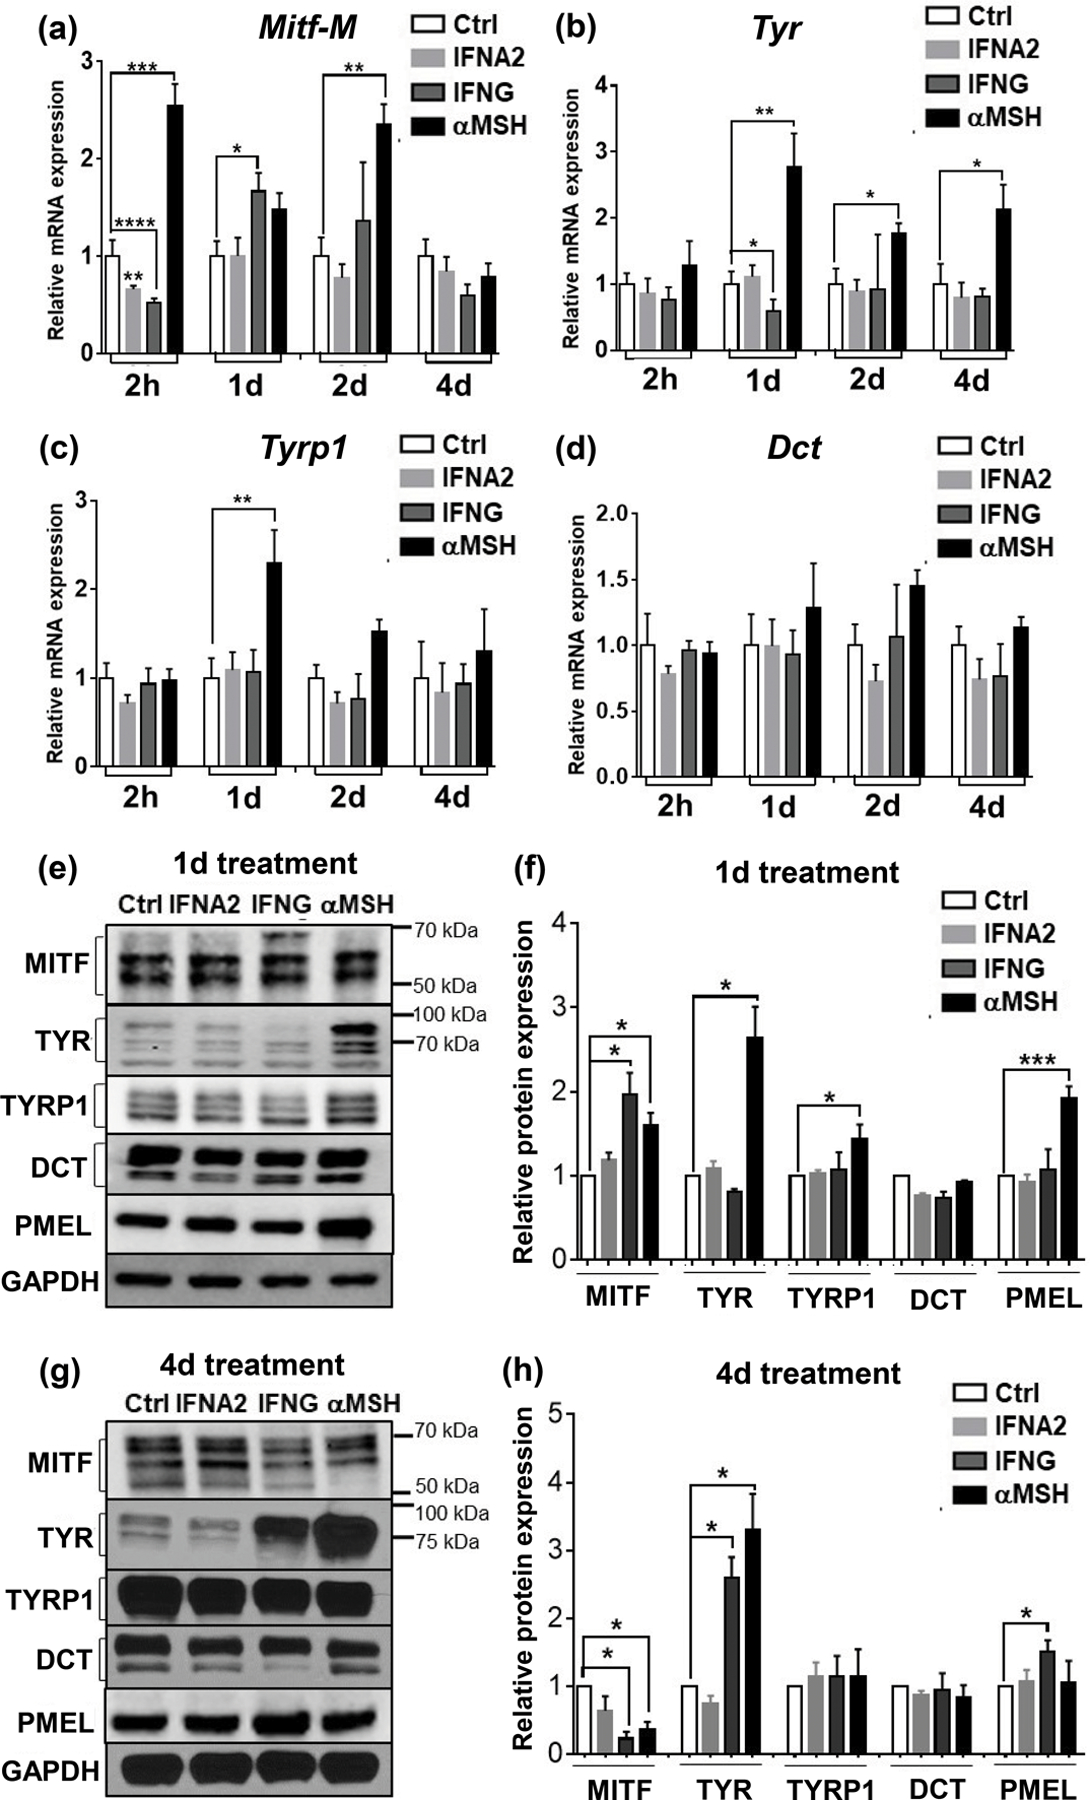
Effects of cytokines and αMSH on the expression of melanogenesis-related genes. qRT-PCR analysis of mRNA expression of Mitf-M (a), Tyr (b), Tyrp1(c), and Dct (d) in B16N cells upon cytokine treatments for the indicated time periods. Bar graphs are presented as mean ± SEM of three biological replicates. (e) Western blot of MITF, TYR, TYRP1, DCT, and PMEL in B16N cells upon indicated treatment for 1 d (e) and 4 d (g). (f) and (h) Quantification of protein abundances of western blot. GAPDH was used as a loading control. The ratio of target protein/GAPDH is relative to the Ctrl group. Data are presented as mean ± SEM of 3–5 independent experiments. *P<0.05; **P<0.01; ***P<0.001; ****P<0.0001.
Figure 6.
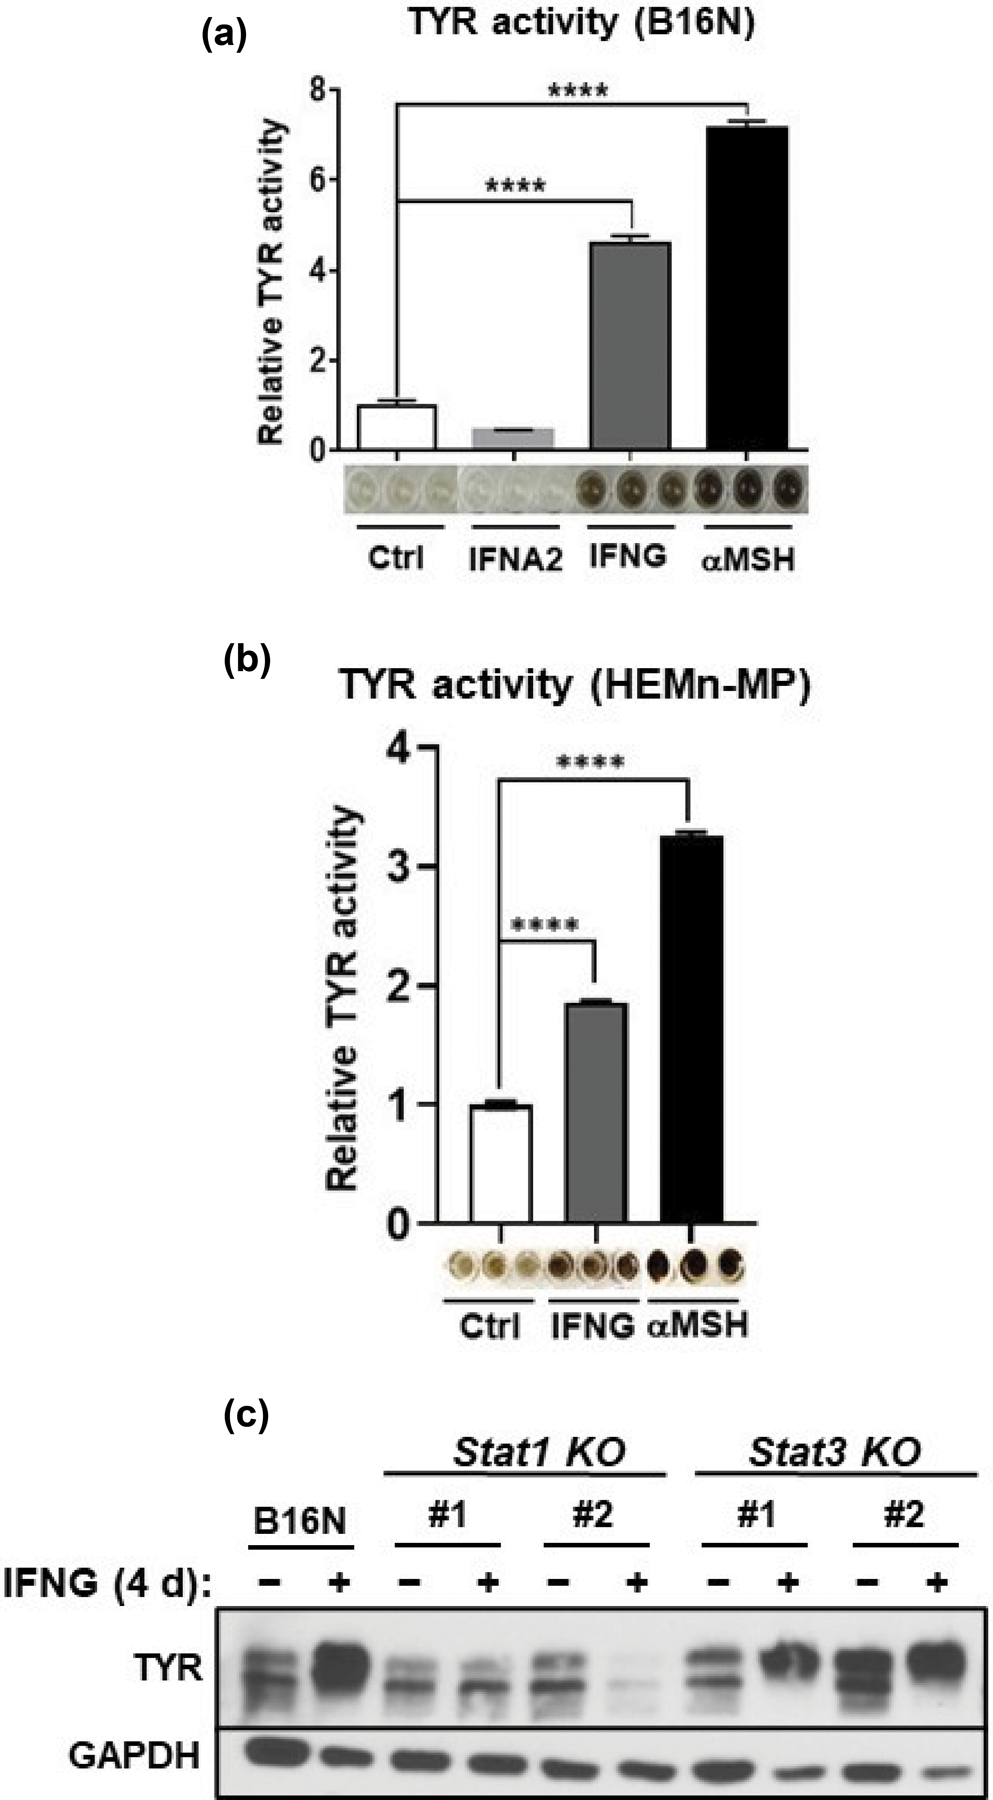
IFNG promotes the TYR activity and protein abundance in a STAT1-dependent manner. (a), (b) TYR activity in mouse B16N and human primary melanocyte (HEMn-MP) cells treated with the indicated cytokines and hormone. The plots are presented as mean ± SEM of three biological replicates, relative to the Ctrl group. Images of the TYR activity by a colorimetric assay are given below the plots. (c) Western blot of TYR expression in B16N cells and their Stat1-KO and Stat3-KO counterpart cells treated with or without IFNG for 4 d. The western blot is representative of three independent experiments.
3.4. IFNG promotes tyrosinase protein stability
Western blotting for TYR showed that IFNG treatment for 4 d led to a significant increase in the abundance of mature TYR that appeared mostly as a ~75–80 KDa band (Figure 7a, lanes 1–3). We utilized glycosidase digestion to evaluate the post-translational modification of TYR following cytokine treatments. Endoglycosidase H (Endo H) cleaves early, less processed mannose added to TYR in the ER (Endo H-sensitive), but not from the mature TYR that exits the trans Golgi network (Endo H-resistant) (Ando et al., 2006). Another enzyme used for glycosidase digestion; N-Glycosidase F (PNGase F) cleaves all N-linked oligosaccharides from glycoproteins. PNGase F digestion showed that the total amount of deglycosylated TYR (~58kD) significantly increased after treatment with IFNG but not by IFNA2 (Figure 7a, lanes 7–9). The Endo H digestion revealed that the majority of TYR extracted from IFNG-treated B16N cells was the Endo H-resistant mature form (Figure 7a, ~75kD band in lane 6); whereas TYR in either untreated or IFNA2-treated B16N cells was largely Endo H-sensitive immature protein (Figure 7a, ~58kD bands in lanes 4 and 5, respectively.)
Figure 7.
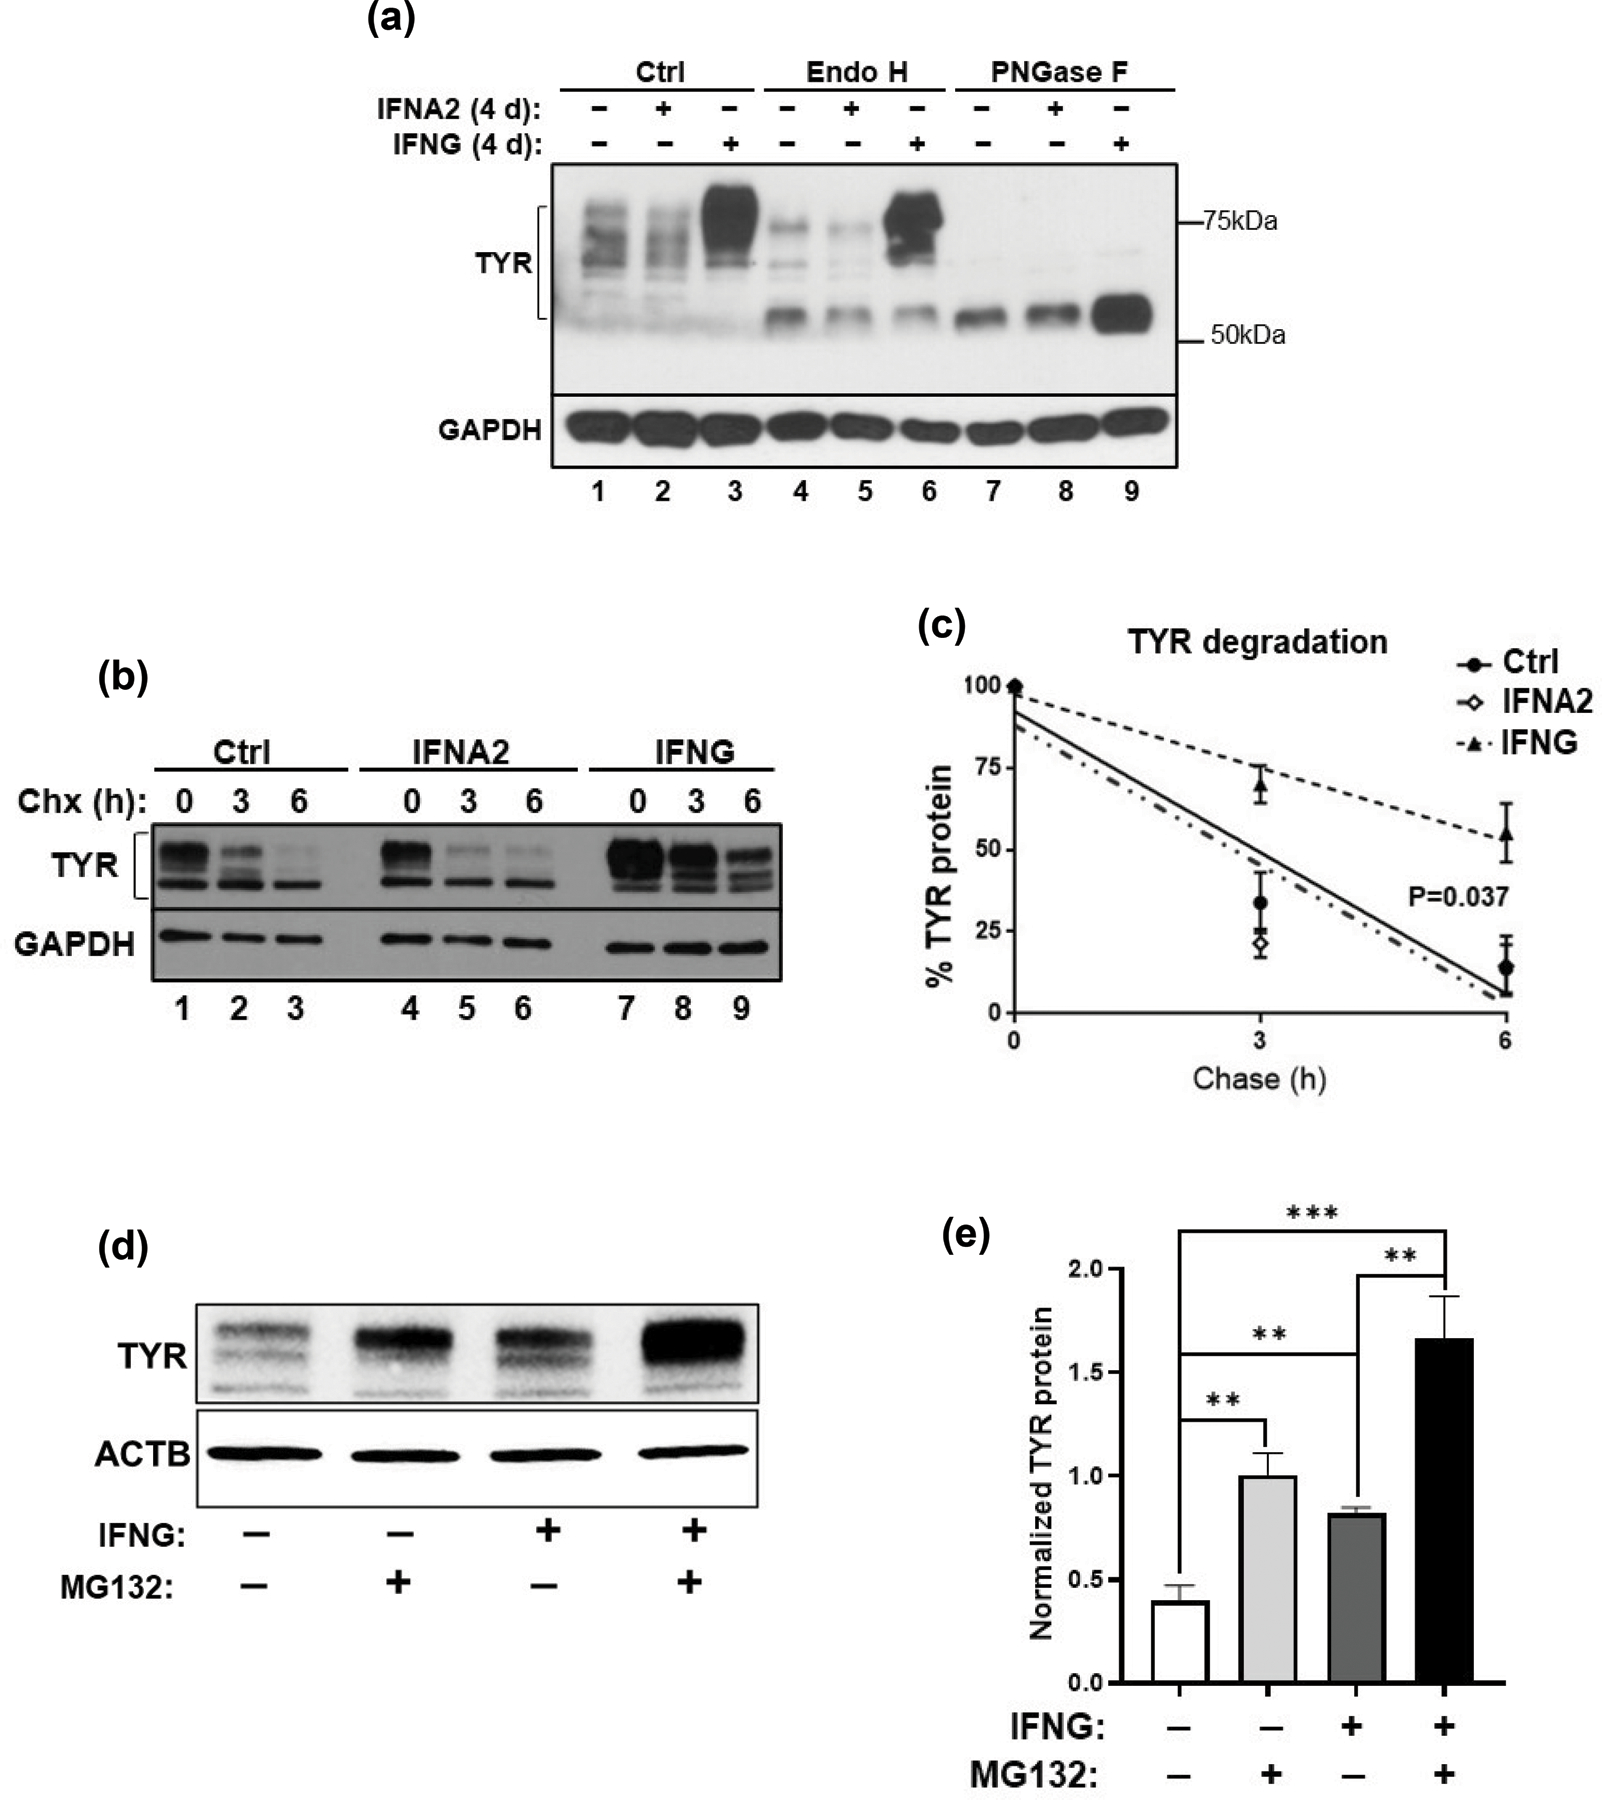
Accumulation of ER-resistant, fully mature, and more stable tyrosinase (TYR) in response to IFNG treatment. (a) Cell lysates obtained from B16N cells following 3 d of treatment with either IFNA2 or IFNG were subsequently incubated with the glycosidases, Endo H and PNGase F. Western blot of TYR to confirm the extent of digestion is shown. TYR band ranges between 58 and 80 kDa. (b) B16N cells were cultured with IFNG for 4 d, then treated with 50 uM cycloheximide (Chx) for 3 h or 6 h, followed by western blotting for TYR abundance. (c) The curve represents the mean ± SEM of three independent measurements of western blots of (b). On the Y-axis, the percentage of TYR/GAPDH is relative to Ctrl at 0 h. Linear regression and ANCOVA were performed by GraphPad Prism 6. **P<0.01; ***P<0.001. (d) B16 cells were subjected to treatment with IFNG (10 ng/ml for 4 d) and proteasome inhibitor MG132 (10µM for 3 h), alone or in combination as indicated. Cells were collected and western blotting was performed. The blot is representative of 4 independent experiments. (e) Densitometric quantification of (d) is plotted. Quantification was done by Image J, normalized with beta-actin. **P<0.01; ***P<0.001.
To investigate whether IFNG-mediated glycosylation promotes TYR protein stability and an increased half-life, we performed cycloheximide (Chx) pulse-chase assay. The results showed that the half-life of TYR in untreated cells was approximately 3 h (Figure 7b, lanes 1–3 and Figure 7c), as reported earlier (Ando et al., 2004; Halaban et al., 1997); but interestingly, the half-life of TYR was significantly prolonged in IFNG-treated cells (Figure 7b, lanes 7–9, and Figure 7c). In contrast, IFNA2 did not alter the degradation rate of TYR (Figure 7b, lanes 4–6, and Figure 7c). Intriguingly, there was a reduced amount of ER-sensitive TYR in IFNG-treated B16N cells, suggesting that it did not increase de novo synthesis or early processing of TYR in the endoplasmic reticulum, which was consistent with the mRNA expression of Tyr. Therefore, our findings suggest that IFNG leads to the accumulation of the mature glycosylated form of TYR with a prolonged half-life, which results in increased melanin synthesis. To test whether the IFNG-induced prolonged half-life of TYR was due to the protection from proteasome-mediated degradation, we treated B16 cells with the proteasome inhibitor drug MG132 (Bellei et al., 2010). Indeed, the results confirmed not only that MG132 prevented TYR degradation, but also that MG132 synergized with IFNG to further enhance the protection of TYR from proteasome-mediated degradation, which led to its increased cellular accumulation (Figure 7d, e).
4. Discussion
Two previous studies had shown that IFNG inhibited melanogenesis leading to hypopigmentation in melanocytes and B16 melanoma cells (Natarajan et al., 2014; Son et al., 2014). Natarajan et al. showed that IFNG signaling caused hypopigmentation in human primary melanocytes by arresting melanosome maturation. This effect was accompanied by reduced expression of the melanogenic genes TYR, DCT, and TRP1, but was interpreted to be independent of MITF (Natarajan et al., 2014). In contrast, Son et al. reported that IFNG inhibited melanogenesis by suppressing the expression of MITF, which led to reduced activation of the Tyr gene promoter in B16 cells (Son et al., 2014). We have failed to reproduce the results of both Natarajan et al. and Son et al. In contrast, we have identified an entirely new regulatory mechanism of IFNG-mediated enhancement of melanogenesis that is independent of MITF and is based on the post-translational modification and stability of TYR protein. These opposing results can only be explained in terms of the extremely intricate genetic control of melanogenesis that would be manifest in the remarkable heterogeneity of the pigmentary phenotype observed in the human primary melanocytes obtained from different individuals, and disparate human and mouse melanoma cells. Nevertheless, it seems plausible that IFNG is capable of suppressing as well as enhancing melanogenesis in the melanocytic compartment in a genetic and/or cellular context-dependent manner. Elucidation of these differing contexts will require further research.
Natarajan et al. also showed that Ifng−/− mice in the C57BL/6 strain background exhibit a hyperpigmented tail phenotype and that pigmentation is further enhanced by exposure to UVB radiation (Natarajan et al., 2014). We have not observed this phenotype in Ifng−/− mice as compared to wildtype littermates. Notably, transgenic mice in which the AU-rich element (ARE) in the 3’UTR of the Ifng gene is deleted (Ifng-ARE-Del), with the homozygous ARE-Del−/− mice exhibiting chronic production of circulatory IFNG, exhibit visibly elevated skin pigmentation (Bae et al., 2016; Hodge et al., 2014), which supports a melanogenesis-inducing effect of IFNG signaling in melanocytes.
Numerous studies have shown the role of MITF in initiating and maintaining the transcription of TYR, TYRP1, and DCT in melanocytes and melanoma cells (Figure 8). Unexpectedly, IFNG did not increase the mRNA expression of Tyr, Tyrp1, and Dct genes despite an increase in MITF expression. In contrast, upregulation of MITF by αMSH elevated mRNA expression of Tyr and Tyrp1. One possible explanation for these results is that IFNG induces factors that cooperate with MITF to negatively regulate the transcription of Tyr and Tyrp1 genes. It has been reported that MITF-induced transcription of Tyr, Tyrp1, and Dct genes is dependent on other transcriptional factors, such as Sox10 (D’Mello et al., 2016; Jager et al., 2006; Potterf et al., 2001). We observed a decrease in the expression of Sox10 gene by IFNG treatment, which might explain why mRNA expression of Tyr was unresponsive to the upregulation of MITF. The enhanced stability and consequent accumulation of post-translationally modified TYR protein can readily explain the lag in the induction of melanin biosynthesis in response to IFNG as compared to αMSH treatment. Newton et al. have also reported that the elevation of MITF expression by forskolin induces TYR protein expression, but not its mRNA expression (Bae et al., 2016; Newton et al., 2007). Based on our results, we present a model in which the regulation of melanogenesis is controlled at the transcriptional as well as post-translational level. While the transcriptional control of melanogenesis via the SCF, WNT, and αMSH-mediated pathways is well-studied, here we have identified the IFNG pathway as a novel post-translational regulator of melanogenesis, specifically by modulating the activation and stability of TYR (Figure 8). A detailed understanding of the downstream target genes of the IFNG signaling that are involved in this regulation will require further research.
Figure 8.
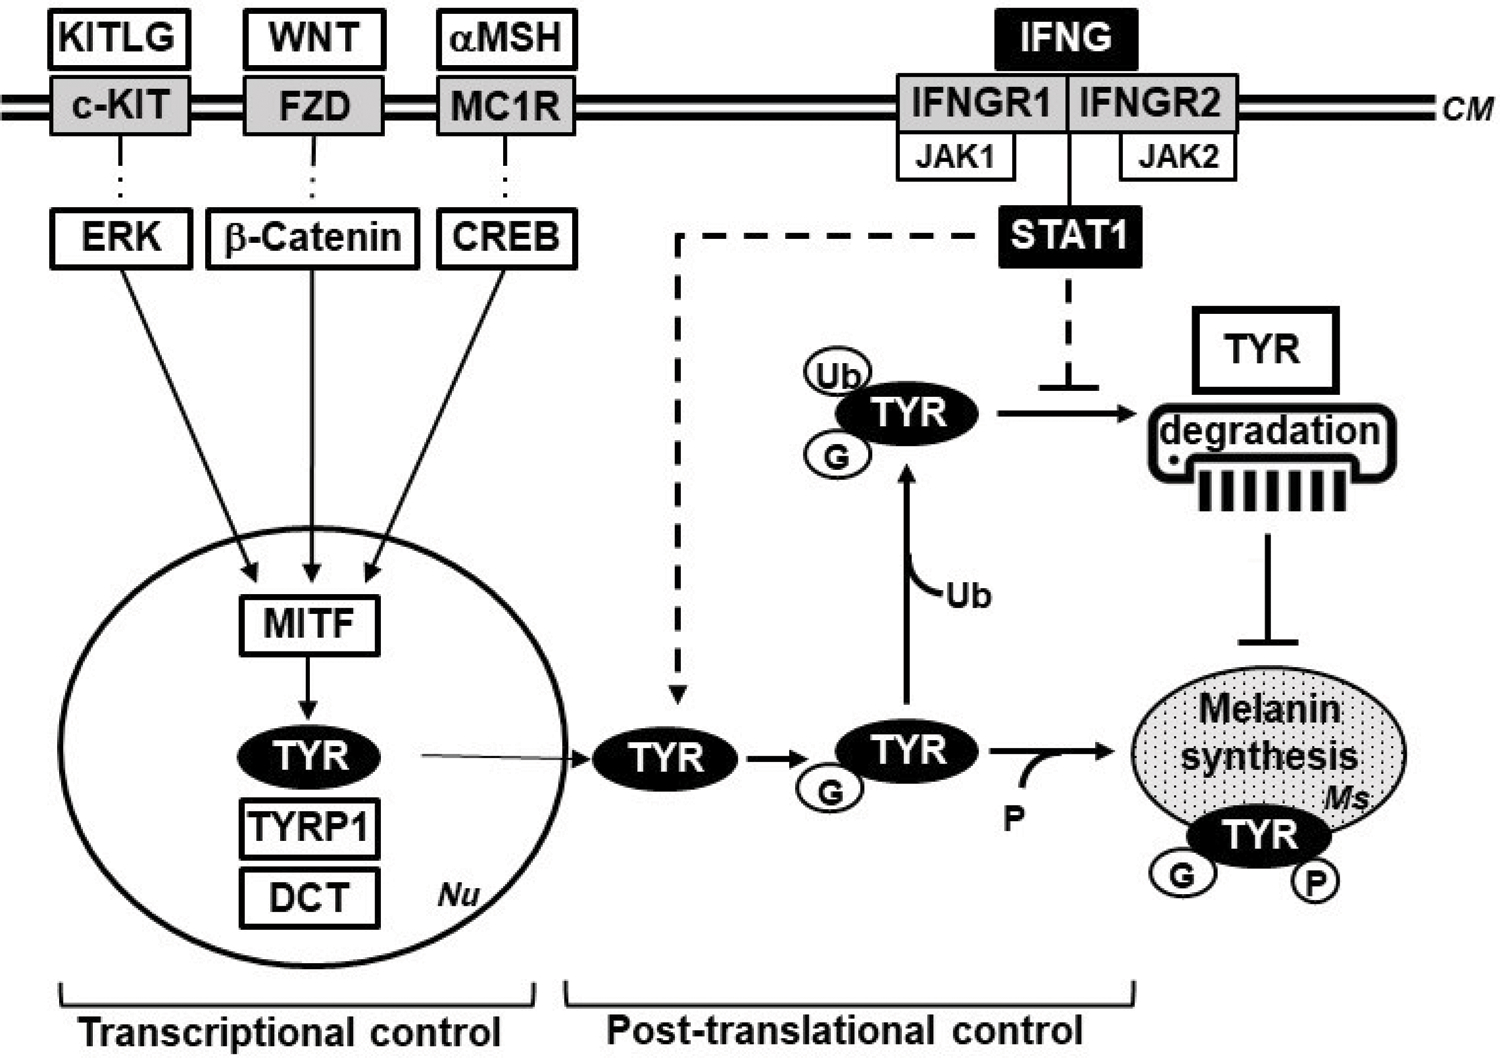
A model of the transcriptional and post-translational control of melanogenesis in melanocytes. The transcriptional control of melanogenesis is known to be mainly mediated through the αMSH, WNT, and KITLG pathways. This study has identified IFNG-JAK-STAT1 pathway as a novel regulator of the post-translational control. The depiction of the signaling pathways has been simplified for clarity. KITLG, KIT ligand (SCF); KIT, Kit receptor tyrosine kinase; WNT, Wingless-type MMTV integration site family; FZD, Frizzled receptor; αMSH, alpha melanocyte stimulating hormone; MC1R, melanocortin receptor; ERK, Extracellular signal-regulated kinase; CREB, CAMP responsive element binding protein; MITF, melanocyte inducing transcription factor; TYR, Tyrosinase; TYRP1, Tyrosinase related protein 1; DCT, Dopachrome tautomerase; IFNG, interferon-gamma; IFNGR, Interferon-gamma receptor; JAK, Janus kinase; STAT1, Signal transducer and activator of transcription 1. Nu, nucleus; PM, plasma membrane; Ms, melanosome; Ub, ubiquitin; G, N-linked glycosylation; P, phosphorylation.
Interestingly, Yang et al. have proposed that the constitutive activation of STAT3 in B16 cells was important for TYR expression (Yang et al., 2010). They mutated the phosphorylation site of STAT3 at Y705, which resulted in the loss of its transcriptional activity. The overexpression of mutated dominant-negative STAT3 (STAT3-DN) in B16 cells decreased TYR expression, which led to the inhibition of melanogenesis (Yang et al., 2010). However, we have not observed a reduction in TYR expression and melanogenesis in Stat3-KO clones. Additionally, we have shown that IFNG-induced hyperpigmentation was mediated by the STAT1, but not the STAT3, signaling axis. These results suggest that the depigmentation effect mediated by STAT3-DN is not due to the disruption of the transcriptional function of STAT3. Further research is needed to elucidate the exact mechanism.
IFNG has long been known as the principal proinflammatory cytokine that plays the role of the central orchestrator of inflammation and autoimmune disease (Schroder et al., 2004). IFNG is predominantly produced by the NK, NKT, and macrophages of the innate immune system, as well as the CD4+ Th1 and CD8+ cytotoxic T lymphocytes of the adaptive immune system (Schroder et al., 2004; Zaidi, 2019; Zaidi and Merlino, 2011). IFNG is directly involved in almost all types of skin inflammatory conditions, e.g. those caused by pathogenic infections, tissue injury, tissue stress, and/or malfunction (Dries and Perry, 2002; Xiao et al., 2009). One of the most prevalent skin conditions is post-inflammatory hyperpigmentation (PIH), which is characterized by a localized increase in melanogenesis by melanocytes (hypermelanosis) following numerous skin inflammatory conditions. Some of the most common inflammatory conditions that cause PIH are acne, atopic dermatitis, allergic contact dermatitis, and several types of dermatological procedures (Kaufman et al., 2018). Wound healing following skin abrasions, cuts, and burns also frequently lead to PIH. Exposure to the ultraviolet radiation (UVR) from the sun further exacerbates PIH (Ruiz-Maldonado and Orozco-Covarrubias, 1997). Overall, PIH is one of the most common skin disorders and affects hundreds of millions of people worldwide (Park et al., 2016). At the histopathological level, PIH features elevated deposition of melanin in either the epidermis or the dermis. Both patterns are due to increased melanogenic activity without an increase in the number of melanocytes (Park et al., 2017). The molecular mechanisms of the induction of PIH remain poorly understood. In light of our results presented here, it is plausible to speculate that inflammation-associated release of IFNG in the skin microenvironment is capable of inducing melanogenesis in the inflamed skin, leading to PIH. Elucidating this potential causal connection is an enticing future prospective investigative avenue.
SIGNIFICANCE.
The core pathway that transcriptionally controls melanogenesis in melanocytes is regulated by the alpha melanocyte stimulating hormone (αMSH) via its activation of the expression of the melanocyte master regulator MITF and its downstream target genes involved in the melanogenic process, including the principal melanogenic enzyme tyrosinase (TYR). Here we report a novel melanogenic pathway that is mediated via the interferon-gamma (IFNG) cytokine signaling. We show that the IFNG pathway functions independently of MITF-mediated gene expression by regulating the post-translational activation and stability of TYR.
Acknowledgments
Funding information: National Cancer Institute, National Institutes of Health, Grant Number: R01CA193711
Footnotes
Conflicts of Interest: The authors have no conflicts of interest.
REFERENCES
- Ando H, Watabe H, Valencia JC, Yasumoto K, Furumura M, Funasaka Y, Oka M, Ichihashi M, and Hearing VJ (2004). Fatty acids regulate pigmentation via proteasomal degradation of tyrosinase: a new aspect of ubiquitin-proteasome function. J Biol Chem 279, 15427–33. [DOI] [PubMed] [Google Scholar]
- Ando H, Wen ZM, Kim HY, Valencia JC, Costin GE, Watabe H, Yasumoto K, Niki Y, Kondoh H, Ichihashi M, et al. (2006). Intracellular composition of fatty acid affects the processing and function of tyrosinase through the ubiquitin-proteasome pathway. Biochem J 394, 43–50. [DOI] [PMC free article] [PubMed] [Google Scholar]
- Avalle L, Pensa S, Regis G, Novelli F, and Poli V (2012). STAT1 and STAT3 in tumorigenesis: A matter of balance. JAKSTAT 1, 65–72. [DOI] [PMC free article] [PubMed] [Google Scholar]
- Bae HR, Leung PS, Tsuneyama K, Valencia JC, Hodge DL, Kim S, Back T, Karwan M, Merchant AS, Baba N, et al. (2016). Chronic expression of interferon-gamma leads to murine autoimmune cholangitis with a female predominance. Hepatology 64, 1189–201. [DOI] [PMC free article] [PubMed] [Google Scholar]
- Bellei B, Maresca V, Flori E, Pitisci A, Larue L, and Picardo M (2010). p38 regulates pigmentation via proteasomal degradation of tyrosinase. J Biol Chem 285, 7288–99. [DOI] [PMC free article] [PubMed] [Google Scholar]
- Branza-Nichita N, Negroiu G, Petrescu AJ, Garman EF, Platt FM, Wormald MR, Dwek RA, and Petrescu SM (2000). Mutations at critical N-glycosylation sites reduce tyrosinase activity by altering folding and quality control. J Biol Chem 275, 8169–75. [DOI] [PubMed] [Google Scholar]
- Chang TS (2009). An updated review of tyrosinase inhibitors. Int J Mol Sci 10, 2440–75. [DOI] [PMC free article] [PubMed] [Google Scholar]
- Choi H, Choi H, Han J, Jin SH, Park JY, Shin DW, Lee TR, Kim K, Lee AY, and Noh M (2013). IL-4 inhibits the melanogenesis of normal human melanocytes through the JAK2-STAT6 signaling pathway. J Invest Dermatol 133, 528–36. [DOI] [PubMed] [Google Scholar]
- D’mello SA, Finlay GJ, Baguley BC, and Askarian-Amiri ME (2016). Signaling Pathways in Melanogenesis. Int J Mol Sci 17. [DOI] [PMC free article] [PubMed] [Google Scholar]
- Dries DJ, and Perry JF Jr. (2002). Interferon-gamma: titration of inflammation. Crit Care Med 30, 1663–4. [DOI] [PubMed] [Google Scholar]
- Fujiwara N, and Kobayashi K (2005). Macrophages in inflammation. Curr Drug Targets Inflamm Allergy 4, 281–6. [DOI] [PubMed] [Google Scholar]
- Gough DJ, Levy DE, Johnstone RW, and Clarke CJ (2008). IFNgamma signaling-does it mean JAK-STAT? Cytokine Growth Factor Rev 19, 383–94. [DOI] [PubMed] [Google Scholar]
- Halaban R, Cheng E, Zhang Y, Moellmann G, Hanlon D, Michalak M, Setaluri V, and Hebert DN (1997). Aberrant retention of tyrosinase in the endoplasmic reticulum mediates accelerated degradation of the enzyme and contributes to the dedifferentiated phenotype of amelanotic melanoma cells. Proc Natl Acad Sci U S A 94, 6210–5. [DOI] [PMC free article] [PubMed] [Google Scholar]
- Hearing VJ, Vieira WD, and Law LW (1985). Malignant melanoma: cross-reacting (common) tumor rejection antigens. Int J Cancer 35, 403–9. [DOI] [PubMed] [Google Scholar]
- Hodge DL, Berthet C, Coppola V, Kastenmuller W, Buschman MD, Schaughency PM, Shirota H, Scarzello AJ, Subleski JJ, Anver MR, et al. (2014). IFN-gamma AU-rich element removal promotes chronic IFN-gamma expression and autoimmunity in mice. J Autoimmun 53, 33–45. [DOI] [PMC free article] [PubMed] [Google Scholar]
- Jager M, Queinnec E, Houliston E, and Manuel M (2006). Expansion of the SOX gene family predated the emergence of the Bilateria. Mol Phylogenet Evol 39, 468–77. [DOI] [PubMed] [Google Scholar]
- Jagirdar K, Smit DJ, Ainger SA, Lee KJ, Brown DL, Chapman B, Zhen Zhao Z, Montgomery GW, Martin NG, Stow JL, et al. (2014). Molecular analysis of common polymorphisms within the human Tyrosinase locus and genetic association with pigmentation traits. Pigment Cell Melanoma Res 27, 552–64. [DOI] [PMC free article] [PubMed] [Google Scholar]
- Jimenez M, Kameyama K, Maloy WL, Tomita Y, and Hearing VJ (1988). Mammalian tyrosinase: biosynthesis, processing, and modulation by melanocyte-stimulating hormone. Proc Natl Acad Sci U S A 85, 3830–4. [DOI] [PMC free article] [PubMed] [Google Scholar]
- Kaufman BP, Aman T, and Alexis AF (2018). Postinflammatory Hyperpigmentation: Epidemiology, Clinical Presentation, Pathogenesis and Treatment. Am J Clin Dermatol 19, 489–503. [DOI] [PubMed] [Google Scholar]
- Kawakami A, and Fisher DE (2017). The master role of microphthalmia-associated transcription factor in melanocyte and melanoma biology. Lab Invest 97, 649–656. [DOI] [PubMed] [Google Scholar]
- Mo X, Preston S, and Zaidi MR (2019). Macroenvironment-gene-microenvironment interactions in ultraviolet radiation-induced melanomagenesis. Adv Cancer Res 144, 1–54. [DOI] [PubMed] [Google Scholar]
- Natarajan VT, Ganju P, Singh A, Vijayan V, Kirty K, Yadav S, Puntambekar S, Bajaj S, Dani PP, Kar HK, et al. (2014). IFN-gamma signaling maintains skin pigmentation homeostasis through regulation of melanosome maturation. Proc Natl Acad Sci U S A 111, 2301–6. [DOI] [PMC free article] [PubMed] [Google Scholar]
- Negroiu G, Branza-Nichita N, Petrescu AJ, Dwek RA, and Petrescu SM (1999). Protein specific N-glycosylation of tyrosinase and tyrosinase-related protein-1 in B16 mouse melanoma cells. Biochem J 344 Pt 3, 659–65. [PMC free article] [PubMed] [Google Scholar]
- Newton RA, Cook AL, Roberts DW, Leonard JH, and Sturm RA (2007). Post-transcriptional regulation of melanin biosynthetic enzymes by cAMP and resveratrol in human melanocytes. J Invest Dermatol 127, 2216–27. [DOI] [PubMed] [Google Scholar]
- Nguyen NT, and Fisher DE (2019). MITF and UV responses in skin: From pigmentation to addiction. Pigment Cell Melanoma Res 32, 224–236. [DOI] [PMC free article] [PubMed] [Google Scholar]
- Park JH, Kim JI, and Kim WS (2016). Treatment of Persistent Facial Postinflammatory Hyperpigmentation With Novel Pulse-in-Pulse Mode Intense Pulsed Light. Dermatol Surg 42, 218–24. [DOI] [PubMed] [Google Scholar]
- Park JY, Park JH, Kim SJ, Kwon JE, Kang HY, Lee ES, and Kim YC (2017). Two histopathological patterns of postinflammatory hyperpigmentation: epidermal and dermal. J Cutan Pathol 44, 118–124. [DOI] [PubMed] [Google Scholar]
- Potterf SB, Mollaaghababa R, Hou L, Southard-Smith EM, Hornyak TJ, Arnheiter H, and Pavan WJ (2001). Analysis of SOX10 function in neural crest-derived melanocyte development: SOX10-dependent transcriptional control of dopachrome tautomerase. Dev Biol 237, 245–57. [DOI] [PubMed] [Google Scholar]
- Qing Y, and Stark GR (2004). Alternative activation of STAT1 and STAT3 in response to interferon-gamma. J Biol Chem 279, 41679–85. [DOI] [PubMed] [Google Scholar]
- Ran FA, Hsu PD, Wright J, Agarwala V, Scott DA, and Zhang F (2013). Genome engineering using the CRISPR-Cas9 system. Nat Protoc 8, 2281–2308. [DOI] [PMC free article] [PubMed] [Google Scholar]
- Ruiz-Maldonado R, and Orozco-Covarrubias ML (1997). Postinflammatory hypopigmentation and hyperpigmentation. Semin Cutan Med Surg 16, 36–43. [DOI] [PubMed] [Google Scholar]
- Schroder K, Hertzog PJ, Ravasi T, and Hume DA (2004). Interferon-gamma: an overview of signals, mechanisms and functions. J Leukoc Biol 75, 163–89. [DOI] [PubMed] [Google Scholar]
- Slominski A, Tobin DJ, Shibahara S, and Wortsman J (2004). Melanin pigmentation in mammalian skin and its hormonal regulation. Physiol Rev 84, 1155–228. [DOI] [PubMed] [Google Scholar]
- Son J, Kim M, Jou I, Park KC, and Kang HY (2014). IFN-gamma inhibits basal and alpha-MSH-induced melanogenesis. Pigment Cell Melanoma Res 27, 201–8. [DOI] [PubMed] [Google Scholar]
- Sturm RA (2006). A golden age of human pigmentation genetics. Trends Genet 22, 464–8. [DOI] [PubMed] [Google Scholar]
- Wang CQF, Akalu YT, Suarez-Farinas M, Gonzalez J, Mitsui H, Lowes MA, Orlow SJ, Manga P, and Krueger JG (2013). IL-17 and TNF synergistically modulate cytokine expression while suppressing melanogenesis: potential relevance to psoriasis. J Invest Dermatol 133, 2741–2752. [DOI] [PMC free article] [PubMed] [Google Scholar]
- Wang R, Tang P, Wang P, Boissy RE, and Zheng H (2006). Regulation of tyrosinase trafficking and processing by presenilins: partial loss of function by familial Alzheimer’s disease mutation. Proc Natl Acad Sci U S A 103, 353–8. [DOI] [PMC free article] [PubMed] [Google Scholar]
- Wang Y, Radfar S, Liu S, Riker AI, and Khong HT (2010). Mitf-Mdel, a novel melanocyte/melanoma-specific isoform of microphthalmia-associated transcription factor-M, as a candidate biomarker for melanoma. BMC Med 8, 14. [DOI] [PMC free article] [PubMed] [Google Scholar]
- Wenta N, Strauss H, Meyer S, and Vinkemeier U (2008). Tyrosine phosphorylation regulates the partitioning of STAT1 between different dimer conformations. Proc Natl Acad Sci U S A 105, 9238–43. [DOI] [PMC free article] [PubMed] [Google Scholar]
- Xiao M, Wang C, Zhang J, Li Z, Zhao X, and Qin Z (2009). IFNgamma promotes papilloma development by up-regulating Th17-associated inflammation. Cancer Res 69, 2010–7. [DOI] [PubMed] [Google Scholar]
- Yang CH, Fan M, Slominski AT, Yue J, and Pfeffer LM (2010). The role of constitutively activated STAT3 in B16 melanoma cells. Int J Interferon Cytokine Mediat Res 2010, 1–7. [DOI] [PMC free article] [PubMed] [Google Scholar]
- Zaidi MR (2019). The Interferon-Gamma Paradox in Cancer. J Interferon Cytokine Res 39, 30–38. [DOI] [PMC free article] [PubMed] [Google Scholar]
- Zaidi MR, and Merlino G (2011). The two faces of interferon-gamma in cancer. Clin Cancer Res 17, 6118–24. [DOI] [PMC free article] [PubMed] [Google Scholar]