Abstract
Multidrug resistance (MDR) is a huge challenge for gastric cancer chemotherapy. Therefore, MDR accurate monitoring is of great significance for the treatment of gastric cancer. GMBP1, an extracellular internalization peptide, can target MDR gastric cancer cells through specific binding to GRP78, which is an MDR-related protein that is overexpressed in gastric cancer cells. Herein, we constructed GMBP1 conjugated Mn3O4 nanoplates (Mn3O4@PEG-GMBP1 NPs) for in vivo monitoring of MDR gastric cancer through magnetic resonance imaging (MRI). The generated Mn3O4@PEG-GMBP1 NPs had a size of about 11 nm and exhibited a good colloidal stability in PBS and in 10% FBS medium. Serial in vivo MRI studies in mice demonstrated that the magnetic resonance signal intensity, at the tumor site, reached a peak at 3 h after tail vein injection of Mn3O4@PEG-GMBP1 NPs. The specific targeting ability of MDR gastric cancer cells (SGC7901/ADR) by Mn3O4@PEG-GMBP1 NPs was authenticated in vitro, in vivo and by immunofluorescence analysis experiments. The systematic safety evaluation indicated that the toxicity of Mn3O4@PEG-GMBP1 NPs in mice was negligible. Therefore, the GMBP1 conjugated Mn3O4 nanoplates can be clinically used for accurate imaging and monitoring of MDR gastric cancer.
GMBP1 conjugated manganese oxide nanoplates for in vivo monitoring multidrug resistance of gastric cancer through magnetic resonance imaging.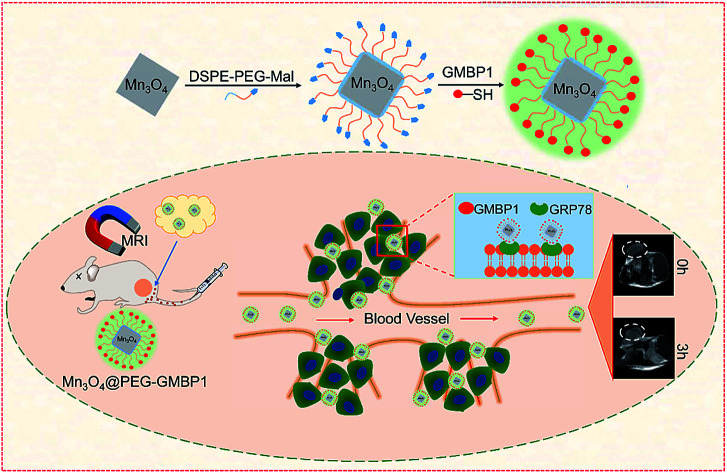
Introduction
According to the Global Cancer Statistics 2018, gastric cancer (GC) remains the third leading cause of cancer-related death worldwide.1 Although surgery is an effective treatment for GC, the associated symptoms are vague and nonspecific and usually advanced at the time of diagnosis. At this stage, chemotherapy is the main or postoperative treatment option.2,3 Unfortunately, chemotherapy often fails for most patients due to multidrug resistance (MDR).4 MDR is a distinctive drug resistance phenomenon that results in cells acquiring cross-resistance to a variety of drugs, with unrelated structure and function, and once exposed to a certain anticancer drug.5 It is reported that MDR is mainly attributed to the overexpression of MDR-associated protein 1 (MRP1) and P-glycoprotein (P-gp) in resistant cancer cells, which increase drug efflux, reduce intracellular drug concentration and lead to the weakening anticancer drugs efficacy.5,6 In addition, MDR is also associated with DNA damage repair, drug targets change, and tumor microenvironment regulation.7 However, at present, the complex mechanism of MDR has not been fully elucidated, and the clinical anti-cancer drugs, that mainly target P-gp, have little effects.8–10 Therefore, there is a pressing need to explore biomarkers that can identify MDR in GC. Kang et al. screened the short peptide GMBP1, which can specifically bind to the MDR of GC cells, and that has the greatest potential to reverse the MDR phenotype by phage display method. This group also identified GRP78 as the receptor for the peptide.11 Further research by Wang et al. revealed that both GMBP1 and GRP78 are localized in the cytoplasm, and confirmed, that the GRP78-mediated internalization of GMBP1, occurs by way of a transferrin-related pathway, that is not related to clathrin. Moreover, in GMBP1-treated MDR cell lines, the levels of eukaryotic translation initiation factor 4E (EIF4E) and C-terminal binding protein 2 (CTBP2) were significantly down-regulated.12 EIF4E is a member of the PI3K/AKT pathway that plays an important role in a variety of cellular functions.13 Combining previous work, Wang et al. proposed that peptide GMBP1 regulates MDR of gastric cancer by targeting GRP78, and the expression of GRP78 regulates the expression of EIF4E and MDR1 through the PI3K/AKT pathway.12 CTBPs may promote tumor proliferation and is a transcriptional co-pressor factor that mediates Notch and Wnt pathways.14 Notch signaling and Wnt signaling are considered to be the key to regulating drug resistance. Therefore, down-regulation of CTBP2 has an effect on reversing MDR.12 Although the important role played by GMBP1 has been fully elucidated at the cellular level, there have been no reports on MDR detection by GMBP1 in vivo. Thus, it is necessary to design GRP78-specific nanoprobes for MDR detection in GC in vivo.
Molecular imaging is of great value in early cancer diagnosis and development due to its ability to accurately diagnose diseases in the whole body and at the cellular and molecular levels.15–17 In recent decades, with the development of medical imaging technology, MDR can be in vivo evaluated by positron emission tomography (PET),18,19 single-photon emission computed tomography (SPECT)20,21 and computed tomography (CT)22 imaging of radiolabeled drugs. However, monitoring MDR is a long-term process and the ionizing radiation damage, caused by radioactive labelling, cannot be ignored. MRI is one of the main methods of clinical detection, characterized by a high spatial resolution, non-invasiveness, and absence of ionizing radiation, which makes this method the best technology for soft tissue detection.23 Therefore, MRI is the ideal candidate for detecting MDR in gastric cancer.
Contrast agents (CAs) have the ability to improve MRI sensitivity and image quality.24 The existing MRI CAs can be divided into two categories: one is a T1 contrast agent based on Gd or Mn, and the other is a T2 contrast agent based on superparamagnetic Fe3O4 nanoparticles.25 At present, Gd-based contrast agents are commonly used in clinic; however, studies have found that it is associated with renal fibrosis and brain deposition.26,27 In the past two decades, some T2 CAs that are based on superparamagnetic Fe3O4 nanoparticles have been examined and approved by the US Food and Drug Administration (FDA), or have entered clinical tests. Sadly, these nanoparticles were handicapped in clinical practice due to their inherent dark signals and magnetic susceptibility artifacts.28,29 Since Mn is an essential trace element in living organisms, this molecule has a good biocompatibility, high relaxation spin and a bright signal, that make Mn-based contrast agents ideal candidates for MRI CAs.30 Furthermore, manganese oxide nanoparticles, with favorable monodispersity and excellent crystallinity, have been shown to be synthesized on a massive scale in an air atmosphere under mild conditions.31 In previous studies, nanoprobes based on Mn3O4 nanospheres have been used for in vivo PET/MR28,32 and fluorescence/MR33 imaging of tumors. Although the reported Mn3O4 nanospheres have good imaging capabilities, it is still necessary to broaden the application of Mn3O4 nanoparticles in biomedical imaging.
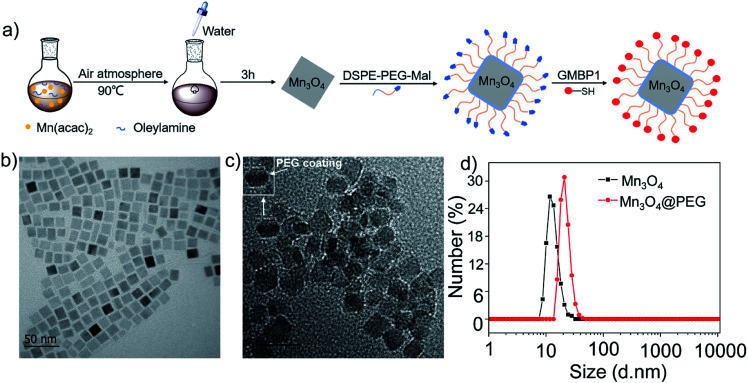
Herein, in order to achieve the monitoring of MDR in GC in vivo, we synthesized Mn3O4 nanoplates (Mn3O4 NPs) by a simple and gentle method, and then conjugated them with GMBP1 after PEGylation (Fig. 1a). To verify the specificity of the resulting Mn3O4@PEG-GMBP1 NPs to MDR gastric cancer cells, in vivo MRI and blocking studies were performed in SGC7901/ADR tumor-bearing nude mice, ex vivo and in vitro. In addition, the in vitro and in vivo toxicity studies and the histological evaluations were performed to investigate the toxic potential of these nanoplates.
Fig. 1. (a) Design and synthesis protocol of Mn3O4@PEG-GMBP1 NPs; TEM images of (b) Mn3O4 nanoplates and (c) Mn3O4@PEG NPs (the inset is a screenshot of a single NPs, with a white arrow indicating PEG coating); (d) size distribution of Mn3O4 and Mn3O4@PEG NPs measured by DLS.
Results
Synthesis and characterization of Mn3O4@PEG-GMBP1 NPs
The GMBP1 conjugated Mn3O4@PEG NPs (Mn3O4@PEG-GMBP1 NPs) were prepared as described in Fig. 1a. TEM image showed that the obtained Mn3O4 nanoplates have a good monodispersity in a nonpolar solution, a uniform particle size and an average side length of approximately 10 nm (Fig. 1b). In addition, Mn3O4 NPs successfully transferred to an aqueous solution by PEG modification, which showed a good dispersion and stability, with a size of approximatively 11 nm (Fig. 1c). TEM images showed that PEG coating on Mn3O4 nanoplates formed a transparent layer. Dynamic light scattering (DLS) measurements further confirmed that the average hydrodynamic size of Mn3O4 nanoplates and Mn3O4@PEG NPs were 11.8 ± 1.41 nm and 21.2 ± 2.53 nm, respectively (Fig. 1d). The crystalline form of Mn3O4 nanoplates was determined by XRD (Fig. S1†). As a result, the diffraction peaks of the synthesized Mn3O4 nanoplates coincided with the diffraction peaks of the Joint Committee on Powder Diffraction Standard (JCPDS) card number: 24-0734. Therefore, the crystal form of the prepared Mn3O4 nanoplates belongs to the tetragonal Mn3O4 phase. The stability of Mn3O4@PEG NPs in PBS and 10% FBS was examined (see Fig. S2†). The NPs size in the two solutions did not significantly change at 25 °C and 37 °C within five days, and the solution remained clear and transparent.
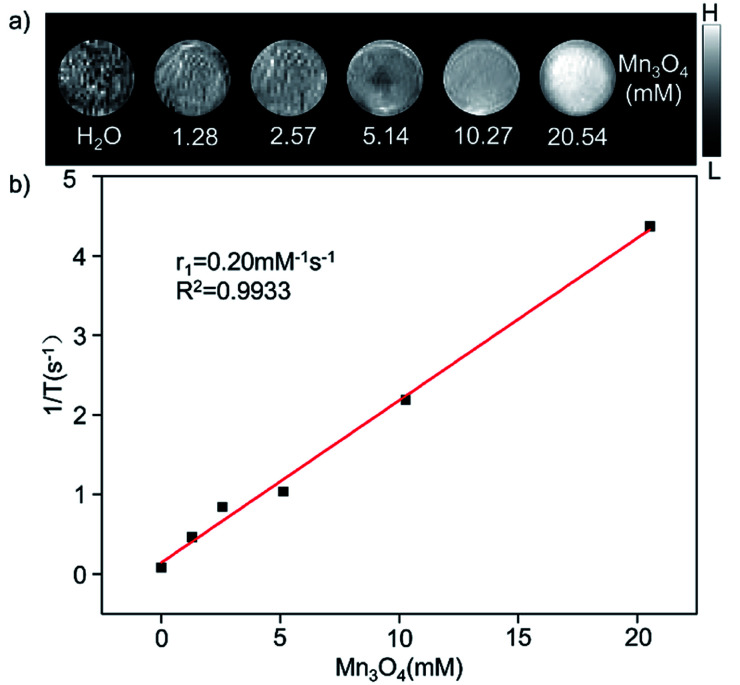
The magnetic resonance contrast performance of Mn3O4@PEG NPs in aqueous phase was characterized by a 0.5 T MRI scanner. As shown in Fig. 2a, T1-MRI of Mn3O4@PEG showed an increase in signal that correlated with the increase in manganese oxide concentration. The relaxation rate (r1) of the Mn3O4@PEG nanoplates was obtained by measuring the relaxation time of protons that corresponded NPs concentration gradient (Fig. 2b). The value r1 was reckoned as 0.20 mM−1 s−1 from a linear fitting of 1/T1 versus Mn3O4 concentration.
Fig. 2. The relaxation properties of Mn3O4@PEG NPs. (a) T1-weighted MR imaging and (b) longitudinal r1-relaxivity plot of Mn3O4@PEG NPs aqueous suspension at a 0.5 T MR scanner.
Internalization and affinity assay
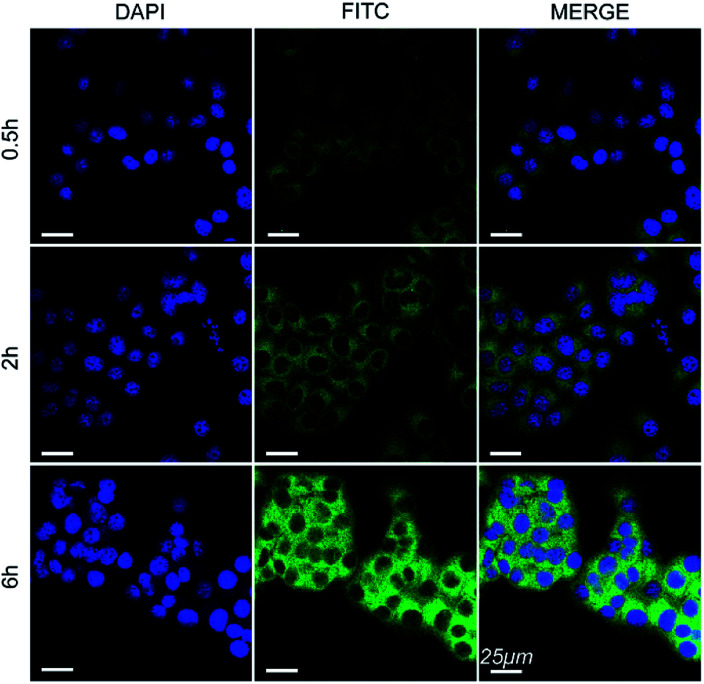
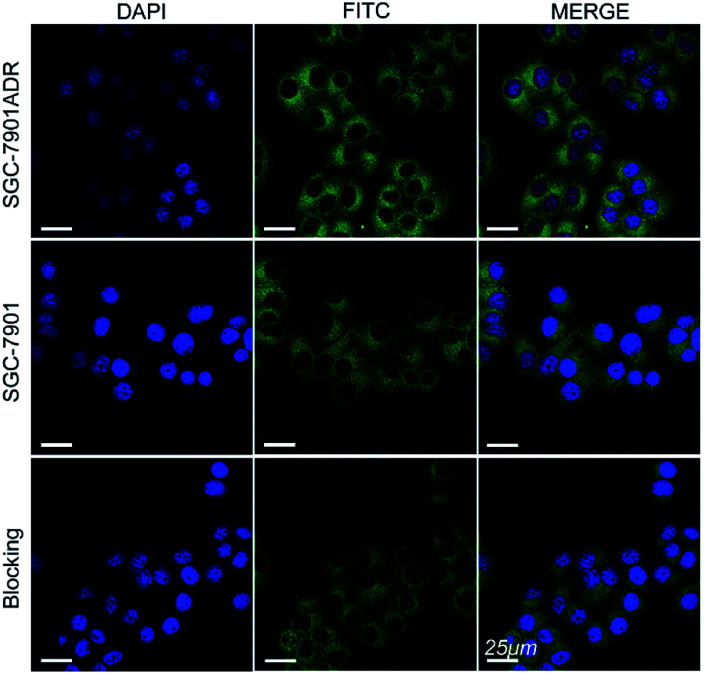
The cell internalization of Mn3O4@PEG-GMBP1 NPs was performed on a confocal laser scanning microscope (CLSM). As illustrated in Fig. 3, the nuclei were labelled with DAPI blue fluorescence, and the green fluorescence indicates, that the FITC-labelled Mn3O4@PEG-GMBP1 NPs were successfully internalized and distributed in the cytoplasm. With time, the fluorescence intensity increased with the increase of internalized NPs. The quantitative analysis of the fluorescence intensity further confirmed this result (Fig. S3†). The specific targeting ability of Mn3O4@PEG-GMBP1 NPs to MDR gastric cancer cells was evaluated by CLSM (Fig. 4). SGC7901/ADR (GMBP1 positive) and SGC7901 cells (GMBP1 negative) were incubated with Mn3O4@PEG-GMBP1 NPs, and CLSM showed that the fluorescence intensity of MDR cells (SGC7901/ADR) was stronger than that of wild gastric cancer cells (SGC7901). Meanwhile, the fluorescence intensity of SGC7901/ADR cells that were co-incubated with Mn3O4@PEG-GMBP1 NPs significantly decreased when GMBP1 was blocked. The quantitative analysis of fluorescence intensity between the control group and the test groups was consistent with the results of confocal imaging (Fig. S4†).
Fig. 3. Confocal laser scanning microscope images of Mn3O4@PEG-GMBP1 NPs incubated with SGC7901/ADR cells at 37 °C for 0.5, 2 and 6 h. The nuclei were labelled with DAPI (blue). The cells containing Mn3O4@PEG-GMBP1 NPs are coloured green. Scale bar: 25 μm.
Fig. 4. Confocal laser scanning microscope images of Mn3O4@PEG-GMBP1 NPs incubated with SGC7901/ADR cells, SGC7901 cells and GMBP1-blocking SGC7901/ADR cells. The nuclei were labelled with DAPI (blue). The cells containing Mn3O4@PEG-GMBP1 NPs are coloured green. Scale bar: 25 μm.
Cytotoxicity assay
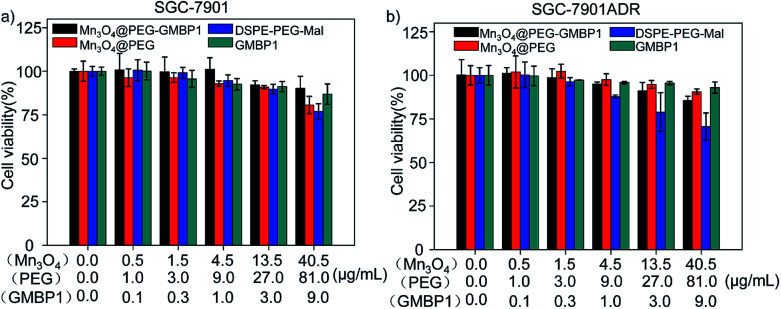
The cytotoxicity of Mn3O4@PEG-GMBP1 and its components was evaluated by MTT assay using SGC7901 and SGC7901/ADR cells. As shown in Fig. 5, no significant cytotoxicity was observed with Mn3O4@PEG-GMBP1 NPs treatments at the concentrations of 0.001–40.5 μg mL−1. Similarly, Mn3O4@PEG, DSPE-PEG-Mal and GMBP1 were also non-toxic to cancer cells.
Fig. 5. Cell viability of SGC7901 cells and SGC7901/ADR cells incubated with different concentrations of Mn3O4@PEG-GMBP1 NPs, Mn3O4@PEG NPs, DSPE-PEG-Mal and GMBP1.
In vivo MR imaging
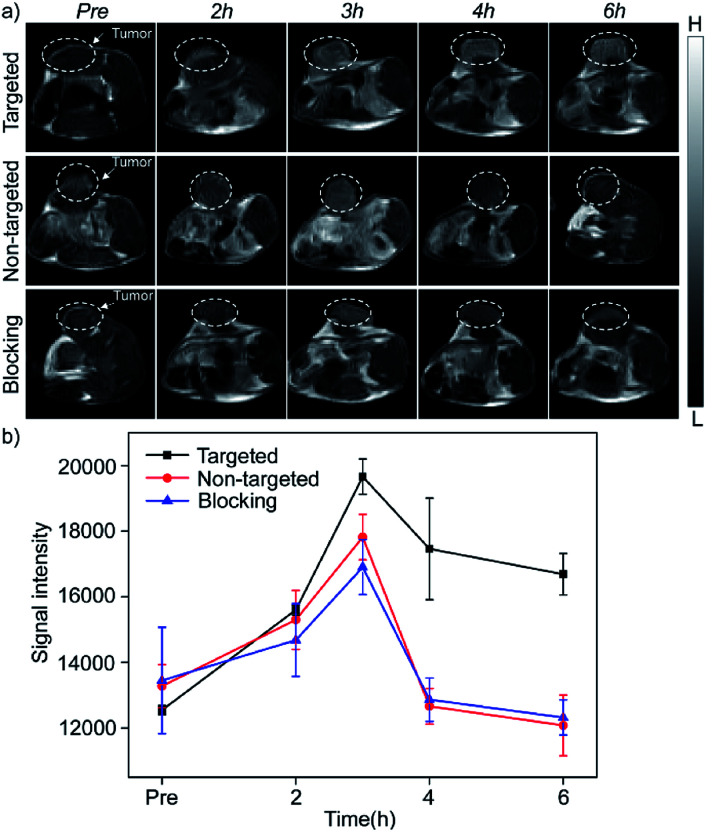
The in vivo enhanced MRI of subcutaneous tumor models was performed by intravenous injection of Mn3O4@PEG-GMBP1 NPs. As shown in Fig. 6a, after treatment with Mn3O4@PEG-GMBP1 NPs, significant changes of the MR signal at the tumors sites (white circle) were observed in all three groups (targeted, non-targeted and blocking groups). The MR contrast intensity in the three groups, all peaked 3 hours after injection, and the contrast intensity of the targeted group was obviously stronger than that of the GMBP1-blocking group and non-targeted group. After 3 hours, the MR signal intensity in the tumor sections from the three groups decreased; however, this signal slowly decreased in tumor sections of the targeted group compared to the other two groups. The over time quantitative analysis of the MR contrast intensity of the tumor site further validated this variation trend (Fig. 6b).
Fig. 6. (a) In vivo T1-weighted MRI after intravenous injection with Mn3O4@PEG-GMBP1 NPs at different time points of preinjection, 2, 3, 4 and 6 h. The tumors are indicated by white circles; (b) changes in MR intensity of Mn3O4@PEG-GMBP1 NPs over time in vivo imaging studies.
Histology
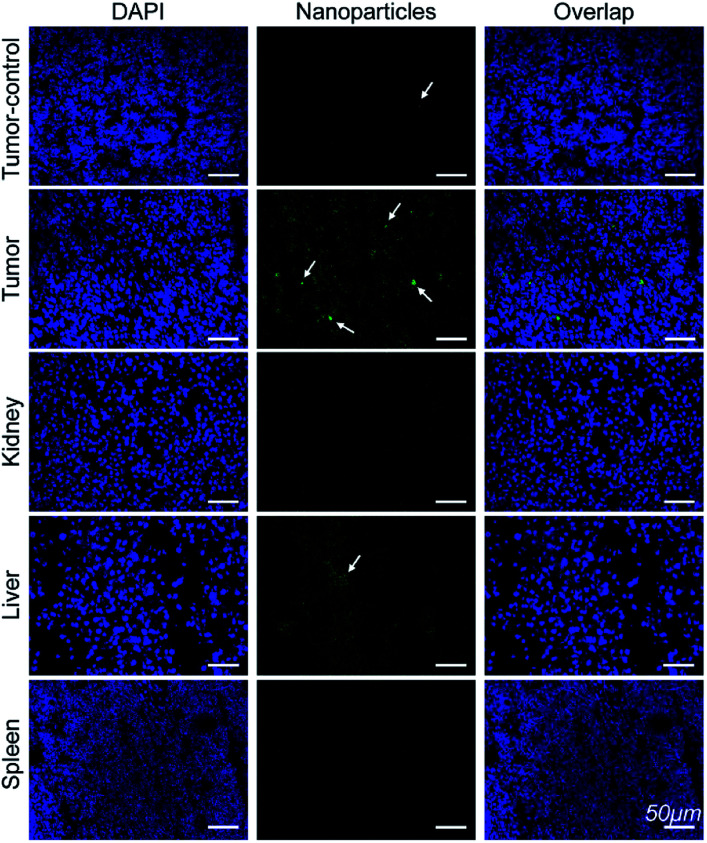
Immunofluorescence analysis of the tissue sections were performed to investigate if Mn3O4@PEG-GMBP1 targets MDR gastric cancer cells via GRP78. As shown in Fig. 7, the colocalization of nanoparticles (green) with nuclei (blue) indicated that Mn3O4@PEG-GMBP1 entered the MDR gastric cancer cells (SGC7901/ADR). In addition, a small number of nanoparticles accumulated in the livers tissue and wild gastric cancer (SGC7901) tumors tissue, but no obvious signal was observed in the kidneys and spleens.
Fig. 7. Immunofluorescent staining for GMBP1 within Mn3O4@PEG-GMBP1 NPs (green, indicated with white arrow). The nuclei were labelled with DAPI (blue). Scale bar: 50 μm.
Toxicity of Mn3O4@PEG NPs in healthy mice
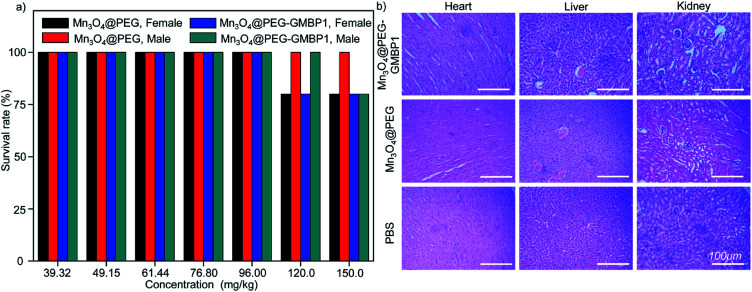
The in vivo potential toxicity of Mn3O4@PEG nanoplates and Mn3O4@PEG-GMBP1 NPs were investigated through acute toxicity experiments and histological evaluation. After 14 days of intravenous injection of Mn3O4@PEG nanoplates or Mn3O4@PEG-GMBP1 NPs, no significant toxicity of Mn3O4@PEG nanoplates and Mn3O4@PEG-GMBP1 NPs were observed in healthy mice at the studied concentrations (Mn3O4 concentration from 39.32 to 150.0 mg kg−1) (Fig. 8a). Even at a concentration of 150.0 mg kg−1, the survival rate of mice was still above 80%. In addition, the mice were sacrificed 14 days later and their main organs (hearts, kidneys and livers) were harvested for H&E staining. Histological analysis revealed, that compared with the control group, all major organs of the mice had no obvious damage (Fig. 8b).
Fig. 8. Biocompatibility studies of Mn3O4@PEG-GMBP1 NPs and Mn3O4@PEG NPs in healthy mice. (a) The survival rate of healthy mice injected with different concentrations of Mn3O4@PEG-GMBP1 NPs or Mn3O4@PEG NPs; (b) H&E staining of the hearts, livers and kidneys of mice harvested 14 days after injection with Mn3O4@PEG-GMBP1 NPs or Mn3O4@PEG (dose: 150 mg kg−1). Healthy mice treated with PBS were used as the control. Scale bar: 100 μm.
Discussion
MDR has seriously impeded chemotherapy effects on gastric cancer; thus, its accurate monitoring has a great significance for clinical treatment. To monitor MDR in gastric cancer, we generated Mn3O4@PEG-GMBP1 NPs for in vivo MRI. Monodisperse Mn3O4 nanoplates were synthesized by thermally decomposing the products formed by the reaction of water and manganese acetate in the presence of oleylamine.31 In this method, water is a key factor in the nucleation of nanocrystals and oleylamine is a nucleation catalyst. The TEM showed that the prepared oil phase Mn3O4 crystals were square shaped, with a side length of about 10 nm, and uniformly dispersed in cyclohexane. The XRD result revealed, that the crystal structure of the Mn3O4 nanoplates, is a tetragonal system (Joint Committee for Powder Diffraction Standards (JCPDS) card no: 24-0734). Hydrophobic nanocrystals can not be directly used for in vivo and in vitro imaging; therefore, it is necessary to transfer Mn3O4 nanoplates from the oil phase to the aqueous phase to endow them with biocompatibility. Moreover, PEG modification is the most versatile strategy for increasing the water solubility of hydrophobic nanoparticles.24,34,35 In this study, hydrophobic Mn3O4 nanoplates were coated with maleimide-functionalized PEG lipids (DSPE-PEG5000-Mal) through a solvent exchange strategy, which was successfully dispersed in aqueous solution and showed good stability. DLS measurements further indicated that the average hydrodynamic size of Mn3O4 nanoplates was 11.8 ± 1.41 nm, while Mn3O4@PEG was 21.2 ± 2.53 nm. The DLS measurement results were slightly higher than the TEM measurements due to hydration and surface coating.36,37
NPs performance and safety are related to their stability; thus, it is of significant importance to study the stability of NPs in a strong ionic and simulated body fluid environments. To evaluate NPs colloidal stability, the hydrodynamic size of Mn3O4@PEG NPs in 10% FBS and 0.01 M PBS solutions and at different temperatures, was measured. Obviously, there were no significant changes in the hydrodynamic size within 5 days, confirming their good colloidal stability.38 Furthermore, the PEG coating with a maleimide group provides the nanoparticles the ability of further modification. The MDR targeting peptide GMBP1 was linked to the maleimide group via a thiol group to form Mn3O4@PEG-GMBP1 NPs.
To further investigate the intracellular distribution and stability of Mn3O4@PEG-GMBP1 NPs, the SGC7901/ADR cell line was used as an in vitro cell model to study NPs cell uptake capacity. CLSM results showed that Mn3O4@PEG-GMBP1 NPs were distributed in the cytoplasm and aggregated into the nucleus, which was consistent with the results of previous studies that showed, that GMBP1 specifically bonded to the surface receptor GRP78 of the gastric cancer cells' MDR, and that GRP78 mediated the internalization of GMBP1 into MDR cells, through transporter-related pathways.12 The specific recognition of MDR gastric cancer cells by Mn3O4@PEG-GMBP1 NPs is a prerequisite for achieving gastric cancer monitoring. Affinity experiments showed that SGC7901/ADR had the highest fluorescence intensity in the SGC7901/ADR, SGC7901 and GMBP1 blocked SGC7901/ADR experiments. Therefore, it can be concluded that Mn3O4@PEG-GMBP1 NPs have a favorable targeting ability for MDR gastric cancer cells, which may have potential in vivo applications in targeted tumor imaging.
Biocompatibility is an important indicator of whether Mn3O4@PEG-GMBP1 NPs can be used as MRI contrast agents. For the in vitro cytotoxicity testing, SGC7901/ADR and SGC7901 were treated with different concentrations of Mn3O4@PEG-GMBP1 NPs. The MTT assay showed that Mn3O4@PEG-GMBP1 NPs have an excellent biocompatibility within the detection concentration range. In addition, no significant toxicity was observed for Mn3O4@PEG-GMBP1 NPs free components.
We extended our study in vivo to further assess the safety of Mn3O4@PEG nanoplates and Mn3O4@PEG-GMBP1 NPs. Healthy mice were injected with Mn3O4@PEG nanoplates or Mn3O4@PEG-GMBP1 NPs via the tail vein for acute toxicity testing and organs histological evaluation. Even at doses up to 150 mg kg−1, the survival rate of mice was still above 80%. In addition, H&E staining of major organs tissues was used for histological analysis and no significant tissues damage was found compared to the control group. Based on these results, it can be concluded that Mn3O4@PEG-GMBP1 can be safely used for T1-weighted MRI in vivo.
Since Mn3O4 nanoparticles were applied in T1-weighted MRI, a series of in vitro and in vivo T1 MR image scanning was used to evaluate Mn3O4@PEG NPs MR contrast performance. Obviously, as the concentration of Mn increased, the signal of the MR images was enhanced, indicating that Mn3O4 had the potential as a T1 MR contrast agent. The r1 value of Mn3O4@PEG was 0.2 mM−1 s−1, which is lower than other T1 contrast agents (r1 value of the commercial Gd-based MR CAs is 4.11 mM−1 s−1). The low r1 relaxation rate may due to two aspects: on one hand, PEG modification may lead to the formation of a thick hydrophobic coating that hinders the chemical exchange between protons and magnetic ions, resulting in a lower T1 relaxation rate.39,40 On the other hand, the paramagnetic strength of Mn ions, with different valence states, depends on the number of unpaired electrons in the 3d orbital. The more unpaired electrons, the stronger the paramagnetic strength.30 However, Mn3O4 contains one divalent Mn and two trivalent Mn. The unpaired electron number of Mn3+ (4) is less than Mn2+ (5), resulting in a relatively low r1 value.
Next, Mn3O4@PEG-GMBP1 NPs enhanced MR imaging ability for the subendothelial MDR gastric cancer tumor model was evaluated. After injecting the same dose of Mn3O4@PEG-GMBP1 NPs, we found that in the targeted group, the MR contrast intensity of the tumor site was significantly higher than that in the non-targeted group. Intravenous injection of GMBP1 reduced MR contrast intensity at the tumor site, indicating that Mn3O4@PEG-GMBP1 NPs have a good targeting ability for MDR gastric cancer cells. It is worth noting that in all three groups, the tumor sites' MR signals showed a trend of first increasing and then weakening, which indicated that Mn3O4@PEG-GMBP1 NPs could be metabolized in a short time, and that the long-term toxicity of this nanomaterial was negligible. Three hours after the injection, the MR signal intensity in the targeted group reached a higher peak compared with the GMBP1 blocking group. It is most likely due to the free GMBP1 occupying a large number of binding sites when injected in advance; thereby, preventing the binding of Mn3O4@PEG-GMBP1 NPs.
To further verify that Mn3O4@PEG-GMBP1 NPs targeted MDR gastric cancer cells via GRP78 in vivo, all mice were sacrificed 6 hours after injection and their organs and tumors harvested for immunofluorescence staining. CLSM imaging results showed that a large number of Mn3O4@PEG-GMBP1 NPs were distributed in the tumor tissue of the targeted group. This indicates that GMBP1 has an excellent affinity for MDR gastric cancer cells and that the strong magnetic resonance signal of the targeted group is caused by the conjugated Mn3O4 NPs. In addition, a small amount of Mn3O4@PEG-GMBP1 NPs was observed in the liver tissue of the targeted group, which may be due to NPs metabolism by the hepatobiliary system.28,41 Meanwhile, the small amount of accumulated NPs in the non-targeted tumor tissue was caused by the tumor enhanced permeability and retention (EPR) effect.42 All these results suggested that Mn3O4@PEG-GMBP1 NPs may be a safe in vivo MR contrast agent for monitoring MDR in gastric cancer.
Experimental
Materials
Manganese(ii) acetate (98%) was purchased from Sigma-Aldrich, fluorescein isothiocyanate isomer I (FITC, 90%) from Acros Organics, oleylamine (technical grade 90%) and xylene (98%) from Aladdin. DSPE-PEG5000-Mal, SCM-PEG5000-Mal, and DSPE-PEG5000-NH2 were purchased from Creative PEGworks, Traut's Reagent was from Thermo and GMBP1 from GL Biochem (Shanghai) Ltd.
Synthesis of Mn3O4 nanoplates
Mn3O4 nanoplates were synthesized based on a previous report but with slight modifications.31 In an air atmosphere, oleylamine (20 mmol, 5.70 g) and manganese acetate (1 mmol, 0.17 g) were mixed and dispersed in 15 mL of xylene, and then slowly heated to 90 °C with vigorous stirring. After the temperature was stabilized at 90 °C, 2 mL of ultra-pure water was mixed and a vigorous stirring was maintained for 3 h. After completion, the reaction system was destroyed by adding 100 mL of absolute ethanol and then centrifuged to obtain powdered Mn3O4 NPs for further use.
Synthesis of (FITC-)Mn3O4@PEG-GMBP1 NPs
To obtain Mn3O4@PEG NPs, 10 mg manganese oxide nanoplates were dissolved in 3 mL of chloroform and 25 mg of DSPE-PEG5000-Mal or DSPE-PEG5000-NH2 were added. After 4 hours of mixing at room temperature, the chloroform was removed via nitrogen blowing. A brown transparent solution was obtained after adding 10 mL of ultra-pure water and sonicating for 30 minutes. Excess DSPE-PEG5000-Mal or DSPE-PEG5000-NH2 was removed by centrifugation. The Mn3O4@PEG-NH2 NPs were then reacted with FITC at pH 8.5 for 3 h at a molar ratio of 1 : 10. The nanoparticles were further modified by SCM-PEG-Mal using the same procedure, and the final products were FITC-Mn3O4@PEG-Mal NPs.
GMBP1-conjugated Mn3O4@PEG NPs (Mn3O4@PEG-GMBP1 NPs or FITC-Mn3O4@PEG-GMBP1 NPs) were prepare by the following protocol: GMBP1 and Traut's reagent were incubated at pH 8.0 for 2 h at a molar ratio of 1 : 25, then the Mn3O4@PEG-Mal NPs or FITC-Mn3O4@PEG-Mal NPs were added and the resulting solution was incubated for further 1 h at 37 °C. The unconjugated GMBP1 was then separated using a PD-10 desalting chromatography column.
Characterization
The morphology and size of the Mn3O4 nanoplates were obtained from a JEOL JEM-2100F transmission electron microscope (TEM). The hydrodynamic size was performed on a Malvern Zetasizer Nano ZS. For DLS measurement of Mn3O4 nanoplates and Mn3O4@PEG NPs, cyclohexane and ultrapure water were used as the solvent, respectively, at a concentration of 0.1 mg mL−1. The powder X-ray diffraction (XRD) patterns of the Mn3O4 nanoplates were characterized using a Bruker D8 diffractometer with Cu Kα radiation (λ = 0.15405 nm). The T1-relaxivities and T1-weighted images of Mn3O4 aqueous solutions, with different concentrations, were determined using a 0.5 T small animal scanner (Shanghai Niumag Corporation). A set of conventional spin-echo acquisition sequence is shown below: TR 350 ms, TE 18.2 ms, slice gap 0.8 mm and slice thickness 4 mm. The value of r1 was calculated by the linear fitting of 1/T1 (s−1) versus the Mn3O4 concentration (mM).
Gastric cancer cell lines and animal models
Human gastric adenocarcinoma cancer cells SGC7901 and MDR variants SGC7901/ADR cell lines were provided by Xijing Hospital. The cells were cultured in DMEM medium with 10% fetal bovine serum (FBS), 100 μg mL−1 streptomycin and 100 U mL−1 penicillin, and incubated at 37 °C under 5% CO2 in a humidified incubator. Four-week-old male nude mice were provided by the Department of Experimental Animals, Health Science Center, Xi'an Jiaotong University. The mice were housed in SPF animal rooms, maintained at a temperature of 20 °C and acclimated for at least 48 h prior to the experiment. Then 5 × 10⁵ desired cells were dispersed in 20 μL PBS and subcutaneously implanted in the right hind limbs to prepare SGC7901 or SGC7901/ADR tumor-bearing nude mouse models. All animal procedures were performed in accordance with the Guidelines for Care and Use of Laboratory Animals of Xi'an Jiaotong University and experiments were approved by the Animal Ethics Committee of Xi'an Jiaotong University. (Number XJTULAC 2016-412).
Colloidal stability of Mn3O4@PEG NPs
The coalescence stability is the key to the stability of a colloid. The stability of Mn3O4@PEG NPs was evaluated by the hydrodynamic size distribution of NPs in 10% FBS and 0.01 M PBS solution within 5 days. The solvents used for DLS measurement were 10% FBS and 0.01 M PBS, respectively, and the concentration of Mn3O4@PEG was 0.1 mg mL−1. At the same time, the effect of temperature on the size distribution of the nanoplates was investigated. All data were expressed as mean values with ± SD.
Internalization and affinity assay
The intracellular internalization of Mn3O4@PEG-GMBP1 NPs was observed by a CLSM (TCS SP5 II, Leica, Germany). The SGC7901/ADR cells were incubated with FITC-Mn3O4@PEG-GMBP1 NPs for 48 hours in a confocal dish. The Mn3O4@PEG-GMBP1 nanoprobes were detected by a confocal with a laser excitation wavelength of 496 nm. The endocytosis of Mn3O4@PEG-GMBP1 NPs was examined by monitoring the uptake behaviour of the cells at 0.5, 2 and 6 h using a CLSM. For cell affinity studies, SGC7901 and SGC7901/ADR cells were incubated with a concentration of FITC-Mn3O4@PEG-GMBP1 NPs, in a confocal dish for an allotted time, and then PBS (pH 7.4) was used to wash out non-uptaken NPs and the cells were fixed with 4% paraformaldehyde. Meanwhile, using GMBP1 as a blocking agent, the effect of SGC7901/ADR cells on the uptake of FITC-Mn3O4@PEG-GMBP1 NPs was also examined after the blocking. The fluorescence intensity of SGC7901 and SGC7901/ADR cells was measured by labelling their nuclei with DAPI and the detection was performed using a laser excitation wavelength of 340 nm.
Cytotoxicity assay
The cytotoxicity of Mn3O4@PEG-GMBP1 NPs on SGC7901 cells and SGC7901/ADR cells was investigated by the MTT assay. Briefly, the cells were seeded in a 96-well plate at a density of 1 × 10⁵ cells per well and cultured for 24 hours. Complete mediums with different concentrations of Mn3O4@PEG-GMBP1 NPs were added to the 96-well plate, respectively. After 72 hours, the mediums were removed and fresh mediums containing MTT (5 mg mL−1, 20 μL) were added. After 4 h incubation, the mediums were discarded and 100 μL of dimethyl sulfoxide (DMSO) was added and mixed into each well. After shaking, the absorbance of each well was measured at 590 nm using an enzyme-linked immunosorbent detector (Infinite® 200 Pro, Tecan, Switzerland). The cell viability calculation formula was as follows: cell viability = (mean absorbance of the treated group/mean absorbance of the control group) × 100%. Additionally, the cytotoxicities of Mn3O4@PEG, DSPE-PEG-Mal and GMBP1 were tested using the same protocol.
In vivo toxicity studies
Toxicity in healthy Balb/c mice was assessed by an acute toxicity test. The experimental group was intravenously injected with different concentrations of Mn3O4@PEG nanoplates or Mn3O4@PEG-GMBP1 NPs. The mice injected with PBS were used as the control group. Seventy-five male mice were randomly divided into 15 groups (n = 5) and injected with PBS, 39.12, 49.15, 61.44, 76.80, 96.00, 120.0 and 150.0 mg kg−1 of Mn3O4@PEG NPs or Mn3O4@PEG-GMBP1 NPs, respectively. Seventy-five female mice were similarly treated. The survival number was recorded after 14 days. Meanwhile, the mice were sacrificed and hearts, kidneys and livers were harvested. The tissues were fixed with 4% paraformaldehyde solution, embedded in paraffin, sectioned and stained with hematoxylin and eosin (H&E). Tissue sections were observed under a digital microscope (Leica DM5000).
In vivo magnetic resonance imaging
The accumulation of Mn3O4@PEG-GMBP1 NPs in the tumors was detected in vivo by T1-MRI using a 0.5 T small animal scanner (Shanghai Niumag Corporation). Imaging was performed before and after intravenous injection of the NPs at 2, 3, 4 and 6 h. The SGC7901/ADR tumor cells were xenografted in the targeted group and the blocking group, while the SGC7901 tumor cells were xenografted in the non-targeted group. All groups were injected with 200 μL of Mn3O4@PEG-GMBP1 NPs (2.80 mg mL−1). Before the injection of 200 μL of Mn3O4@PEG-GMBP1 NPs (2.80 mg mL−1), the blocking group was injected into the tail vein with GMBP1 for 3 hours. The parameters of T1-MR images were set as follows: TR = 350 ms; TE = 18.2 ms; slice thickness = 4 mm; flip angle = 90°; FOV = 100; NEX = 2; matrix = 256 × 256; for axial images.
Histology
An SGC7901/ADR-bearing mice and an SGC7901-bearing mice were injected with 200 μL of Mn3O4@PEG-GMBP1 NPs (2.80 mg mL−1), respectively, and euthanized 6 h after the intravenous injections. As previously reported, the major organs (liver, kidney, and spleen) and the tumors were harvested, frozen, sectioned and subjected to immunofluorescent staining for histological analysis.28 Rabbit anti-human GRP78 and FITC-labelled goat anti-rabbit antibodies were used to visualize Mn3O4@PEG-GMBP1 NPs, while the nuclei were labelled with DAPI. A CLSM was used for the visualization of the tissue sections.
Statistical analysis
Data were expressed as the mean values ± standard deviation of independently repeated experiments. The GraphPad 5.0 software was used to analyze the differences between different experimental groups through one-way ANOVA statistical analysis. The statistical differences between the groups are indicated by asterisks and as follows: *p < 0.05, **p < 0.01, ***p < 0.001.
Conclusions
In this study, we monitored MDR in gastric cancer in vivo by establishing biocompatible GMBP1-conjugated Mn3O4-based nanoplates for magnetic resonance imaging. GMBP1, as a target ligand of the contrast agent, has been proved to specifically bind to the GRP78 receptor expressed on the surface of MDR gastric cancer cells, which makes of this contrast agent a good target for the imaging and diagnosis of MDR gastric cancer. Mn3O4@PEG-GMBP1 NPs showed a good colloid stability and a high specificity to MDR gastric cancer cells. The MRI studies performed in mice showed that Mn3O4@PEG-GMBP1 NPs exhibit an excellent T1-weighted imaging performance with rapid accumulation at the tumor site (peaked 3 hours after intravenous injection). In addition, in vivo and in vitro toxicity studies showed that Mn3O4 NPs have no significant toxicity. Therefore, Mn3O4@PEG-GMBP1 NPs have been validated as a potential nanoplatform for MDR gastric cancer imaging and monitoring.
Conflicts of interest
There are no conflicts to declare.
Supplementary Material
Acknowledgments
This work was supported, in part, by the National Natural Science Foundation of China under Grant No. 81571725, 81701750. The Shanghai Municipal Human Resources Development Program for Outstanding Young Talents in Medical and Health Sciences (2018YQ33). The authors would like to express their gratitude to EditSprings (https://www.editsprings.com/) for the expert linguistic services provided.
Electronic supplementary information (ESI) available: Fig. S1: X-ray diffraction pattern of Mn3O4 nanoplates, Fig. S2: Hydrodynamic size of the Mn3O4@PEG at different time periods in PBS and 10% FBS at different temperatures, Fig. S3: The quantitative analysis of fluorescence intensity for Mn3O4@PEG-GMBP1 NPs in SGC7901/ADR cells at 0.5, 2, and 6 h. ***p < 0.01; n = 3, Fig. S4: The quantitative analysis of fluorescence intensity for Mn3O4@PEG-GMBP1 NPs in SGC7901/ADR, SGC7901, and GMBP1-blocking SGC7901/ADR cells. **p < 0.05; n = 3. See DOI: 10.1039/d0ra00897d
References
- Bray F. Ferlay J. Soerjomataram I. Siegel R. L. Torre L. A. Jemal A. Ca-Cancer J. Clin. 2018;68:394–424. doi: 10.3322/caac.21492. [DOI] [PubMed] [Google Scholar]
- Matsubara J. Shimada Y. Kato K. Nagai Y. Iwasa S. Nakajima T. E. Hamaguchi T. Yamada Y. Takagi S. Kobayashi K. Yoshioka A. Nakayama N. Tsuji A. Oncology. 2011;81:291–297. doi: 10.1159/000334462. [DOI] [PubMed] [Google Scholar]
- Li W. M. Wang S. Zhou L. L. Cheng Y. J. Fang J. Talanta. 2019;199:634–642. doi: 10.1016/j.talanta.2019.03.016. [DOI] [PubMed] [Google Scholar]
- Fan D. M. Zhang X. Y. Chen X. T. Mou Z. X. Hu J. L. Zhou S. J. Ding J. Wu K. C. J. Gastroenterol. Hepatol. 2005;20:360–365. doi: 10.1111/j.1440-1746.2005.03797.x. [DOI] [PubMed] [Google Scholar]
- Gong J. Jaiswal R. Mathys J. M. Combes V. Grau G. E. R. Bebawy M. Cancer Treat. Rev. 2012;38:226–234. doi: 10.1016/j.ctrv.2011.06.005. [DOI] [PubMed] [Google Scholar]
- Mu Y. Z. Wu G. S. Su C. Dong Y. Zhang K. C. Li J. Sun X. J. Li Y. Chen X. G. Feng C. Carbohydr. Polym. 2019;223:115072. doi: 10.1016/j.carbpol.2019.115072. [DOI] [PubMed] [Google Scholar]
- Feng W. Su Z. Y. Yin Q. Q. Zong W. Shen X. J. Ju S. Q. J. Cell. Physiol. 2019;234:19143–19157. doi: 10.1002/jcp.28551. [DOI] [PubMed] [Google Scholar]
- Yang Y. X. Chen Z. C. Zhang G. Y. Yi H. Xiao Z. Q. J. Cell. Biochem. 2008;104:1010–1021. doi: 10.1002/jcb.21687. [DOI] [PubMed] [Google Scholar]
- Gruber A. Bjorkholm M. Brinch L. Evensen S. Gustavsson B. Hedenus M. Juliusson G. Lofvenberg E. Nesthus I. Simonsson B. Sjo M. Stenke L. Tangen J. M. Tidefelt U. Uden A. M. Paul C. Liliemark J. Leuk. Res. 2003;27:323–328. doi: 10.1016/S0145-2126(02)00181-9. [DOI] [PubMed] [Google Scholar]
- Sandler A. Gordon M. De Alwis D. P. Pouliquen I. Green L. Marder P. Chaudhary A. Fife K. Battiato L. Sweeney C. Jordan C. Burgess M. Slapak C. A. Clin. Cancer Res. 2004;10:3265–3272. doi: 10.1158/1078-0432.CCR-03-0644. [DOI] [PubMed] [Google Scholar]
- Kang J. Q. Zhao G. H. Lin T. Tang S. H. Xu G. H. Hu S. J. Bi Q. Guo C. C. Sun L. Han S. Xu Q. Nie Y. Z. Wang B. L. Liang S. H. Ding J. Wu K. C. Cancer Lett. 2013;339:247–259. doi: 10.1016/j.canlet.2013.06.016. [DOI] [PubMed] [Google Scholar]
- Wang X. J. Li Y. N. Xu G. H. Liu M. H. Xue L. Liu L. J. Hu S. J. Zhang Y. Nie Y. Z. Liang S. H. Wang B. L. Ding J. BMC Cancer. 2015;15:358. doi: 10.1186/s12885-015-1361-3. [DOI] [PMC free article] [PubMed] [Google Scholar]
- Tapia O. Riquelme I. Leal P. Sandoval A. Aedo S. Weber H. Letelier P. Bellolio E. Villaseca M. Garcia P. Virchows Arch. 2014;465:25–33. doi: 10.1007/s00428-014-1588-4. [DOI] [PubMed] [Google Scholar]
- Paliwal S. Kovi R. C. Nath B. Chen Y.-W. Lewis B. C. Grossman S. R. Cancer Res. 2007;67:9322–9329. doi: 10.1158/0008-5472.CAN-07-1743. [DOI] [PubMed] [Google Scholar]
- Terreno E. Delli Castelli D. Viale A. Aime S. Chem. Rev. 2010;110:3019–3042. doi: 10.1021/cr100025t. [DOI] [PubMed] [Google Scholar]
- Na H. B. Song I. C. Hyeon T. Adv. Mater. 2009;21:2133–2148. doi: 10.1002/adma.200802366. [DOI] [Google Scholar]
- Hu H. Dai A. Sun J. Li X. Gao F. Wu L. Fang Y. Yang H. An L. Wu H. Yang S. Nanoscale. 2013;5:10447–10454. doi: 10.1039/C3NR03490A. [DOI] [PubMed] [Google Scholar]
- Galante E. Okamura T. Sander K. Kikuchi T. Okada M. Zhang M. R. Robson M. Badar A. Lythgoe M. Koepp M. Arstad E. J. Med. Chem. 2014;57:1023–1032. doi: 10.1021/jm401764a. [DOI] [PMC free article] [PubMed] [Google Scholar]
- Kurdziel K. A. Kiesewetter D. O. Curr. Top. Med. Chem. 2010;10:1792–1798. doi: 10.2174/156802610792928077. [DOI] [PMC free article] [PubMed] [Google Scholar]
- Piwnica-Worms D. Sharma V. Curr. Top. Med. Chem. 2010;10:1834–1845. doi: 10.2174/156802610792928086. [DOI] [PubMed] [Google Scholar]
- Liu Z. L. Stevenson G. D. Barrett H. H. Kastis G. A. Bettan M. Furenlid L. R. Wilson D. W. Woolfenden J. M. Nucl. Med. Biol. 2004;31:53–65. doi: 10.1016/S0969-8051(03)00119-7. [DOI] [PMC free article] [PubMed] [Google Scholar]
- Kurata S. Ushijima K. Kawahara A. Kaida H. Kawano K. Hirose Y. Kage M. Kamura T. Ishibashi M. Abe T. Ann. Nucl. Med. 2015;29:643–649. doi: 10.1007/s12149-015-0980-8. [DOI] [PubMed] [Google Scholar]
- Sun C. Lee J. S. H. Zhang M. Q. Adv. Drug Delivery Rev. 2008;60:1252–1265. doi: 10.1016/j.addr.2008.03.018. [DOI] [PMC free article] [PubMed] [Google Scholar]
- Lei M. Fu C. Cheng X. Fu B. Wu N. N. Zhang Q. Fu A. L. Cheng J. L. Gao J. H. Zhao Z. H. Adv. Funct. Mater. 2017;27:1700978. doi: 10.1002/adfm.201700978. [DOI] [Google Scholar]
- Zhao Z. H. Zhou Z. J. Bao J. F. Wang Z. Y. Hu J. Chi X. Q. Ni K. Y. Wang R. F. Chen X. Y. Chen Z. Gao J. H. Nat. Commun. 2013;4:2266. doi: 10.1038/ncomms3266. [DOI] [PubMed] [Google Scholar]
- Idee J. M. Port M. Dencausse A. Lancelot E. Corot C. Radiol. Clin. 2009;47:855–869. doi: 10.1016/j.rcl.2009.06.006. [DOI] [PubMed] [Google Scholar]
- Caravan P. Chem. Soc. Rev. 2006;35:512–523. doi: 10.1039/B510982P. [DOI] [PubMed] [Google Scholar]
- Zhan Y. H. Shi S. X. Ehlerding E. B. Graves S. A. Goel S. Engle J. W. Liang J. M. Tian J. Cai W. B. ACS Appl. Mater. Interfaces. 2017;9:38304–38312. doi: 10.1021/acsami.7b12216. [DOI] [PMC free article] [PubMed] [Google Scholar]
- Neves H. R. Bini R. A. Barbosa J. H. O. Salmon C. E. G. Varanda L. C. Part. Part. Syst. Charact. 2016;33:167–176. doi: 10.1002/ppsc.201500251. [DOI] [Google Scholar]
- Garcia-Hevia L. Banobre-Lopez M. Gallo J. Chem.–Eur. J. 2019;25:431–441. doi: 10.1002/chem.201802851. [DOI] [PubMed] [Google Scholar]
- Yu T. Moon J. Park J. Park Y. I. Na H. B. Kim B. H. Song I. C. Moon W. K. Hyeon T. Chem. Mater. 2009;21:2272–2279. doi: 10.1021/cm900431b. [DOI] [Google Scholar]
- Zhan Y. H. Ehlerding E. B. Shi S. X. Graves S. A. Goel S. Engle J. W. Liang J. M. Cai W. B. J. Biomed. Nanotechnol. 2018;14:900–909. doi: 10.1166/jbn.2018.2498. [DOI] [PMC free article] [PubMed] [Google Scholar]
- Zhan Y. H. Zhan W. H. Li H. R. Xu X. Y. Cao X. Zhu S. P. Liang J. M. Chen X. L. Molecules. 2017;22:2208. doi: 10.3390/molecules22122208. [DOI] [PMC free article] [PubMed] [Google Scholar]
- Hao R. Xing R. J. Xu Z. C. Hou Y. L. Gao S. Sun S. H. Adv. Mater. 2010;22:2729–2742. doi: 10.1002/adma.201000260. [DOI] [PubMed] [Google Scholar]
- Zhao Z. H. Huang D. T. Yin Z. Y. Chi X. Q. Wang X. M. Gao J. H. J. Mater. Chem. 2012;22:15717–15725. doi: 10.1039/C2JM31692G. [DOI] [Google Scholar]
- Li J. J. Wu C. Hou P. F. Zhang M. Xu K. Biosens. Bioelectron. 2018;102:1–8. doi: 10.1016/j.bios.2017.10.047. [DOI] [PubMed] [Google Scholar]
- Li H. R. Li K. Dai Y. P. Xu X. Y. Cao X. Zeng Q. He H. Y. L. Pang L. J. Liang J. M. Chen X. L. Zhan Y. H. Nanomedicine. 2018;14:1867–1877. doi: 10.1016/j.nano.2018.04.018. [DOI] [PubMed] [Google Scholar]
- Sun W. J. Zhang J. L. Zhang C. C. Wang P. Peng C. Shen M. W. Shi X. Y. ACS Macro Lett. 2018;7:137–142. doi: 10.1021/acsmacrolett.7b00999. [DOI] [PubMed] [Google Scholar]
- Dubertret B. Skourides P. Norris D. J. Noireaux V. Brivanlou A. H. Libchaber A. Science. 2002;298:1759–1762. doi: 10.1126/science.1077194. [DOI] [PubMed] [Google Scholar]
- Gao J. H. Chen K. Miao Z. Ren G. Chen X. Y. Gambhir S. S. Cheng Z. Biomaterials. 2011;32:2141–2148. doi: 10.1016/j.biomaterials.2010.11.053. [DOI] [PMC free article] [PubMed] [Google Scholar]
- Albanese A. Tang P. S. Chan W. C. W. Annu. Rev. Biomed. Eng. 2012;14:1–16. doi: 10.1146/annurev-bioeng-071811-150124. [DOI] [PubMed] [Google Scholar]
- Kelkar S. S. Reineke T. M. Bioconjugate Chem. 2011;22:1879–1903. doi: 10.1021/bc200151q. [DOI] [PubMed] [Google Scholar]
Associated Data
This section collects any data citations, data availability statements, or supplementary materials included in this article.


