Abstract
The functionalization of halloysite nanotube (HNT) surfaces with aminosilanes is an important strategy for their further decoration with organic molecules to obtain hybrid inorganic–organic nanoarchitectures to be used in catalysis and drug delivery. The exact quantification of amino groups on the surface is an important aspect in view of the obtainment of systems with a known number of loaded molecules. In the present study, we describe a simple and reliable method for the correct quantification of groups present on HNT surfaces after their reaction with aminopropyltriethoxysilane (APTES). This method, applied for the first time to HNT chemistry, was based on the use of Fmoc groups as probes covalently bound to APTES and quantified by UV-Vis after release from the HNT–APTES–Fmoc system. Interestingly, this method showed great accordance with the already employed quantitative thermogravimetric analysis (TGA), with some benefits such as simple and non-destructive procedure, besides the possibility to monitor the deprotection reaction.
The functionalization of halloysite nanotube (HNT) surfaces with aminosilanes is an important strategy for their further decoration with organic molecules to obtain hybrid inorganic–organic nanoarchitectures to be used in catalysis and drug delivery.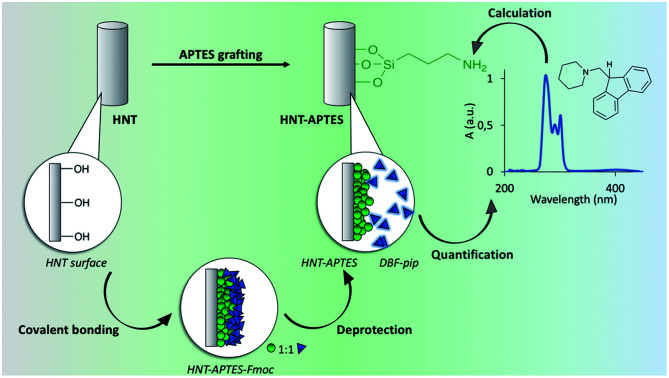
1. Introduction
Halloysite nanotubes (HNTs) are a natural nanomaterial with a peculiar hollow architecture, endowed with considerable mechanical strength and the possibility to be easily functionalized both in the inner and outer surface of their tubular structure. The chemical formula is Al2Si2O5(OH)4·nH2O, in which n indicates the number of water molecules present in the cell unit.1 In terms of crystallographic structure, halloysite nanoparticles are composed of two-layered tetrahedral silicate and octahedral aluminum hydroxide sheets separated by water molecules.2 Their unique hollow structure, site-reactivity and great surface area, porosity and biocompatibility render them, inter alia, ideal candidates for the development of nano-containers and carriers for drugs, corrosion inhibitors, active agents, metals etc.3 Within this context the functionalization with organosilanes is one of the most efficient method for loading HNTs with functional groups suitable for the formation of covalent bonds with active molecules. In this way, inorganic–organic systems are obtained in which organic molecules are bound more stably then those loaded by passive absorption on HNTs surface, thus overcoming the problem of poorly-controlled release of molecules loaded through weak interactions.4 Halloysite nanotubes functionalized with silanes have been used as a support for versatile applications in diverse scientific domains, such as for the adsorption of CO2 from the ambient atmosphere,5 for the coating and high-performance tumor cell capture6 or for enzymes immobilization and biosensing.7 Indeed, halloysite nanotubes have been successfully functionalized with various types of silanes,8 such as 3-azidopropyltrimethoxysilane,9 3-mercaptopropyltrimethoxysilane,10 γ-glycidoxypropyltrimethoxysilane,11 3-chloropropyltrimethoxysilane,12 3-aminomethyltrimethoxysilane13 and 3-aminopropyltriethoxysilane.14 In all these cases the silane residue is grafted on the HNTs surface while the second functional group, namely an azido, mercapto, epoxy, chloro and amine respectively remains available for the anchoring of the desired molecule. Up to date, a variety of techniques have been used for the qualitative characterization of halloysite modified with 3-aminopropyltriethoxysilane (APTES), such as FTIR,15ζ-potential,16 water contact angle17 and nitrogen adsorption Brunauer–Emmett–Teller (BET).18 On the contrary, the quantification of covalently attached APTES moieties on the surface of halloysite is restricted to only one indirect method, that is the destructive thermogravimetric analysis (TGA).19 Of course it is highly desirable to determine the exact number of free reactive amino groups, and hence the number of guest active molecules that could be loaded on the surface of HNT nanosystem. In addition, the possibility of loading on the same HNT different types of molecules in a controlled way could eventually allow the preparation of multivalent systems containing molecules with diverse properties. In this context, we have developed an easy and quantitative approach to define the number of primary amino functional groups present on APTES-functionalized halloysites. This method is based on the determination of the amount of Fmoc released by deprotection of HNT–APTES–Fmoc, that allows the quantification of deprotected amine groups of APTES moiety loaded on HNT. Herein, we describe how this has been realized through the use of the fluorenylmethyloxycarbonyl (Fmoc) method, an already used technique for measuring the loading of amine functional groups on solid supports such as for example silica nanoparticles,20 but never used in the case of naturally occurring HNTs. The method we have utilized gives superior advantages with respect to the already existing quantitative TGA analysis, since it is a simple, direct, nondestructive and low-cost technique that additionally allows to monitor in time the deprotection reaction.
2. Materials and methods
2.1. Materials
(3-Aminopropyl)triethoxysilane (APTES), pristine halloysite (HNT), toluene and anhydrous toluene, anhydrous dichloromethane (DCM), N,N-diisopropylethylamine (DIPEA) as well as ethanol (EtOH) were purchased from Sigma Aldrich and used without further purification. Fmoc chloride (Fmoc-Cl) was purchased from Fluka, while piperidine (pip) from Biosolve.
2.2. Preparation of HNT–APTES–Fmoc
Synthesis of (3-triethoxysilylpropyl)carbamic acid 9H-fluorenylmethyl ester (APTES–Fmoc)
The synthesis of APTES–Fmoc was performed according to K. Cheng et al. procedure.21 Specifically, 0.47 mL of APTES were dissolved in 10.68 mL of anhydrous DCM, under nitrogen atmosphere, while cooling and stirring. Then, 0.28 mL of DIPEA were added and a solution of 563 mg of Fmoc-Cl anhydrous DCM, was dropped. The reaction was kept under stirring at room temperature for 3.5 h, and the progress monitored by TLC (eluent: ethyl acetate : hexane 1 : 4). Then, the solvent was evaporated at reduced pressure, leaving a yellow oil. The product was purified by flash column chromatography with ethyl acetate/hexane 1 : 4, yielding to the formation of white rhombic solid (710 mg, 1.6 mmol, 74.8% yield). 1H NMR (300 MHz, CDCl3): δ 7.78 (d, J = 7.5 Hz, 2H), 7.62 (d, J = 7.5 Hz, 2H), 7.42 (t, J = 7.1 Hz, 2H), 7.33 (t, J = 7.4 Hz, 2H), 5.06 (broad s, 1H), 4.42 (d, J = 6.9 Hz, 2H), 4.24 (t, J = 6.8 Hz, 1H), 3.84 (q, J = 7.0 Hz, 6H), 3.23 (dd, J = 12.9 Hz, 2H), 1.76–1.51 (m, 2H), 1.25 (t, J = 7.0 Hz, 9H), 0.76–0.58 (m, 2H). Melting point: 81 °C. The product was also characterized with Kaiser test, FTIR and TGA analysis.
Halloysite nanotubes functionalization with APTES–Fmoc
217 mg of APTES–Fmoc were dissolved in 6.73 mL of anhydrous toluene, under nitrogen atmosphere. Next, 216.52 mg of pristine halloysite clay were added to the solution and the reaction was stirred for 20 h at room temperature. After this time the reaction mixture was centrifuged and the powder was washed ten times with fresh portions of toluene and finally dried in air for few days. Next, the dry powder was examined with Kaiser test, FTIR and TGA analysis.
Fmoc deprotection from HNT–APTES–Fmoc
Five samples of 6 mg each of HNT–APTES–Fmoc powder were suspended in 2 mL of a 20% solution of piperidine in EtOH and stirred for 1, 2, 3, 4 and 5 h respectively. Next, mixtures were centrifuged at 45 000 rpm. for 10 minutes. Then supernatants were separated from precipitates and characterized with UV-Vis spectrophotometer. Precipitated powders were washed extensively with 1 M aqueous solution of ammonium chloride and dried in air, to be further characterized. Washed and dried powders after the deprotection reaction were examined with Kaiser test and FTIR.
2.3. Characterization of HNT nanosystem
Kaiser tests were performed using Kaiser test kit (Sigma Aldrich) and its standard protocol. Briefly, 1 mg of the powder under analysis was suspended in 1.5 mL of Kaiser solution in a glass tube and heated up for 1 minute at 100 °C. The IR spectra were recorded on powders using ATR Fourier Transform Infrared (FTIR) spectrometer (PerkinElmer spectrum 100) in the transmittance mode, in the range of 4000–500 nm. Thermogravimetric analysis (TGA) was conducted using Mettler-Toledo Stare System TGA/DSC3+ instrument, heating the sample in a crucible from 30.0–900.0 °C at the rate 5 K min−1 in air. The characterization of supernatants was done using spectrophotometer (500 Evolution Thermo Electron Corporation) on their absorbance values at 290 nm, when placed in quartz cuvettes of 1 cm light path.
3. Results and discussion
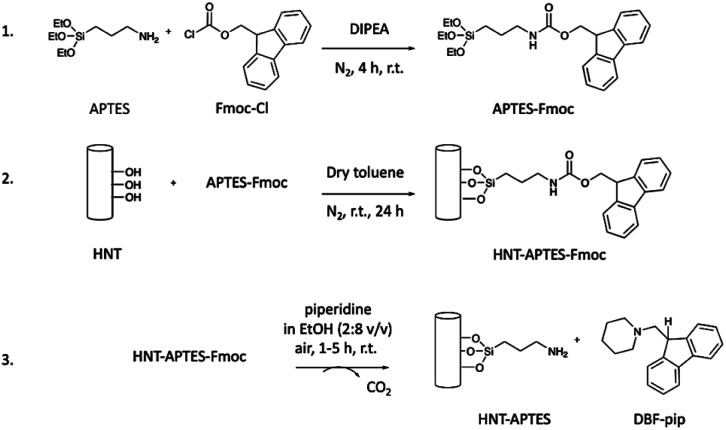
The method set up for the quantification of free primary amino groups loaded on the HNTs surface consisted of (i) grafting of APTES–Fmoc molecule on pristine HNTs; (ii) removal and quantification of Fmoc protecting group. The amount of released Fmoc should correspond to the number of amino groups on the HNTs surface. In particular, we prepared (3-triethoxysilylpropyl)carbamic acid 9H-fluorenylmethyl ester (APTES–Fmoc) following a procedure reported elsewhere (step 1, Scheme 1).21
Scheme 1. Preparation of HNT–APTES–Fmoc nanoconstruct and Fmoc release: (1) synthesis of APTES–Fmoc; (2) functionalization of pristine halloysite nanotubes with APTES–Fmoc; (3) release of Fmoc from HNT–APTES–Fmoc.
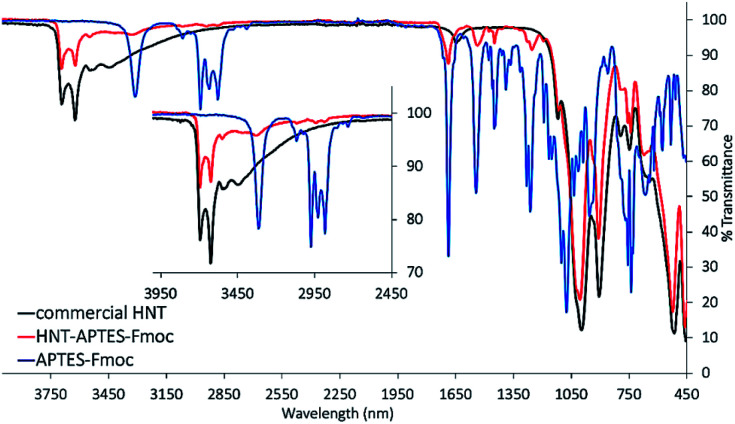
In the next step, APTES–Fmoc was reacted with pristine halloysite nanotubes, forming the new nanosystem HNT–APTES–Fmoc (step 2, Scheme 1). To reach a high degree of silanization, we applied the temperature-optimized protocol for halloysite functionalization with silanes.22 The hydroxyl groups on HNT surface reacted with APTES–Fmoc, immobilizing the organosilane moieties on the surfaces of nanoparticles.23 The characterization of the new HNT–APTES–Fmoc system was performed with Kaiser test, FTIR and thermogravimetric analysis. As expected, HNT–APTES–Fmoc showed a negative output of qualitative Kaiser test indicating that no free amino groups were present on the HNTs surface (cf. ESI, Photograph 1†). The test also indicated that the APTES–Fmoc moiety was stable under the reaction conditions used to functionalize nanoparticles. The FTIR of HNT–APTES–Fmoc turned out to be an easy and useful method to verify the presence of APTES–Fmoc on the NP's surface (Fig. 1). In particular, diagnostic bands of APTES–Fmoc appeared in HNTs spectral window at 3320 nm, 2975–2885 nm, 1689 nm, 1547 nm, 1452 nm, 1077 nm and 1194 nm.24
Fig. 1. FTIR spectra superposition of pristine HNT (black), APTES–Fmoc (blue), and HNT–APTES–Fmoc (red). Inset magnifying the bands at 4000–2450 nm wavelength range.
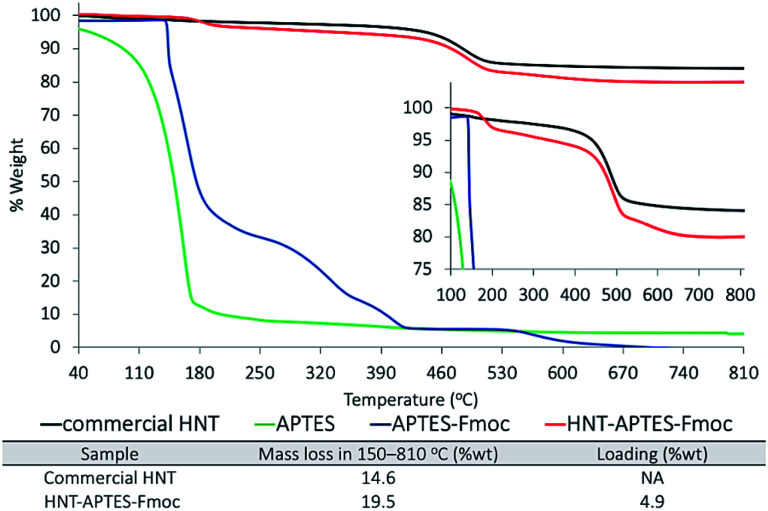
The thermogravimetric analysis of APTES–Fmoc showed four degradation bands in-between 40–810 °C temperature range (Fig. 2). The first one in between 142–270 °C corresponded to degradation of aromatic part of Fmoc molecule and of three ethoxy groups (68 %wt loss). The second one in between 270–348 °C corresponded to degradation of –NH–CO2–CH2– (15 %wt). The third one, temperature range 348–389 °C attributable to the Si degradation (6 %wt). The fourth one detected in between 389–670 °C corresponded to aliphatic chain degradation. The TGA plot of pristine HNT showed initial slight mass loss, due to evaporation of loosely bonded water from the surface of halloysite tubes and the interlayer water molecules present in between the bi-layer of HNT. The degradation band at ∼400 °C corresponded to dehydroxylation of halloysite. At this temperature HNTs hydroxyl groups are degraded, leading to the formation of alumina-rich phase, namely γ-Al2O3 (<5 nm) (∼900–1000 °C).25 TGA analysis of HNT–APTES–Fmoc showed characteristic degradation bands of both components: nanoparticle and APTES–Fmoc. We have distinguished degradation band in 150–208 °C temperature region, which potentially refers to degradation of aromatic part of incorporated APTES–Fmoc. The band in the range 208–420 °C, can be attributed to degradation of –NH–CO2–CH2– and organosilane moiety. Bands from 420 °C to 527 °C are related to the degradation of HNTs hydroxyl groups and the band between 527–670 °C referred to degradation of APTES–Fmoc aliphatic chain. The overall mass loss in-between 40–810 °C was calculated to be 19.5 %wt and corresponded to 4.9 %wt of APTES–Fmoc incorporation on halloysite.
Fig. 2. TGA spectra superposition of APTES (green), APTES–Fmoc (blue), commercial HNT (black) and formed HNT–APTES–Fmoc (red).
As reported in step (3) of Scheme 1, the Fmoc group was removed from HNT–APTES–Fmoc nanoconstruct by treatment with a 20% solution of piperidine in EtOH (step 3, Scheme 1).20 The Fmoc moiety was released in solution in the form of dibenzofulvene–piperidine adduct (DBF–pip) (cf. ESI, Scheme 1†). Taking into account the complex structure of halloysite nanoparticles that could slow down the kinetics of deprotection, we have monitored the Fmoc removal during a period of 5 h to find the optimal conditions. In fact, halloysite nanotubes possess aluminol groups directed inside its cavity and less reactive silanol bridges on its outer surface. The edges of nanotubes and surface's defects contain silanol and aluminol groups.26 Halloysite functionalization with silanes takes place both on the outer and in the inner surfaces with the preferential grafting on more reactive inner lumen.27 Thus, we took into account the potential slow down of Fmoc release and its diffusion retardation from sterically hidden cavity, thus studied kinetics of deprotection in the time interval of 1–5 h. Five HNT–APTES–Fmoc samples were mixed separately with an excess of 20% solution of piperidine in EtOH at room temperature. The first sample was checked after 1 h, the second after 2 h, the third after 3 h, the fourth 4 h, and the fifth sample after 5 h. Each of the five supernatant solutions containing DBF–pip were separated from HNT–APTES by centrifugation. The quantification of DBF–pip in each solution was performed by means of UV-Vis absorption spectrophotometry. The absorbance at 290 nm was used to calculate the concentration of DBF–pip in the five solutions (Table 1).
Quantification of released Fmoc adduct in time.
| Time of conducted release (h) | n DPBF–pip released (mmol) | % Released DBF–pip |
|---|---|---|
| 1 | 0.0027 | 66 |
| 2 | 0.0036 | 88 |
| 3 | 0.0039 | 95 |
| 4 | 0.0038 | 93 |
| 5 | 0.0040 | 98 |
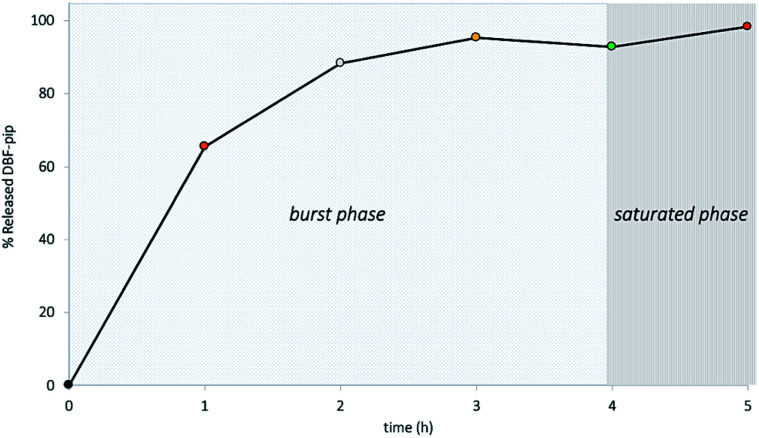
The calibration curve was prepared using known concentrations of Fmoc-Cl (0.06–0.14 mol L−1) in piperidine solution (20% in EtOH) (cf. ESI, Fig. 1a and b†). In the first sample checked after 1 h of reaction, the 66% of DBF–pip resulted to be released from HNT–APTES–Fmoc nanosystem (Fig. 3). The amount of DBF–pip reached the 88%, the 95% and 98% after 2, 3 hours and 5 h respectively. This result indicates that the Fmoc deprotection from halloysite support requires 4–5 h to be completed. From the amount of released DBF–pip we calculated the loading of APTES on HNTs which resulted to be 0.014 mmol/100 mg, corresponding to 4.9 %wt of organic mass. This value is perfectly in accord with the one obtained from TGA analysis of HNT–APTES (Fig. 2).
Fig. 3. Percentage of released Fmoc adduct in time.
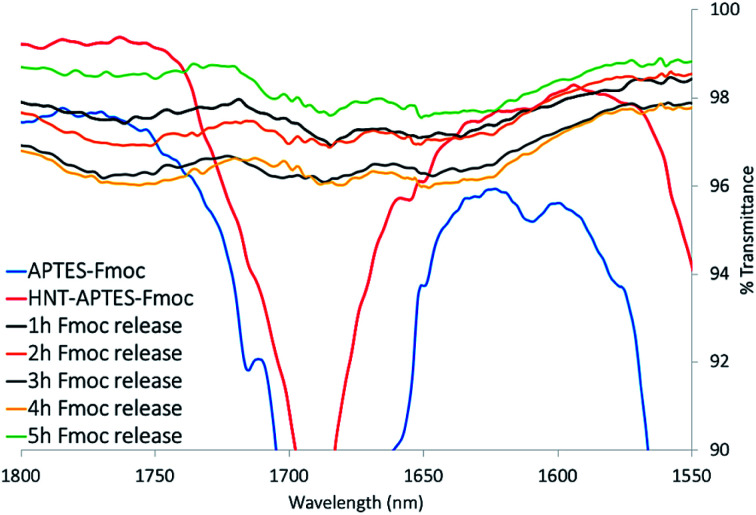
Each of the five samples of HNT–APTES obtained after centrifugation (step 3 in Scheme 1) was washed several times with an excess of 1 M aqueous solution of NH4Cl and dried in air. As expected, their characterization with FTIR technique showed the disappearance of diagnostic band positioned at 1689 nm (Fig. 4). Mentioned IR band was attributed to the cleavage of carbamate bond between HNT–APTES and Fmoc adduct. Parallelly executed Kaiser test of all analyzed powders resulted positive, thus indicated the presence of deprotected primary amino groups already after the first hour of pending the deprotection reaction (cf. ESI, Photograph 2†).
Fig. 4. FTIR spectra superposition of APTES–Fmoc (red), HNT–APTES–Fmoc (blue) and powder after deprotection reaction, which lasted: 1 h (black), 2 h (orange), 3 h (grey), 4 h (yellow) and 5 h (green).
4. Conclusions
In this study we set up a method to quantify the number of primary amino groups in HNT–APTES system. Following a non-destructive procedure, we have quantified the DBF–pip released in solution after removal of Fmoc from HNT–APTES–Fmoc nanoconstruct. The validation of this method comes from the comparison with the TGA of HNT–APTES: in both cases we found the same loading value of APTES on HNTs, that is 0.014 mmol of primary amino groups per 100 mg of HNT–APTES. This is the first example of non destructive quantification of amino groups loaded on halloysite nanotubes. Thanks to the slow rate of Fmoc deprotection reaction from HNT–APTES–Fmoc, it might be in principle possible to tune the deprotection to obtain halloysite nanotubes loaded with both free and protected amino groups, convenient to load different types of molecules on the same HNT. In this way the loading of molecules with different functions could be realized.
Conflicts of interest
There are no conflicts to declare.
Supplementary Material
Acknowledgments
K. F. acknowledges Università degli Studi di Milano for supporting her PhD thesis with a fellowship.
Electronic supplementary information (ESI) available. See DOI: 10.1039/d0ra01994a
References
- Abdullayev E. Lvov Y. J. Nanosci. Nanotechnol. 2011;11:1007–10026. doi: 10.1166/jnn.2011.5724. [DOI] [PubMed] [Google Scholar]
- Meunier A., Clays, Springer, Poitiers, France, 2005 [Google Scholar]
- Kamble R. Ghag M. Gaikawad S. Kumar Panda B. J. Adv. Sci. Res. 2012;3:25–29. [Google Scholar]
- Yuan P. Southon P. Liu Z. Green M. Hook J. Antill S. Kepert C. J. Phys. Chem. C. 2008;112:15742–15751. doi: 10.1021/jp805657t. [DOI] [Google Scholar]
- Jana S. Das S. Gosh C. Maity A. Pradhan M. Sci. Rep. 2015;5:8711. doi: 10.1038/srep08711. [DOI] [PMC free article] [PubMed] [Google Scholar]
- He R. Liu M. Long Y. Zho C. J. Mater. Chem. B. 2017;5:1712–1723. doi: 10.1039/C6TB02538B. [DOI] [PubMed] [Google Scholar]
- Kumar-Krishnan S. Hernandez-Rangel A. Pal U. Ceballos-Sanchez O. Flores-Ruiz F. J. Prokhorov E. Arias de Fuentes O. Esparza R. Meyyappan M. J. Mater. Chem. 2016;4:2533–2560. doi: 10.1039/C6TB00051G. [DOI] [PubMed] [Google Scholar]
- Massaro M. Cavallaro G. Colletti C. Lazzara G. Milioto S. Noto R. Riela S. J. Mater. Chem. B. 2018;6:3415–3433. doi: 10.1039/C8TB00543E. [DOI] [PubMed] [Google Scholar]
- Riela S. Massaro M. Coletti C. Bommarito A. Giordano C. Milioto S. Noto R. Paoma P. Lazzara G. Int. J. Pharm. 2014;475:613–623. doi: 10.1016/j.ijpharm.2014.09.019. [DOI] [PubMed] [Google Scholar]
- Massaro M. Riela S. Cavallaro G. Gruttadauria M. Milioto S. Noto R. Lazzara G. J. Organomet. Chem. 2014;749:410–415. doi: 10.1016/j.jorganchem.2013.10.044. [DOI] [Google Scholar]
- Hou Y. Jiang J. Li K. Zhang Y. Liu J. J. Phys. Chem. 2014;118:1962–1967. doi: 10.1021/jp411610a. [DOI] [PubMed] [Google Scholar]
- Cao X. Showkat A. Woo K. Tae J. Su K. Taek L. J. Nanosci. Nanotechnol. 2015;15:8617–8621. doi: 10.1166/jnn.2015.11482. [DOI] [PubMed] [Google Scholar]
- Zhang J. Zhang D. Zhang A. Jia Z. Jia D. Iran. Polym. J. 2013;22:501–510. doi: 10.1007/s13726-013-0151-5. [DOI] [Google Scholar]
- Yuan P. Southon P. Liu Z. Green M. Hook J. Antill S. Kepert C. J. Phys. Chem. C. 2008;112:15742–15751. doi: 10.1021/jp805657t. [DOI] [Google Scholar]
- Szpilska K. Czaja K. Kudła S. Polimery. 2015;60:360–371. doi: 10.14314/polimery.2015.359. [DOI] [Google Scholar]
- Mingyi G. Aifei W. Faheem M. Wenxiu Q. Hao R. Yingjie G. Guangshan Z. Chin. J. Chem. 2012;30:2115–2120. doi: 10.1002/cjoc.201200657. [DOI] [Google Scholar]
- Bhagabati P. Chaki T. Khastgir D. Ind. Eng. Chem. Res. 2015;54:6698–6712. doi: 10.1021/acs.iecr.5b01043. [DOI] [Google Scholar]
- Kim J. Rubino I. Lee J.-Y. Choi H.-J. Mater. Res. Express. 2016;3:1–12. [Google Scholar]
- Li H. Zhu X. Xu J. Peng W. Zhong S. Wang Y. RSC Adv. 2016;6:54463–54470. doi: 10.1039/C6RA09599B. [DOI] [Google Scholar]
- Chen Y. Zhang Y. Anal. Bioanal. Chem. 2011;399:2503–2509. doi: 10.1007/s00216-010-4622-7. [DOI] [PubMed] [Google Scholar]
- Cheng K. Landry C. J. Am. Chem. Soc. 2007;129:9674–9685. doi: 10.1021/ja070598b. [DOI] [PubMed] [Google Scholar]
- Yuan P. Southon P. Liu Z. Kepert C. Nanotechnology. 2012;23:1–5. doi: 10.1088/0957-4484/23/37/375705. [DOI] [PubMed] [Google Scholar]
- Barrientos-Raamirez S. Montes de Oca-Ramirez G. Ramos-Fernández E. Sepulveda-Escribano A. Pastor-Blas M. Gonzalez-Montiel A. Appl. Catal., A. 2011;406:22–33. doi: 10.1016/j.apcata.2011.08.003. [DOI] [Google Scholar]
- Coates J., Interpretation of Infrared Spectra, A Practical Approach, Newton, USA, Wiley Online Library, 2006 [Google Scholar]
- Yuan P. Tan D. Annabi-Bergaya F. Appl. Clay Sci. 2015;112–113:75–93. doi: 10.1016/j.clay.2015.05.001. [DOI] [Google Scholar]
- Ressam I. El Kadib A. Lahcini M. Luinstra G. Perrot H. Sel O. Int. J. Hydrogen Energy. 2018;43:18578–18591. doi: 10.1016/j.ijhydene.2018.05.025. [DOI] [Google Scholar]
- Tan D., Yuan P., Liu D. and Du P., Surface and Interface Chemistry of Clay Minerals, ed. R. Schoonheydt, C. T. Johnston and F. Bergaya, Elsevier, Netherlands, 2006, vol. 9, pp. 167–201 [Google Scholar]
Associated Data
This section collects any data citations, data availability statements, or supplementary materials included in this article.


