

ABSTRACT
Background:
Both visceral adiposity index (VAI) and lipid accumulation product (LAP) can be used to assess insulin resistance (IR) and metabolic syndrome (MetS) which are required for management of even lean polycystic ovary syndrome (PCOS) (body mass index [BMI] <23 kg/m2).
Aim:
This study was aimed to see the magnitude of associations of VAI and LAP with cardiometabolic risk factors including IR and MetS in lean PCOS.
Study Setting and Design:
This cross-sectional study was done amongst 62 newly detected lean PCOS patients and 58 age- and BMI-matched healthy controls.
Materials and Methods:
PCOS was diagnosed according to the Revised 2003 Rotterdam Consensus criteria. Along with relevant clinical data, fasting blood was taken to measure glucose, insulin and lipid profile by glucose oxidase, chemiluminescent microparticle immunoassay and by glycerol phosphate dehydrogenase-peroxidase method, respectively. IR was calculated by homeostasis model of IR (HOMA-IR). VAI and LAP were calculated from BMI, waist circumference, triglyceride and high-density lipoprotein cholesterol by using sex-specific formulae.
Statistical Analysis Used:
Linear and binary regression analyses and receiver operating characteristics curve (ROC) analyses were done as appropriate.
Results:
Only LAP had predictive associations with age, systolic and diastolic blood pressure and total and low-density lipoprotein cholesterol. Both VAI and LAP had predictive associations with history of subfertility and MetS. LAP had moderate discriminating index for IR with cut-off of HOMA-IR of 2.3. Both VAI and LAP had excellent discriminating index for MetS in lean PCOS patients.
Conclusions:
LAP had more associations with cardiometabolic risks than VAI and was a moderate discriminator of IR in lean PCOS.
KEYWORDS: Insulin resistance, lean polycystic ovary syndrome, lipid accumulation product, metabolic syndrome, visceral adiposity index
INTRODUCTION
Polycystic ovary syndrome (PCOS) is a heterogeneous disorder affecting mostly young reproductive aged women with an increasing incidence than assumed.[1] Besides reproductive and cutaneous manifestations, it can increase the risk of metabolic complications such as insulin resistance (IR), type 2 diabetes mellitus (DM), metabolic syndrome (MetS) and cardiovascular (CV) disease (CVD). Obesity is largely thought to be associated with these metabolic abnormalities, which affect around half of PCOS women.[2] On the other hand, the metabolic characteristics of PCOS patients who are not obese, are debatable. After adjusting for body mass index (BMI), some researchers have shown that patients with PCOS are still at risk for metabolic dysfunctions.[3] In addition, a previous meta-analysis found a higher prevalence of impaired glucose tolerance and MerS in women with PCOS relative to BMI-matched controls, particularly in lean women (BMI <25 kg/m2).[4]
CVDs are leading causes of deaths which were approximately 35% of the total deaths in Asia. It is well established that CVD risk depends on several factors such as lifestyle, ethnicity, genetic, intrauterine and environmental factors, but it is debatable whether all PCOS phenotypes are at high CVD risk. Obesity (particularly visceral adiposity) and PCOS jointly increase the early atherosclerosis and CV mortality.[5] The visceral adiposity is responsible for IR and hyperandrogenaemia, the two most important component in the pathophysiology of PCOS.[6]
Hyperinsulinaemic euglycaemic clamp method is the gold standard to assess IR.[7] In spite of its precision, this index is difficult to evaluate in clinical practice because it is expensive and time-consuming to adapt in vast populations. Alternative indexes have recently gained popularity as methods for identifying IR because of their efficiency and low cost. The lipid accumulation product (LAP) and the visceral adiposity index (VAI) have thus been proposed as credible markers of IR and CV risk in general population, as well as for PCOS women.[8,9,10] However, their cut-off values are different depending on different study populations. LAP and VAI are also responsive indicators of central visceral obesity and adipocyte function estimators. Besides, the central fat distribution pattern is related to IR and linked to metabolic disorders and dyslipidaemia; it plays an important role in cardiometabolic risk estimation.[11]
Obese women have a clustering of coexisting risk factors, such as MetS components, that aids in the early detection of metabolic abnormalities; but, risk identification using standard CV risk factors may be challenging in lean patients. LAP and VAI are more effective in predicting IR and MetS compared with traditional anthropometric parameters.[12] However, these were mostly studied in PCOS population as a whole or with a BMI of <25 kg/m2. For Asian population, the lean population should be considered with the BMI cut-off of 23 kg/m2. Currently, studies evaluating the cardiometabolic risk factors in lean PCOS are lacking. The objective of the present study was to evaluate the associations of VAI and LAP with metabolic parameters and their utility as markers of IR and MetS in lean PCOS patients.
SUBJECTS AND METHODS
This cross-sectional study was done in the Department of Endocrinology of a university hospital over a period of 2 years. Considering this formula (n = [Z2 × p × q] ÷ d2), the minimum number of sample size was ~39.[13] This study included 62 newly detected lean (BMI <23 kg/m2) PCOS patients of 16–30 years and 58 age- and BMI-matched healthy controls. The study was conducted in accordance with the ethical principles mentioned in the Declaration of Helsinki. The study protocol was approved by the Institutional Review Board of Bangabandhu Sheikh Mujib Medical University (No. BSMMU/2016/2566). Informed written consent was taken from each participant.
PCOS was diagnosed according to the Revised 2003 Rotterdam Consensus criteria (two out of the following three: oligo/anovulation, clinical and/or biochemical signs of hyperandrogenism and polycystic ovaries by ultrasonography along with exclusion of similar diseases by appropriate clinical and hormonal investigations).[14] Participants with regular menstrual cycle with insignificant hirsutism (modified Ferriman–Gallwey score <8) and normal total testosterone (≤46 ng/dL) were included as healthy control. Relevant history (personal and family history) was taken and physical examinations (height, weight, waist circumference [WC] and blood pressure [BP]) were done for each participant. History of subfertility defined as 1 year of unwanted non-conception with unprotected intercourse in the fertile phase of the menstrual cycles.[15] Participants taking oral contraceptive within the last 3 months and having BMI ≥23 kg/m2 were excluded. Fasting blood was taken to measure glucose, insulin and lipid profile. Glucose was measured by glucose oxidase, insulin by chemiluminescent microparticle immunoassay and lipid by glycerol phosphate dehydrogenase-peroxidase method. IR was measured by homeostasis model of IR (HOMA-IR = [fasting insulin in μIU/ml × fasting plasma glucose (FPG) in mmol/L] ÷ 22.5).[16] IR was considered with HOMA-IR ≥2.3.[17] MetS was diagnosed by presence of any three of the five following criteria: WC ≥80 cm, elevated BP ≥130/85 mmHg, elevated FPG ≥5.6 mmol/L, elevated triglyceride (TG) ≥150 mg/dl and low high-density lipoprotein cholesterol (HDL-C) <50 mg/dl.[18] VAI and LAP were calculated from BMI, WC, TG and HDL-C by using sex-specific following formulae:
VAI for female = (WC in cm ÷ [39.68 + (1.88 × BMI)]) × (TG in mmol/L ÷ 0.81) × (1.52 ÷ HDL-C in mmol/L)[9]
LAP for female = (WC in cm – 58) × TG in mmol/L.[19]
Statistical analysis
Data were expressed as median (interquartile range), IQR or frequency (percentages, %) as appropriate. Comparison between groups was done by Mann–Whitney U-test or Pearson's Chi-square/Fisher's exact test. Multivariate linear regression of the manifestations with VAI and LAP as independent variable was done. Predictive associations of VAI and LAP (independent variables) with manifestations of PCOS (dependent variable) were analysed by binary logistic regression. Receiver operating characteristic (ROC) curve analyses were done to see the discriminating index of VAI, LAP along with BMI and WC for IR and MetS amongst patients with lean PCOS. A two-tailed P < 0.05 was set as statistically significant. We used SPSS software 22.0 version for statistical analysis of data (Armonk, NY: IBM Corp).
RESULTS
Figure 1 shows the diagnostic characteristics and phenotypes of lean PCOS patients. The frequency of phenotype A was 33.9%, followed by phenotype C (29.0%), then phenotype B (21.0%) and at last phenotype D (16.1%).
Figure 1.
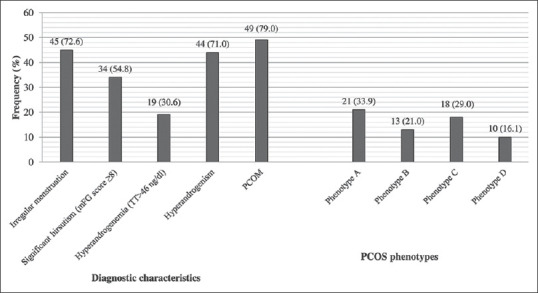
Diagnostic characteristics and phenotypes of lean polycystic ovary syndrome patients
The characteristics of the study population are shown in Table 1. History of subfertility (P = 0.034) history of PCOS (P < 0.001), obesity (P < 0.001) and DM (P < 0.001) were significantly higher in the lean PCOS group than control. The PCOS group had significantly more metabolic abnormalities than the control group (central obesity: P = 0.021; high BP: P = 0.033; impaired fasting glucose: P = 0.006; hypertriglyceridaemia: P = 0.017; MetS: P = 0.009; IR: P < 0.001) except for low HDL-C. Similarly, total cholesterol (TC) (mg/dl) (P = 0.001), low-density lipoprotein cholesterol (LDL-C) (mg/dl) (P = 0.001), FPG (mmol/L) (P = 0.001), fasting insulin (μIU/ml) (P < 0.001) and HOMA-IR (P < 0.001) all were significantly higher in the PCOS group than control. Other variables including VAI and LAP were statistically similar between the groups (P = NS for all).
Table 1.
Characteristics of patients with lean polycystic ovary syndrome
| Variables | Frequency (%) | P* | |
|---|---|---|---|
|
| |||
| PCOS (n=62) | Control (n=58) | ||
| Menstrual regulation/abortion | 2 (3.2) | 2 (3.4) | 0.665 |
| Subfertility | 5 (12.2) [41] | 0 (0.0) [47] | 0.019 |
| F/H of PCOS | 18 (29.0) | 0 (0.0) | <0.001 |
| F/H of subfertility | 15 (24.2) | 4 (6.9) | 0.008 |
| F/H of obesity | 29 (46.8) | 9 (15.5) | <0.001 |
| F/H of DM | 37 (59.7) | 16 (27.6) | <0.001 |
| Centrally obese (WC ≥80 cm) | 14 (22.6) | 4 (6.9) | 0.021 |
| High blood pressure (≥130/85 mmHg) | 8 (12.9) | 1 (1.7) | 0.033 |
| Impaired fasting glucose (≥5.6 mmol/L) | 8 (12.9) | 0 (0.0) | 0.006 |
| Hypertriglyceridaemia (≥150 mg/dl) | 11 (17.7) | 2 (3.4) | 0.017 |
| Low HDL-C (<50 mg/dl) | 47 (75.8) | 43 (74.1) | 1.00 |
| MetS | 10 (16.1) | 1 (1.7) | 0.009 |
| Insulin resistance (HOMA-IR ≥2.6) | 31 (50.0) | 3 (5.2) | <0.001 |
|
| |||
| Variables | Median (IQR) | P** | |
|
| |||
| Age (years) | 21.0 (18.0-24.0) | 21.0 (20.75-24.25) | 0.073 |
| BMI (kg/m2) | 21.38 (20.18-22.61) | 20.73 (19.49-21.90) | 0.057 |
| WC (cm) | 74.0 (70.0-80.25) | 72.0 (69.0-76.0) | 0.081 |
| Systolic blood pressure (mmHg) | 110.0 (100.0-120.0) | 110.0 (100.0-110.0) | 0.559 |
| Diastolic blood pressure (mmHg) | 70.0 (60.0-80.0) | 70.0 (60.0-76.25) | 0.091 |
| Serum TC (mg/dl) | 167.0 (152.0-192.0) | 150.5 (137.0-176.50) | 0.001 |
| Serum LDL-C (mg/dl) | 107.0 (92.75-124.40) | 90.50 (79.10-109.10) | 0.001 |
| Serum HDL-C (mg/dl) | 44.0 (36.0-49.25) | 44.50 (39.0-51.0) | 0.358 |
| Serum TG (mg/dl) | 97.0 (66.75-132.0) | 85.0 (62.75-115.25) | 0.112 |
| TG/HDL-C ratio | 2.36 (1.47-3.19) | 1.94 (1.43-2.67) | 0.126 |
| VAI | 1.93 (1.16-2.58) | 1.56 (1.10-2.16) | 0.109 |
| LAP | 16.74 (9.64-30.34) | 13.01 (9.23-19.20) | 0.078 |
| FPG (mmol/L) | 4.75 (4.38-5.37) | 4.05 (3.67-4.80) | 0.001 |
| TT (ng/dl) | 33.37 (23.76-55.40) | 27.38 (21.95-36.56) | 0.066 |
| LH/FSH ratio | 1.58 (1.04-2.72) | Not done | |
| Fasting insulin (µIU/ml) | 13.04 (9.08-17.95) | 8.0 (6.28-9.85) | <0.001 |
| HOMA-IR | 2.89 (1.87-3.96) | 1.50 (1.08-2.02) | <0.001 |
*Pearson’s Chi-Square test/Fisher’s exact test was done as appropriate, **Mann–Whitney U test was done. Within parentheses are percentages over column total for qualitative variables. [eligible number]. DM: Diabetes mellitus, F/H: Family history, PCOS: Polycystic ovary syndrome, MetS: Metabolic syndrome, BMI: Body mass index, WC: Waist circumference, TC: Total cholesterol, LDL-C: Low-density lipoprotein cholesterol, HDL-C: High-density lipoprotein cholesterol, TG: Triglyceride, VAI: Visceral adiposity index, LAP: Lipid accumulation product, FPG: Fasting plasma glucose, TT: Total testosterone, LH: Luteinising hormone, FSH: Follicle-stimulating hormone, HOMA-IR: Homeostasis model assessment of insulin resistance, IQR: Interquartile range
In the lean PCOS group, age (P = 0.027), diastolic BP (P = 0.022), TC (P = 0.006), LDL-C (P = 0.039) and HOMA-IR (P = 0.002) were only weakly correlated with LAP. Only systolic BP was significantly and weakly correlated with both VAI (P = 0.029) and LAP (P = 0.001). All correlations were in positive direction. Multivariate linear regression analysis showed that age (P = 0.004), systolic (P = 0.001) as well as diastolic BP (P = 0.046), TC (P = 0.002) and LDL-C (P = 0.029) had predictive association only with LAP [Table 2].
Table 2.
Correlation and multivariate linear regression analysis of manifestations of polycystic ovary syndrome with visceral adiposity index and lipid accumulation product (independent variables)
| Dependent variables | Spearman’s correlation test | Linear regression analysis | ||||||||
|---|---|---|---|---|---|---|---|---|---|---|
|
|
|
|||||||||
| VAI | LAP | VAI | LAP | |||||||
|
|
|
|
|
|||||||
| r | P | r | P | B | β | P | B | β | P | |
| Age (years) | −0.02 | 0.879 | 0.280 | 0.027 | 0.184 | 0.061 | 0.638 | 0.07 | 0.358 | 0.004 |
| mFG score | 0.134 | 0.298 | 0.126 | 0.327 | 0.236 | 0.062 | 0.632 | 0.030 | 0.122 | 0.345 |
| Systolic blood pressure (mmHg) | 0.278 | 0.029 | 0.412 | 0.001 | 1.872 | 0.178 | 0.166 | 0.280 | 0.414 | 0.001 |
| Diastolic blood pressure (mmHg) | 0.134 | 0.300 | 0.290 | 0.022 | 0.323 | 0.041 | 0.753 | 0.129 | 0.254 | 0.046 |
| FPG (mmol/L) | −0.138 | 0.283 | 0.01 | 0.940 | −0.152 | −0.118 | 0.361 | 0.005 | 0.060 | 0.645 |
| TC (mg/dl) | 0.114 | 0.379 | 0.343 | 0.006 | 1.550 | 0.045 | 0.727 | 0.837 | 0.379 | 0.002 |
| LDL-C (mg/dl) | 0.098 | 0.450 | 0.263 | 0.039 | 0.341 | 0.011 | 0.933 | 0.559 | 0.277 | 0.029 |
| LH/FSH ratio | 0.126 | 0.328 | −0.029 | 0.824 | −0.060 | −0.046 | 0.720 | −0.013 | −0.159 | 0.218 |
| TT (ng/dl) | −0.106 | 0.414 | −0.008 | 0.953 | −0.685 | −0.259 | 0.796 | 0.150 | 0.113 | 0.380 |
| HOMA-IR | 0.176 | 0.172 | 0.377 | 0.002 | 0.163 | 0.094 | 0.469 | 0.027 | 0.237 | 0.063 |
TC: Total cholesterol, LDL-C: Low-density lipoprotein cholesterol, VAI: Visceral adiposity index, LAP: Lipid accumulation product, FPG: Fasting plasma glucose, TT: Total testosterone, LH: Luteinising hormone, FSH: Follicle-stimulating hormone, HOMA-IR: Homeostasis model assessment of insulin resistance, mFG: modified Ferriman–Gallwey
Amongst the characteristics, both VAI and LAP had predictive associations with only history of subfertility (odds ratio, OR [95% confidence interval, CI] – VAI: 2.053 [1.083, 3.893], P = 0.028; LAP: 1.083 [1.019, 1.151], P = 0.010) and MetS (OR [95% CI] – VAI: 4.781 [1.947, 11.741], P = 0.001; LAP: 1.124 [1.050, 1.202], P = 0.001) in PCOS participants [Table 3].
Table 3.
Characteristics of the polycystic ovary syndrome population in relation to visceral adiposity index and lipid accumulation product (n=62)
| Variables | Groups, n (%) | VAI | LAP | ||||
|---|---|---|---|---|---|---|---|
|
|
|
||||||
| Median (IQR) | OR (95% CI) | P † | Median (IQR) | OR (95% CI) | P † | ||
| Menstrual cycle | Irregular, 45 (72.58) | 1.98 (1.20-2.55) | 0.815 (0.529-1.255) | 0.352 | 16.75 (9.57-29.85) | 1.007 (0.976-1.040) | 0.648 |
| Regular, 17 (27.42) | 1.89 (1.09-3.31) | 16.62 (8,81-31.55) | |||||
| Infertility (41) | Present, 5 (12.2) | 3.40 (1.33-5.86) | 1.960 (1.008-3.808) | 0.047 | 44.71 (27.17-92.86) | 1.072 (1.010-1.137) | 0.021 |
| Absent, 36 (87.8) | 1.98 (1.14-2.52) | 17.95 (11.31-29.72) | |||||
| Significant hirsutism (mFG score ≥8) | Present, 34 (54.84) | 1.98 (1.25-2.61) | 1.169 (0.766-1.785) | 0.469 | 17.31 (10.72-30.70) | 1.010 (0.982-1.038) | 0.482 |
| Absent, 28 (45.16) | 1.78 (1.02-2.65) | 16.33 (8.60-30.59) | |||||
| Polycystic ovary morphology | Present, 49 (79.03) | 1.89 (1.15-2.74) | 1.143 (0.665-1.962) | 0.629 | 16.12 (9.44-31.55) | 1.005 (0.971-1.040) | 0.769 |
| Absent, 13 (20.97) | 1.98 (1.13-2.34) | 18.74 (13.11-27.17) | |||||
| Hyperandrogenaemia TT >46 ng/dl | Present, 19 (30.65) | 1.25 (0.98-2.38) | 0.611 (0.339-1.100) | 0.100 | 12.42 (7.93-26.49) | 0.973 (0.937-1.011) | 0.167 |
| Absent, 43 (69.35) | 2.01 (1.26-2.91) | 18.74 (10.91-30.94) | |||||
| Altered LH/FSH ratio (>2.0) | Altered, 24 (38.71) | 1.93 (1.11-2.78) | 0.994 (0.657-1.505) | 0.978 | 16.68 (9.42-30.65) | 0.996 (0.970-1.024) | 0.796 |
| Normal, 38 (61.29) | 1.85 (1.18-2.51) | 17.31 (10.03-30.32) | |||||
| MetS | Unhealthy, 10 (16.13) | 3.45 (2.78-4.53) | 4.781 (1.947-11.741) | 0.001 | 48.05 (30.90-58.82) | 1.124 (1.050-1.202) | 0.001 |
| Healthy, 52 (83.87) | 1.56 (1.03-2.25) | 14.42 (8.76-24.18) | |||||
| Insulin resistance (HOMA-IR ≥2.3) | High, 31 (50.0) | 1.89 (1.02-2.78) | 0.906 (0.602-1.363) | 0.636 | 16.62 (5.96-29.56) | 0.992 (0.966-1.019) | 0.578 |
| Normal, 31 (50.0) | 1.98 (1.24-2.43) | 18.74 (12.42-32.37) | |||||
†Univariate binary logistic regression analysis of VAI and LAP as covariates [Eligible number]. VAI: Visceral adiposity index, LAP: Lipid accumulation product, TT: Total testosterone, LH: Luteinising hormone, FSH: Follicle-stimulating hormone, HOMA-IR: Homeostasis model assessment of insulin resistance, mFG: modified Ferriman–Gallwey, IQR: Interquartile range, OR: Odds ratio, CI: Confidence interval, MetS: Metabolic syndrome
ROC curve analysis showed that with a cut-off of HOMA-IR of 2.3, BMI, WC and LAP were moderate discriminators of IR in lean PCOS [Figure 2]. Another ROC curve analysis showed that WC (area under the curve [AUC] = 0.795) was a fair discriminator of MetS in lean PCOS. Both VAI (AUC = 0.915) and LAP (AUC = 0.912) had excellent discriminating index for MetS in lean PCOS patients [Figure 3].
Figure 2.

ROC curve analysis of visceral adiposity index and lipid accumulation product as discriminator of insulin resistance (cut-off of 2.3) in lean polycystic ovary syndrome
Figure 3.

ROC curve analysis of visceral adiposity index and lipid accumulation product as discriminator of metabolic syndrome in lean polycystic ovary syndrome
DISCUSSION
Our study shows that patients with lean PCOS had significantly more adverse cardiometabolic risk factors including IR and MetS than their BMI-matched controls. LAP had higher associations with several risk factors than VAI. Amongst different body fat indices, WC had the highest discriminating index for IR. On the other hand, both VAI and LAP had excellent discriminating indices for MetS in lean PCOS patients.
The incidence of IR (50%) in our study is similar to that observed in previous studies.[20,21] In an Indian study, Gupta et al. noticed a lower (36%) frequency of IR in lean PCOS subjects and it was significantly more than their healthy counterpart as observed in our study.[22] We did not find any significant difference of LAP and VAI indices in between cases and controls which is expected as BMI, WC and TG level were similar in both the groups. Rashidi et al. found results in agreement with us.[23] Whereas another study found significant differences of these markers when compared with obese counterpart.[24]
We found significant associations of LAP than VAI with different cardiometabolic risk factors. Previous studies also showed that LAP better correlated with hepatic steatosis, IR and other metabolic parameters than VAI.[25,26,27] Hence, LAP may be chosen first to screen cardiometabolic risk factors in lean PCOS patients. Association of VAI and LAP with subfertility may indicate the negative impact of metabolic factors on fertility.[28]
Different adiposity markers were investigated (WC, BMI, VAI and LAP) and their potentials to predict MetS in women with PCOS were assessed. When ROC curve for markers – WC, BMI, VAI and LAP – was plotted, LAP and VAI were found to possess the highest AUC value (0.91) with a cut-off value of 23.2 cm. mmol/L and 2.32, respectively, which was similar to another study.[29] LAP has earlier been reported to be a strong predictor of CVD with cut-off of 37.9 cm. mmol/L (sensitivity: 85.19%, specificity: 81.35%) by Nascimento et al. and 34.5 cm. mmol/L (sensitivity: 84%; specificity 79%) by Wiltgen et al. in women with PCOS which were more than our cut-off level as they included all BMI categories.[30,31] WC was also found to have significant ability to predict MetS in the present study with 84.7% specificity and 70% sensitivity, but AUC value (0.79) was less than LAP and VAI. In a Spanish adolescent population, waist–hip ratio was found to have the highest predictive value for MetS whereas WC was found to best predict MetS.[32] Our study also suggests WC (80.5 cm) with AUC value of 0.76, to be the second best predictor of MetS in PCOS women amongst all the adiposity markers studied.
IR is a prevalent finding women with PCOS and is thought to be an independent risk factor for CVD. In order to prevent CVD in young women with PCOS, early detection of the IR phenotype is required. IR is assessed using a variety of surrogate markers such as HOMA-IR, LAP, TG/HDL and others because the gold standard approach is not a feasible or cost-effective tool for epidemiological research. LAP and VAI have been proposed as two indicators that best predict IR and as effective markers for detecting cardiometabolic risk in women with PCOS in order to implement early intervention methods in clinical practice.[17] With IR cut-off of 2.3, BMI, WC and LAP were found moderate discriminator of IR, and amongst the three, WC was found to have significant relation to predict IR with a specificity of more than 90%. The cut-off of HOMA-IR may vary according to the body weight, and it is not yet well established in PCOS.[27] In a recent Indian study, Rashid et al. suggested that LAP can serve as a significant marker to predict IR in PCOS women where their cut-off was >2.0 where they included young PCOS women irrespective of BMI.[29] A large population-based study of Iran demonstrated that the LAP index and VAI were two indicators that best predict IR in women with PCOS, and amongst the healthy control, the two most reliable indicators were the LAP index and WC that had the optimum sensitivity of 78% and 75% and positive predictive value of 82% and 81%, respectively, where they used the HOMA cut-off at 2.3.[17] In our study, LAP was found to positively correlate with HOMA-IR. This indicates that LAP can serve as a reliable marker for assessing IR in PCOS women than other indices in lean phenotype. There are some limitations of this study. Our study population was recruited from a referral centre. We also could not measure serum progesterone and polycystic ovarian morphology in the control group.
In conclusion, lean PCOS patients have significantly more adverse cardiometabolic risk factors than their BMI-matched controls. These cardiometabolic risk factors had significant associations with LAP rather than VAI. The optimal adiposity markers and their optimal cut-off values may differ. However, the LAP index is a simpler metric than VAI and might be used to screen for cardiometabolic risks, especially IR and MetS in lean PCOS women.
Financial support and sponsorship
Partial funding from Research and Development, BSMMU, was used for the investigations of the study participants.
Conflicts of interest
There are no conflicts of interest.
Data Availability:
The data used for this study is available with and the authors are willind to share it upon reasonable request.
Acknowledgement
We would like to thank the Department of Microbiology and Immunology, BSMMU, for hormone analysis and Department of Biochemistry and Molecular Biology, BSMMU, for biochemical analysis.
REFERENCES
- 1.Rashidi H, Ramezani Tehrani F, Bahri Khomami M, Tohidi M, Azizi F. To what extent does the use of the Rotterdam criteria affect the prevalence of polycystic ovary syndrome? A community-based study from the Southwest of Iran. Eur J Obstet Gynecol Reprod Biol. 2014;174:100–5. doi: 10.1016/j.ejogrb.2013.12.018. [DOI] [PubMed] [Google Scholar]
- 2.Moran LJ, Norman RJ, Teede HJ. Metabolic risk in PCOS: Phenotype and adiposity impact. Trends Endocrinol Metab. 2015;26:136–43. doi: 10.1016/j.tem.2014.12.003. [DOI] [PubMed] [Google Scholar]
- 3.Morgan CL, Jenkins-Jones S, Currie CJ, Rees DA. Evaluation of adverse outcome in young women with polycystic ovary syndrome versus matched, reference controls: A retrospective, observational study. J Clin Endocrinol Metab. 2012;97:3251–60. doi: 10.1210/jc.2012-1690. [DOI] [PubMed] [Google Scholar]
- 4.Moran LJ, Misso ML, Wild RA, Norman RJ. Impaired glucose tolerance, type 2 diabetes and metabolic syndrome in polycystic ovary syndrome: A systematic review and meta-analysis. Hum Reprod Update. 2010;16:347–63. doi: 10.1093/humupd/dmq001. [DOI] [PubMed] [Google Scholar]
- 5.Shaw LJ, Bairey Merz CN, Azziz R, Stanczyk FZ, Sopko G, Braunstein GD, et al. Postmenopausal women with a history of irregular menses and elevated androgen measurements at high risk for worsening cardiovascular event-free survival: Results from the National Institutes of Health – National Heart, Lung, and Blood Institute sponsored Women's Ischemia Syndrome Evaluation. J Clin Endocrinol Metab. 2008;93:1276–84. doi: 10.1210/jc.2007-0425. [DOI] [PMC free article] [PubMed] [Google Scholar] [Retracted]
- 6.Vilmann LS, Thisted E, Baker JL, Holm JC. Development of obesity and polycystic ovary syndrome in adolescents. Horm Res Paediatr. 2012;78:269–78. doi: 10.1159/000345310. [DOI] [PubMed] [Google Scholar]
- 7.DeFronzo RA, Tobin JD, Andres R. Glucose clamp technique: A method for quantifying insulin secretion and resistance. Am J Physiol. 1979;237:E214–23. doi: 10.1152/ajpendo.1979.237.3.E214. [DOI] [PubMed] [Google Scholar]
- 8.Zheng SH, Li XL. Visceral adiposity index as a predictor of clinical severity and therapeutic outcome of PCOS. Gynecol Endocrinol. 2016;32:177–83. doi: 10.3109/09513590.2015.1111327. [DOI] [PubMed] [Google Scholar]
- 9.Amato MC, Giordano C, Galia M, Criscimanna A, Vitabile S, Midiri M, et al. Visceral adiposity index: A reliable indicator of visceral fat function associated with cardiometabolic risk. Diabetes Care. 2010;33:920–2. doi: 10.2337/dc09-1825. [DOI] [PMC free article] [PubMed] [Google Scholar]
- 10.Mazidi M, Kengne AP, Katsiki N, Mikhailidis DP, Banach M. Lipid accumulation product and triglycerides/glucose index are useful predictors of insulin resistance. J Diabetes Complications. 2018;32:266–70. doi: 10.1016/j.jdiacomp.2017.10.007. [DOI] [PubMed] [Google Scholar]
- 11.Hetherington-Rauth M, Bea JW, Lee VR, Blew RM, Funk JL, Lohman TG, et al. Relationship between fat distribution and cardiometabolic risk in Hispanic girls. Am J Hum Biol. 2018;30:e23149. doi: 10.1002/ajhb.23149. [DOI] [PMC free article] [PubMed] [Google Scholar]
- 12.Matos LN, Giorelli Gde V, Dias CB. Correlation of anthropometric indicators for identifying insulin sensitivity and resistance. Sao Paulo Med J. 2011;129:30–5. doi: 10.1590/S1516-31802011000100006. [DOI] [PMC free article] [PubMed] [Google Scholar]
- 13.Asunción M, Calvo RM, San Millán JL, Sancho J, Avila S, Escobar-Morreale HF. A prospective study of the prevalence of the polycystic ovary syndrome in unselected Caucasian women from Spain. J Clin Endocrinol Metab. 2000;85:2434–8. doi: 10.1210/jcem.85.7.6682. [DOI] [PubMed] [Google Scholar]
- 14.Rotterdam ESHRE/ASRM-Sponsored PCOS Consensus Workshop Group. Revised 2003 consensus on diagnostic criteria and long-term health risks related to polycystic ovary syndrome. Fertil Steril. 2004;81:19–25. doi: 10.1016/j.fertnstert.2003.10.004. [DOI] [PubMed] [Google Scholar]
- 15.Evers JL. Female subfertility. Lancet. 2002;360:151–9. doi: 10.1016/S0140-6736(02)09417-5. [DOI] [PubMed] [Google Scholar]
- 16.Matthews DR, Hosker JP, Rudenski AS, Naylor BA, Treacher DF, Turner RC. Homeostasis model assessment: Insulin resistance and beta-cell function from fasting plasma glucose and insulin concentrations in man. Diabetologia. 1985;28:412–9. doi: 10.1007/BF00280883. [DOI] [PubMed] [Google Scholar]
- 17.Ramezani Tehrani F, Minooee S, Azizi F. Comparison of various adiposity indexes in women with polycystic ovary syndrome and normo-ovulatory non-hirsute women: A population-based study. Eur J Endocrinol. 2014;171:199–207. doi: 10.1530/EJE-14-0094. [DOI] [PubMed] [Google Scholar]
- 18.Alberti KG, Eckel RH, Grundy SM, Zimmet PZ, Cleeman JI, Donato KA, et al. Harmonizing the metabolic syndrome: a joint interim statement of the International Diabetes Federation Task Force on Epidemiology and Prevention; National Heart, Lung, and Blood Institute; American Heart Association; World Heart Federation; International Atherosclerosis Society; and International Association for the Study of Obesity. Circulation. 2009;120:1640–5. doi: 10.1161/CIRCULATIONAHA.109.192644. [DOI] [PubMed] [Google Scholar]
- 19.Kahn HS. The “lipid accumulation product” performs better than the body mass index for recognizing cardiovascular risk: A population-based comparison. BMC Cardiovasc Disord. 2005;5:26. doi: 10.1186/1471-2261-5-26. [DOI] [PMC free article] [PubMed] [Google Scholar]
- 20.Yildizhan B, Anik Ilhan G, Pekin T. The impact of insulin resistance on clinical, hormonal and metabolic parameters in lean women with polycystic ovary syndrome. J Obstet Gynaecol. 2016;36:893–6. doi: 10.3109/01443615.2016.1168376. [DOI] [PubMed] [Google Scholar]
- 21.Morales AJ, Laughlin GA, Bützow T, Maheshwari H, Baumann G, Yen SS. Insulin, somatotropic, and luteinizing hormone axes in lean and obese women with polycystic ovary syndrome: Common and distinct features. J Clin Endocrinol Metab. 1996;81:2854–64. doi: 10.1210/jcem.81.8.8768842. [DOI] [PubMed] [Google Scholar]
- 22.Gupta N, Radhakrishnan G, Madhu SV, Radhika AG. Comparison of metabolic and endocrinal parameters in obese and nonobese women of polycystic ovarian syndrome with normal controls. Fertil Sci Res. 2015;2:19–23. [Google Scholar]
- 23.Rashidi H, Tafazoli M, Jalali MT, Mofrad AM. Serum lipid profile and insulin resistance in women with Polycystic Ovary Syndrome (PCOS) J Diabetes Metab Disord Control. 2018;5:148–52. [Google Scholar]
- 24.Huang X, Wang Q, Liu T, Pei T, Liu D, Zhu H, et al. Body fat indices as effective predictors of insulin resistance in obese/non-obese polycystic ovary syndrome women in the Southwest of China. Endocrine. 2019;65:81–5. doi: 10.1007/s12020-019-01912-1. [DOI] [PubMed] [Google Scholar]
- 25.Zheng S, Tong M, Dong L, Du C, Zheng X, Wang L, et al. Lipid accumulation product independently correlate with hepatic steatosis quantified by controlled attenuation parameter in women with polycystic ovary syndrome. Endocr Connect. 2020;9:154–62. doi: 10.1530/EC-19-0559. [DOI] [PMC free article] [PubMed] [Google Scholar]
- 26.Bermúdez V, Salazar J, Fuenmayor J, Nava M, Ortega Á, Duran P, et al. Lipid accumulation product is more related to insulin resistance than the visceral adiposity index in the Maracaibo City Population, Venezuela. Journal of Obesity, Article ID 5514901. 2021;7 doi: 10.1155/2021/5514901. [DOI] [PMC free article] [PubMed] [Google Scholar]
- 27.Ribeiro VB, Kogure GS, Lopes IP, Silva RC, Pedroso DC, Ferriani RA, et al. Association of measures of central fat accumulation indices with body fat distribution and metabolic, hormonal, and inflammatory parameters in women with polycystic ovary syndrome. Arch Endocrinol Metab. 2019;63:417–26. doi: 10.20945/2359-3997000000157. [DOI] [PMC free article] [PubMed] [Google Scholar]
- 28.He Y, Lu Y, Zhu Q, Wang Y, Lindheim SR, Qi J, et al. Influence of metabolic syndrome on female fertility and in vitro fertilization outcomes in PCOS women. Am J Obstet Gynecol. 2019;221:138.e1–12. doi: 10.1016/j.ajog.2019.03.011. [DOI] [PubMed] [Google Scholar]
- 29.Rashid N, Nigam A, Kauser S, Prakash P, Jain SK, Wajid S. Assessment of insulin resistance and metabolic syndrome in young reproductive aged women with polycystic ovarian syndrome: Analogy of surrogate indices. Arch Physiol Biochem. 2020;126:1–8. doi: 10.1080/13813455.2020.1724157. [doi: 10.1080/13813455.2020.172415] [DOI] [PubMed] [Google Scholar]
- 30.Nascimento JX, Chein MB, de Sousa RM, Ferreira Ados S, Navarro PA, Brito LM. Importance of lipid accumulation product index as a marker of CVD risk in PCOS women. Lipids Health Dis. 2015;14:62. doi: 10.1186/s12944-015-0061-y. [DOI] [PMC free article] [PubMed] [Google Scholar]
- 31.Wiltgen D, Benedetto IG, Mastella LS, Spritzer PM. Lipid accumulation product index: A reliable marker of cardiovascular risk in polycystic ovary syndrome. Hum Reprod. 2009;24:1726–31. doi: 10.1093/humrep/dep072. [DOI] [PubMed] [Google Scholar]
- 32.Perona JS, Schmidt-RioValle J, Rueda-Medina B, Correa-Rodríguez M, González-Jiménez E. Waist circumference shows the highest predictive value for metabolic syndrome, and waist-to-hip ratio for its components, in Spanish adolescents. Nutr Res. 2017;45:38–45. doi: 10.1016/j.nutres.2017.06.007. [DOI] [PubMed] [Google Scholar]
Associated Data
This section collects any data citations, data availability statements, or supplementary materials included in this article.
Data Availability Statement
The data used for this study is available with and the authors are willind to share it upon reasonable request.