Abstract
Three-dimensional electrodes serve as more efficient cathodes for the in situ generation of H2O2 in microbial fuel cells (MFCs) than two-dimensional electrodes and possess significant electric potentials in the advanced oxidation of organics. In this study, we investigated the performance of a three-dimensional MFC-Fenton system in degrading p-nitrophenol (PNP) in an aqueous solution with the objective of optimizing the operating parameters, including the initial pH, iron dosage, and loading resistance. A corresponding reaction pathway for PNP in the system was also proposed. The results showed that the three-dimensional electrode bioelectrochemical system efficiently oxidized PNP and removed total organic carbon over a short period (64 h). In addition, experiments showed that a lower initial pH enhanced the removal of PNP by the system. The highest removal efficiency of PNP was achieved with an initial iron concentration of 0.025 mol L−1, and a lower or higher iron concentration resulted in decreased PNP degradation. Furthermore, the treatment capacity of the system was remarkably enhanced at a low loading resistance of 20 Ω. Under optimal conditions, the three-dimensional MFC-Fenton system achieved 95.7% PNP removal (within 8 h). Furthermore, the system showed a stable high treatment efficiency of approximately 90% for low PNP concentrations in wastewater over as long as 96 h.
PNP absorbed in and surrounded by GPEs has kinetic favorability in the degradation process by a three-dimensional electrode MFC-Fenton system.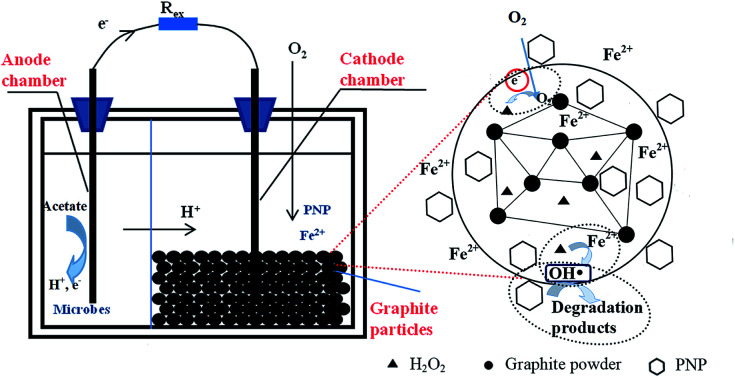
1. Introduction
The use of advanced electrochemical oxidation processes is gaining acceptance as a “clean” technology for water treatment. As these processes show several advantages over the traditional advanced oxidation processes (AOPs), they have been extensively studied for preventing pollution problems, particularly from refractory organic pollutants.1 Moderate electrical conductivity is sufficient for applying electrochemical oxidation processes to degrade low concentrations of pollutants in contaminated natural water.2,3 However, continuous power consumption leads to high energy costs.4,5 Microbial fuel cells (MFCs) have emerged as environmentally friendly bioelectrochemical devices that can be used for bioelectricity generation as well as anodic biodegradation in wastewater treatment.6–10 MFCs have lately been combined with Fenton reactions to develop a bioelectrochemical oxidation process aimed at decomposing refractory organics.4,5,11–14 In this process, hydrogen peroxide is synthesized in situ by two-electron oxygen reduction at the carbonaceous cathode using electrons and protons generated by biocatalysis at the MFC anode.15–19 The synthesized H2O2 reacts with ferrous iron to produce hydroxyl radicals in the catholyte, which act as strong oxidants. A remarkable feature of the MFC-Fenton system is that it needs no external power to operate.15,16,20–22 This energy-saving and cost-effective feature has made it the focus of recent research as a bioelectrochemical oxidation process for treating organic contaminants in water.23
Research with MFCs has largely been conducted using two-dimensional electrodes; however, their use causes the hydrogen peroxide production rates to be low,15,24,25 which lowers the rate of oxidation of organic pollutants. To improve the degradation of organic contaminants, alternative configurations that produce hydrogen peroxide at higher rates are needed. It is well established that the use of three-dimensional electrodes can improve the rate of oxidation due to their larger specific surface area in comparison to the conventional two-dimensional electrodes.1,26–28 In addition, in an electric field, charged microelectrodes can be formed in an electrode consisting of particles to increase the mass transfer coefficient.26,27,29,30 In our previous studies, using three-dimensional electrode MFC systems,21,31 graphite particle electrodes (GPEs) gave a larger mass transfer and higher efficiency of oxygen reduction to H2O2 (ref. 31) (10.15 mg L−1 (ref. 21) and 9.78 mg L−1) compared to two-dimensional electrodes (6.57 mg L−1).16 The high efficiency of removal of refractory organics in the three-dimensional electrode MFC system results from not only the higher H2O2 production efficiency, but also the porous nature and large interfacial area of GPEs that favor the adsorption of refractory organics on the electrode surface. The optimization of the operating conditions is useful for determining the limits of removal efficiencies for refractory organics in the MFC-Fenton process.32
According to Zhao et al.,33 HNO3/H2O2 carbon oxide felts can be used to increase the hydrophilicity, promote biocompatibility, enhance electron transfer, and improve the electrocatalytic performance of biofilms, particularly to greatly increase the power output of MFCs. Feng et al.34 used a simple method to synthesize pyridinic and pyrrolic nitrogen-rich ordered mesoporous carbon, which showed excellent electrocatalytic activity and durability for oxygen reduction in neutral electrolytes. In order to obtain large cathodes with excellent electrical conductivity and performance, Rossi et al.35 designed and tested a new multi-panel air cathode that can function in large-scale MFCs with high hydrostatic pressure (85 cm water height). Electrode materials36–38 and reactor configuration for the MFC system have been thoroughly studied, while the performance and mechanism of MFC degradation of refractory pollutants need to be deeply explored.
p-Nitrophenol (PNP), a representative of refractory pollutants, is widely used in chemical industries as a raw material for manufacturing pesticides, herbicides, dyes and explosives.39–41 PNP is extremely toxic, mutagenic and carcinogenic, and is listed as a priority pollutant by the USEPA.24,42 Due to its stability and high solubility,43 PNP resists degradation and persists for long times in nature waters, posing risk to environment and human health. Based on the above considerations, PNP was chosen as the model organic pollutant in this study.
This study used a three-dimensional electrode MFC-Fenton system with graphite particle electrodes to produce strong oxidants (e.g., ˙OH) to degrade PNP in aquatic solutions. The reaction mechanism for PNP transformation was proposed. The effects of initial pH, current density, and iron dosage on the efficiency of PNP removal were investigated, and the stability of PNP degradation in this system was evaluated.
2. Experimental methodology
2.1. MFC configuration
The dual-chamber MFC reactor with an anodic volume of 32.0 mL and cathodic volume of 64.0 mL was employed as previously described.31 A 3.0 cm × 3.0 cm piece of carbon felt (Hesen, Shanghai, China) was used as the anode. It was prepared by soaking carbon felt in acetone for 24 h and then washing three times with deionized (DI) water to remove the impurities on its surface.15 As described previously, 0.05 g graphite-PTFE particles were filled in the cathode chamber as particle electrodes,21 decreasing the cathodic working volume to ∼50.0 mL. A graphite rod of 0.8 cm diameter and 6 cm length was inserted into the bed of graphite-PTFE particles to establish electrical contact. A cation exchange membrane (CEM, Ultrex CMI-7000, Membranes International Inc., Glen Rock, NJ, USA) was used to separate the two identical compartments.
2.2. Start-up and operation
The anode was inoculated with the anodic effluent of a well-operated MFC containing a mixed microbial culture with exoelectrogenic bacteria. The growth media for the exoelectrogens was 50 mM phosphate buffer solution (PBS) together with 1 g L−1 acetate solution (700 mg L−1 COD, pH 7.0). The PBS contained NH4Cl (0.31 g L−1), KCl (0.13 g L−1), NaH2PO4·H2O (2.452 g L−1), Na2HPO4 (4.576 g L−1), mineral solution and vitamins.44 The catholyte of MFCs comprised 0.05 mol L−1 Na2SO4 solution, continuously bubbled with air. The anolyte and catholyte were replaced every 24 h. During start-up, the MFC circuit was connected across an external resistor of 1000 Ω. The MFC was operated in open circuit for at least three successive batch cycles to produce a stable maximum voltage consistently. The substrate was then switched to PBS and acetate solution. The catholyte was also changed to Na2SO4 and PNP solution air bubbled at pH 3.0, and ferrous iron (FeSO4·H2O) was added as well.
2.3. MFC test
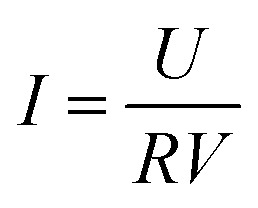
The cell voltages were continuously monitored by a data acquisition system (PISO-813, ICP DAS Co., Ltd, China) at 60 s intervals. The anode and cathode potentials were measured using a saturated calomel electrode (SCE, +0.242 V vs. SHE) as reference. Current density (I) was calculated using eqn (1) and power density (P) was calculated using eqn (2).
| P = IU | 1 |
 |
2 |
where, U is the cell voltage (V), R is the external resistance (Ω), and V is the effective volume of the cathode chamber (m3). The polarization and power density curves were controlled by varying the external resistance over 5–5000 Ω using a resistor box.
2.4. Experimental procedures
The experimental and four control MFCs were constructed to investigate PNP degradation in the three-dimensional electrode bioelectrochemical system (Table 1). Specifically, MFC-1 was operated without ferrous iron in the cathode chamber; MFC-2 was operated without air-purging in the cathode chamber; MFC-3 was designed to test the effect of cathodic reduction by operating it without ferrous iron and H2O2 (without air-purging); and MFC-4 was operated under open-circuit condition to study PNP sorption to graphite particles.
Cathode operation conditions in the MFCs.
| MFCs | Cathode operation conditions | Purpose |
|---|---|---|
| Experimental MFC | With air-purging and ferrous iron | MFC-Fenton reaction |
| MFC-1 | With air-purging but without ferrous iron | Effects of H2O2 |
| MFC-2 | Without air-purging but with ferrous iron | Iron oxidation–reduction |
| MFC-3 | Absence of ferrous iron and H2O2 | Effects of cathode reduction |
| MFC-4 | Open-circuit condition | PNP absorption of graphite particle electrodes |
Batch experiments were conducted to investigate the effect of different operating conditions on PNP degradation by varying the total iron dosage, solution pH, and applied external resistance. The initial operating parameters were: PNP solution at pH 3.0, external load 200 Ω, limonite dosage ([Fe2+]0) 0.05 mol L−1, and initial PNP concentration ([PNP]0) 50 mg L−1. The pH of the catholyte was adjusted using 0.5 mol L−1 NaOH or 0.5 mol L−1 H2SO4. Prior to degradation, the system was stirred for 1 h to equilibrate the sorption of PNP to graphite particles. All batch experiments were carried out at 30 ± 0.5 °C in a biochemical incubator.
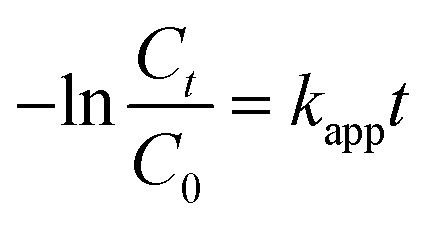
The PNP concentration was determined by high performance liquid chromatography (HPLC, Waters E 2695 Separation Module 2998 PDA, Waters, USA) with a C18 column (5 μm, 4.6 × 250 mm). The mobile phase was a mixture of methanol–water (60/40, v/v) and the flow rate was 1.0 mL min−1. The UV-vis detector system was set at 320 nm.24 The apparent rate constant (kapp) for p-nitrophenol was determined using eqn (3).
 |
3 |
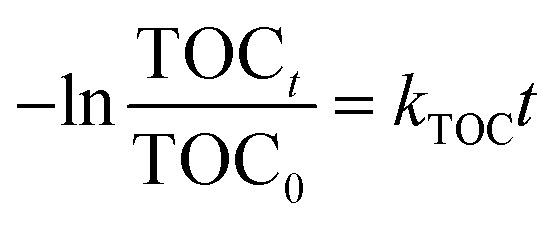
where, Ct and C0 are the PNP concentration at instant t and the initial PNP concentration, respectively, and t is the reaction time. The total organic carbon (TOC) of initial and treated aqueous PNP solutions was measured using a TOC analyzer (TOC-VCPH, Shimadzu Corporation, Japan) and the kinetic constant of TOC (kTOC) was determined using eqn (4).
 |
4 |
where, TOCt and TOC0 are the concentrations of TOC at instant t and initial time, respectively, and t is the reaction time. The catholyte pH was detected by a pH meter (PHSJ-3F, INESA Scientific Instrument Co. Ltd, Shanghai, China).
3. Results and discussion
3.1. Electricity generation in the three-dimensional electrode MFC-Fenton system
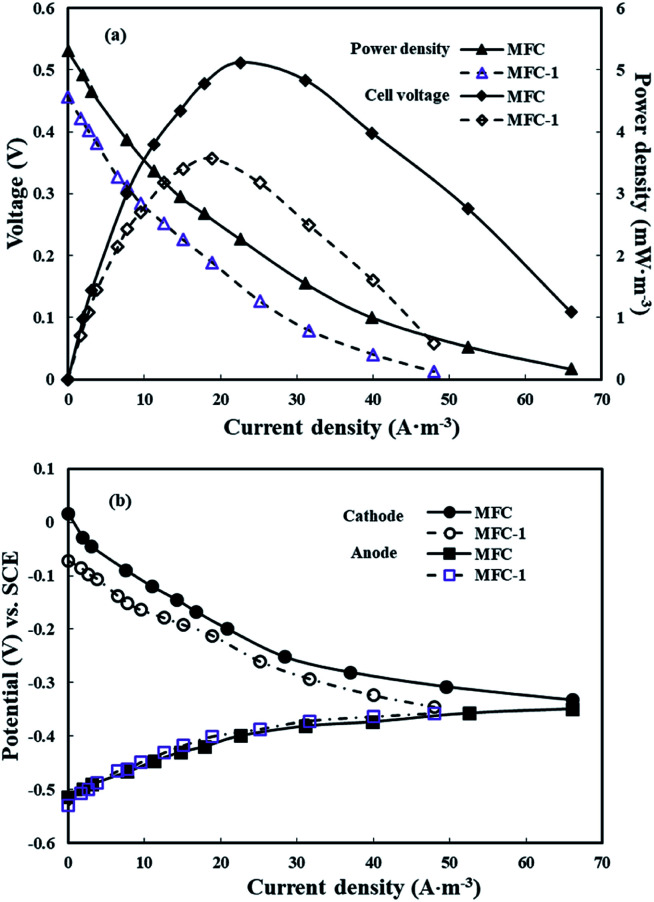
Electricity production in the three-dimensional electrode MFC with ferrous iron in the cathode chamber was compared with that in MFC-1, which did not contain ferrous iron in the catholyte. Stable voltages of 0.377 ± 0.021 V and 0.327 ± 0.014 V were obtained within three cycles (72 h) following the inoculation of MFC and MFC-1, respectively. Power density and polarization curves were measured after 12 cycles for mature anode potentials by varying the external resistance from 5 to 5000 Ω (Fig. 1(a)). The maximum power density output of 5.11 W m−3 attained in the MFC with ferrous iron was 30.1% higher than that in MFC-1 (3.57 W m−3). The current densities of MFC and MFC-1 were 20.8 A m−3 and 18.9 A m−3, respectively, when both MFCs achieved the maximum power density with an external resistance of 200 Ω. The open circuit voltage (OCV) of MFC and MFC-1 were 0.530 V and 0.475 V, respectively. The level of electricity generated in the MFC containing ferrous iron in the cathode chamber was higher than that in the previous H2O2-producing MFCs using two-dimensional electrodes (0.34 V;15 0.44 V)16 and was close to that of the generally reported two-chamber MFCs (0.67 V;45 0.725 V).46 The electrode potentials of the MFCs with SCE as the reference electrode are shown in Fig. 1(b). No significant polarization losses occurred in the MFCs. The anode potentials were almost the same, whereas the potentials of cathodes were different. With an increase in the current density, the cathode potentials exhibited a decreasing trend, leading to variation in the polarization curves. This indicates that the differences in the cell voltages and power densities were mainly caused by the cathode chambers. In addition, the findings show that the presence of iron ions is beneficial to power generation in a three-dimensional electrode bioelectrochemical system.
Fig. 1. (a) Power density curves and polarization curves for the experimental MFCs and MFC-1; (b) anode potentials and cathode potentials as a function of current density for the experimental MFCs and MFC-1.
3.2. Advanced oxidation of PNP in three-dimensional electrode bioelectrochemical system
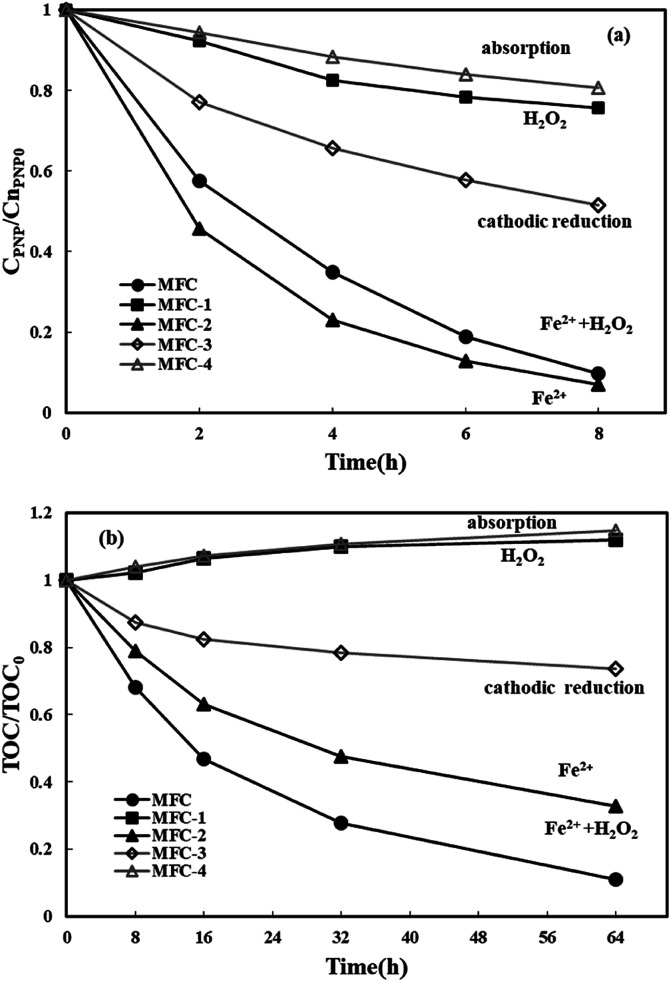
The efficiency of PNP degradation and mineralization in a three-dimensional electrode bioelectrochemical system was investigated. Four types of MFCs were used in this study for control. All of the MFCs were operated at: [PNP]0 = 50 mg L−1, ferrous iron dosage = 0.05 mol L−1, Rex = 200 Ω, and pH = 3. The PNP degradation and TOC removal in the cathode chamber of the MFCs are displayed in Fig. 2. In MFC-1, H2O2 was generated at the graphite particle electrodes by oxygen reduction. Only 24.3% PNP was degraded after 8 h, and TOC was not removed even after 64 h, mainly because H2O2 is a relatively weaker oxidant compared with ˙OH. PNP was quickly removed from the MFC-2 system (without air purging in the cathode chamber) in 8 h, which contributed to the reduction–oxidation of ferrous iron. In MFC, most of the Fe2+ in the cathode immediately reacted with the generated H2O2 to produce ˙OH, rather than proceeding in the reduction–oxidation reaction with PNP. That is why MFC-2 had a slightly larger PNP degradation efficiency with a quicker degradation process than MFC. Nevertheless, the TOC removal (67.4% over 64 h) in MFC-2 was relatively lower than that in MFC. Unlike the use of the oxidants of ˙OH by MFC, in MFC-2, PNP was mainly transformed into p-aminophenol and other aromatic intermediates (e.g., hydroquinone) by the reduction–oxidation of iron.13 PNP degradation in MFC-3 (without ferrous ions or H2O2) was largely attributed to cathodic reduction.47 PNP degradation and TOC removal efficiencies of 48.5% over 8 h and 26.3% over 64 h, respectively, were observed. Values were lower as there was no contribution from ferrous iron reduction–oxidation to their removal. The results for MFC-4 (operated under an open circuit) show good sorption of PNP to graphite particles (19.4%). The decrease in solution volume by volatilization contributed to a slight rise in TOC concentration in MFC-1 and MFC-4. The PNP degradation and TOC removal in the experimental MFC were 90.4% after 8 h and 88.9% after 64 h respectively, which were larger than those observed in other MFCs. The results indicate that PNP degradation by the three-dimensional bioelectrochemical system took less time than the degradation in the MFC-Fenton systems using two-dimensional electrodes (85% in 96 h).13 The degradation and mineralization of PNP followed pseudo-first-order kinetics with a kapp of 0.290 h−1 (R2 = 0.997) and a kTOC of 0.032 h−1 (R2 = 0.9875), indicating that the PNP degradation and TOC removal were proportional to the reactant content.
Fig. 2. The degradation of p-nitrophenol (a) and the removal of TOC (b) after 8 h and 64 h electricity production in the experimental MFC and four control MFCs.
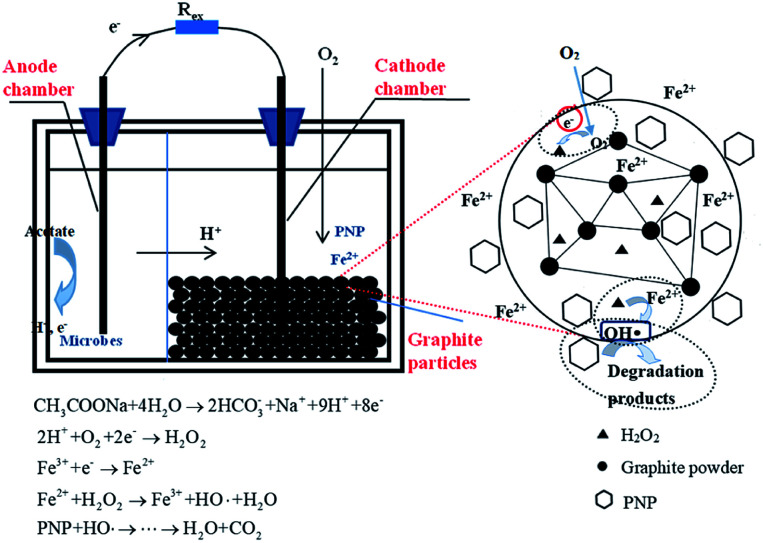
On the basis of the above data, a possible reaction mechanism for this three-dimensional MFC-Fenton system was proposed (Fig. 3). In the anode chamber, a bioelectrochemical reaction occurred to produce electrons and protons with the acetate oxidized by electricigens. The generated electrons and protons were then transferred through the external contact and cation exchange membrane, respectively, to the cathode chamber. In the cathode chamber, PNP was firstly absorbed in and surrounded by the graphite particle electrodes, which had a greater kinetic favorability in the degradation process. The dissolved oxygen was electrochemically reduced by the transferred electrons and protons to H2O2, which further reacted with Fe2+ in the cathode chamber to form stronger oxidants like hydroxyl radicals. Owing to the oxidation of hydroxyl radicals, the PNP absorbed in and surrounded by the particle electrodes was degraded to carboxylic acids and finally mineralized to CO2 and H2O, as indicated by the TOC removal efficiency and kinetic mineralization constant (kTOC). The initial iron source worked as a catalyst and was relatively constant, while Fe2+ could be regenerated by introducing electrons into the Fe3+/Fe2+ redox cycle, which improved the efficiency of the Fenton chain reaction. Consequently, the operational cost would be reduced as compared with that of the conventional Fenton approach, as the continuous addition of iron could be avoided in this MFC-Fenton system.
Fig. 3. The mechanism of p-nitrophenol advanced oxidation in the three-dimensional electrode bioelectrochemical system.
3.3. Effects of operating parameters on p-nitrophenol degradation
3.3.1. Effect of initial pH
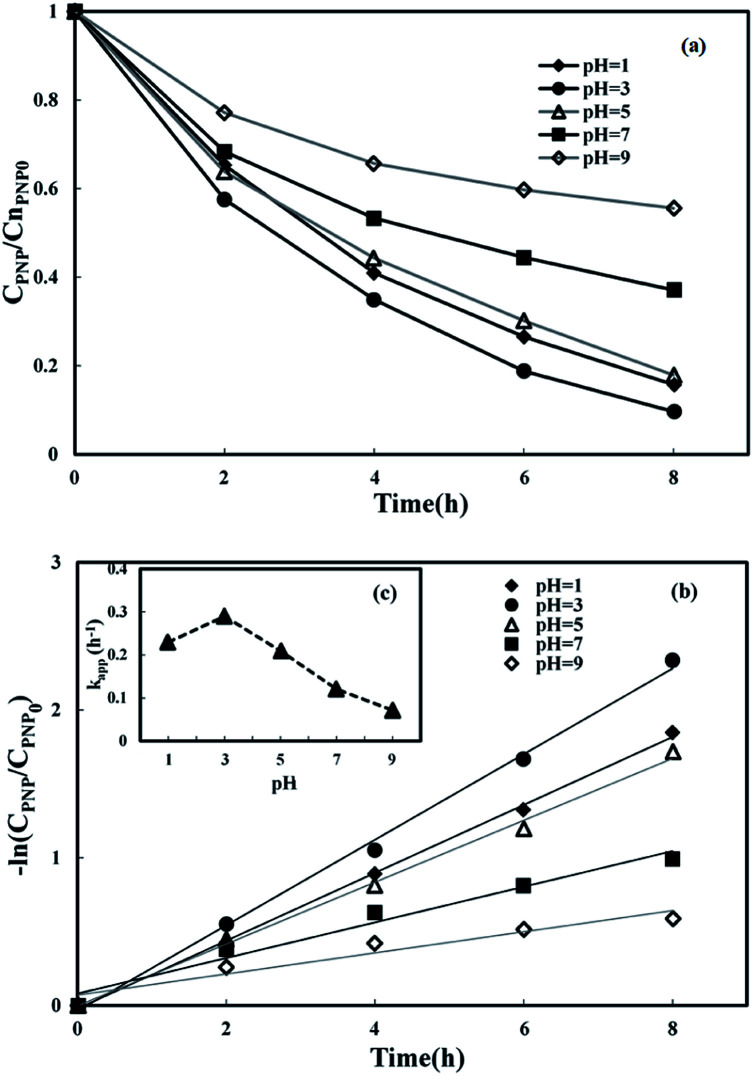
Batch experiments in three-dimensional MFC-Fenton systems were undertaken at various pH values of 1, 3, 5, 7, and 9 to study the influence of pH on PNP removal. The pH of the catholyte was adjusted to the required value using 0.5 mol L−1 H2SO4 or 0.5 mol L−1 NaOH throughout the reaction. Fig. 4(a) shows the remarkable correlation between the removal efficiencies of PNP and the initial pH. The highest degradation efficiency was attained at pH 3. When the pH value was raised above 3, the PNP removal efficiency decreased, likely because of a decrease in the ˙OH production48 in the weak acidic environment, even though H2O2 production increased.49 When the pH was raised to 7, a PNP removal of 62.9% was observed, indicating that the three-dimensional electrode MFC-Fenton system can degrade PNP under neutral conditions, but with relatively low efficiency.
Fig. 4. Effect of initial pH on p-nitrophenol removal in MFC-Fenton system ([PNP]0 = 50 mg L−1, [Fe2+]0 = 0.50 mol L−1, Rex = 200 Ω).
Furthermore, the PNP removal efficiency also decreased with a smaller pH value in the cathode chamber. A relatively high solution acidity inhibited the regeneration of Fe2+, which led to the decrease in the degradation efficiency of the target pollutant. Fenton chemistry is pH sensitive; according to previous studies, the optimal pH for the Fenton reaction is generally in the range of 2–4. Wang et al.32 demonstrated that controlling pH at 3 would promote H2O2 accumulation. The study by Zhou et al.50 also indicated that the pH value of 3.1 was beneficial for higher H2O2 production. Otherwise, the large proton concentration gradient led to the transport of protons from the cathode to the anode chamber, forming an acidic environment in the anode.51 Consequently, an increasing number of microbes died in the anode under the acidic conditions, which decreased the electron generation, then lowered the production of Fenton reagents and, ultimately, the degradation rate.
The PNP reduction at different initial pH values followed the pseudo-first-order kinetics model (Fig. 4(b)), and the corresponding kinetic constants are displayed in Fig. 4(c). A pH value of 3 is shown as the optimal pH for PNP removal (90.4%; kapp = 0.290 h−1) in this MFC-Fenton system. The value of kapp at the optimal pH is 3 times higher than that at pH 9, which demonstrates the significant effect of the initial pH on the kinetics of PNP reduction. For pH values larger than 3, kapp and pH value show a linear relationship (kapp = −0.0371pH + 0.3957, R2 = 0.987).
3.3.2. Effect of ferrous iron dosage
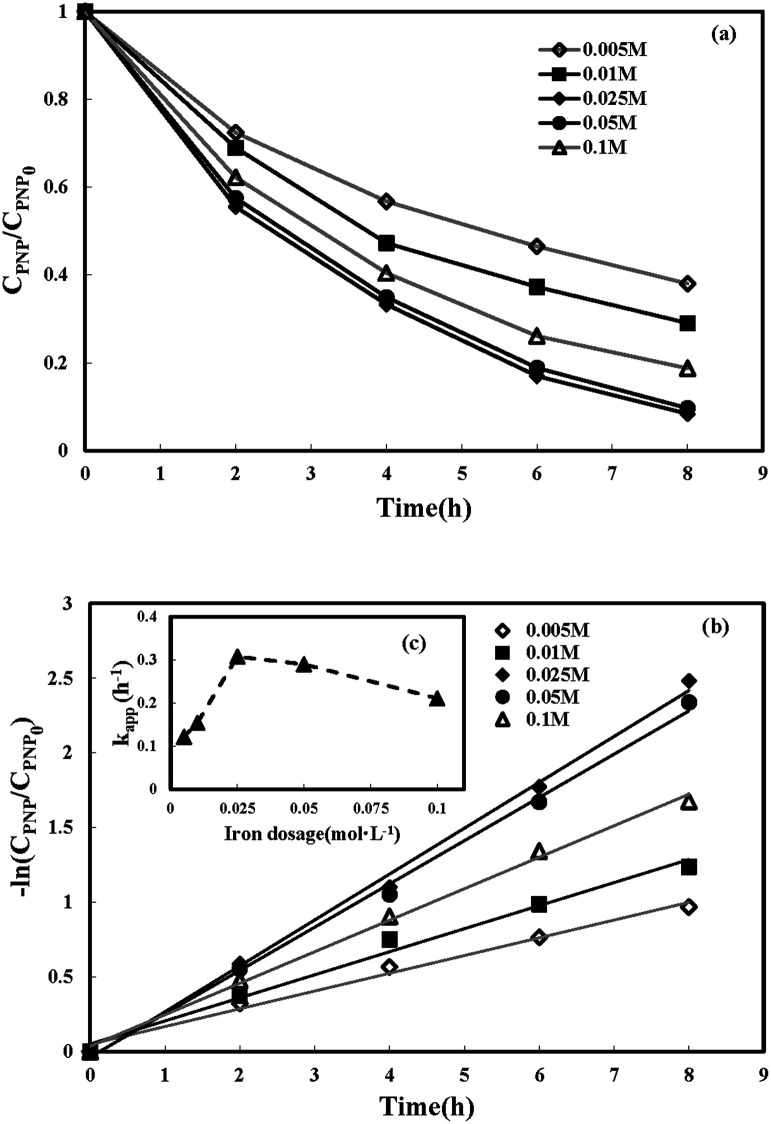
The influence of the initial iron dosage on the treatment efficiency in the MFC-Fenton system was measured at different initial concentration conditions of iron (0.005, 0.01, 0.025, 0.05, and 0.10 mol L−1), as shown in Fig. 5(a). It is clear from the graph that the PNP removal efficiency was evidently affected by the initial iron dosage. When iron concentration increased from 0.005 to 0.025 mol L−1, PNP removal efficiency at 8 h enhanced from 62.0% to 91.6%. A further increase in iron dosage from 0.025 to 0.05 mol L−1, decreased the PNP removal efficiency slightly at 8 h. However, when the iron dosage increased to 0.10 mol L−1, the PNP removal efficiency decreased by 11.2%. The logarithmic plots of the residual PNP concentration versus time and the corresponding kinetic constants versus iron dosage are shown in Fig. 5(b) and (c), respectively. The kapp increased dramatically from 0.121 to 0.307 h−1 when the initial concentration of iron increased from 0.005 to 0.025 mol L−1, following the straight-line correlation (kapp = 9.5062 + 0.0676 ([Fe2+]0 < 0.025 mol L−1), R2 = 0.994). In addition, the kapp declined by a small value with the initial concentration of iron further increasing from 0.025 to 0.1 mol L−1, showing a linear decreasing trend (kapp = −1.3269[Fe2+]0 + 0.3467 ([Fe2+]0 > 0.025 mol L−1), R2 = 0.9742). In other words, the removal rate of PNP reached its maximum after the concentration of iron reached around 0.025 mol L−1. As reported previously,52 the molar ratio of Fe2+ to H2O2 in the Fenton system played an important role in the oxidation process. The side reactions, namely, eqn (5) and (6) might be triggered in the system with a higher or lower molar ratio; since the concentration of the in situ-generated H2O2 in this system was basically constant, the iron dosage became the limiting factor.
| Fe2+ + HO˙ → Fe2+ + OH− | 5 |
 |
6 |
Fig. 5. Effect of iron dosage on p-nitrophenol removal in MFC-Fenton system ([PNP]0 = 50 mg L−1, pH = 3 and Rex = 200 Ω).
Therefore, the optimal molar ratio of Fe2+ to H2O2 occurred at an iron dosage of 0.025 mol L−1 in this MFC-Fenton system.
3.3.3. Effect of loading external resistance
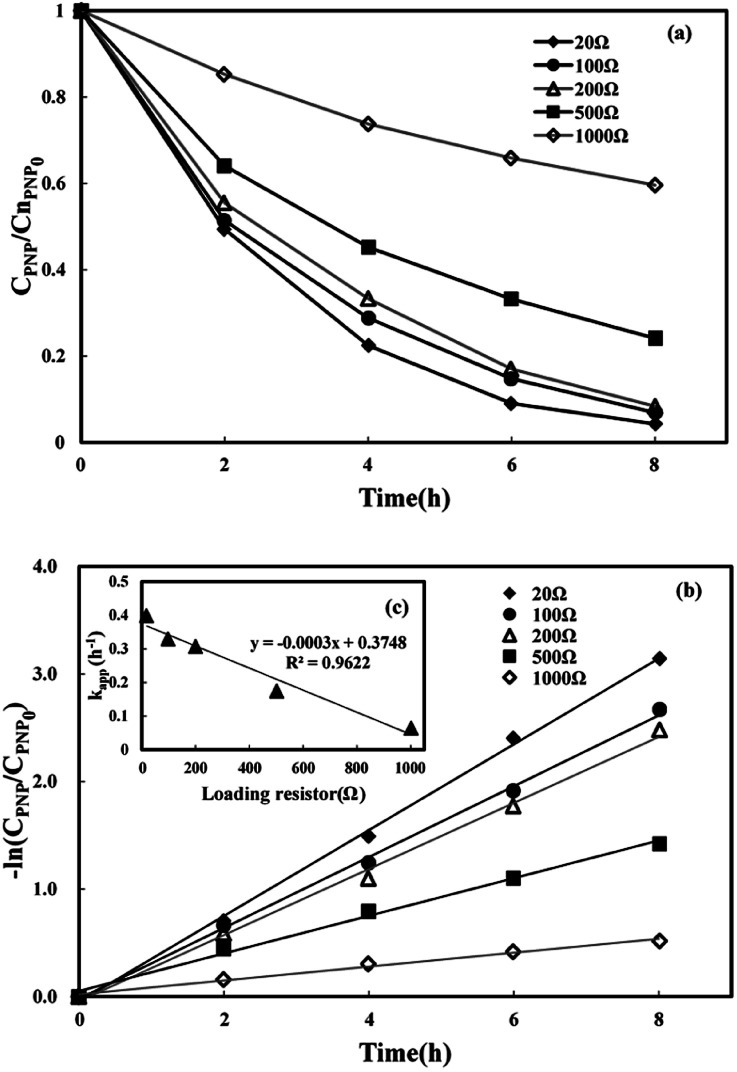
Five various loading external resistances (20 Ω, 100 Ω, 250 Ω, 500 Ω, and 1000 Ω) were used to investigate the influence of current density on PNP removal. Higher current density corresponded to lower external resistance. As shown in Fig. 6(a), the PNP degradation efficiency increased 1.34 times when the external resistance dropped from 1000 to 20 Ω, and the highest PNP removal efficiency of 95.7% was attained at the lowest external load of 20 Ω, indicating that increasing current density led to higher degradation of PNP. Fig. 6(b) shows that the value of kapp increased from 0.0646 to 0.399 h−1 when the external resistance value declined from 1000 to 20 Ω. Fig. 6(c) further indicates a linear relationship between the kapp value and the external resistance (kapp = −0.0003Rex + 0.3748) with a correlation of determination (R2) of 0.962, which demonstrated that a decrease in external resistance could enhance the value of kapp. These above results suggest that the bio-generated electrons measured by electrical current density can directly affect H2O2 generation and further the in situ production of strong oxidants.53 However, a small external resistance value contributed to the relatively low voltage output of the system.
Fig. 6. Effect of loading external resistance on p-nitrophenol removal in MFC-Fenton system ([PNP]0 = 50 mg L−1, [Fe2+]0 = 0.025 mol L−1 and pH = 3).
3.4. The stability of the reaction system
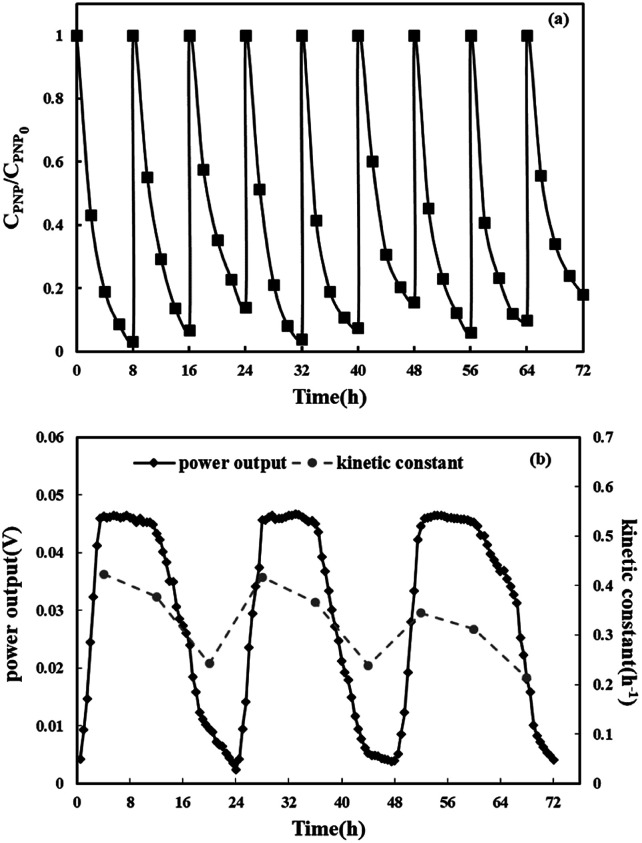
At last, the stability of the reaction system was investigated. The repeatable oxidation experiments in the three-dimensional electrode MFC-Fenton system were run for nine cycles (8 h for each cycle) under the optimal condition ([PNP]0 = 50 mg L−1, [Fe2+]0 = 0.025 mol L−1, pH = 3 and Rex = 20 Ω). The anode solution was changed after every three runs and the cathode solution was changed after each run. As shown in Fig. 7(a), during nine cycles, the PNP removal efficiency remained around 90% in each cycle. Fig. 7(b) displays the first-order kinetic constants and MFC voltage output during nine cycles. In every three cycles, the cell voltage reached a plateau around 0.05 V and then started to decrease due to the consumption of acetate in the anode chamber. The degradation rate and kinetic constant decreased slightly during the first two runs and then dropped dramatically in the third run due to the decline in anode performance. After the substrate was refreshed in the anode chamber, the degradation rate and kinetic constants increased. These results indicate the long-term stability of efficient PNP degradation and simultaneously weak electricity generation in the three-dimensional electrode MFC-Fenton system.
Fig. 7. Residual concentrations of p-nitrophenol in the three-dimensional electrode MFC-Fenton system during nine cycles (a); the first-order kinetic constants and MFC voltage output under the optimal condition during nine cycles (b).
4. Conclusions
In this study, a three-dimensional electrode MFC-Fenton system was used to degrade PNP in an aqueous solution. Relatively high efficiencies of PNP degradation (90.4% after 8 h) and TOC removal (88.9% after 64 h) were obtained in this system, and a reaction pathway for PNP was proposed as well. The effects of the initial pH, iron dosage, and loading resistance on PNP removal from water were also investigated. The results indicate that a lower initial pH could promote the removal rate of PNP through the MFC-Fenton system. The removal efficiencies of PNP increased significantly with an increase in the initial iron concentration from 0.005 to 0.025 mol L−1 and decreased moderately with a further increase in the iron concentration to 0.01 mol L−1. Decreasing the external resistance could enhance the PNP elimination. Under optimal conditions ([PNP]0 = 50 mg L−1, [Fe2+]0 = 0.025 mol L−1, pH = 3, and Rex = 20 Ω), the PNP removal reached 95.7%. Finally, the stability of the three-dimensional electrode MFC-Fenton system was also detected, which showed a constantly high treatment efficiency of approximately 90% for low PNP concentration in wastewater and continuous power generation over 96 h.
Abbreviations
- MFCs
Microbial fuel cells
- PNP
p-Nitrophenol
- TOC
Total organic carbon
- AOPs
Advanced oxidation processes
- GPEs
Graphite particle electrodes
- USEPA
United States Environmental Protection Agency
- PPN-OMC
Pyrrolic nitrogen-rich ordered mesoporous carbon
- DI
Deionized
- PBS
Phosphate buffer solution
- HPLC
High performance liquid chromatography
- OCV
Open circuit voltage
Conflicts of interest
There are no conflicts to declare.
Supplementary Material
Acknowledgments
This research is supported by the National Water Pollution Control and Management Technology Major Projects (No. 2015ZX07202-012) and Liaoning Provincial Department of Education Research Project (LQN201909). The fruitful suggestions provided by Professor Lin Zhao have been invaluable to the progress of our research.
References
- An T.-C. Zhu X.-H. Xiong Y. Chemosphere. 2002;46:897–903. doi: 10.1016/S0045-6535(01)00157-6. [DOI] [PubMed] [Google Scholar]
- Yuan S. Chen M. Mao X. Alshawabkeh A. N. Water Res. 2013;47:269–278. doi: 10.1016/j.watres.2012.10.009. [DOI] [PMC free article] [PubMed] [Google Scholar]
- Chen S. Tang J. Fu L. Yuan Y. Zhou S. J. Soils Sediments. 2016;16:2326–2334. doi: 10.1007/s11368-016-1452-z. [DOI] [Google Scholar]
- Fu L. You S.-J. Zhang G.-q. Yang F.-L. Fang X.-h. Chem. Eng. J. 2010;160:164–169. doi: 10.1016/j.cej.2010.03.032. [DOI] [Google Scholar]
- Feng C.-H. Li F.-B. Mai H.-J. Li X.-Z. Environ. Sci. Technol. 2010;44:1875–1880. doi: 10.1021/es9032925. [DOI] [PubMed] [Google Scholar]
- Logan B. E. Hamelers B. Rozendal R. A. Schrorder U. Keller J. Freguia S. Aelterman P. Verstraete W. Rabaey K. Environ. Sci. Technol. 2006;40:5181–5192. doi: 10.1021/es0605016. [DOI] [PubMed] [Google Scholar]
- Aelterman P. Rabaey K. Pham H. T. Boon N. Verstraete W. Environ. Sci. Technol. 2006;40:3388–3394. doi: 10.1021/es0525511. [DOI] [PubMed] [Google Scholar]
- Zhao F. Harnisch F. Schroerder U. Scholz F. Bogdanoff P. Herrmann I. Environ. Sci. Technol. 2006;40:5193–5199. doi: 10.1021/es060332p. [DOI] [PubMed] [Google Scholar]
- Logan B. E. Regan J. M. Environ. Sci. Technol. 2006;40:5172–5180. doi: 10.1021/es0627592. [DOI] [PubMed] [Google Scholar]
- Min B. Kim J. Oh S. Regan J. M. Logan B. E. Water Res. 2005;39:4961–4968. doi: 10.1016/j.watres.2005.09.039. [DOI] [PubMed] [Google Scholar]
- Zhuang L. Zhou S. Li Y. Liu T. Huang D. J. Power Sources. 2010;195:1379–1382. doi: 10.1016/j.jpowsour.2009.09.011. [DOI] [Google Scholar]
- Zhuang L. Zhou S. Yuan Y. Liu M. Wang Y. Chem. Eng. J. 2010;163:160–163. doi: 10.1016/j.cej.2010.07.039. [DOI] [Google Scholar]
- Zhu X. Ni J. Electrochem. Commun. 2009;11:274–277. doi: 10.1016/j.elecom.2008.11.023. [DOI] [Google Scholar]
- Dios M. A. F. d. Iglesias O. Bocos E. Pazos M. Sanromán M. A. J. Ind. Eng. Chem. 2014;20:3754–3760. doi: 10.1016/j.jiec.2013.12.075. [DOI] [Google Scholar]
- Rozendal R. A. Leone E. Keller J. Rabaey K. Electrochem. Commun. 2009;11:1752–1755. doi: 10.1016/j.elecom.2009.07.008. [DOI] [Google Scholar]
- Fu L. You S.-J. Yang F.-l. Gao M.-m. Fang X.-h. Zhang G.-q. J. Chem. Technol. Biotechnol. 2010;85:715–719. doi: 10.1002/jctb.2367. [DOI] [Google Scholar]
- Modin O. Fukushi K. Water Sci. Technol. 2012;66:831–836. doi: 10.2166/wst.2012.255. [DOI] [PubMed] [Google Scholar]
- Asghar A. Abdul Raman A. A. Daud W. M. A. W. J. Chem. Technol. Biotechnol. 2014;89:1466–1480. doi: 10.1002/jctb.4460. [DOI] [Google Scholar]
- Wang Y.-J. Chen Z. Liu P.-P. Sun G.-X. Ding L.-J. Zhu Y.-G. J. Soils Sediments. 2016;16:1745–1753. doi: 10.1007/s11368-016-1369-6. [DOI] [Google Scholar]
- You S.-J. Wang J.-Y. Ren N.-Q. Wang X.-H. Zhang J.-N. Chemsuschem. 2010;3:334–338. doi: 10.1002/cssc.200900245. [DOI] [PubMed] [Google Scholar]
- Chen J.-y. Li N. Zhao L. J. Power Sources. 2014;254:316–322. doi: 10.1016/j.jpowsour.2013.12.114. [DOI] [Google Scholar]
- Arends J. B. A. Blondeel E. Tennison S. R. Boon N. Verstraete W. J. Soils Sediments. 2012;12:1197–1206. doi: 10.1007/s11368-012-0537-6. [DOI] [Google Scholar]
- Wang J. He M.-F. Zhang D. Ren Z. Song T.-s. Xie J. RSC Adv. 2017;7:44226–44233. doi: 10.1039/C7RA07799H. [DOI] [Google Scholar]
- Sun S.-P. Lemley A. T. J. Mol. Catal. A: Chem. 2011;349:71–79. doi: 10.1016/j.molcata.2011.08.022. [DOI] [Google Scholar]
- Gustave W. Yuan Z.-F. Sekar R. Ren Y.-X. Chang H.-C. Liu J.-Y. Chen Z. J. Soils Sediments. 2019;19(1):106–115. doi: 10.1007/s11368-018-2024-1. [DOI] [Google Scholar]
- Wu X. Yang X. Wu D. Fu R. Chem. Eng. J. 2008;138:47–54. doi: 10.1016/j.cej.2007.05.027. [DOI] [Google Scholar]
- Wei L. Guo S. Yan G. Chen C. Jiang X. Electrochim. Acta. 2010;55:8615–8620. doi: 10.1016/j.electacta.2010.08.011. [DOI] [Google Scholar]
- Li X. Li Y. Zhao X. Weng L. Li Y. J. Soils Sediments. 2017;18:1003–1008. doi: 10.1007/s11368-017-1785-2. [DOI] [Google Scholar]
- Jara C. C. Fino D. Specchia V. Saracco G. Spinelli R. Appl. Catal., B. 2007;70:479–487. doi: 10.1016/j.apcatb.2005.11.035. [DOI] [Google Scholar]
- Yuan H.-Y. Liu P.-P. Wang N. Li X.-M. Zhu Y.-G. Khan S. T. Alkhedhairy A. A. Sun G.-X. J. Soils Sediments. 2017;18:517–525. doi: 10.1007/s11368-017-1769-2. [DOI] [Google Scholar]
- Chen J.-y. Zhao L. Li N. Liu H. J. Power Sources. 2015;287:291–296. doi: 10.1016/j.jpowsour.2015.04.071. [DOI] [Google Scholar]
- Wang Y. Feng C. Li Y. Gao J. Yu C.-P. Chem. Eng. J. 2017;307:679–686. doi: 10.1016/j.cej.2016.08.094. [DOI] [Google Scholar]
- Zhao Y. Ma Y. Li T. Dong Z. Wang Y. RSC Adv. 2018;8:2059–2064. doi: 10.1039/C7RA12923H. [DOI] [PMC free article] [PubMed] [Google Scholar]
- Feng L. Chen X. Cao Y. Chen Y. Wang F. Chen Y. Liu Y. RSC Adv. 2017;7:14669–14677. doi: 10.1039/C7RA00807D. [DOI] [Google Scholar]
- Rossi R. Jones D. Myung J. Zikmund E. Yang W. Gallego Y. A. Pant D. Evans P. J. Page M. A. Cropek D. M. Logan B. E. Water Res. 2019;148:51–59. doi: 10.1016/j.watres.2018.10.022. [DOI] [PubMed] [Google Scholar]
- Li X. Wei J. Li Q. Zheng S. Xu Y. Du P. Chen C. Zhao J. Xue H. Xu Q. Pang H. Adv. Funct. Mater. 2018;28:1800886. doi: 10.1002/adfm.201800886. [DOI] [Google Scholar]
- Liang Z. Zhao R. Qiu T. Zou R. Xu Q. EnergyChem. 2019;1:100001. doi: 10.1016/j.enchem.2019.100001. [DOI] [Google Scholar]
- Xiong B. Zhong W. Zhu Q. Liu K. Li M. Sun G. Wang D. Nanoscale. 2017;9:19216–19226. doi: 10.1039/C7NR06559K. [DOI] [PubMed] [Google Scholar]
- Liou R. M. Water Sci. Technol. 2012;65:845–858. doi: 10.2166/wst.2012.627. [DOI] [PubMed] [Google Scholar]
- Bhushan B. Chauhan A. Samanta S. K. Jain R. K. Biochem. Biophys. Res. Commun. 2000;274:626–630. doi: 10.1006/bbrc.2000.3193. [DOI] [PubMed] [Google Scholar]
- Lou S. Jiang X. Chen D. Shen J. Han W. Sun X. Li J. Wang L. RSC Adv. 2015;5:27052–27059. doi: 10.1039/C4RA17218C. [DOI] [Google Scholar]
- Liu H. Hu T. J. Zeng G. M. Yuan X. Z. Wu J. J. Shen Y. Yin L. Int. Biodeterior. Biodegrad. 2013;76:108–111. doi: 10.1016/j.ibiod.2012.06.015. [DOI] [Google Scholar]
- Dai Q. Lei L. Zhang X. Sep. Purif. Technol. 2008;61:123–129. doi: 10.1016/j.seppur.2007.10.006. [DOI] [Google Scholar]
- Lovley D. R. Phillips E. J. Appl. Environ. Microbiol. 1988;54:1472–1480. doi: 10.1128/AEM.54.6.1472-1480.1988. [DOI] [PMC free article] [PubMed] [Google Scholar]
- Aelterman P. Rabaey K. Pham H. T. Boon N. Verstraete W. Environ. Sci. Technol. 2006;40:3388–3394. doi: 10.1021/es0525511. [DOI] [PubMed] [Google Scholar]
- Jiang J. Zhao Q. Zhang J. Zhang G. Lee D.-J. Bioresour. Technol. 2009;100:5808–5812. doi: 10.1016/j.biortech.2009.06.076. [DOI] [PubMed] [Google Scholar]
- Shen J. Feng C. Zhang Y. Jia F. Sun X. Li J. Han W. Wang L. Mu Y. J. Hazard. Mater. 2012;209–210:516–519. doi: 10.1016/j.jhazmat.2011.12.065. [DOI] [PubMed] [Google Scholar]
- Li J. Ai Z. Zhang L. J. Hazard. Mater. 2009;164:18–25. doi: 10.1016/j.jhazmat.2008.07.109. [DOI] [PubMed] [Google Scholar]
- Hanaoka K. Sun D. Lawrence R. Kamitani Y. Fernandes G. Biophys. Chem. 2004;107:71–82. doi: 10.1016/j.bpc.2003.08.007. [DOI] [PubMed] [Google Scholar]
- Zhou L. Hu Z. Zhang C. Bi Z. Jin T. Zhou M. Sep. Purif. Technol. 2013;111:131–136. doi: 10.1016/j.seppur.2013.03.038. [DOI] [Google Scholar]
- Tao H. C. Wei X. Y. Zhang L. J. Lei T. Xu N. J. Hazard. Mater. 2013;254–255:236–241. doi: 10.1016/j.jhazmat.2013.03.061. [DOI] [PubMed] [Google Scholar]
- Zhang H. Fei C. Zhang D. Tang F. J. Hazard. Mater. 2007;145:227–232. doi: 10.1016/j.jhazmat.2006.11.016. [DOI] [PubMed] [Google Scholar]
- Lai B. Chen Z. Zhou Y. Yang P. Wang J. J. Hazard. Mater. 2013;250–251:220–228. doi: 10.1016/j.jhazmat.2013.02.002. [DOI] [PubMed] [Google Scholar]


