Abstract
Pluripotent stem cells can be driven by manipulation of Wnt signaling through a series of states similar to those that occur during early embryonic development, transitioning from an epithelial phenotype into the cardiogenic mesoderm lineage and ultimately into functional cardiomyocytes. Strikingly, we observed that initiation of differentiation in induced pluripotent stem cells (iPSCs) and embryonic stem cells (ESCs) triggers widespread apoptosis, followed by a synchronous epithelial-mesenchymal transition (EMT). Apoptosis is caused by absence of bFGF from the differentiation medium. EMT requires induction of transcription factors SNAI1/SNAI2 downstream of MESP1 expression, and double knock-out of SNAI1/2, or loss of MESP1 in iPSCs blocks EMT and prevents cardiac differentiation. Remarkably, blockade of early apoptosis chemically or by ablation of pro-apoptotic genes also completely prevents the EMT, suppressing even the earliest events in mesoderm conversion, including BRA/T, TBX6, and MESP1 induction. Conditioned medium from WNT-activated WT iPSCs overcomes the block to EMT by cells incapable of apoptosis (Apop-), suggesting involvement of soluble factors from apoptotic cells in mesoderm conversion. Knockout of the PANX1 channel blocked EMT, while treatment with a purinergic P2 receptor inhibitor or addition of apyrase demonstrated a requirement for nucleotide triphosphate signaling. ATP and/or UTP was sufficient to induce a partial EMT in Apop- cells treated with WNT activator. Notably, knockout of the ATP/UTP-specific P2Y2 receptor blocked EMT and mesoderm induction. We conclude that nucleotides, in addition to acting as chemo-attractants for clearance of apoptotic cells can function as essential paracrine signals that, with WNT signaling, create a logical AND gate for mesoderm specification.
Introduction
The heart is the first organ to form during human development and deep understanding of human cardiogenesis is essential to our understanding of cardiovascular disease but the early events that are required for mesoderm induction and cardiac specification are still not fully understood. Human embryonic stem cells (ESCs) and induced pluripotent stem cells (iPSCs) can be converted along the mesoderm lineage into functional cardiomyocytes, which provides a valuable model through which to understand the mechanisms that initiate human mesoderm induction and cardiogenesis1–4. We have discovered that the induction of mesoderm conversion requires not only WNT activation but an additional signal through P2Y2 receptors that is activated by apoptosing cells.
Results
Cardiogenesis triggers apoptosis followed by EMT
Epiblast cells, ESCs and iPSCs all exhibit epithelial characteristics. The human iPSCs (GM25256) used in this study expressed epithelial polarity proteins including SCRB, LLGL2, PAR-3, PKC-zeta and PALS1 in addition to appropriate pluripotency markers (NANOG, OCT4, SOX2) (Fig. 1A and Extended Data Fig. 1A). They also assemble ZO-1 positive tight junctions (TJ) and E-cadherin positive adherens junctions (AJ), localize polarity proteins appropriately, and form monolayers with a cobblestone appearance (Fig. 1A). Treatment with a WNT activator (CHIR-99021, hereafter CHIR) for 48 hrs followed by treatment with a WNT inhibitor (Fig. 1B) was used to drive cardiomyocyte specification2. This protocol promoted exit from pluripotency and sequential induction of mid-primitive streak, marked by induction of EOMES and TBXT (Bra/T) between 9 – 36 hrs; lateral mesoderm, marked by TBX6 and MESP1 from 36 – 48 hrs, and cardiac mesoderm, marked by ISL1, NKX2.5 and ANP, from 48 – 72 hrs (Extended Data 1B,C). Consistent with previous data1,2, spontaneous beating of immature cardiomyocytes was observed after 10–12 days (Extended Data Video 1). Cardiac specification was accompanied by loss of E-cadherin, and expression of Slug and Vimentin (Extended Data Fig. 1D–E).
Figure 1.
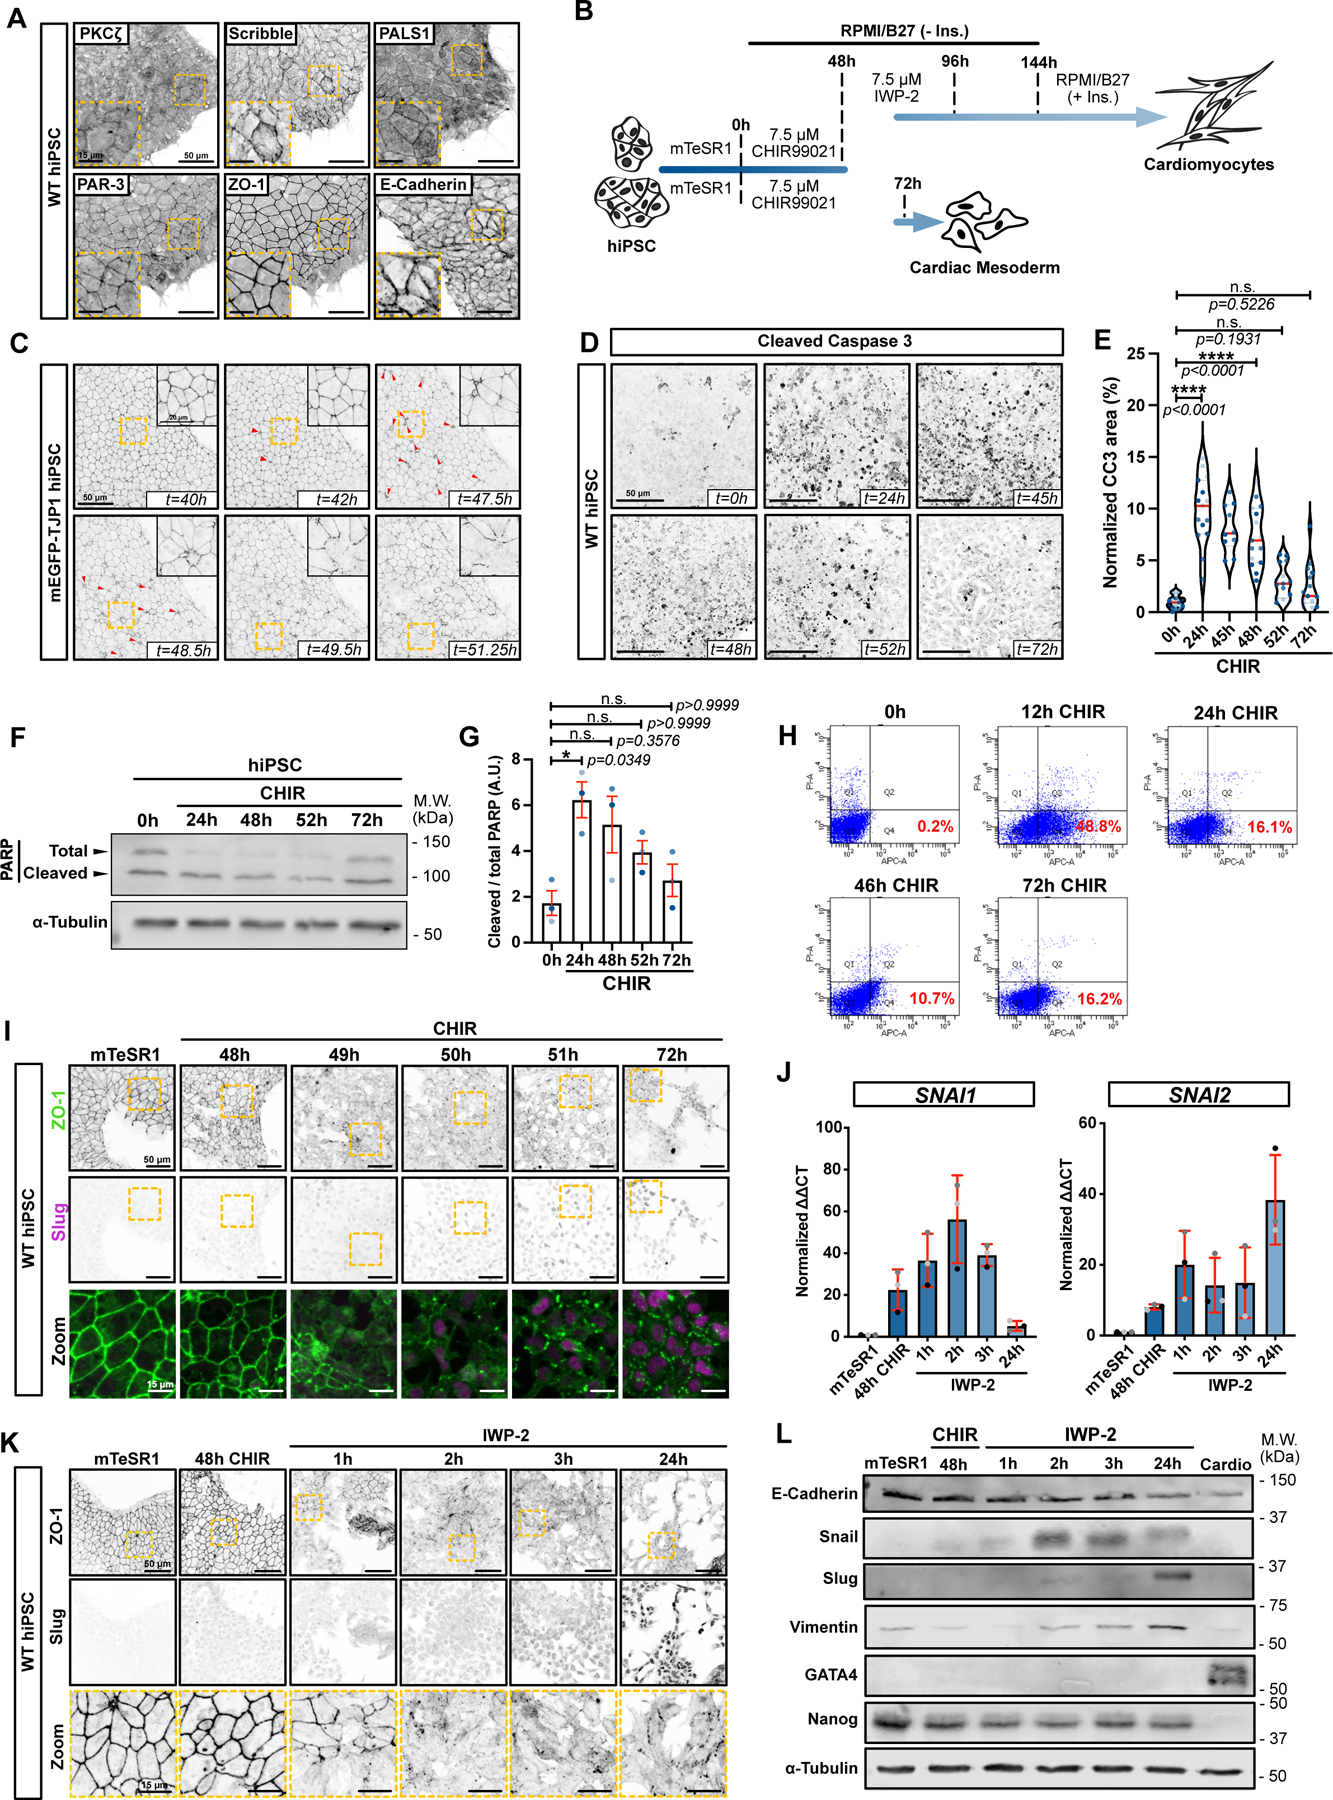
A) Maximum intensity projections (Max IPs) of hiPSCs stained for epithelial/polarity markers ZO-1, E-Cadherin, Scribble, PKCζ, PAR-3, and PALS1. Scale bar = 50μm. Inset shows magnified area (yellow dotted square). Scale bar = 15μm. (N=3 independent experiments).
B) Schematic of GiWi differentiation protocol (top path) (conversion of hiPSC into cardiomyocytes); or alternative protocol with prolonged incubation in CHIR-99021 (bottom path).
C) Stills from Extended Data Video 1. mEGFP-TJP1 hiPSCs were imaged from 40hrs after CHIR treatment. Red arrows mark extruding cells. Scale bar = 5μm. Max IPs are shown. Magnified area (yellow dotted square) is in the right-hand corner. Scale bar = 20μm.
D-E) Representative Max IPs of hiPSCs treated with CHIR and stained for cleaved Caspase-3. Scale bar = 50μm (D). Area of cleaved caspase-positive cells normalized to total cellular area. Biological repeats are color-coded N=10 random fields of view for the 45hr time point and N=15 random fields of view for all other time points, obtained from 2 and 3 independent biological repeats respectively. (Median: plain red line – Quartiles: black dotted lines). Tukey’s multiple comparison was applied (E).
F-G) Immunoblot of PARP cleavage in hiPSCs during CHIR treatment (F). Cleavage was quantified across 3 independent biological repeats (color-coded). Dunn’s multiple comparison was applied. Error bar = Mean +/− S.E.M. (G).
H) Cytometry gates from an Annexin-APC assay. Cells were treated with CHIR for different times, stained, and analyzed for Annexin exposure (x-axis) and PI (y-axis). Percentage Annexin-positive/PI-negative (Gate Q4 – Early apoptosis) is reported for each condition (N=1 experiment).
I) Max IPs of hiPSCs (mTeSR1) untreated or converting towards cardiac mesoderm, stained for ZO-1 and Slug. Scale bar = 50μm. Magnified area (yellow dotted square) is shown as a merge. Scale bar = 15μm. (N=3 independent experiments).
J) qRT-PCR of SNAI1 and SNAI2 RNA during differentiation. Biological repeats are color-coded (N=3 independent experiments). Error bar = Mean +/− S.D.
K) Max IPs of hiPSCs (mTeSR1) or cells undergoing differentiation using CHIR/IWP-2 protocol, stained for ZO-1 and Slug. Scale bar = 50μm. Magnified areas of ZO-1 staining (yellow dotted square) are shown in bottom row. Scale bar = 15μm. (N=3 independent experiments).
L) Immunoblots for EMT markers (E-Cadherin, Snail, Slug, Vimentin) GATA4 (cardiac specific marker) and Nanog (pluripotency marker) during hiPSC differentiation to cardiac mesoderm (N=3 independent experiments).
Source numerical data and unprocessed blots are available in source data.
Strikingly, induction of cardiogenesis resulted in extensive apoptosis (Fig. 1C and Extended Data Video 2), as measured by cleaved caspase 3, cleaved PARP, and Annexin exposure, that began within 12 hrs of addition of CHIR in RPMI medium, and diminished over 2 days (Fig. 1D–H and Supplementary Information for gating strategy). This was followed at 49–50 hrs by an abrupt wave of junction disassembly that was complete within ~2 hrs (Fig. 1l; Extended Data Video 2). Cell-cell contacts and cortical actin were also lost during this epithelial-mesenchymal transition (EMT), with acquisition of stress fibers and a spindle-shaped morphology (Extended Data Fig. 1F). Surprisingly, expression of E-cadherin did not diminish until ~24 hrs after junction disassembly (Extended Data Fig. 1G). Nonetheless, other markers of EMT were detected, including Snail (SNAI1) and Slug (SNAI2) (Fig. 1I,J).
The classical protocol for cardiac conversion requires addition of a WNT inhibitor such as IWP-2 at 48hrs post-WNT activation (Fig. 1B), but addition of IWP-2 did not block the EMT (Fig. 1K,L), suggesting that commitment to this process occurs prior to 48 hrs. Importantly, both apoptosis and the EMT also occurred in hESCs that were driven towards cardiac mesoderm, with increased PARP cleavage over the initial 2 days (Extended Data Fig. 1H–I), followed by increased Snail and Slug (Extended Data Fig. 1J).
Apoptosis is induced by bFGF withdrawal
Apoptosis appears specific to cardiac mesoderm conversion, as neural specification does not stimulate cell death, even though it activates caspases5. To investigate the mechanism triggering apoptosis we asked if the change in medium (from mTeSR1 to RPMI1640, hereafter RPMI) or addition of WNT activator impacted cell survival. Unexpectedly, RPMI lacking CHIR caused substantial apoptosis (Fig. 2 A–B), and addition of CHIR in RPMI did not further increase apoptosis (Fig. 2 A–B, Extended Data 2A), suggesting that the key factor is the medium switch rather than WNT activation. Importantly, however, RPMI lacking CHIR does not trigger EMT, even after prolonged treatment (Fig. 2C). Probing for mechanism, we compared the composition of each medium. mTeSR1 contains bFGF and TGFβ; therefore, we tested whether these growth factors would promote survival of iPSCs, and found that bFGF is sufficient, when added to RPMI, to block apoptosis and maintain survival at a level similar to mTeSR1 (Fig. 2D–G). Notably, initiation of apoptosis by RPMI without bFGF did not induce any of the changes in gene expression that accompany mesoderm conversion and the pluripotency factor NANOG was not repressed (Fig. 2 H–K). These data demonstrate that apoptosis is necessary but insufficient even for the earliest observed changes in gene expression in absence of WNT activation.
Figure 2.
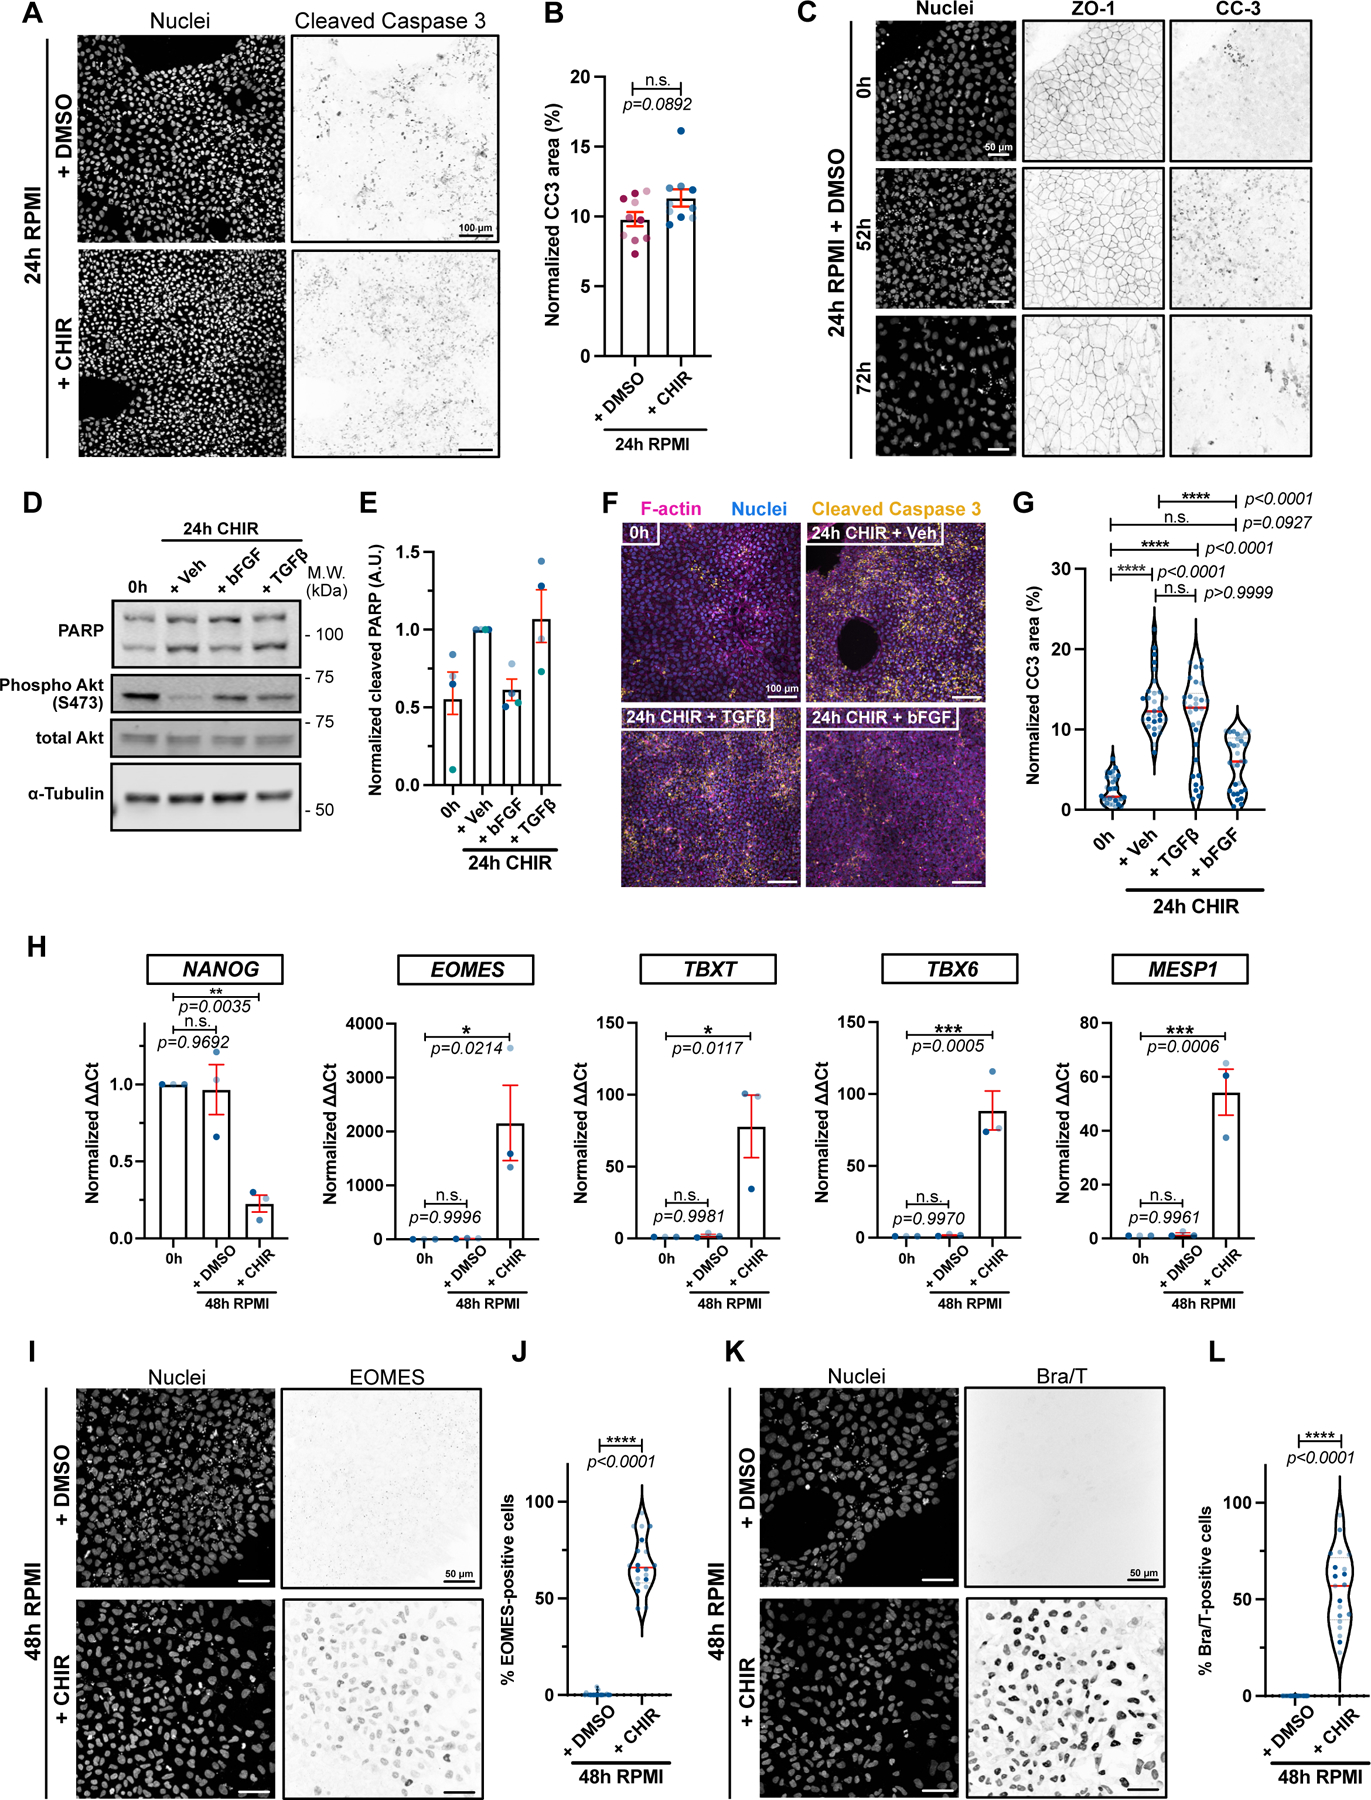
A-B) Max IPs of hiPSCs treated with RPMI/B27(-Ins.) +/− CHIR for 24hrs and stained for DNA and cleaved Caspase-3. Scale bar = 100μm (A). Cleaved Caspase staining was normalized to total cell area and shown in bar graph. Independent biological repeats are color-coded (N=10 random fields of view obtained from 3 independent biological repeats). Error bar = S.E.M. Mann-Whitney test was applied (two-tailed) (B).
C) Max IPs of hiPSCs treated with RPMI/B27(-Ins.) + DMSO and stained for DNA, ZO-1 and cleaved Caspase-3 at the indicated times. Scale bar = 50μm. (N=3 independent experiments).
D-E) Immunoblot of untreated hiPSCs (0h) or treated with RPMI/B27(-Ins) plus 20ng/mL bFGF, 1ng/mL TGFβ or Vehicle for 24hrs. Akt activation (Phospho-Akt S473) a positive control following growth factor addition (D). Ratio of cleaved/full length PARP is quantified (E). Biological repeats are color-coded (N=4 independent experiments). Error bar = Mean +/− S.E.M.
F-G) Max IPs of untreated hiPSCs (0hrs) or treated with RPMI/B27(-Ins) plus 20ng/mL bFGF, 1ng/mL TGFβ or Vehicle for 24hrs and stained for DNA, cleaved Caspase-3 and F-actin. Scale bar = 100μm (F). Cleaved Caspase-3 staining was normalized to total cell area and reported in (G). Biological repeats are color-coded (N=30 random fields of view obtained from 3 independent biological repeats). Median: plain red line – Quartiles: black dotted lines. Dunn’s multiple comparison test was applied.
H) qRT-PCR data for pluripotency marker (NANOG), primitive streak (EOMES), mesoderm (TBXT) and cardiac mesoderm (TBX6 and MESP1) from untreated hiPSCs (0hrs) or treated with RPMI +/− CHIR for 48hrs. Biological repeats are color-coded (n=3 independent experiments). Error bar = Mean +/− S.E.M. Tukey’s multiple comparison test was applied. Values from “+ CHIR” condition are from Extended Data 1 B–C.
I-L) Max IPs of WT hiPSCs treated with RPMI/B27(-Ins.) +/− CHIR for 48hrs and stained for DNA, EOMES (I) and T/Bra (K). Scale bar = 5 μm. Quantifications of EOMES and T/Bra expression are in (J) and (L) respectively. Biological repeats are color-coded (N=20 random fields of view obtained from 3 independent biological repeats). Median: plain red line – Quartiles: black dotted lines. Mann-Whitney test was applied (two-tailed).
Source numerical data and unprocessed blots are available in source data.
We next considered whether apoptosis of the iPSCs is random within colonies or occurs in clusters, indicative of a heterogeneity in response to loss of bFGF, and if cell competition is involved. Nearest neighbor distances between apoptosing cells were analyzed by the Clark-Evans aggregation index, an ecological parameter that describes spatial distributions of species in ecosystems6. Across multiple cell fields, the index value was not significantly different from 1.0, which is expected for random distributions (Extended Data Fig. 2B). This result is consistent with data from Jiang et al.7 that although there is heterogeneity in initial iPSC populations, this variability is not responsible for heterogeneous outcomes. A random distribution is also unlikely if cell competition were occurring in the iPSC population. Nonetheless, we also stained cells for c-MYC, based on data suggesting that high MYC expression generates “winner” cells in mouse ESCs and in pre-gastrulation mouse embryos8. We predicted that surviving “winners” would, therefore, have high MYC, but found the opposite to be true: MYC levels remained constant over the first 24 hrs then began to fall by 48hrs after WNT activation (Extended Data Fig. 2 C,D). We conclude that apoptosis is stochastic and does not occur through cell competition.
EMT is driven by SNAI1/SNAI2 expression downstream of MESP1
To investigate the mechanism of EMT, we first determined if proliferation rates slowed after addition of CHIR, which coupled with apoptosis would result in a lower cell density that might promote a mesenchymal phenotype. However, BrdU staining after a 1 hr pulse detected no change in proliferation over the initial 48 hrs (Extended Data Fig. 3A–B). We also immunostained cells for YAP to determine if a lower cell density induced by widespread apoptosis would promote nuclear retention and activation of this factor, which might also induce a mesenchymal phenotype. Surprisingly, YAP was predominantly nuclear even prior to WNT activation and its location did not change significantly over the following 72 hrs (Extended Data Fig. 3C,D).
Having previously characterized the temporal induction of key EMT regulators SNAI1 and SNAI2 during mesoderm conversion (Fig. 1J, Extended Data Fig. 1G), we asked if the EMT is dependent on SNAI1 and SNAI2, by CRISPR/Cas9-mediated gene editing in the iPSCs. Immunoblotting of lysates from 3 separate (non-clonal) double knockout (DKO) iPSC lines showed a significant decrease in both Snail and Slug levels during cardiac mesoderm conversion, compared to a non-targeting gRNA (Fig. 3A,B). Knockout of either gene alone had little effect because of compensatory induction of the remaining gene but a SNAI1/2 DKO efficiently blocked EMT (Fig. 3C). Moreover, these cells did not continue down the cardiac mesoderm lineage, as key markers such as cardiac Troponin T (cTnT) were not induced (Fig. 3D). We conclude that the EMT induced by WNT activation in iPSCs is driven through expression of Snail and Slug, and that these factors are essential for specification of the cardiac lineage.
Figure 3.
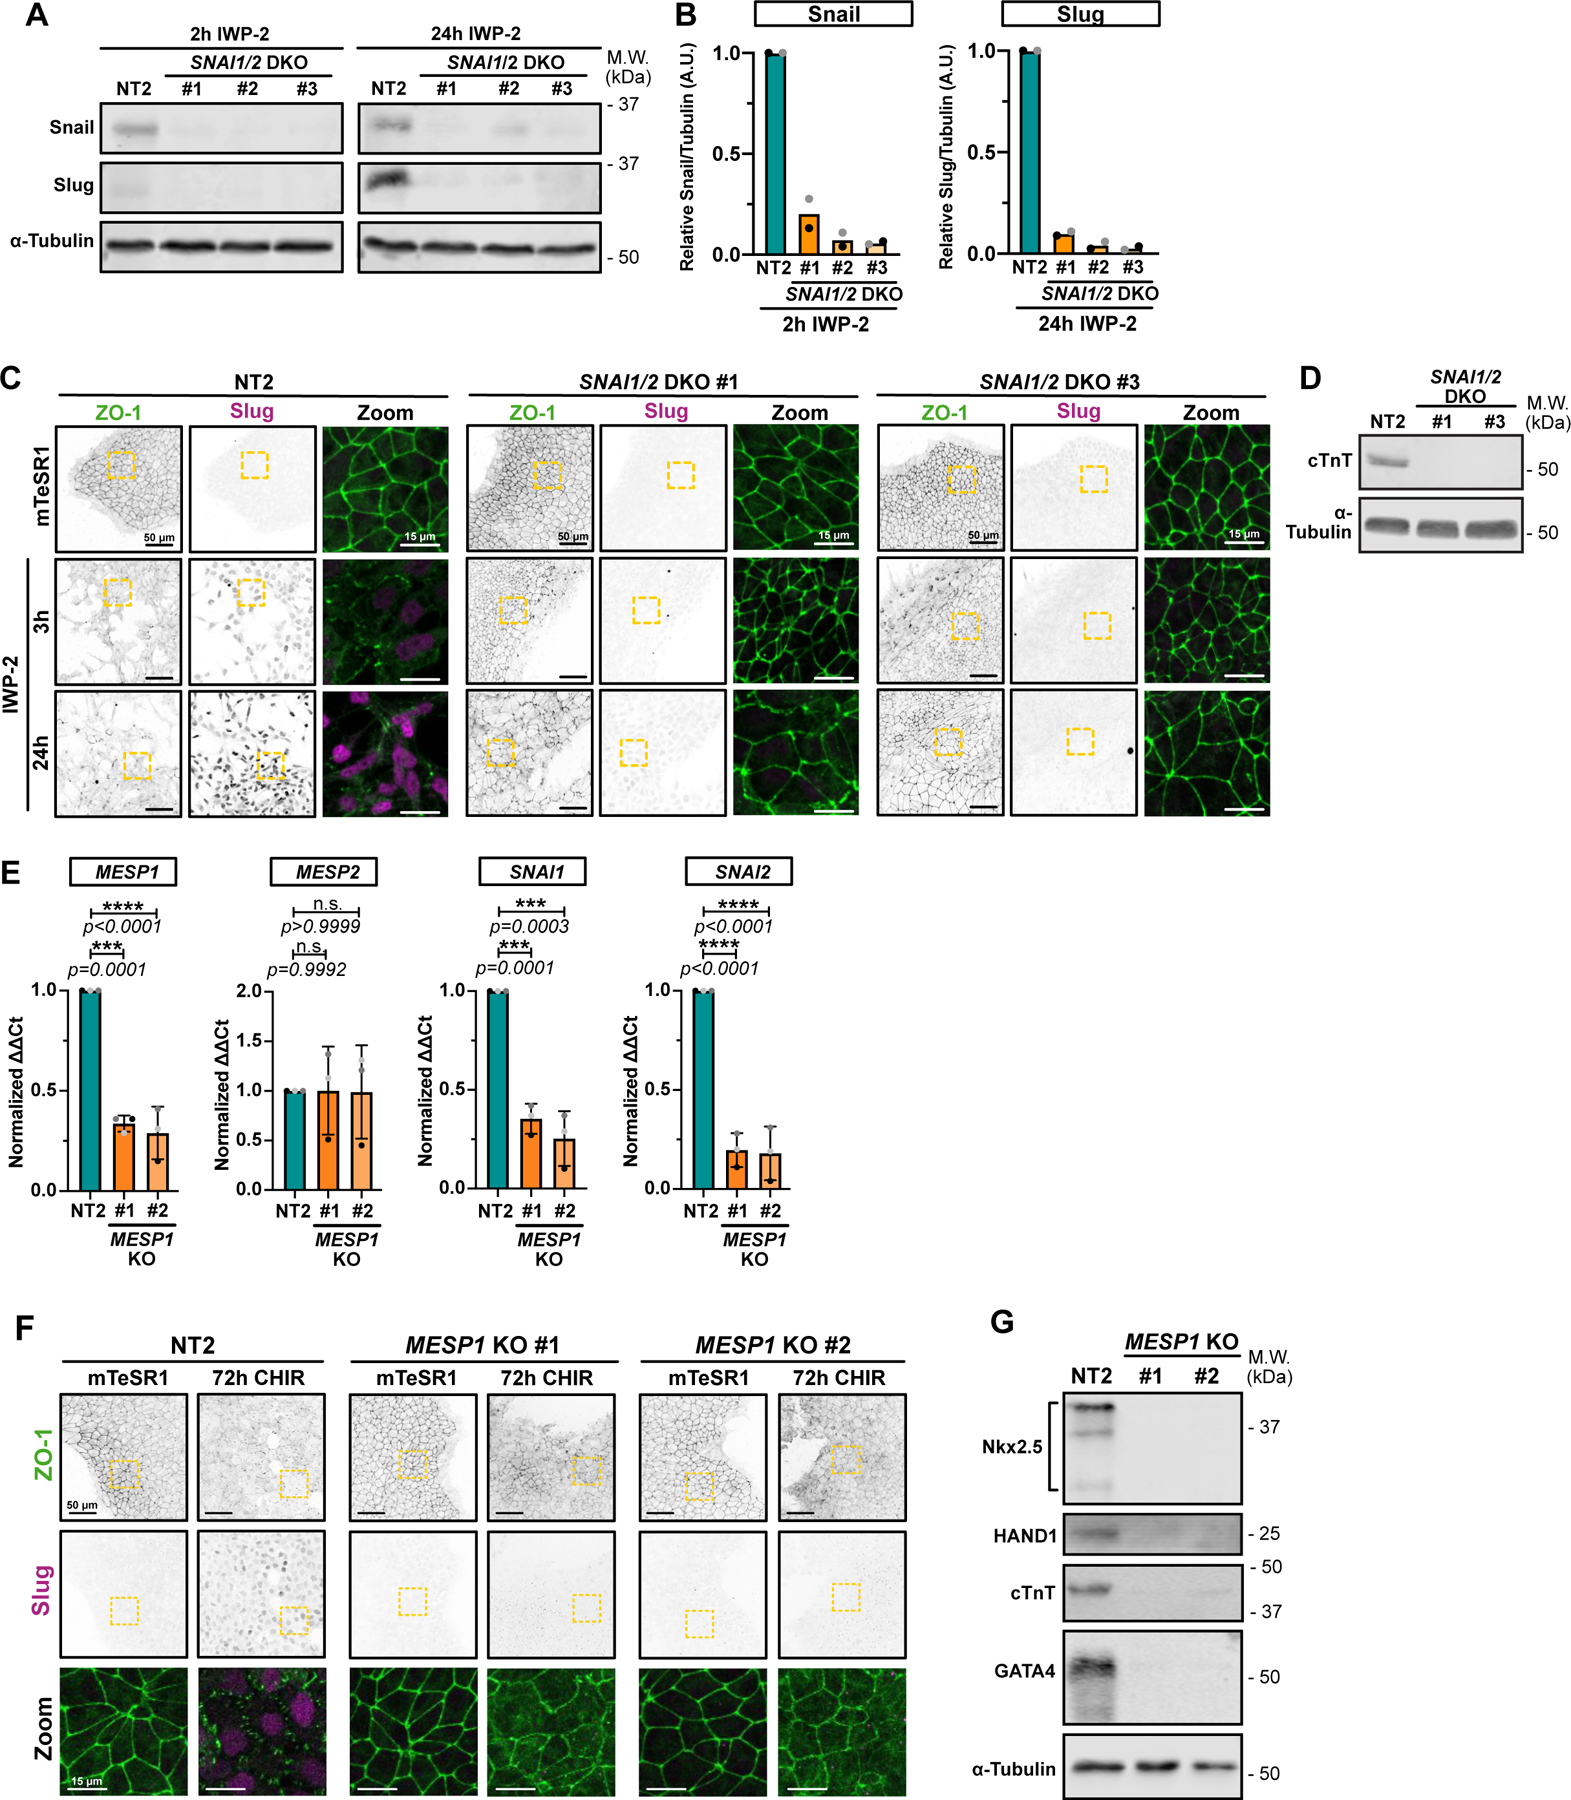
A-B) Representative immunoblot of SNAI1/SNAI2 double knockout (DKO) hiPSC cell lines (non-clonal). Lysates from Non-targeting (NT2) or DKO cell lines were collected 2hrs after IWP-2 treatment (to confirm SNAI1 knockout – Left panel) or 24hrs after IWP-2 treatment (to confirm SNAI2 knockout – Right panel). Expression levels of Snail and Slug from 2 biological replicates were quantified by densitometry and normalized to NT2 (B).
C) Representative immunofluorescence images of control NT2 and two independent SNAI1/SNAI2 DKO lines, fixed at different time points and stained for ZO-1 (green) and Slug (Magenta). Max IPs are shown. Scale bar = 50μm. Magnified area (yellow dotted square) is shown as a merge. Scale bar = 15μm. (n=3 independent experiments).
D) Immunoblot of control NT2 and SNAI1/SNAI2 DKO #1 and #3 hiPSC-derived cardiomyocytes, at 12 days post induction. Expression of cardiac Troponin T (cTnT) and α-Tubulin as loading control were analyzed. Molecular weights (M.W.) are indicated in kDa.
E) Relative gene expression of MESP1, MESP2, SNAI1 and SNAI2 obtained from control (NT2) or two independent MESP1 knockout hiPSCs line (#1 and #2) were analyzed by qRT-PCR. ΔΔCt values were normalized to NT2. Independent biological repeats are color-coded (n=3 independent experiments). Error bar = Mean +/− S.D. Dunnett’s multiple comparison test was applied.
F) Representative Max IPs of control NT2 and two independent MESP1 KO (#1 and #2) non-clonal cell lines stained for ZO-1 (green) and Slug (Magenta) before (mTeSR1) and after 72hrs CHIR treatment. Scale bar = 50μm. Magnified area (yellow dotted square) is shown as a merge. Scale bar = 15μm.
G) Immunoblot of control NT2 and MESP1 KO #1 and #2 hiPSC-derived cardiomyocytes, at 12 days post induction. Expression of cardiac lineage markers (cardiac Troponin T, Nkx-2.5, GATA-4, HAND1) and α-Tubulin as loading control were analyzed.
Source numerical data and unprocessed blots are available in source data.
MESP1 is a pioneer cardiac factor in vivo. During ESC differentiation, Mesp1 is expressed in cardiac mesoderm progenitors and is required for cardiogenesis9. Moreover, MESP1 regulates expression of multiple EMT-promoting genes including SNAI1.9 Testing for epistatic relationships in our system and consistent with these data, we found that KO of MESP1 prevented induction of SNAI1/2, blocked the scheduled EMT post-addition of CHIR, suppressed expression of NKX2.5, HAND1, cTNT and GATA4, and prevented differentiation into cardiomyocytes (Fig. 3E–G; Extended Data Video 3). Non-targeting gRNA had no effect, and the MESP1 gRNA had no effect on MESP2 expression (Fig. 3E–G). We conclude that MESP1 induces SNAI1/2, which in turn drive a highly synchronous EMT that is essential for further differentiation along the cardiac lineage.
Apoptosis is essential for SNAI1/SNAI2 induction and EMT
As described above, the initial CHIR treatment of iPSCs caused rapid, widespread apoptosis, as detected by cleaved caspase 3, PARP cleavage, and Annexin exposure (Fig. 1C–H).
To test whether apoptosis has any impact on EMT and conversion into cardiac mesoderm, we blocked cell death in cultures treated with CHIR using the pan-caspase inhibitor Q-VD-OPH. Remarkably, this drug totally prevented the scheduled EMT (Fig. 4A). The cells maintained a cobblestone appearance, retained tight junctions, grew to high density (Extended Data 4G), and failed to express Snail or Slug (Fig. 4A–C). Inhibition of apoptosis was marked by the absence of Hoechst-positive apoptotic bodies (Fig. 4A) and of cleaved Caspase 3 and PARP (Fig. 4B). A similar effect of Q-VD-OPH on EMT was observed in hESCs (Extended Data Fig. 4A–C).
Figure 4.
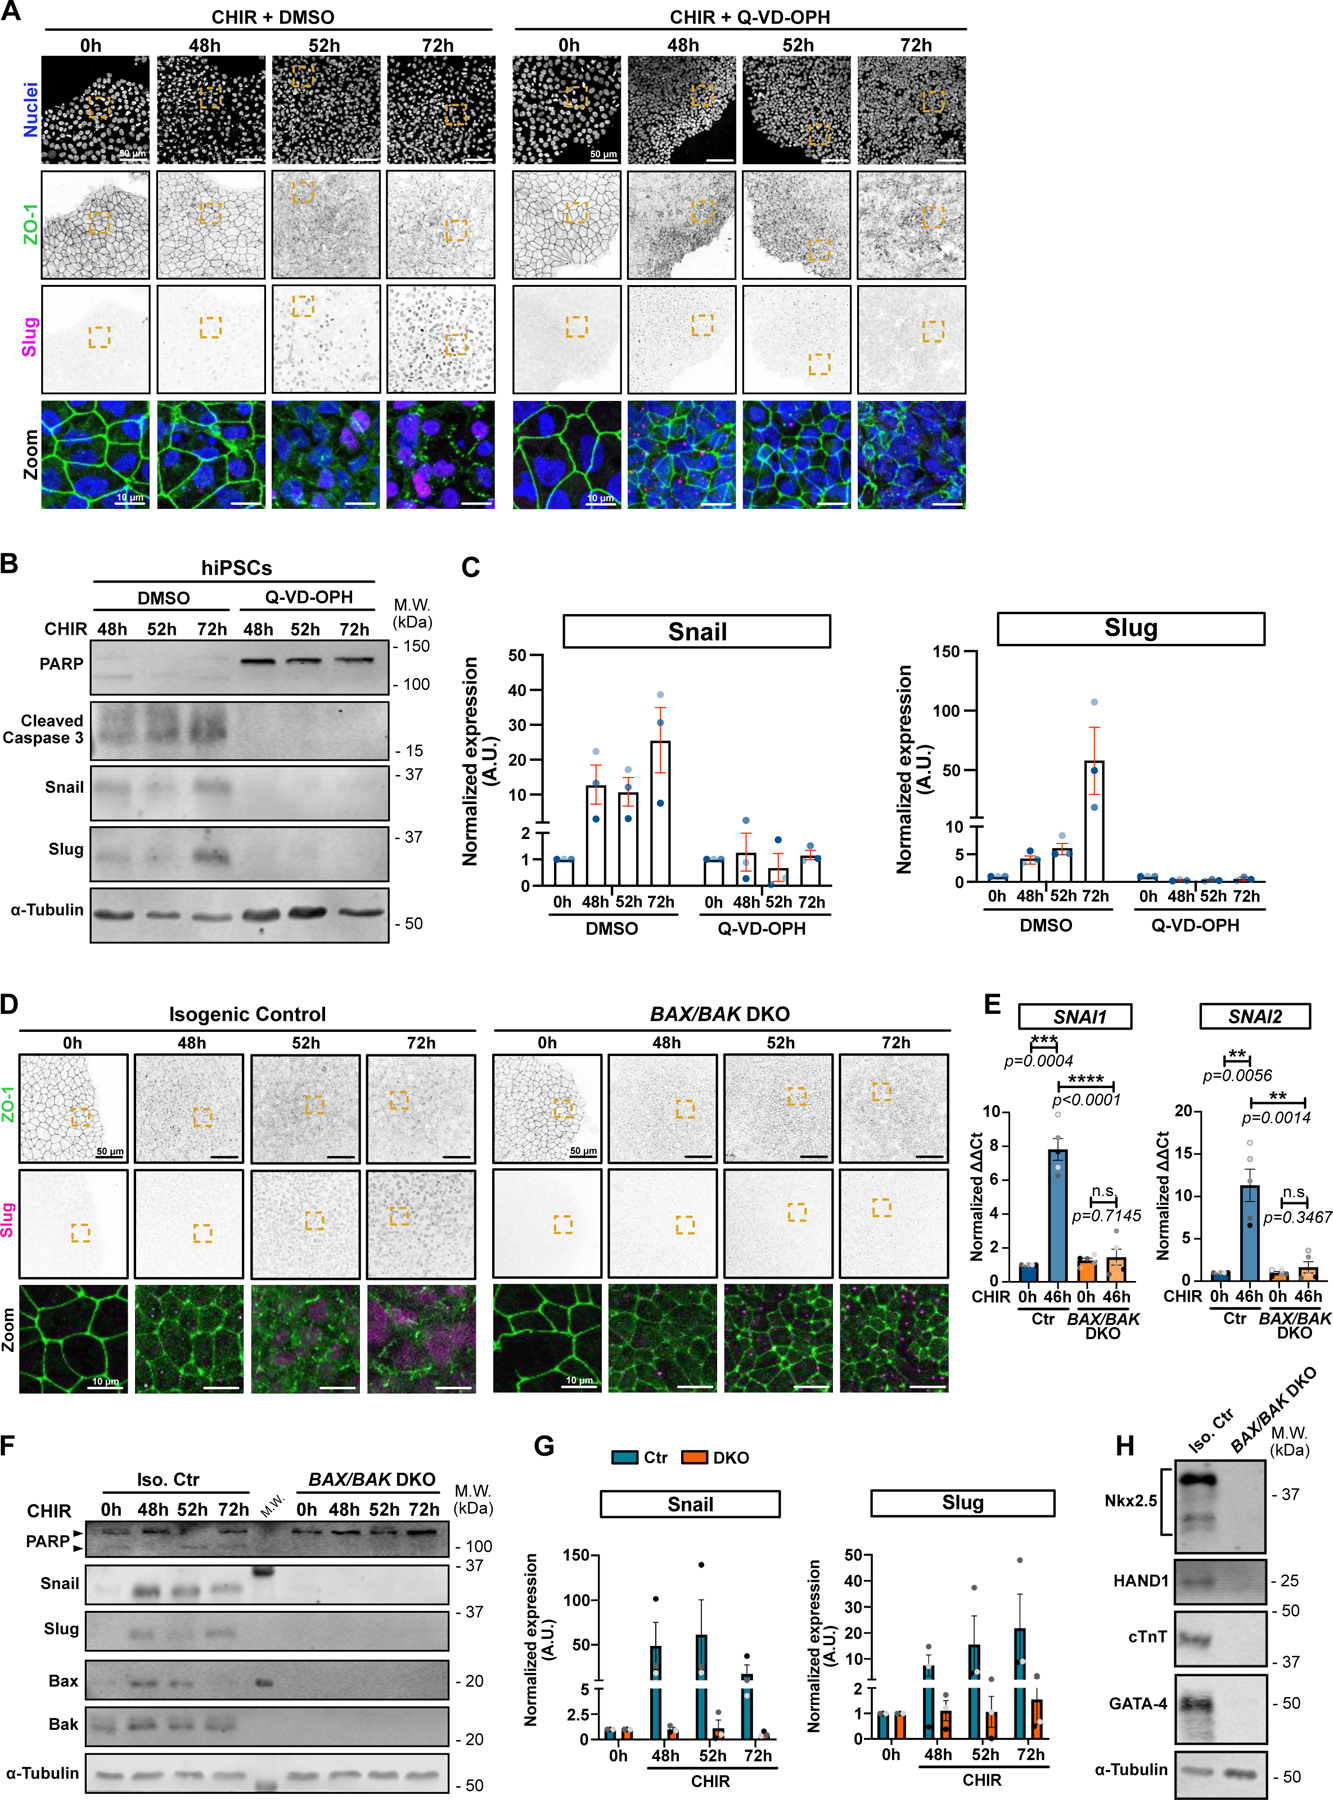
A) Representative Max IPs of hiPSCs co-treated with CHIR + DMSO (left) or CHIR + 10 μM Q-VD-OPH (right) stained for ZO-1 (green), Slug (magenta) and nuclei (blue) at indicated time. Scale bar = 50 μm. Magnified area (yellow dotted square) is shown as a merge. Scale bar = 10μm.
B-C) Immunoblot analysis of hiPSCs co-treated with CHIR + DMSO or 10 μM Q-VD-OPH and analyzed for cell death marker (PARP and cleaved Caspase-3), EMT markers (Snail and Slug) α-Tubulin as loading control. Molecular weights (M.W.) are indicated in kDa (B). Normalized expression of Snail and Slug was quantified by densitometry across 3 independent biological replicates (color-coded). Mean +/− S.E.M. (C).
D) Max IPs images of isogenic control and BAX/BAK double knockout (DKO) hiPSCs, treated with CHIR and stained for ZO-1 (green) and Slug (magenta) at the indicated time. Scale bar = 50 μm. Magnified area (yellow square) is shown as a merge. Scale bar = 15μm.
E) Relative gene expression of SNAI1 and SNAI2 obtained from isogenic control (Ctr) or BAX/BAK DKO hiPSCs, +/−CHIR for 46hrs and analyzed by qRT-PCR. ΔΔCt values were normalized to un-induced control cells. Biological repeats are color-coded (N=5 independent experiments). Error bar = Mean +/− S.E.M. Two-tailed paired t-test was applied to compare 0hrs vs 46hrs and unpaired t-test was applied to compare Ctr vs DKO.
F-G) Immunoblot analysis of isogenic control (Iso. Ctr) and BAX/BAK DKO hiPSCs, treated with CHIR and collected at indicated time. Molecular weights (M.W.) are indicated in kDa (F). Normalized expression of Snail and Slug was quantified by densitometry across 3 biological replicates (color-coded). Mean +/− S.E.M. (G).
H) Immunoblot of isogenic control (Iso. Ctr) and BAX/BAK DKO hiPSC-derived cardiomyocytes, at 12 days post induction. Expression of cardiac lineage markers (cardiac Troponin T, Nkx-2.5, GATA-4, HAND1) and α-Tubulin as loading control were analyzed.
Source numerical data and unprocessed blots are available in source data.
To validate the connection to cell death we generated iPSC lines deleted for the apoptotic executioner proteases Caspase 3 or Caspase 9 (Extended Data Fig. 4D). These lines did not proliferate as rapidly as the parental WT or the control non-target (NT) iPSCs, but nonetheless formed island cultures. Notably, treatment with CHIR did not cause TJ disassembly, even after prolonged incubation, and did not induce SNAI1/2 (Extended Data Fig. 4E–F).
Next, to block apoptotic events upstream of caspase activation, we deleted the pro-apoptotic genes BAX and BAK10. Unlike the CASP3 and 9 KO lines, these BAX/BAK DKO cells grew at rates comparable to control cells and to cells treated with Q-VD-OPH (Extended Data Fig. 4G,H), but again, no EMT was detected after treatment with CHIR as determined by persistence of TJs (Fig. 4D) and the absence of SNAI1/2 expression (Fig. 4D–G). Moreover, upon completion of the differentiation protocol, BAX/BAK DKO cells failed to express cardiac markers, lacked the typical sarcomere structure compared to their isogenic control counterpart, and showed no spontaneous beating (Fig. 4H; Extended Data Fig. 4I and Extended Data Video 4). Similarly, addition of Q-VD-OPH during both CHIR and IWP-2 steps blocked induction of the cardiac marker HAND1 (Extended Data Fig. 4J).
Together, these data support an unanticipated requirement for apoptosis, induced by bFGF withdrawal, to license WNR responsiveness in pluripotent cells. Importantly, apoptosis alone is not sufficient to promote mid-primitive streak gene induction or an EMT in surviving cells (Fig. 2C, H–L).
Apoptosis is required early in selection of mesoderm lineage
To determine at which stage apoptosis permits pluripotent stem cells to differentiate, we treated BAX/BAK DKO iPSCs with CHIR, then harvested cells at 46 hrs for qRT-PCR. Surprisingly, even very early changes in gene expression, including TBXT (T/Bra) and EOMES, were drastically reduced (Fig. 5A). A similar suppression was caused by treatment of WT iPSCs with QVD-OPH prior to CHIR addition (Extended Data Fig. 5A–C). The failure to express these genes was confirmed by immunofluorescence (Fig. 5B,C) and by immunoblotting for T/Bra (Fig. 5D). A similar loss of T/Bra and EOMES expression was caused by knockout of CASP3 or CASP9 (Extended Data Fig. 5D–G). Later changes associated with mesoderm induction, including TBX6 and MESP1 were also inhibited by blocking apoptosis (Fig. 5A, Extended Data Fig. 5C); however, expression of the pluripotent marker Nanog decreased on schedule (Fig. 5E). Importantly, DKO iPSCs lacking BAX and BAK can still enter the neuronal lineage10 suggesting lineage-specific effects.
Figure 5.
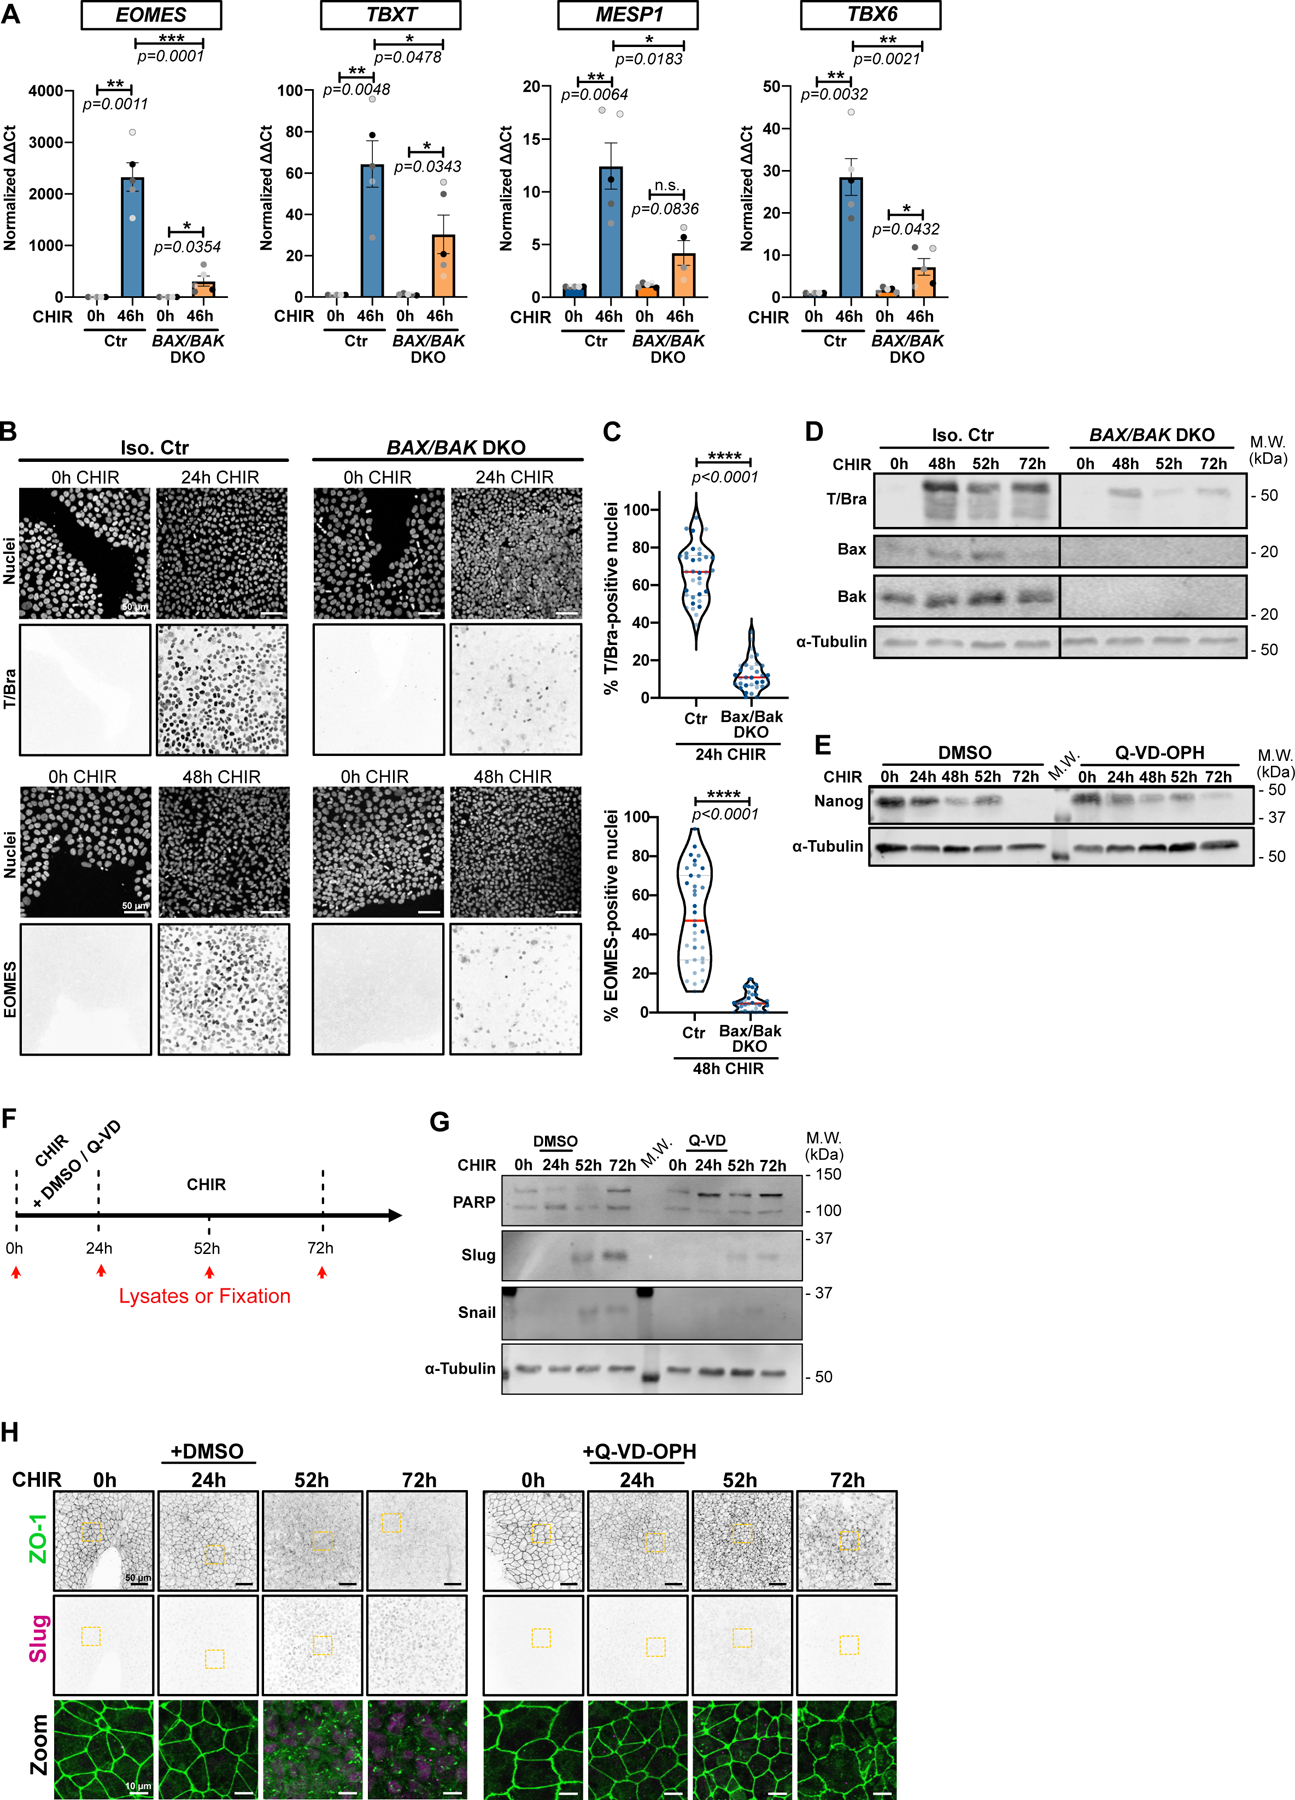
A) Relative gene expression of EOMES, TBXT, MESP1, TBX6 obtained from isogenic control (Ctr) or BAX/BAK DKO hiPSCs, induced or not with CHIR for 46hrs and analyzed by qRT-PCR. ΔΔCt values were normalized to un-induced cells. Biological repeats are color-coded (N=5 independent experiments). Error bar = Mean +/− S.E.M. Two-tailed paired t-test was applied to compare 0hrs vs 46hrs and unpaired t-test was applied to compare Ctr vs DKO.
B-C) Max IPs images of isogenic control (Iso. Ctr) and BAX/BAK DKO hiPSCs stained for T/Bra (top) and EOMES (bottom) and nuclei, before (0hrs) and after CHIR treatment. Scale bar = 50 μm. (B). Percentage of T/Bra-positive (top) and EOMES-positive (bottom) nuclei after CHIR treatment (Median: plain red line – Quartiles: black dotted lines). Biological repeats are color-coded (N=35 random fields of view for EOMES quantification in Iso. Ctr cells and n=34 random fields of view for the remaining data set, all obtained from 3 independent experiments). Mann-Whitney test was applied (C).
D) Immunoblot of isogenic control (Iso. Ctr) and BAX/BAK DKO hiPSCs analyzed for T/Bra expression following CHIR addition.
E) Immunoblot of WT iPSC treated with CHIR +/− 10 μM Q-VD-OPH and analyzed for Nanog expression.
F) Experimental design schematic. Lysate collection and sample fixation time is depicted by red arrows. hiPSCs were treated with CHIR +/− 10 μM Q-VD-OPH for 24hrs, then Q-VD-OPH was washed out and cells were incubated for another 28hrs or 48hrs with CHIR only (respectively 52hrs and 72hrs time point).
G-H) Representative immunoblot (G) and Max IPs images (H) obtained as explained in (F). Membranes were blotted for PARP (cell death marker), and expression level of Snail/Slug (EMT markers) were analyzed. α-Tubulin was used as loading control (G). Scale bar = 50μm. Magnified area (yellow dotted square) is shown as a merge. Scale bar = 15μm.
Source numerical data and unprocessed blots are available in source data.
These data demonstrate that, even though apoptosis continues for >40 hrs after WNT signaling activation, it is necessary for a very early event following initiation of mesoderm specification. To further test this hypothesis, we treated WT iPSCs with CHIR and added Q-VD-OPH only for the first 24 hrs, after which the medium was replaced by CHIR alone for an additional 48 hrs (Fig. 5F) or, as a control, iPSCs were treated with CHIR alone until 24 hrs had passed, then incubated with CHIR + Q-VD-OPH (Extended Data Fig. 5H–J). Notably, early addition of this inhibitor completely blocked the subsequent EMT and strongly reduced Snail/Slug induction (Fig. 5G–H); but addition after 24 hrs had no effect and EMT occurred on schedule (Extended Data Fig. 5I,J). Together, these data highlight an unanticipated essential role for apoptosis in the initial steps by surviving stem cells towards mesoderm specification.
Soluble factor from apoptotic cells licenses mesoderm induction
How might apoptosis allow pluripotent stem cells to enter the cardiac mesoderm lineage? We found no evidence for changes in proliferation or YAP activity (Extended Data 3) but, alternatively, apoptotic cells might release a soluble factor that promotes mesoderm conversion. To test this hypothesis, we treated WT and the BAK/BAX DKO iPSCs for 24 hrs with CHIR then replaced the DKO medium with conditioned medium (CM) from apoptosing WT iPSCs, and incubated the DKO cells for a further 48 hrs (Fig. 6A). Remarkably, DKO cells receiving CM underwent a dramatic EMT (Fig. 6B). To test if CM also relieved the blockade caused by the resistance of DKO cells to apoptosis, we performed RT-qPCR and found significant increases in EOMES, MESP1, TBX6, and SNAI1/2 (Fig. 6C). These results demonstrate that a soluble factor released by apoptosis of iPSCs is required for mesoderm conversion and consequent EMT of the surviving iPSC population.
Figure 6.
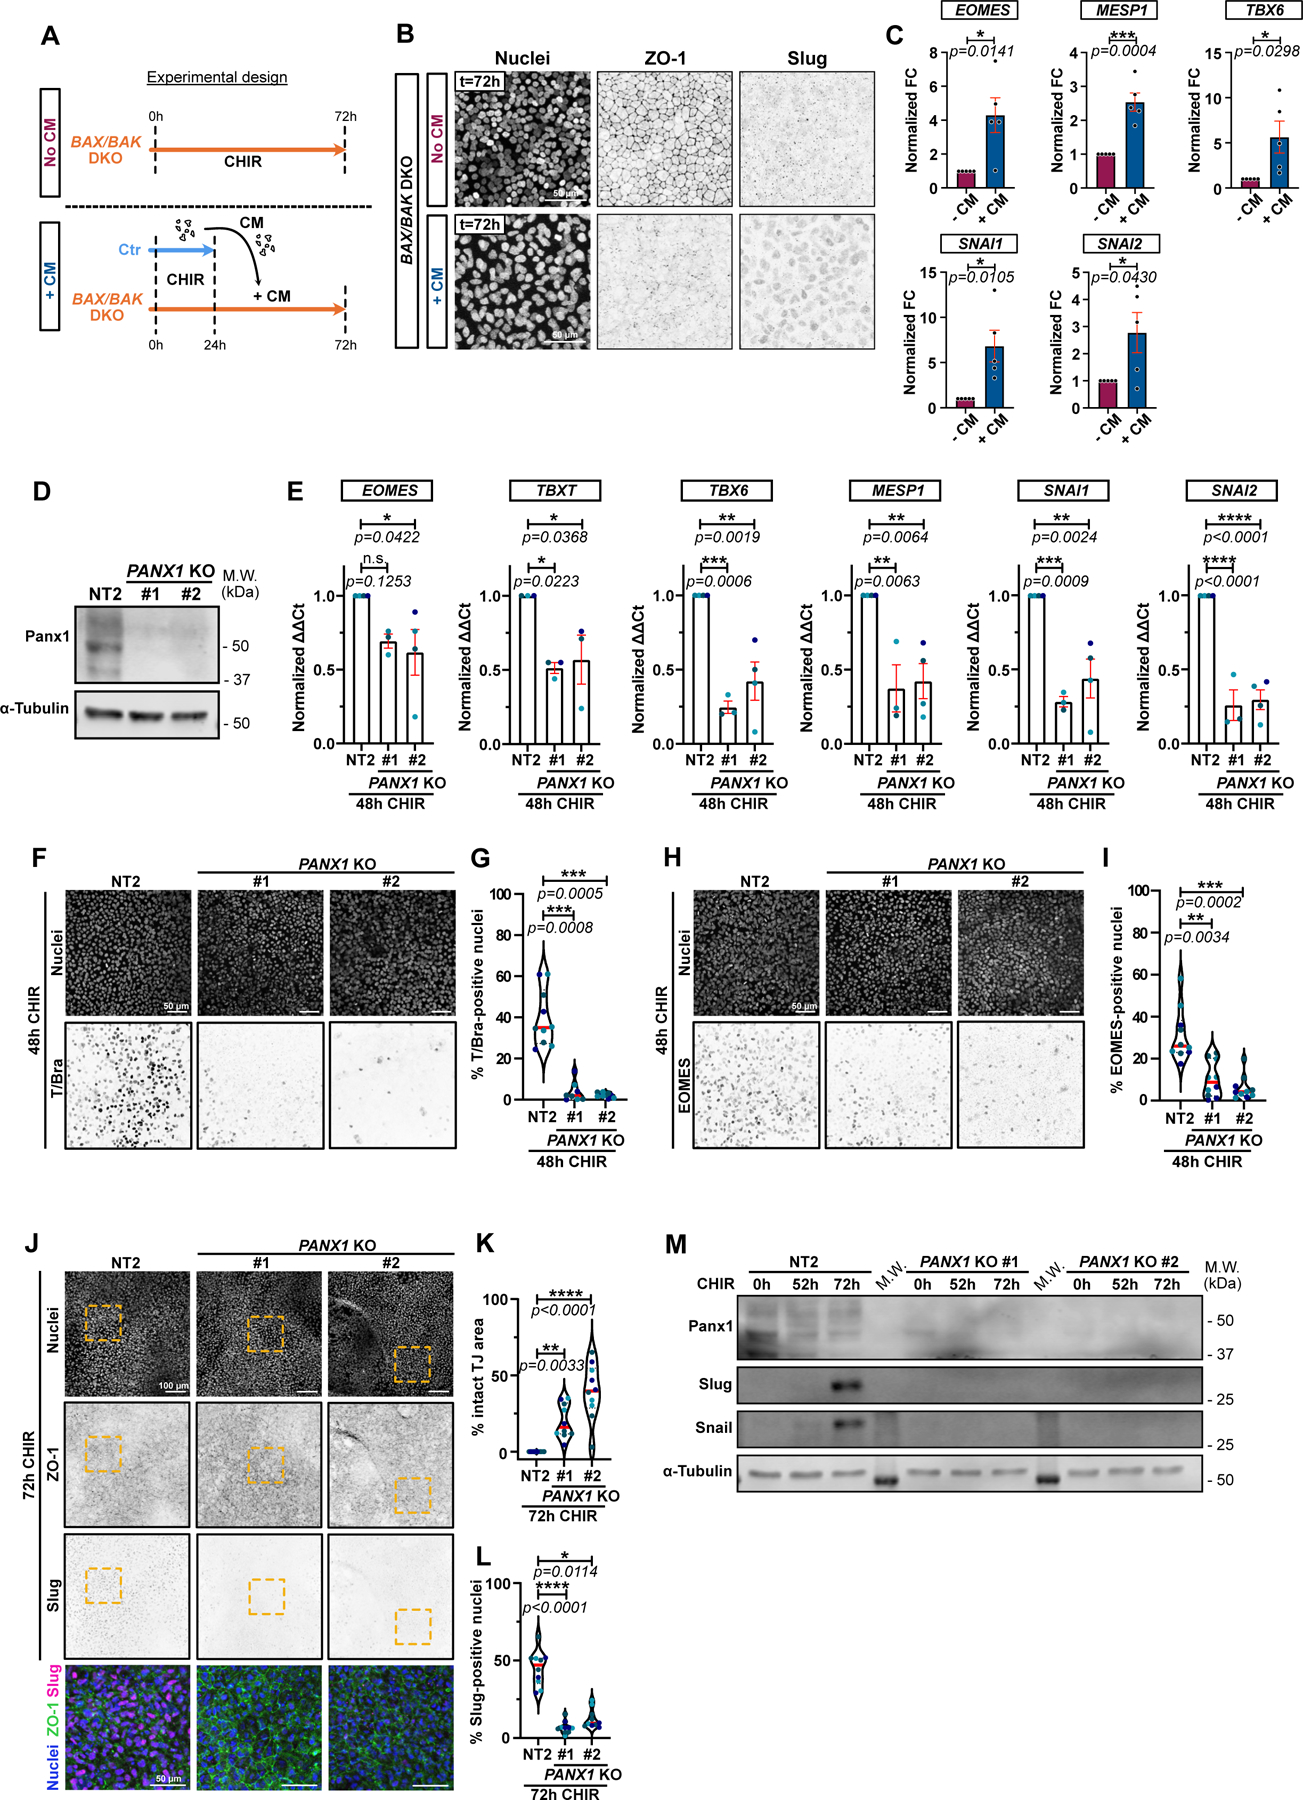
A) Timeline of conditioned media (CM) experiment. Isogenic control (Ctr) and BAX/BAK DKO cells were treated with CHIR for 24hrs. Ctr cell supernatant was transferred onto BAX/BAK DKO and incubated for another 48hrs. As a control, BAX/BAK DKO were kept in CHIR for 48hrs (No CM).
B) Max IPs of BAX/BAK DKO cells treated in (A), stained for ZO-1, Slug, and nuclei. Scale bar = 50μm.
C) Relative expression of EOMES, MESP1, TBX6, SNAI1 and SNAI2 in BAX/BAK DKO hiPSCs treated as in A and analyzed by qRT-PCR across 5 biological repeats. Fold-change in ΔΔCt values normalized to -CM condition. Error bar = Mean +/− S.E.M. Two-tailed paired t test was applied.
D) Immunoblot for Pannexin-1 on control NT2 and 2 independent PANX1 KO cell lines (#1 and #2).
E) Relative expression of EOMES, TBXT, TBX6, MESP1, SNAI1 and SNAI2 from control NT2 or PANX1 KO hiPSCs, analyzed after 48hrs +CHIR. ΔΔCt values normalized to NT2. Biological repeats are color-coded (N=3 independent experiments for KO #1 and n=4 independent experiment for NT2 and KO #2, except for TBXT where all data set were obtained from 3 independent experiments). Error bar = Mean +/− S.E.M. Dunnett’s multiple comparisons test was applied.
F-I) Max IPs of control (NT2) and PANX1 KO hiPSCs stained for T/Bra (F) or EOMES (H) and nuclei, after +CHIR. Scale bar = 50μm. (F, H). Percentage T/Bra-positive (G) and EOMES-positive (I) nuclei (Median: plain red line – Quartiles: black dotted lines). Biological repeats are color-coded (G: N=8 random fields of view for KO #1 and n=10 random fields of view for NT2 and KO #2, obtained from 3 independent experiments. I: N=10 random fields of view obtained from 3 independent experiments). Dunn’s multiple comparison test was applied (G, I).
J-L) Max IPs of control (NT2) and PANX1 KO hiPSCs stained for ZO-1 (green), Slug (magenta) and nuclei (blue) after 72hrs +CHIR. Scale bar = 100μm. Magnified area (yellow square) shown as a merge. Scale bar = 50μm (J). Percentage of normalized area with intact tight junctions (K) and percentage Slug-positive (L) nuclei (Median: plain red line – Quartiles: black dotted lines). Biological repeats are color-coded (N=10 random fields of view obtained from 3 independent experiments). Tukey’s multiple comparison and Dunn’s multiple comparison test was applied respectively in (K) and (L).
M) Immunoblot of Snail and Slug from control NT2 and PANX1 KO cells following CHIR treatment.
Source numerical data and unprocessed blots are available in source data.
The permissive factor is released through PANX1 channels
The release of soluble “find-me” signals by apoptosing cells to recruit phagocytes is mediated by pannexin 1 (PANX1) channels11,12,13. Mechanistically, PANX1 is a substrate for effector caspases during apoptosis, which generates a constitutively open channel14. Therefore, we asked if this channel is required for transmission of the permissive signal to surviving cells. PANX1 was deleted in iPSCs using two different gRNAs, and the cells were then induced by addition of CHIR and assayed for EMT and expression of mesoderm genes. For each gRNA we observed efficient knockout and inhibition of mesoderm lineage genes, both at mRNA and protein levels (Fig. 6D–I). Moreover, the EMT was suppressed, as were Snail and Slug expression (Fig. 6J–M), and spontaneous beating of the cells was strongly reduced (Extended Data Video 5). Finally, we treated WT iPSCs with CHIR with or without carbenoxolone, an inhibitor of gap junctions and pannexin channels. This treatment also blocked EMT and cardiomyocyte specification (Extended Data Fig. 6A–F and Extended Data Video 6)
ATP/UTP permit surviving cells to respond to WNT
Nucleotides have been identified as potent find-me signals15, and PANX channels are known conduits for ATP16. Therefore, we first tested, using a luciferase assay, whether apoptosing iPSCs release ATP during cell conversion. CHIR treatment caused a significant increase in extracellular ATP within 8 hrs (Fig. 7A). This effect was dependent on dying cells as addition of Q-VD-OPH totally blocked ATP release. Moreover, addition of apyrase to hydrolyze triphospho-nucleotides, partially blunted the EMT induced by CM on BAX/BAK DKO cells (Fig. 7 B,C). This result was confirmed when apoptosis was blocked in WT cells using Q-VD-OPH for 24hrs prior to adding the CM +/− apyrase (Extended Data Fig. 7A,B). Additionally, EOMES and T/Bra protein levels were suppressed in WT hiPSCs co-treated with CHIR and apyrase at 52 hrs post-induction (Fig. 7D–H). Apyrase treatment also significantly reduced Snail and Slug expression (Fig. 7I–J)).
Figure 7.
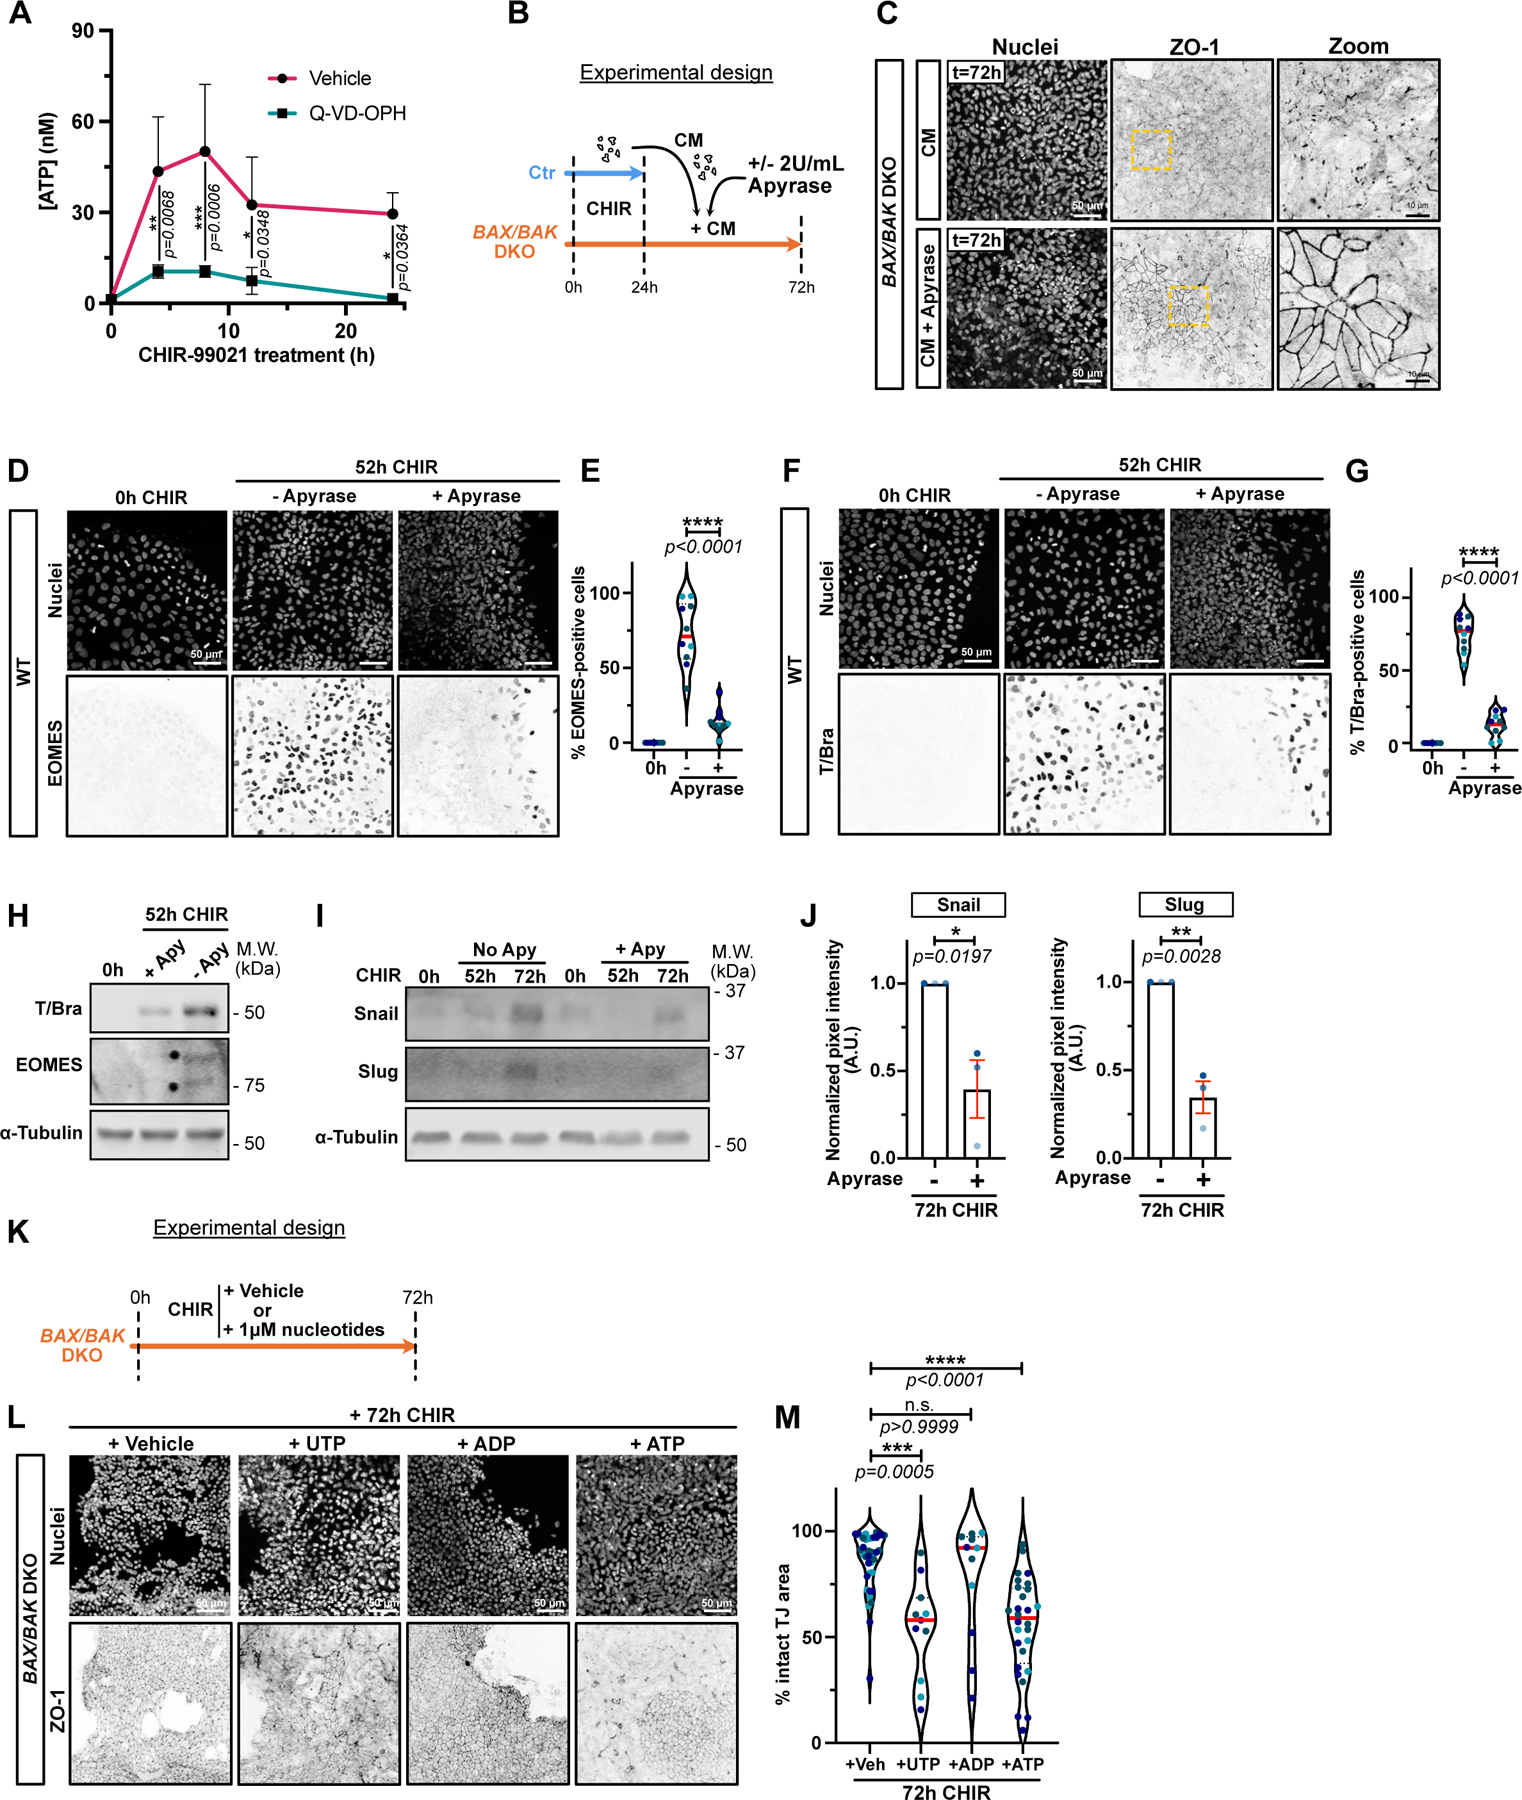
A) Time course of ATP release from dying cells. Luciferase assay was performed on supernatants from hiPSCs treated with CHIR +/− 10 μM Q-VD-OPH at indicated times. Luminescence was converted to [ATP] using a standard curve. Three biological replicates were plotted as a line graph with mean +/− S.D. Two-way ANOVA with Sidak’s multiple comparisons test was applied. (N=3 independent experiments).
B) Timeline of apyrase-treated conditioned media (CM) experiment.
C) Max IPs of BAX/BAK DKO cells fixed after adding apyrase-treated CM as in (B). Cells were stained for ZO-1 and nuclei. Scale bar = 50μm. Magnified area (yellow dotted square) is shown for ZO-1 channel. Scale bar = 10μm.
D-G) Max IPs of WT iPSC before CHIR induction (0hrs) or following CHIR treatment +/− 2U/mL Apyrase. Cells stained for nuclei and EOMES (D) or T/Bra (F). Scale bar = 50μm. Percentage of EOMES (E) and T/Bra-positive (G) nuclei were quantified (Median: plain red line – Quartiles: black dotted lines). Biological repeats are color-coded (N=10 random fields of view obtained from 3 independent experiments). Two-tailed unpaired t-test test was applied (E, G).
H) Immunoblot for T/Bra and EOMES after CHIR induction +/− 2U/mL of Apyrase.
I-J) Immunoblot of WT hiPSCs treated with CHIR +/− 2U/mL Apyrase and probed for Snail, Slug and alpha-Tubulin (I). Normalized expression of Snail and Slug was quantified across 3 biological replicates (color-coded). Mean +/− S.E.M. Two-tailed unpaired t-test was applied (J).
K) Timeline of nucleotide sufficiency. BAX/BAK DKO hiPSCs were treated with CHIR plus vehicle (H2O) or 1μM of UTP, ATP or ADP and fixed after 72hrs.
L-M) Max IPs of BAX/BAK DKO hiPSCs treated as in (K) and stained for ZO-1 and nuclei. Scale bar = 50μm (L). Normalized area with intact tight junctions was measured. Biological repeats are color-coded (Veh: N=38 random fields of view, UTP and ADP: N=11 random fields of view, ATP: N=28 random fields of view, all obtained from 3 independent experiments). Dunn’s multiple comparison test was applied.
Source numerical data and unprocessed blots are available in source data.
We conclude that triphosphonucleotides released from apoptosing cells are essential signals to license a response to WNT activation by surviving cells. To test if nucleotides are not just necessary but are sufficient, we treated BAX/BAK DKO iPSCs with ADP, ATP or UTP in the presence of CHIR and assayed for loss of tight junctions. As demonstrated in Fig. 7K–M, both UTP and ATP, but not ADP, promoted an EMT.
ATP/UTP signal to surviving cells through the P2Y2 receptor
P2 receptor engagement by nucleotides promotes chemo-attraction of macrophages15,17. Multiple P2Y receptors are expressed in our iPSCs (Extended Data Fig. 8A). Strikingly, the P2 receptor inhibitor suramin totally blocked EMT in WT iPSCs treated with CHIR, even though many of these cells still underwent apoptosis (Fig. 8A,B). Snail and Slug were also suppressed (Fig. 8C,D). Additionally, suramin blocked the effect of CM on BAK/BAX DKO cells, preventing EMT and accompanying gene expression changes (Fig. 8 E,F), and suppressed cardiomyocyte conversion (Fig. 8G,H and Extended Data Video 7).
Figure 8.
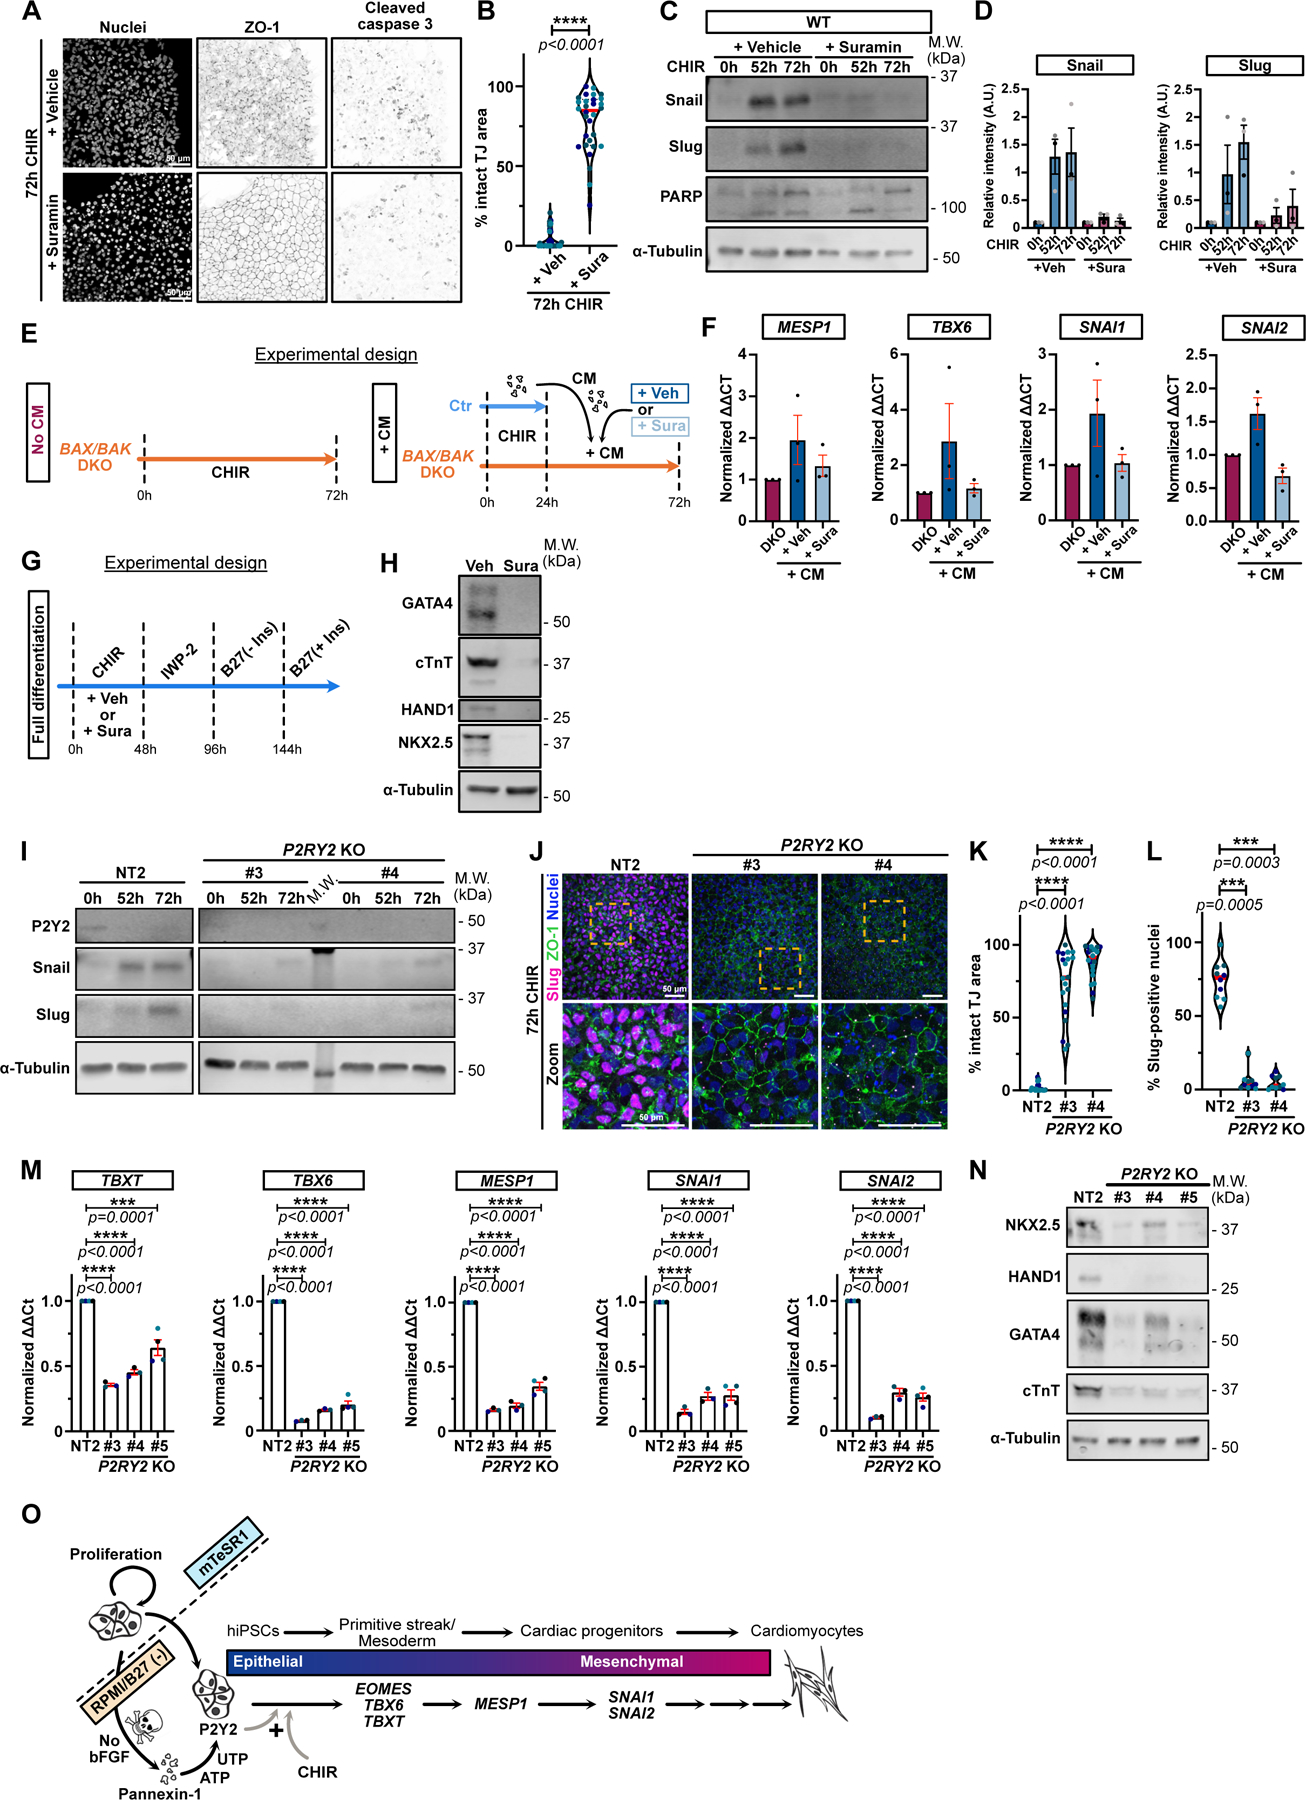
A-B) Max IPs of WT hiPSCs treated with CHIR +/− 100 μM Suramin and stained for ZO-1, cleaved-caspase 3 and nuclei. Scale bar = 50μm (A). Area with intact tight junctions is displayed. (Median: plain red line – Quartiles: black dotted lines). Biological repeats color-coded (N=30 random fields of view obtained from 3 independent experiments). Two-tailed Mann-Whitney t-test was applied (B).
C-D) Immunoblot of WT hiPSCs treated with CHIR +/− 100 μM Suramin and probed for Snail, Slug, PARP and α-Tubulin (C). Normalized expression of Snail and Slug was quantified across 3 independent biological replicates (color-coded). Error bar = Mean +/− S.E.M (D).
E) Timeline of conditioned medium (CM) experiment with Suramin.
F) Relative expression of MESP1, TBX6, SNAI1 and SNAI2 from BAX/BAK DKOs treated as in (E), across 3 independent biological replicates. Mean +/− S.E.M.
G) Complete cardiomyocyte differentiation protocol timeline. 100 μM Suramin or Vehicle (DMSO) was added for 48hrs during the CHIR treatment.
H) hiPSC were treated as in (G) and analyzed for cardiac markers (GATA4, cTnT, HAND1, Nkx2.5) and α-Tubulin 12 days post differentiation initiation.
I) Immunoblot of control NT2 and 2 P2Y2 KO iPSC lines treated with CHIR as indicated and probed for P2Y2, Snail, Slug, and α-Tubulin.
J-L) Max IPs of control (NT2) and P2Y2 KO hiPSCs stained for ZO-1 (green), Slug (magenta) and nuclei (blue) after 72hrs +CHIR. Scale bar = 50μm. Magnified area (yellow square) is shown. Scale bar = 50 μm (J). Area with intact tight junctions (K) or % Slug-positive (L) nuclei are presented (Median: plain red line – Quartiles: black dotted lines). Biological repeats color-coded (K: N=20 random fields of view obtained from 3 independent experiments, L: N=10 random fields of view obtained from 3 independent experiments). Dunn’s multiple comparison test was applied.
M) Relative gene expression from control NT2 or P2Y2 KO hiPSCs, analyzed after 48hrs +CHIR. ΔΔCt values normalized to NT2. Biological repeats are color-coded (N=3 independent experiments for KO #3 and KO #4 and N=4 independent experiments for NT2 and KO #5). Error bar = Mean +/− S.E.M. Tukey’s multiple comparisons test was applied.
N) NT2 and P2Y2 KO hiPSCs were differentiated and immunoblotted for cardiac markers.
O) Proposed working model for cardiogenesis by pluripotent stem cells. Loss of bFGF triggers apoptosis and nucleotide release through Pannexin1 channels. Nucleotides bind P2Y2 receptors on surviving cells, licensing a response to WNT signaling and commitment to mesoderm specification. The plus sign (+) reflects that neither signal alone is sufficient for specification.
Source numerical data and unprocessed blots are available in source data.
P2Y1 transcript is expressed at high levels relative to other members of this receptor family, but is specific for ADP, which had no effect on iPSC differentiation (Fig. 7L,M). The P2Y2 receptor is also expressed in these cells and responds to ATP and UTP; therefore, we knocked out this gene using several independent gRNAs. Deletion of P2Y2 efficiently blocked Snail and Slug protein expression and the EMT in iPSCs treated with CHIR (Fig. 8I–L). Moreover, expression of mesoderm lineage genes and cardiomyocyte genes were suppressed, as well as the beating of these cells (Fig. 8M–N, Extended Data Fig. 8B–E and Extended Data Video 8).
We conclude, therefore, that for pluripotent stem cell commitment to cardiogenesis nucleotide release from apoptosing cells is required, which through P2Y2 receptor engagement acts in a paracrine fashion to license surviving stem cells to respond to WNT activation.
Discussion
We have discovered that, unexpectedly, induction of the cardiac mesoderm lineage in iPSCs and ESCs by WNT activation requires early apoptotic events within the stem cell population. These events are triggered by removal of bFGF from the growth medium and are stochastic. The apoptosing cells open PNX1 channels to release nucleotides, which normally act as find-me and eat-me signals to macrophages and other phagocytic cells7,18 but which in this case signal to surviving stem cells, licensing them to respond to WNT activation. Therefore, WNT and P2Y2 signals function together as a logical AND gate to commit pluripotent stem cells to the mesoderm lineage (Fig. 8O).
ATP and UTP are recognized by G-protein coupled P2Y2 receptors9. Little is known about functions of apoptotic signaling in mammalian cells other than to recruit phagocytic cells, although apoptotic cells in the hair follicle were recently shown to secrete WNT3, which promotes stem cell proliferation18. In other organisms, such as Hydra and Drosophila, apoptotic cells can release multiple signals including Wg, Hh, and Dpp to promote compensatory proliferation and regeneration19. P2Y agonists have multiple biological functions in addition to apoptotic clearance17 but have not previously been implicated in early developmental decisions. Blocking this signaling mechanism at any step prevents initial changes in gene expression by iPSCs, such as the induction of EOMES, resulting in a later block in SNAI1/2 expression and in the subsequent EMT, which we found is essential for cardiac mesoderm commitment. This blockade must, however, occur after escape from pluripotency, because depletion of Nanog induced by WNT activation occurred normally. Remarkably, ADP has no effect on cardiogenesis of iPSCs, even though its receptor, P2Y1 is expressed at ~30-fold higher transcript levels than P2Y2, and it interacts with an overlapping set of G-proteins. It will be of interest in the future to identify which downstream signals, unique to P2Y2, permit the stem cells to respond to WNT activation.
The requirement for a nucleotide signal appears to be specific for cardiogenesis, because BAK/BAX double KO iPSCs can still successfully enter the neural tube lineage10. Moreover, although a previous report identified a caspase requirement for differentiation of ESCs in response to retinoic acid5, the mechanism is through caspase-induced cleavage and deactivation of Nanog, not through the generation of a soluble paracrine signal.
An important question is whether a nucleotide signal functions in vivo during embryogenesis. P2Y2 receptor knockout mice are viable, suggesting that other receptors in the family might play redundant roles, or that the mechanism of mesoderm specification is different in mice than in humans20. Notably, T/Bra expression occurs later in mESCs than in hESCs or hiPSCs21. Apoptosis occurs pre-gastrulation during mouse embryogenesis22, but apoptosis-defective mice generally progress through embryogenesis. CASP3 /CASP7 double KO mice die perinatally from cardiovascular defects23. A triple KO mouse line lacking BAX, BAK and BOK also develops through embryogenesis24 even though most of the progeny die perinatally. These observations emphasize that in vivo some mechanism other than apoptosis might provide the nucleotide signal to embryonic stem cells. PNX channels, in addition to being constitutively activated by caspases are also mechanosensitive, which could provide signals during embryogenesis independently of cell death16,17. Interestingly, cardiac valve formation in the zebrafish was recently shown to require mechanical forces that activate ATP-dependent P2X calcium influx25, suggesting that multiple steps in cardiogenesis use extracellular nucleotide signals.
Finally, we noted that ATP was insufficient to trigger 100% of cells to undergo EMT; moreover, the EMT occurs in clusters within cell colonies. It is possible that additional metabolites released by apoptosing cells contribute to the signal, or that the nucleotides are degraded before they can trigger differentiation of the entire cell population. The patchiness of the response suggests cell-cell communication might promote EMT, or that groups of cells are in different initial states that are less or more susceptible to purinergic signaling. There might also be minor contributions from other P2Y receptors, such as P2Y11.
Overall, it is remarkable that the death of a fraction of pluripotent stem cells is required for differentiation of the survivors, through a paracrine signal that usually functions for apoptotic cell clearance. It will be of interest to determine if other developmental processes require similar signaling mechanisms.
Material & Methods
Research compliance & Ethical regulation
All experiments using hESCs were performed using the WA09 (H9) cell line under the supervision of the Vanderbilt Institutional Human Pluripotent Cell Research Oversight (VIHPCRO) Committee (Protocol IRB # 160146 to VG).
No cells were sourced directly from human embryos.
Reagents
Common lab reagents are listed in Supplementary Table 1.
Cell lines and Cell culture
GM25256 hiPSCs were obtained from the Coriell Institute. The mEGFP-TJP1 knock-in GM25256 hiPSC cell line was obtained from the Allen Cell Collection, Coriell Institute (Cell ID AICS-0023 cl.20). BAX/BAK double knock-out hiPSC GM25256 cell line were provided by Vivian Gama1. Human embryonic stem cell line H9 (WA09) was obtained from WiCell Research Institute (Wisconsin). The hiPSC and hESC H9 lines were cultured on Matrigel coated 6-well plates (Matrigel diluted at 42 μg/mL in DMEM/F12 media) and grown in mTeSR1 medium. Medium was changed daily until cells reached 70% confluence. Cells were passaged using Gentle cell dissociation reagent for 4 min, resuspended in mTseR1 as small clusters and replated at 1:7.
HEK-293T cells were obtained from ATCC and maintained in Dulbecco’s modified Eagle’s medium supplemented with 10% fetal bovine serum and passaged at 1:10 every 2–3 d.
All cell lines used in this study were maintained at 37 °C under 5% CO2.
Cell freezing and thawing
hiPSCs and hESCs were harvested from culture dishes using gentle cell dissociation reagent and centrifuged at 120xg for 3 min. Pellets were resuspended in mTeSR1 supplemented with 10% DMSO and aliquoted in cryovials. Cells were first transferred at −80 °C for 24hrs before long-term storage in liquid nitrogen. hiPSCs and hESCs were slowly thawed using mTeSR1 medium, centrifuged and resuspended in mTeSR1 supplemented with 10 μM of Y-27632 for 24hrs.
Cardiomyocyte differentiation protocol
This protocol was adapted from Lian et al2,3 (GiWi protocol).
Briefly once confluency reached 70–80%, cells were treated with RPMI 1640 supplemented with 1X B27 minus Insulin (-Ins) and 7.5 μM CHIR-99021 for 48hrs. At 48hrs after CHIR addition, medium was aspirated and replaced with RPMI 1640, supplemented with 1X B27 (-Ins.) and 7.5 μM of IWP-2 for 48h. Then, cells were incubated for 48hrs with RPMI 1640/1X B27 (-Ins), before maintaining them in RPMI 1640/1X B27 plus insulin (+Ins.) every 3 days. Spontaneous and homogenous beating (>70–80% of beating area) was observed within 10–12 days after protocol initiation. The hiPSC-derived cardiomyocytes (hiPSC-CMs) used in Extended Data 4I were generated using the small molecules CHIR-99021 and IWR-1. Cardiac differentiation media were defined as M1 (RPMI 1640 with glucose with B27 (-Ins.)), M2 (RPMI 1640 minus glucose with B27 (-Ins.)), and M3 (RPMI 1640 with glucose with B27(+Ins.)). When hiPSCs reached 60% confluence, cardiac differentiation was initiated (day 0). At day 0, hiPSCs were supplemented in M1 with 6 µM CHIR-99021. On day 2, the media was changed to M1. On day 3, cells were treated with 5 µM IWR-1 in M1. Metabolic selection was started at day 10 and cells were treated with M2 from day 10 to 16. On day 16, cells were transitioned to M3. Medium was changed every other day until day 30.
TGFβ and bFGF addition
bFGF was reconstituted in 0.1% BSA at 100μg/mL and frozen as single-use aliquots. TGFβ was reconstituted in 10mM HCl, 0.1% BSA and frozen as single-use aliquots. hiPSCs were switched to RPMI/B27(-Ins) and supplemented with 20 ng/mL of bFGF or 1ng/mL TGFβ for 24hrs and processed for immunofluorescence or immunoblot as described below.
SDS-PAGE and Western blotting
Cells were washed in 1X PBS. Lysates were obtained by scraping cells in lysis buffer (150 mM NaCl, 10 mM Tris-HCl pH 7.5, 1 mM ethylenediaminetetraacetic acid (EDTA), 1% Triton X-100, 0.1% SDS, 1X protease and phosphatase inhibitors) followed by a 5 min incubation on ice and centrifugation at 16000xg for 10 min at 4°C. Protein concentration was measuring using Precision Red.
30 μg of proteins were resolved on bis-tris acrylamide gels and transferred onto nitrocellulose membrane for 90 min at 110V. Membranes were blocked for 30 min in 5% non-fat milk in TBS-T (10 mM Tris pH 8.0, 150 mM NaCl, 0.5% Tween 20) before overnight incubation with primary antibodies (Supplementary Table 2) at 4°C with gentle rocking. Membranes were washed in TBS-T and incubated 1hr at room temperature with Alexa-Fluor conjugated secondary antibodies (Supplementary Table 2). Membranes were washed in TBS-T and scanned using the LI-COR Odyssey CLx. All images were analyzed using Image Studio Lite v. 5.2.5.
For Extended Data 1A, ECL imaging was acquired according to the manufacturer protocol (Thermo Scientific #34580) using the Amersham Imager 600 and processed using Fiji.
Immunofluorescence
Cells were grown on Matrigel-coated coverslip, fixed with 4% paraformaldehyde for 10 min, permeabilized (20 mM glycine, 0.05% Triton X-100) for 10 min and blocked with 5% BSA-PBS for 30 min. Primary and secondary antibodies were diluted in blocking buffer and incubated for 1 hr in a dark, humidified chamber. Coverslips were washed three times in PBS before being mounted on glass slides using Fluoromount-G™ Slide Mounting Medium.
For BrdU treatment: One hr prior to the fixation, cells were incubated with 3μg/mL BrdU. Cells were washed and fixed with 4% PFA for 10min and treated with 2N HCl for 20min at 37°C. Then, samples were processed for immunofluorescence as described above.
Images acquisition and analysis
Images were taken using an inverted Nikon A1-R confocal microscope equipped with a 40x oil objective (NA 1.2). 0.5 μm Z-stack covering the entire cell height were obtained maximum intensity projections (MIPs) were obtained using Fiji. Super-resolution images for Extended Data 4I were acquired using a Nikon SIM microscope equipped with a 1.49 NA 100x Oil objective an Andor DU-897 EMCCD camera. Images were processed and analyzed using Nikon Elements AR (v5.21.01) and Fiji software (ImageJ version 2.1.0/1.53c). Nuclear/cytoplasmic ratio of YAP was measured using the ImageJ Intensity Ratio Nuclei CytoplasmTool (RRID:SCR_018573; https://github.com/MontpellierRessourcesImagerie/imagej_macros_and_scripts/wiki/Intensity-Ratio-Nuclei-Cytoplasm-Tool).
The distribution of apoptotic cells in iPSC cultures was determined from the Clark-Evans index for cleaved Caspase 3-stained cells, where the index (R ) was calculated as follows:
where and (n = total number of stained cells per image, r = nearest neighbor distance for each cell, S = total area of the image, an ρ = object density, = actual mean nearest neighbor distance and = expected mean nearest neighbor distance). Nearest neighbor distances were determined for each image using the Nnd ImageJ plugin (https://icme.hpc.msstate.edu/mediawiki/images/9/9a/Nnd_.class ) after converting the grayscale images to binaries. A random distribution would give a value of R=1; a uniform distribution gives R = 2; and a clustered (aggregated) distribution ~0.
Live Cell Imaging
mEGFP-TJP1 hiPSCs were plated on Matrigel-coated MaTek 35mm dishes. Cells were imaged every 10–15 min on a Nikon A1-R with a 40X oil objective (NA 1.2) and equipped with a heated CO2 chamber. 2–3 μm Z-stack were obtained and images were processed and analyzed using Fiji software (ImageJ version 2.1.0/1.53c). Brightfield imaging of beating cardiomyocytes were obtained using an Evos FL microscope.
Generation of knock-out cell lines.
Single-guide RNA was selected using ChopChop4 and Benchling design tools and are listed in Supplementary Table 3. Annealed oligonucleotides were cloned into pLentiCrispRv2-Puro as described by Sanjana et al.5. HEK-293T cells were seeded on 15cm dish to 50% confluence and transfected using calcium phosphate. Briefly, 50 μg of the lentiviral plasmid, 37.5 μg of pSPAX2 (Addgene 8454) and 15 μg of pMD2G (Addgene 12260) were combined to 1125 μl of sterile water, complemented with 125 μl of 2.5M CaCl2. While vortexing, 1.25ml of filter sterilized 2× HEPES-buffered saline (50 mM Hepes, 10 mM KCl, 12 mM Dextrose, 280 mM NaCl, 1.5 mM Na2PO4, pH 7.04) was added, and the solution was incubated 5 min at RT before adding to HEK-293T cells. Medium was removed after 6–8 hrs and replaced with 15 ml of 10% FBS DMEM. Lentiviruses were collected after 48hrs, concentrated using Amicon centrifugal filter units (100 kDa cut-off) and stored at −80°C. hiPSCs were transduced in suspension for 24hrs and then selected using 1 μg/mL Puromycin.
RNA isolation and RT-qPCR
RNA was isolated using RNeasy Mini kit. 1 μg of RNA was reverse transcribed to cDNA using SuperScript III First-Strand Synthesis System and diluted 1:10 in water. 4.5 μL of cDNA was mixed with 7.5 μL Maxima SYBR Green/Fluorescein Master Mix and 3 μL of primers (1 mM each) (Supplementary Table 4). qPCR was performed on a BioRad CFX96 Thermocycler and Ct values from technical triplicates were average and used to calculate the relative gene expression normalized to GAPDH, using the ΔΔCt formula.
Annexin V-APC assay
Protocol was adapted from the Annexin V apoptosis kit APC. Briefly, cells were collected as single cell suspension by incubation in gentle cell dissociation buffer for 8 min at 37°C. Pellet was washed once in PBS and once in 1X binding buffer. Cells were resuspended in 100 μL 1X binding buffer and incubated 15 min at room temperature with 5 μL of Annexin-APC. Cells were washed in 1X binding buffer, resuspended in 200 μL of binding buffer and incubated with 5 μL of propidium iodide. Cells were passed through a 70 μm strainer prior to cytometry analysis using a 3-laser Fortessa flow cytometer.
ATP release - Luciferase assay
hiPSCs were treated with 7.5 μM CHIR-99021 plus DMSO or 10 μM Q-VD-OPH. Aliquots of culture medium (300 μl) were taken at indicated timepoints and mixed with 100 μL of 4X RealTime-Glo extracellular ATP assay reagent reconstituted in RPMI 1640/B27(-Ins) medium. Technical triplicates of 100 μL were dispensed into a dark edged glass-bottom 96-well plate. Luminescence was measured after 30min using a HT-Synergy plate reader. Luminescence was subtracted for background and averaged between technical replicates. A standard curve was obtained by serial dilution of ATP in RPMI 1640/B27(-Ins) medium followed by the luciferase assay as described above. Simple linear regression was applied to transform luminescence values to ATP concentration.
Reproducibility and statistics
Datasets were analyzed using Prism8 (v.8.4.3) and tested for normality prior to applying the appropriate statistical test, as mentioned in each figure legend. Error bars are stated in each figure legend. Significance levels are given as follows: n.s. (not significant): P ≥ 0.05, *P < 0.05, **P < 0.01, ***P < 0.001, ****P < 0.0001 and exact two-tailed P-values are indicated in each figure.
All experiments, including representative Max IPs and western blots, were repeated at least three times independently as biological repeats unless stated otherwise in the legends. Datasets are color-coded to reflect the variability between biological repeats. No statistical method was used to predetermine sample size; no data were excluded from the analyses; the experiments were not randomized; and the investigators were not blinded to allocation during experiments and outcome assessment.
Extended Data
Extended Data Fig. 1. Pluripotent stem cells undergo EMT during conversion to cardiac mesoderm.
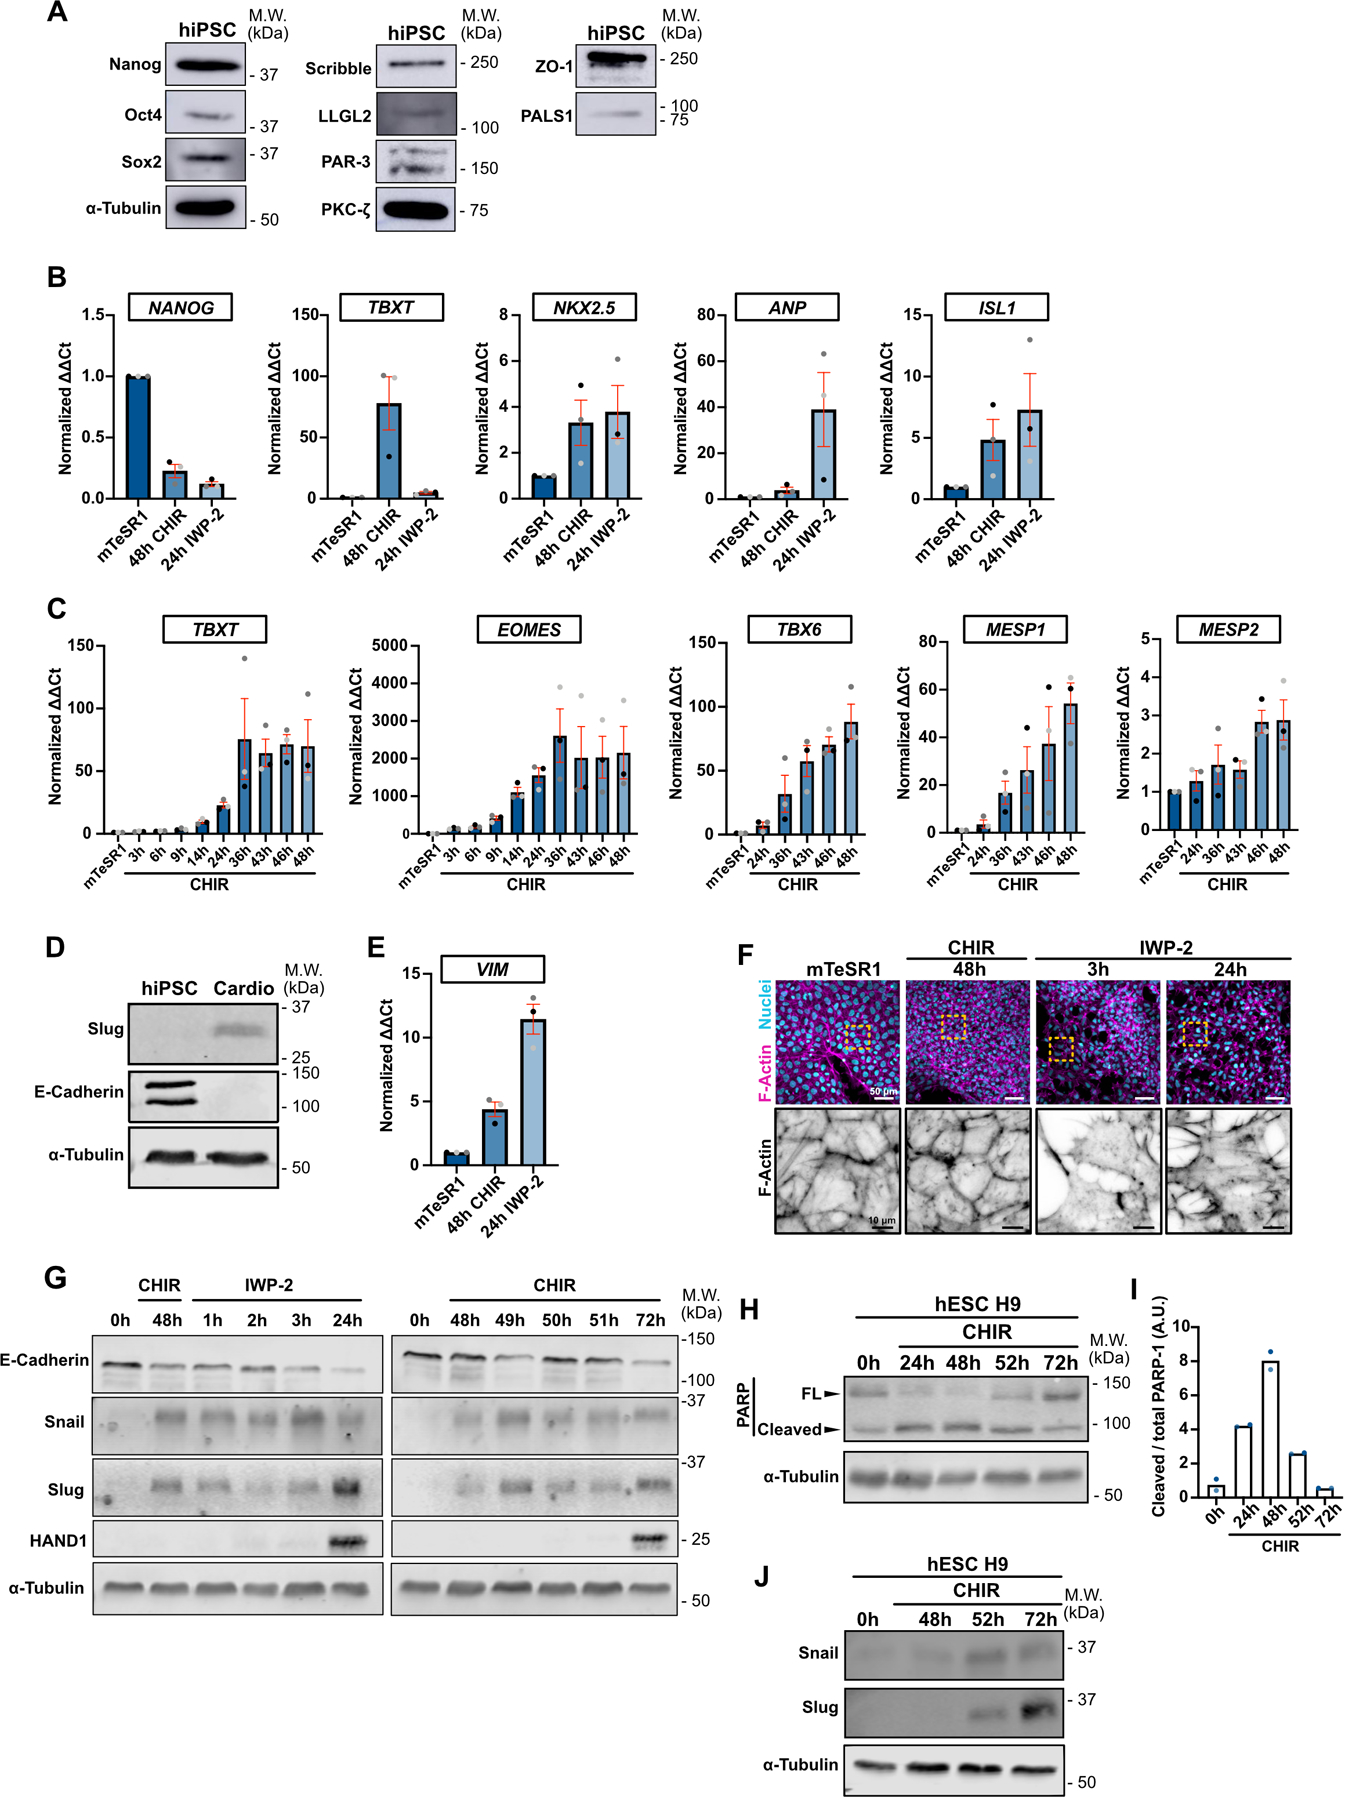
A) Representative immunoblot of WT hiPSC for pluripotency markers (Nanog, Oct4, Sox2), tight junctions marker (ZO-1), Crumb complex (PALS1), PAR complex (PAR-3, PKC-ζ), Scribble complex (LLGL2, Scribble) and α-Tubulin. Molecular weights (M.W.) are indicated in kDa.
B) Relative gene expression of NANOG, TBXT, NKX2.5, ANP, ISL1 during differentiation. ΔΔCt values were normalized to the mTeSR1 condition (prior to cell differentiation). Independent biological repeats are color-coded (N=3 independent experiments). Mean +/− S.E.M.
C) Relative gene expression of TBXT, EOMES, TBX6, MESP1, MESP2 during CHIR induction. ΔΔCt values were normalized to the mTseSR1 condition (prior to cell differentiation). Independent biological repeats are color-coded (N=3 independent experiments). Mean +/− S.E.M.
D) Representative immunoblot of hiPSCs and hiPSC-derived cardiomyocytes obtained 12 days post differentiation (Top pathway described in Fig. 1B). Expression of EMT markers (Slug and E-Cadherin) were analyzed. Molecular weights (M.W.) are indicated in kDa. (N=2 independent experiments).
E) Relative gene expression of VIM was analyzed by qRT-PCR during cell conversion. ΔΔCt values were normalized to the mTseSR1 condition. Independent biological repeats are color-coded (N=3 independent experiments). Mean +/− S.E.M.
F) Representative Max IPs images of wildtype hiPSCs fixed at the indicated times along the differentiation protocol and stained for F-actin (Phalloidin) and nuclei (Hoechst). Scale bar = 50 μm. Magnified area of the F-actin channel (yellow dotted square) is shown. Scale bar = 10 μm.
G) Representative Immunoblot comparing expression of EMT markers (E-Cadherin, Snail, Slug) and cardiac marker (HAND1) between the two protocols shown in Fig. 1B.
H-I) Immunoblot of PARP cleavage in hESC H9 during CHIR treatment. Molecular weights (M.W.) are indicated in kDa (H). PARP cleavage was quantified by densitometry across 2 independent biological repeats (color-coded). Tukey’s multiple comparison was applied (I).
J) Snail and Slug expression was analyzed in hESC H9 following CHIR induction. Molecular weights (M.W.) are indicated in kDa.
Source numerical data and unprocessed blots are available in source data.
Extended Data Fig. 2. bFGF withdrawal induces apoptosis randomly across the cell population.
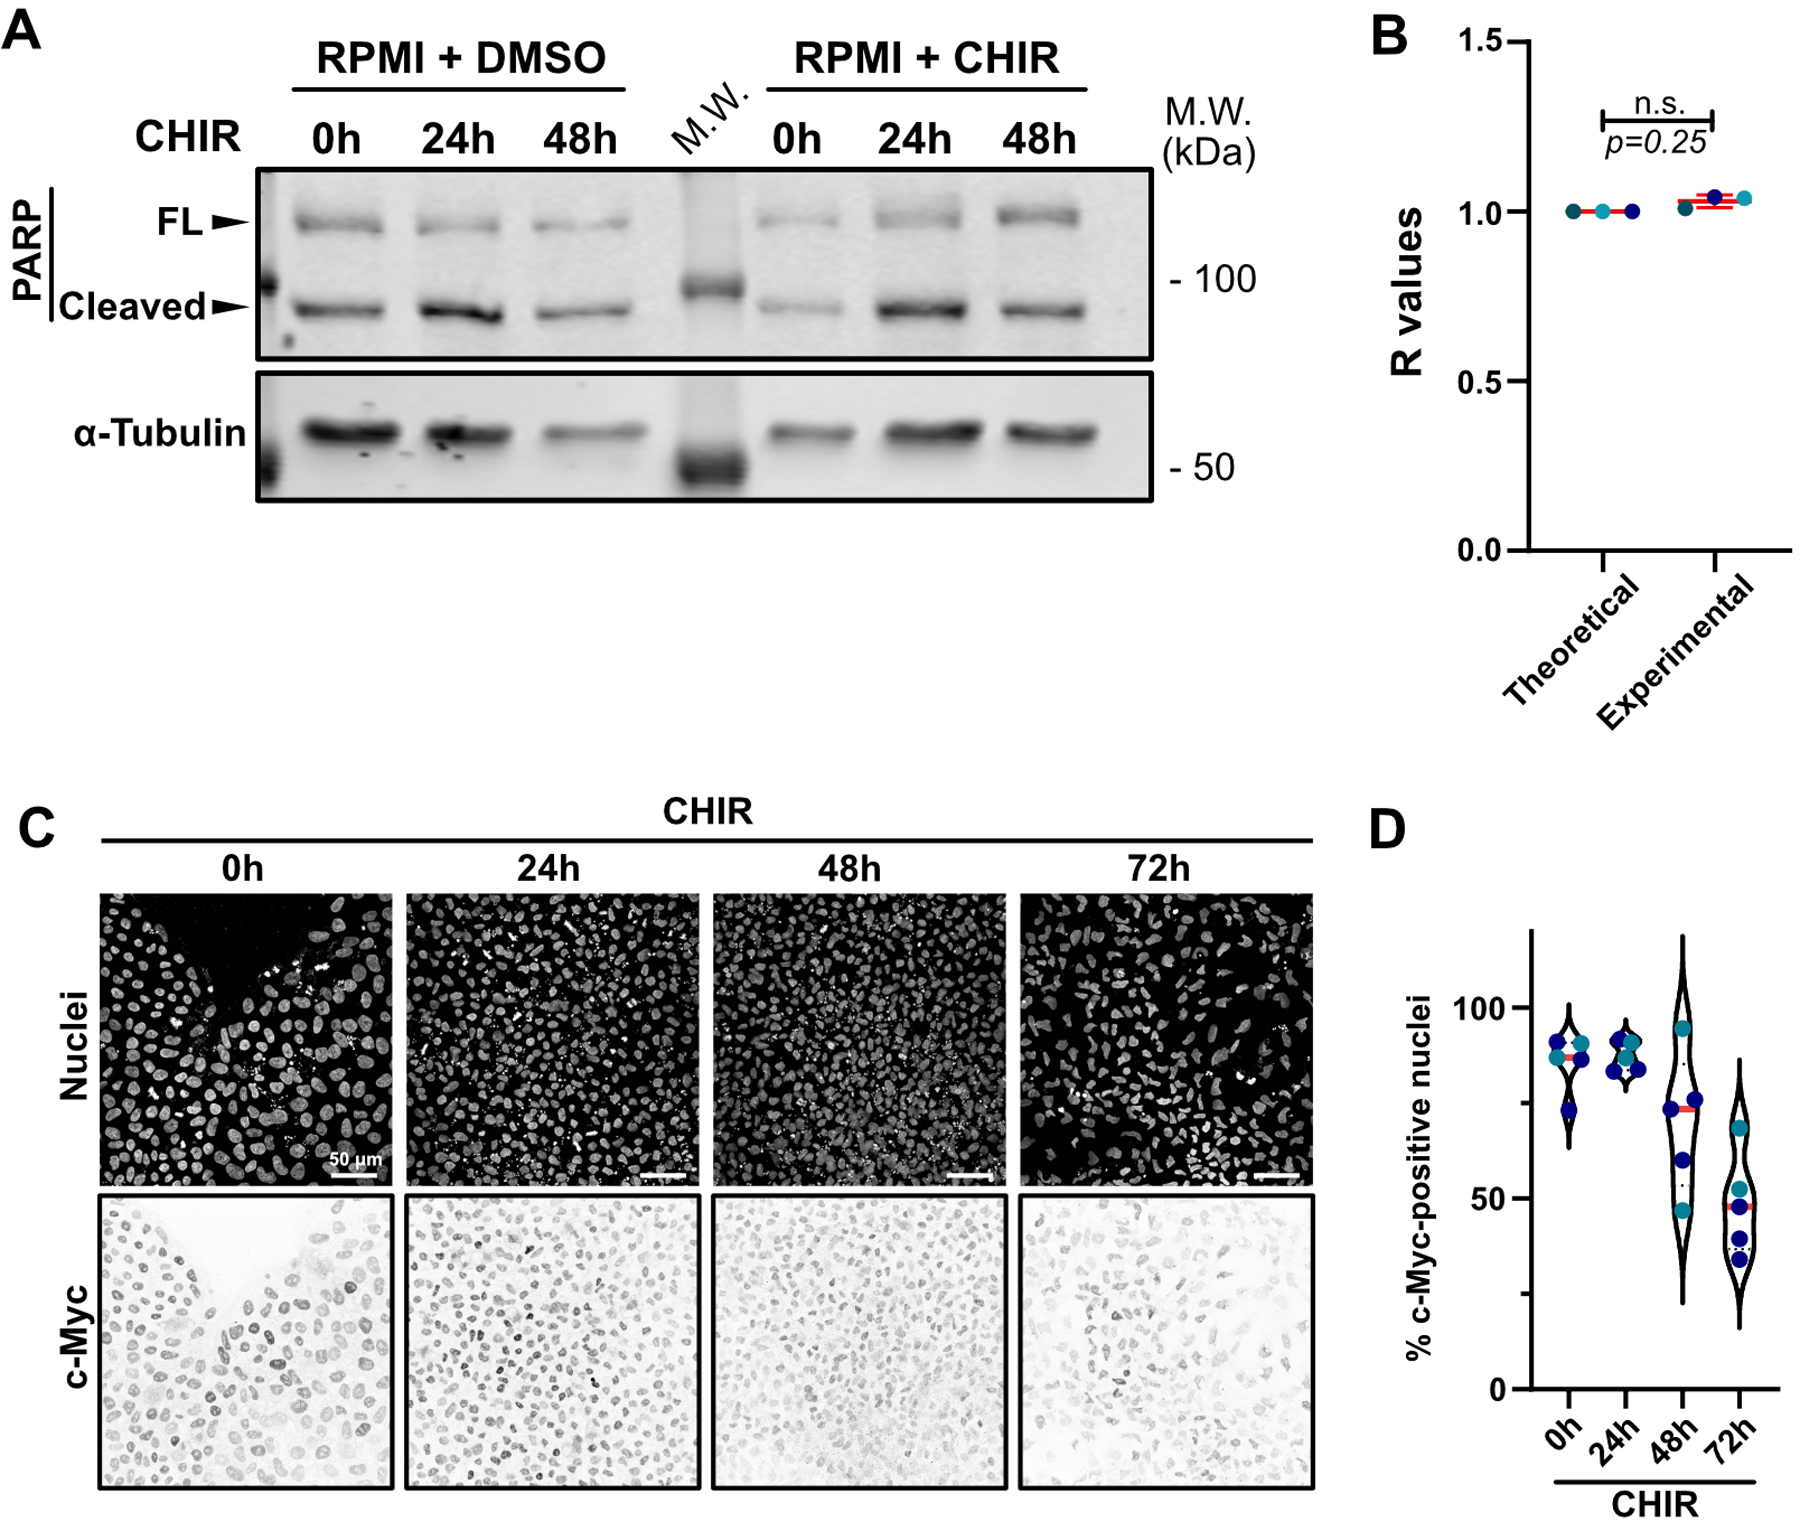
A) Representative immunoblot of PARP cleavage of hiPSCs treated with RPMI/B27(-Ins) supplemented or not with CHIR and collected at the indicated time. Molecular weights (M.W.) are indicated in kDa.
B) Clark-Evans analysis was used to measure randomness of cell death events after 24hrs CHIR treatment (See Methods). Cleaved Caspase-3 staining distribution was analyzed and compared to a theorical random distribution (R=1). R values closer to 0 have a tendency towards clustering while R values closer to 2 represent a tendency towards regularity. Two-tailed Wilcoxon Signed Rank Test (N=3 independent experiments).
C-D) Representative Max IPs pictures of hiPSC treated with CHIR and stained for nuclei and c-Myc. Scale bar = 50 μm (C). c-Myc expression was analyzed and presented as violin plots (Median: plain red line – Quartiles: black dotted lines). Independent biological repeats are color-coded (N=5 random fields of view obtained from 2 independent experiments) (D).
Source numerical data and unprocessed blots are available in source data
Extended Data Fig. 3. Density-dependent pathways do significantly promote EMT.
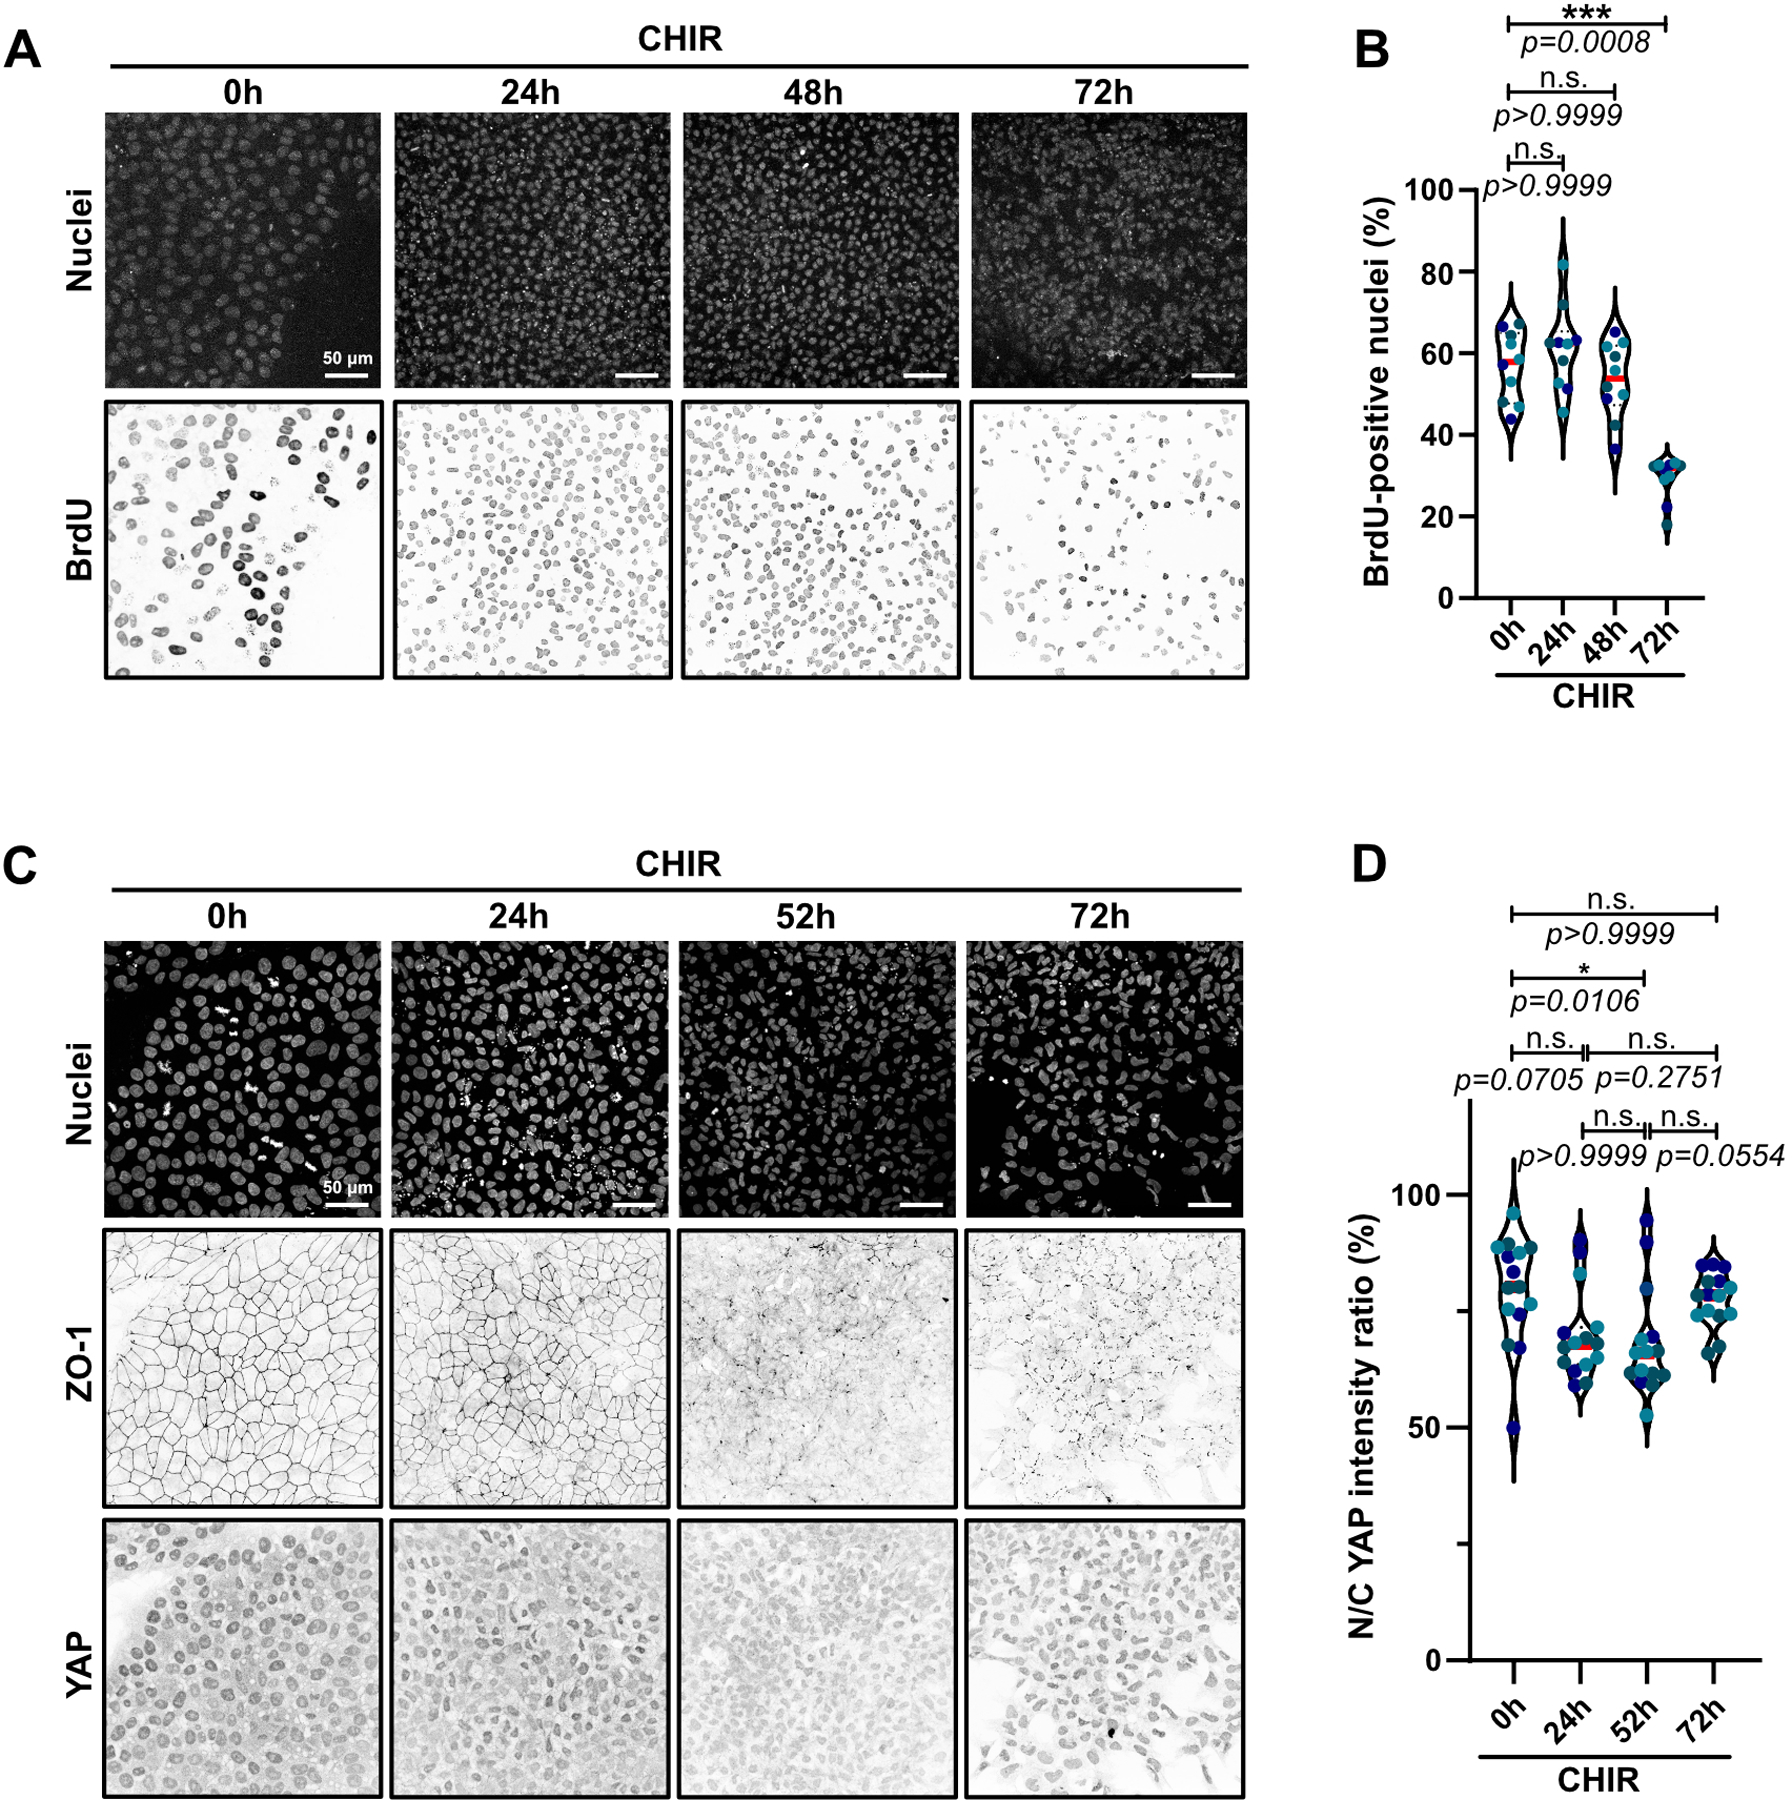
A-B) Representative Max IPs pictures of hiPSC treated with CHIR and BrdU 1h prior to fixation. Cells were stained for nuclei and BrdU to assess cell proliferation. Scale bar = 50 μm (A). BrdU incorporation was analyzed and presented as violin plots (Median: plain red line – Quartiles: black dotted lines). Independent biological repeats are color-coded (N=10 random fields of view obtained from 3 independent experiments). Dunn’s multiple comparisons test was applied. (B).
C-D) Representative Max IPs pictures of hiPSC treated with CHIR and stained for nuclei, ZO-1 and YAP. Scale bar = 50 μm (C). Nuclear-to-cytosolic ratio of YAP was analyzed and presented as violin plots (Median: plain red line – Quartiles: black dotted lines). Independent biological repeats are color-coded (N=15 random fields of view obtained from 3 independent experiments). Dunn’s multiple comparisons test was applied (D).
Source numerical data are available in source data
Extended Data Fig. 4. Apoptosis is required for EMT and cardiac differentiation.
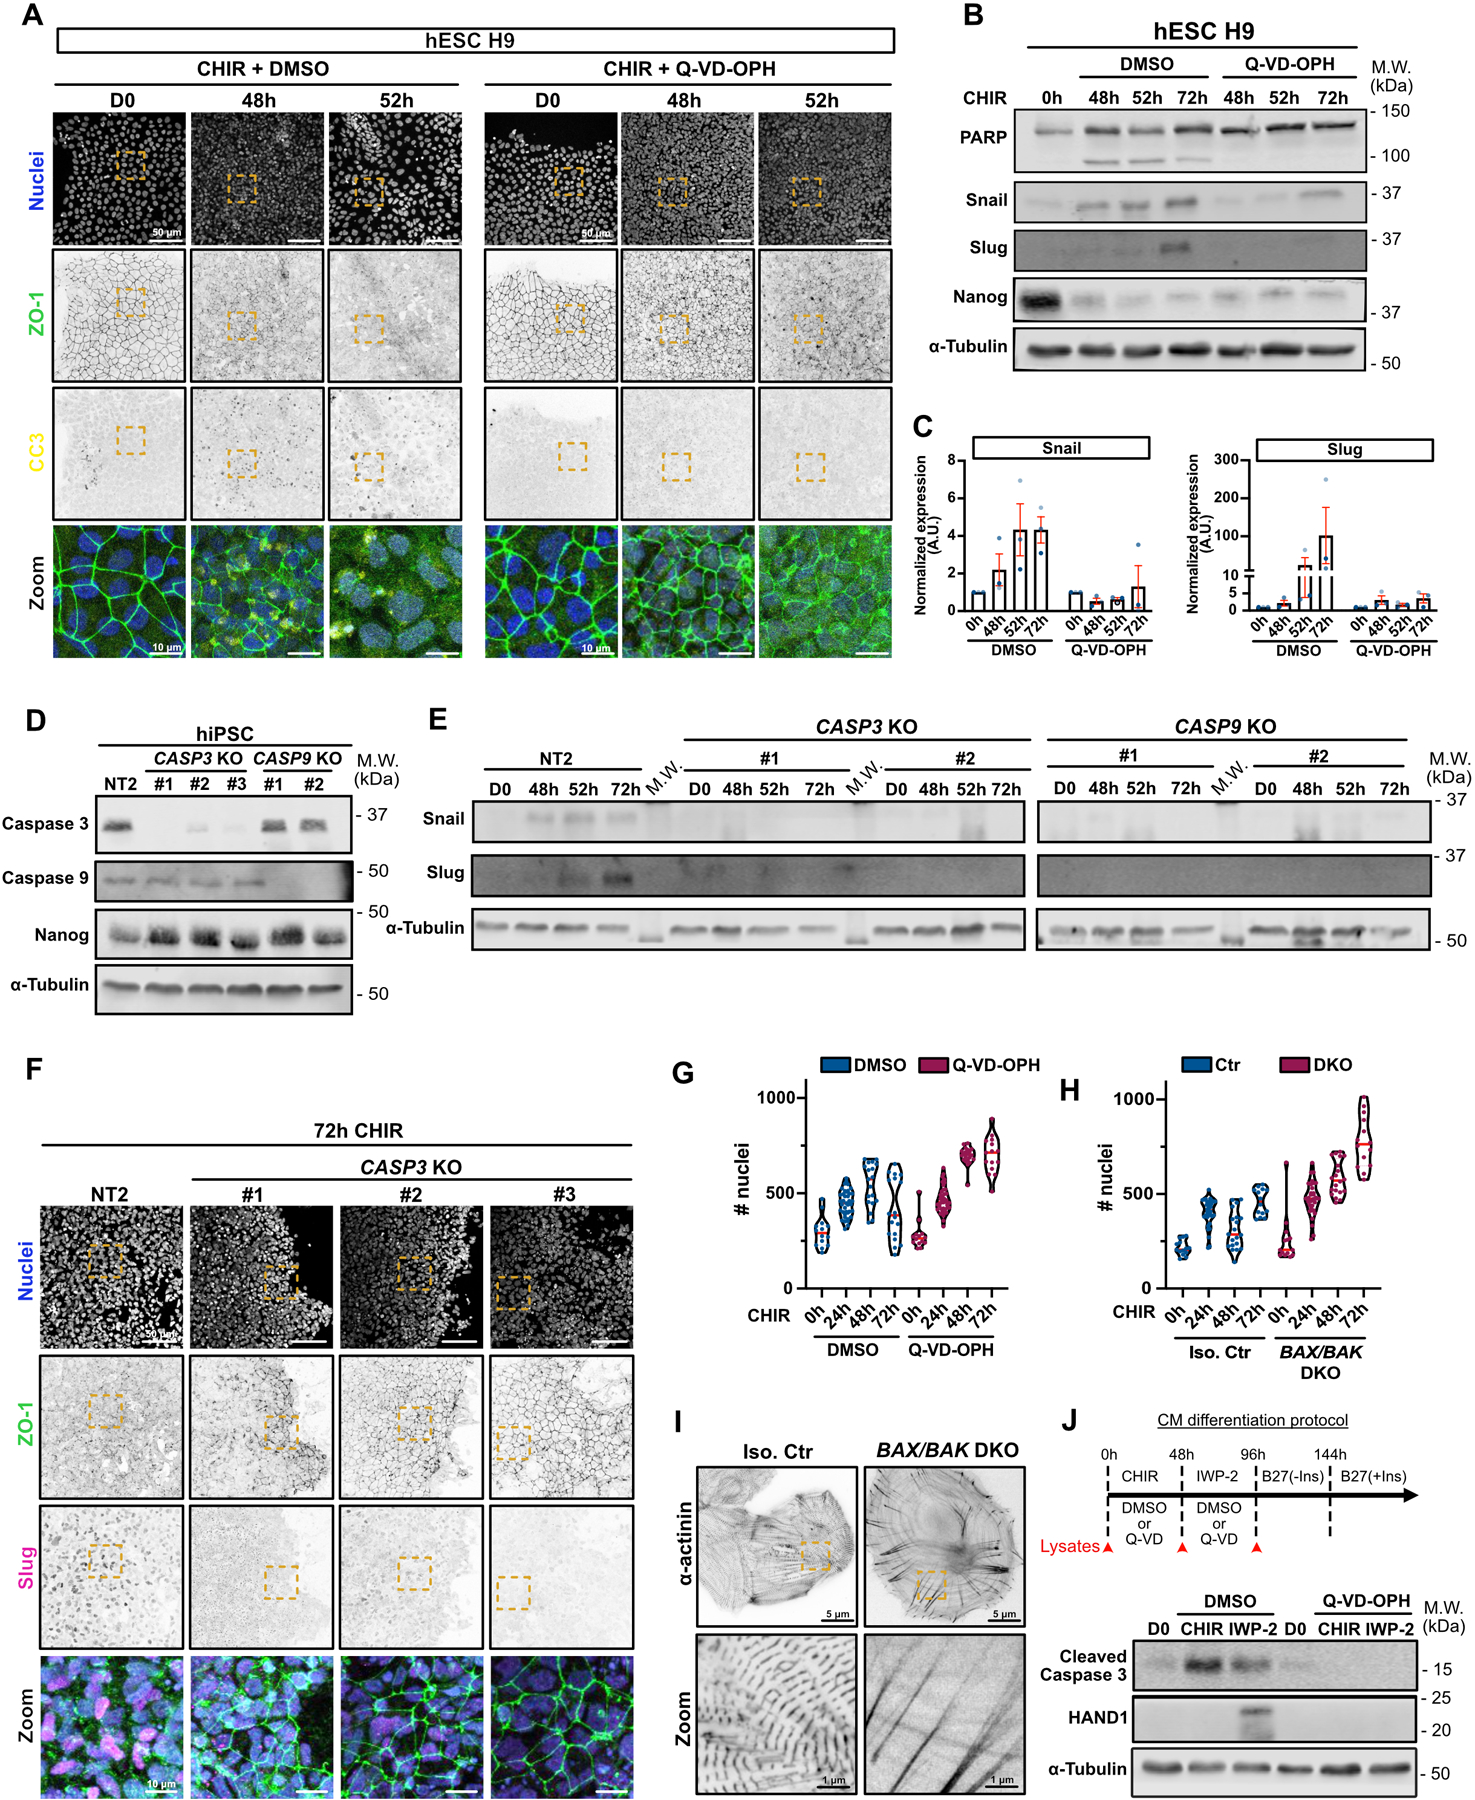
A) Representative Max IPs images of hESC H9 co-treated with CHIR + DMSO (left) or CHIR + 10 μM Q-VD-OPH (right) stained for ZO-1 (green), cleaved caspase 3 (yellow) and nuclei (blue). Scale bar = 50 μm. Magnified area (yellow dotted square) is shown as a merge. Scale bar = 10 μm.
B-C) Immunoblot analysis of hESC H9 co-treated with CHIR + DMSO or 10 μM Q-VD-OPH. Molecular weights (M.W.) are indicated in kDa (B). Normalized expression of Snail and Slug was quantified by densitometry across 3 independent biological replicates (color-coded). Mean +/− S.E.M. (C).
D) Immunoblot of CASP3 and CASP9 KO cell lines (non clonal). Knockout validation was performed by probing for Caspase 3 and Caspase 9 expression, as well as Nanog as a stem cell marker. Molecular weights (M.W.) are indicated in kDa.
E) Immunoblot of control Non Targeted (NT2) and CASP3 and CASP9 KO cell lines, analyzed for Snail and Slug expression upon CHIR induction. Molecular weights (M.W.) are indicated in kDa.
F) Representative Max IPs images of Non targeted (NT2) and CASP3 KO hiPSCs, induced 72hrs with CHIR and stained for ZO-1 (green), Slug (magenta) and nuclei (blue). Scale bar = 50 μm. Magnified area (yellow dotted square) is shown as a merge. Scale bar = 10 μm.
G-H) Violin plots representing numbers of nuclei over time for WT hiPSCs co-treated with CHIR +/− Q-VD-OPH (G) or BAX/BAK DKO hiPSCs treated with CHIR. (Median: plain red line – Quartiles: black dotted lines). Three independent biological repeats are color-coded (Number of fields of view: DMSO 0hrs N=14, DMSO 24hrs N=39, DMSO 48hrs N=19, DMSO 72hrs N=18, Q-VD 0hrs N=14, Q-VD 24hrs N=39, Q-VD 48hrs N=21, Q-VD 72hrs N=15) (Number of fields of view Ctr 0hrs N=14, Ctr 24hrs N=34, Ctr 48hrs N=20, Ctr 72hrs N=14, DKO 0hrs N=14, DKO 24hrs N=33, DKO 48hrs N=20, DKO 72hrs N=14).
I) SIM images of isogenic control and BAX/BAK DKO hiPSC-derived cardiomyocytes, plated at low density and stained for alpha-actinin. Scale bar = 5 μm. Magnified area (yellow dotted square) is shown. Scale bar = 1 μm.
J) Immunoblot analysis of hiPSC treated with CHIR and IWP-2 co-treated or not with 10 μM Q-VD-OPH and probed for cleaved Caspase-3 and cardiac marker HAND1. Cell lysates were collected as indicated on the timeline (red arrows).
Source numerical data and unprocessed blots are available in source data.
Extended Data Fig. 5. Apoptosis is required early in selection of mesoderm lineage.
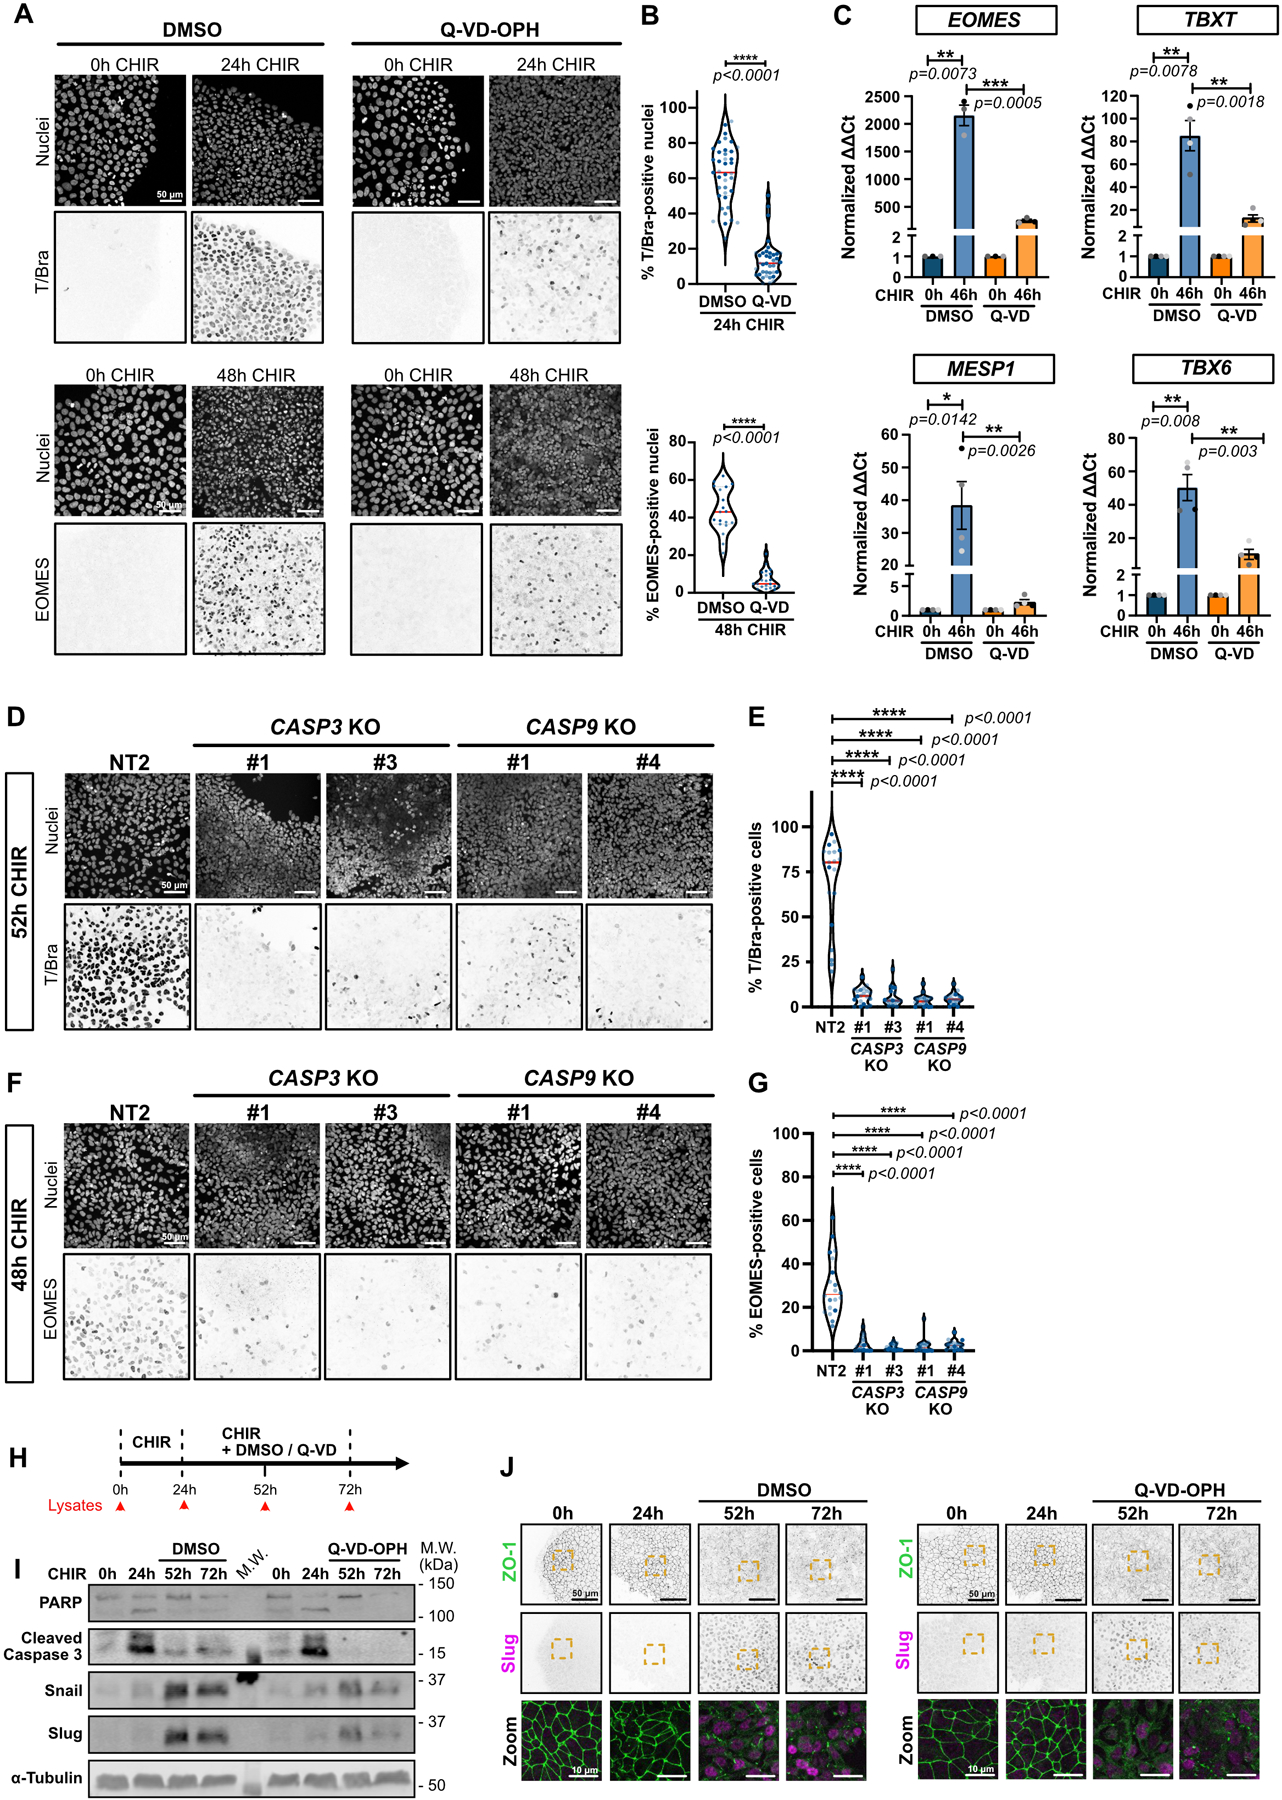
A-B) Representative Max IPs images of hiPSCs stained for T/Bra (top) and EOMES (bottom) and nuclei, before (0hrs) and after CHIR treatment +/− Q-VD-OPH. Scale bar = 50 μm. (A). Violin plots summarize quantification of the percentage of T/Bra-positive (top) and EOMES-positive (bottom) nuclei after CHIR treatment (Median: plain red line – Quartiles: black dotted lines). Independent biological repeats are color-coded (N=19 and 21 random fields of view for EOMES staining in DMSO and Q-VD-treated cells respectively, obtained from 2 independent experiments and N=39 random fields of view for T/Bra staining, obtained from 3 independent experiments). Two-tailed Mann-Whitney test was applied.
C) Relative gene expression of EOMES, TBXT, MESP1, TBX6 obtained from WT hiPSCs, induced or not with CHIR and DMSO or CHIR and Q-VD-OPH for 46hrs and analyzed by qRT-PCR. ΔΔCt values were normalized to un-induced cells. Independent biological repeats are color-coded (N=3 independent experiments for EOMES and N=4 independent experiments for the remaining data set). Error bar = Mean +/− S.E.M. Two-tailed paired t-test was applied to compare 0hrs vs 46hrs and unpaired t-test was applied to compare DMSO vs Q-VD.
D-G) Representative Max IPs images of control NT2, CASP3 and CASP9 KO hiPSCs stained for T/Bra (D), EOMES (F) and nuclei after CHIR treatment. Scale bar = 50 μm. Percentage of T/Bra-positive (E) and EOMES-positive (G) nuclei after CHIR treatment are shown as violin plots (Median: plain red line – Quartiles: black dotted lines). Independent biological repeats are color-coded (N=20 random fields of view obtained from 3 independent experiments). Kurskal-Wallis test was applied.
H) Timeline for the Q-VD-OPH treatment and lysate collection/fixation time points. hiPSCs were treated with CHIR only for 24hrs, before adding CHIR +/− 10 μM Q-VD-OPH for another 28hrs and 48hrs with CHIR (52hrs and 72hrs time point respectively).
I) Immunoblot analysis of hiPSCs treated as presented in (H) and probed for EMT markers (Snail and Slug) and cell death markers (PARP and cleaved Caspase-3). Molecular weights (M.W.) are indicated in kDa.
J) Representative Max IPs images of hiPSCs treated as presented in (H) and stained for ZO-1 (green) and Slug (magenta). Scale bar = 50 μm. Magnified area (yellow dotted square) is shown as a merge (bottom row). Scale bar = 10 μm.
Source numerical data and unprocessed blots are available in source data
Extended Data Fig. 6. Small molecule inhibitor of Pannexin and gap junctions blocks mesoderm specification and cardiac differentiation.
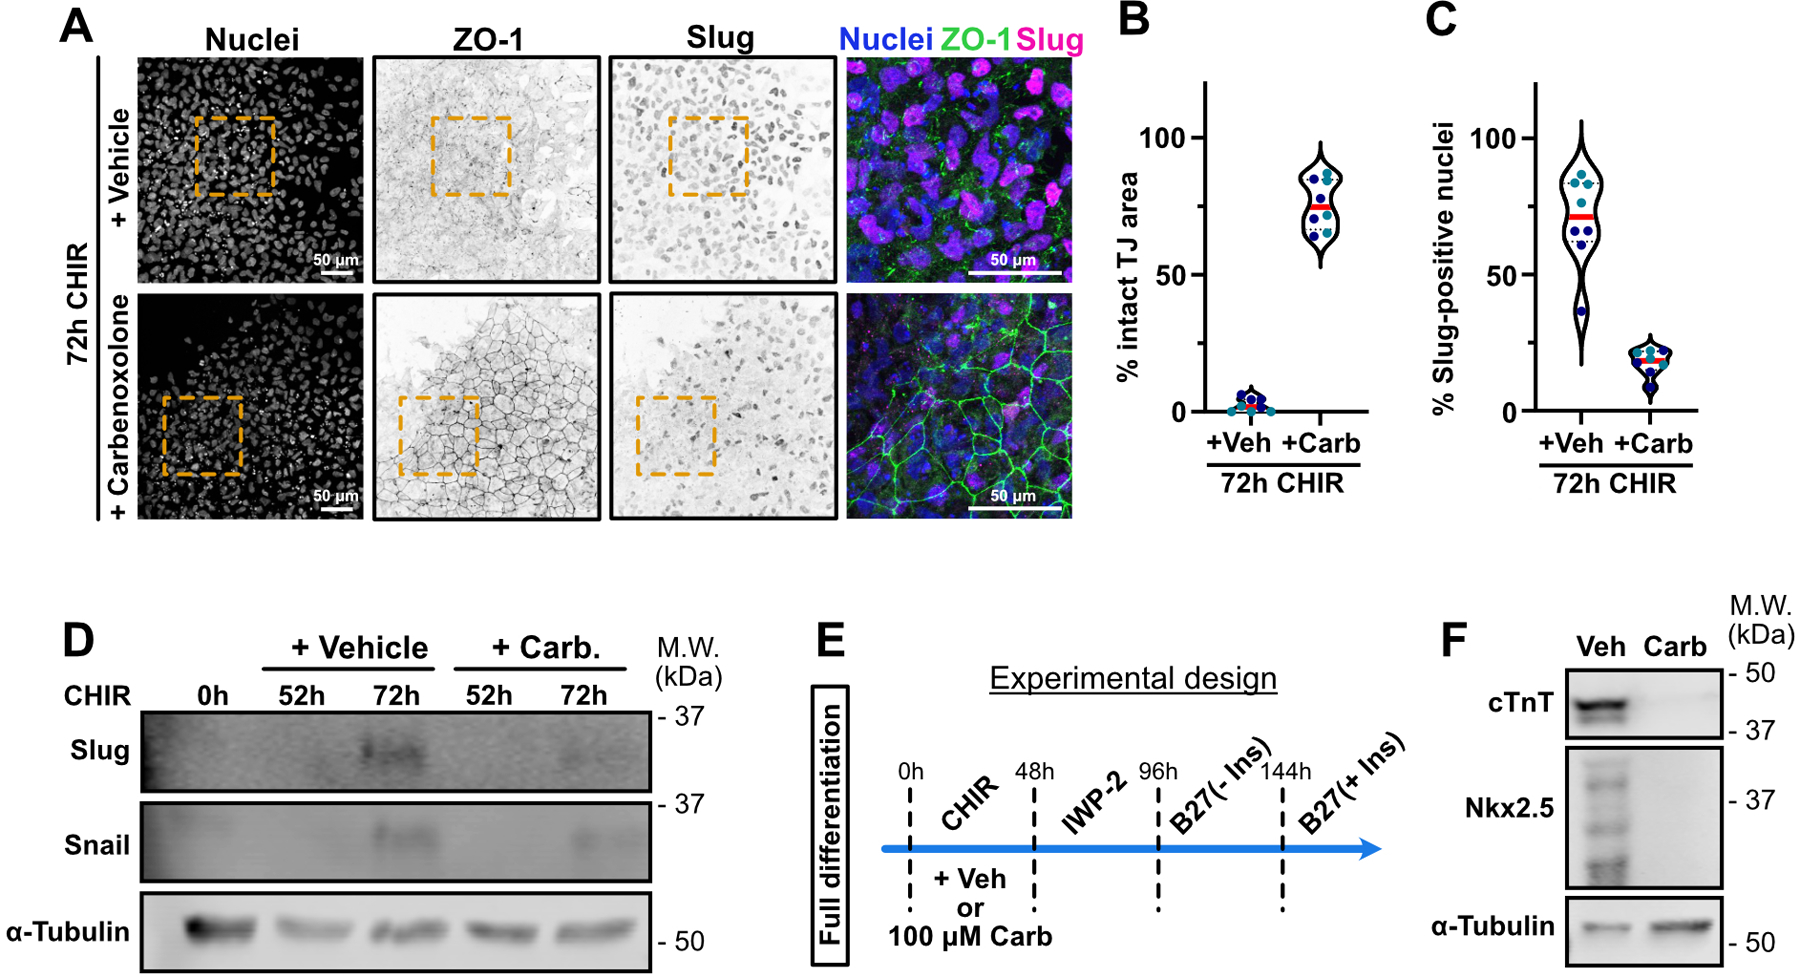
A-C) Representative Max IPs pictures of hiPSC co-treated with CHIR + Vehicle (water) or CHIR 100 μM Carbenoxolone for 72hrs and stained for nuclei (blue), ZO-1 (green) and Slug (Magenta). Scale bar = 50 μm. Magnified area (yellow dotted square) is shown as a merge. Scale bar = 50 μm (A). Percentage of area with intact tight junctions and percentage of Slug-positive nuclei is presented as violin plots in (B) and (C) respectively. (Median: plain red line – Quartiles: black dotted lines). Independent biological repeats are color-coded (N=8 random fields of view obtained from 2 independent experiments). Two-tailed unpaired t-test was applied (B-C).
D) Immunoblot analysis of Snail and Slug expression level during CHIR treatment in the presence or absence of Carbenoxolone. Molecular weights (M.W.) are indicated in kDa. (N=2 independent repeats).
E) Complete cardiomyocyte differentiation protocol timeline. 100 μM Carbenoxolone or Vehicle (water) was supplemented to the media during the CHIR step for 48hrs, followed by the usual steps and maintained in RPMI/B27(+Ins) media.
H) hiPSC were treated as presented in E and analyzed for expression of cardiac markers (Cardiac Troponin T and Nkx2.5) 13 days post differentiation initiation. Molecular weights (M.W.) are indicated in kDa.
Source numerical data and unprocessed blots are available in source data
Extended Data Fig. 7. Apyrase treatment partially blocks EMT.

A) Timeline of apyrase-treated conditioned media (CM) experiment. WT hiPSC were initially treated with CHIR + Q-VD-OPH. At the same time, WT hiPSCs were treated with CHIR only. 24hrs later, Q-VD-OPH was washed out and condition media from the CHIR-only treatment was added onto the Q-VD-OPH pre-treated cells, in the presence or absence of 2U/mL of Apyrase.
B) Representative Max IPs pictures of WT cells fixed after adding apyrase-treated CM as presented in (A). Cells were stained for ZO-1, Slug and nuclei. Scale bar = 50 μm. Magnified area (yellow dotted square) is shown for the ZO-1 channel. Scale bar = 10 μm.
Extended Data Fig. 8. P2Y2 receptor signaling is required for mesoderm specification.
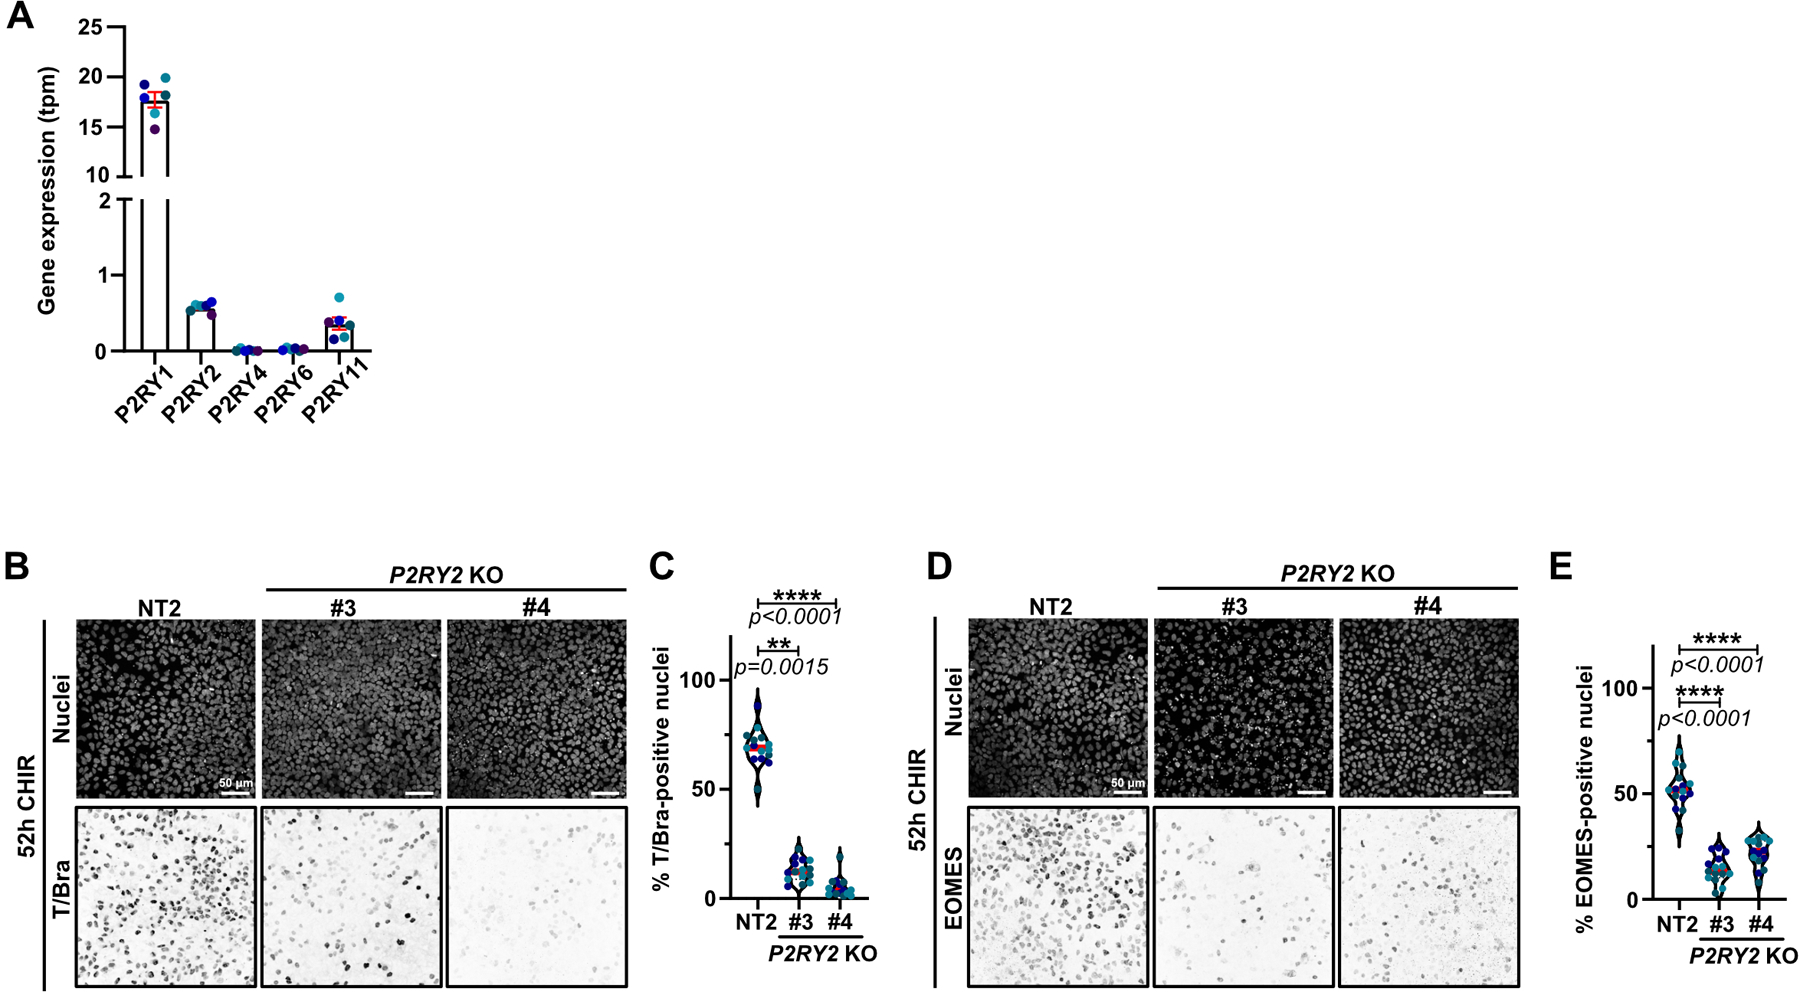
A) Gene expression for different members of the P2Y receptor family was obtained from RNAseq data realized by the Allen Institute. Data were obtained using the GM25256 hiPSC cell line, sequenced at different passage (color-coded).
B-E) Representative Max IPs images of control (NT2) and P2RY2 KO hiPSCs treated with CHIR for 52hrs and stained for nuclei and T/Bra (B) or EOMES (D). Scale bar = 50 μm. (B-D). Percentage of T/Bra (C) and EOMES-positive (E) nuclei were quantified and displayed as violin plots (Median: plain red line – Quartiles: black dotted lines). Independent biological repeats are color-coded (N=15 random fields of view obtained from 3 independent experiments). Dunn’s multiple comparisons test comparison test was applied in (C) and (E).
Source numerical data are available in source data
Supplementary Material
Acknowledgments
We thank Piyush Joshi (Gama lab) for establishing the BAX/BAK DKO hiPSCs and Megan Rasmussen (Gama lab) for the providing the SIM pictures of hiPSC-derived cardiomyocytes. We thank members of the Macara lab for discussion. This work was supported by GM070902 from NIGMS, CA197571 from the NCI (both to I.G.M) and by 1R35GM128915-01 (to V.G.).
Footnotes
Declaration of interests
The authors declare no competing interests.
Data availability
Previously published RNAseq data that were re-analysed in Extended Data 8A are available from the Allen Institute for Cell Science (https://www.allencell.org/genomics.html).
Source data have been provided in Source Data. All other data supporting the findings of this study are available from the corresponding author on reasonable request.
References
- 1.Ueno S et al. Biphasic role for Wnt/beta-catenin signaling in cardiac specification in zebrafish and embryonic stem cells. Proc Natl Acad Sci U S A 104, 9685–9690, doi: 10.1073/pnas.0702859104 (2007). [DOI] [PMC free article] [PubMed] [Google Scholar]
- 2.Lian X et al. Robust cardiomyocyte differentiation from human pluripotent stem cells via temporal modulation of canonical Wnt signaling. Proc Natl Acad Sci U S A 109, E1848–1857, doi: 10.1073/pnas.1200250109 (2012). [DOI] [PMC free article] [PubMed] [Google Scholar]
- 3.Rao J et al. Stepwise Clearance of Repressive Roadblocks Drives Cardiac Induction in Human ESCs. Cell Stem Cell 18, 554–556, doi: 10.1016/j.stem.2016.03.008 (2016). [DOI] [PubMed] [Google Scholar]
- 4.Loh KM et al. Mapping the Pairwise Choices Leading from Pluripotency to Human Bone, Heart, and Other Mesoderm Cell Types. Cell 166, 451–467, doi: 10.1016/j.cell.2016.06.011 (2016). [DOI] [PMC free article] [PubMed] [Google Scholar]
- 5.Fujita J et al. Caspase activity mediates the differentiation of embryonic stem cells. Cell Stem Cell 2, 595–601, doi: 10.1016/j.stem.2008.04.001 (2008). [DOI] [PMC free article] [PubMed] [Google Scholar]
- 6.Clark P; E F Distance to nearest neighbor as a measure of spatial relationships in populations. Ecology 35, 445–453, doi:doi: 10.2307/1931034 (1954). [DOI] [Google Scholar]
- 7.Jiang CL;G Y;Jain N;Wang Q; Truitt RE; Cote AJ; Ermert B; Mellis IA; Kiani K; Yang W; Jain R; Raj A Cell type determination for cardiac differentiation occurs soon after seeding of human induced pluripotent stem cells. BioRxiv, 10.1101/2021.08.08.455532 (2021). [DOI] [PMC free article] [PubMed] [Google Scholar]
- 8.Diaz-Diaz C et al. Pluripotency Surveillance by Myc-Driven Competitive Elimination of Differentiating Cells. Dev Cell 42, 585–599 e584, doi: 10.1016/j.devcel.2017.08.011 (2017). [DOI] [PubMed] [Google Scholar]
- 9.Bondue A et al. Defining the earliest step of cardiovascular progenitor specification during embryonic stem cell differentiation. J Cell Biol 192, 751–765, doi: 10.1083/jcb.201007063 (2011). [DOI] [PMC free article] [PubMed] [Google Scholar]
- 10.Joshi P et al. Modeling the function of BAX and BAK in early human brain development using iPSC-derived systems. Cell Death Dis 11, 808, doi: 10.1038/s41419-020-03002-x (2020). [DOI] [PMC free article] [PubMed] [Google Scholar]
- 11.Ravichandran KS Beginnings of a good apoptotic meal: the find-me and eat-me signaling pathways. Immunity 35, 445–455, doi: 10.1016/j.immuni.2011.09.004 (2011). [DOI] [PMC free article] [PubMed] [Google Scholar]
- 12.Lauber K, Blumenthal SG, Waibel M & Wesselborg S Clearance of apoptotic cells: getting rid of the corpses. Mol Cell 14, 277–287, doi: 10.1016/s1097-2765(04)00237-0 (2004). [DOI] [PubMed] [Google Scholar]
- 13.Chekeni FB et al. Pannexin 1 channels mediate ‘find-me’ signal release and membrane permeability during apoptosis. Nature 467, 863–867, doi: 10.1038/nature09413 (2010). [DOI] [PMC free article] [PubMed] [Google Scholar]
- 14.Sandilos JK et al. Pannexin 1, an ATP release channel, is activated by caspase cleavage of its pore-associated C-terminal autoinhibitory region. J Biol Chem 287, 11303–11311, doi: 10.1074/jbc.M111.323378 (2012). [DOI] [PMC free article] [PubMed] [Google Scholar]
- 15.Elliott MR et al. Nucleotides released by apoptotic cells act as a find-me signal to promote phagocytic clearance. Nature 461, 282–286, doi: 10.1038/nature08296 (2009). [DOI] [PMC free article] [PubMed] [Google Scholar]
- 16.Bao L, Locovei S & Dahl G Pannexin membrane channels are mechanosensitive conduits for ATP. FEBS Lett 572, 65–68, doi: 10.1016/j.febslet.2004.07.009 (2004). [DOI] [PubMed] [Google Scholar]
- 17.Erb L & Weisman GA Coupling of P2Y receptors to G proteins and other signaling pathways. Wiley Interdiscip Rev Membr Transp Signal 1, 789–803, doi: 10.1002/wmts.62 (2012). [DOI] [PMC free article] [PubMed] [Google Scholar]
- 18.Ankawa R et al. Apoptotic cells represent a dynamic stem cell niche governing proliferation and tissue regeneration. Dev Cell 56, 1900–1916 e1905, doi: 10.1016/j.devcel.2021.06.008 (2021). [DOI] [PubMed] [Google Scholar]
- 19.Vriz S, Reiter S & Galliot B Cell death: a program to regenerate. Curr Top Dev Biol 108, 121–151, doi: 10.1016/B978-0-12-391498-9.00002-4 (2014). [DOI] [PubMed] [Google Scholar]
- 20.Cressman VL et al. Effect of loss of P2Y(2) receptor gene expression on nucleotide regulation of murine epithelial Cl(−) transport. J Biol Chem 274, 26461–26468, doi: 10.1074/jbc.274.37.26461 (1999). [DOI] [PubMed] [Google Scholar]
- 21.Turner DA, Rue P, Mackenzie JP, Davies E & Martinez Arias A Brachyury cooperates with Wnt/beta-catenin signalling to elicit primitive-streak-like behaviour in differentiating mouse embryonic stem cells. BMC Biol 12, 63, doi: 10.1186/s12915-014-0063-7 (2014). [DOI] [PMC free article] [PubMed] [Google Scholar]
- 22.Manova K et al. Apoptosis in mouse embryos: elevated levels in pregastrulae and in the distal anterior region of gastrulae of normal and mutant mice. Dev Dyn 213, 293–308, doi: (1998). [DOI] [PubMed] [Google Scholar]
- 23.Lakhani SA et al. Caspases 3 and 7: key mediators of mitochondrial events of apoptosis. Science 311, 847–851, doi: 10.1126/science.1115035 (2006). [DOI] [PMC free article] [PubMed] [Google Scholar]
- 24.Ke FFS et al. Embryogenesis and Adult Life in the Absence of Intrinsic Apoptosis Effectors BAX, BAK, and BOK. Cell 173, 1217–1230 e1217, doi: 10.1016/j.cell.2018.04.036 (2018). [DOI] [PubMed] [Google Scholar]
- 25.Fukui H et al. Bioelectric signaling and the control of cardiac cell identity in response to mechanical forces. Science 374, 351–354, doi: 10.1126/science.abc6229 (2021). [DOI] [PubMed] [Google Scholar]
- 26.Lian X et al. Directed cardiomyocyte differentiation from human pluripotent stem cells by modulating Wnt/beta-catenin signaling under fully defined conditions. Nat Protoc 8, 162–175, doi: 10.1038/nprot.2012.150 (2013). [DOI] [PMC free article] [PubMed] [Google Scholar]
- 27.Labun K et al. CHOPCHOP v3: expanding the CRISPR web toolbox beyond genome editing. Nucleic Acids Res 47, W171–W174, doi: 10.1093/nar/gkz365 (2019). [DOI] [PMC free article] [PubMed] [Google Scholar]
References
- 1.Joshi P et al. Modeling the function of BAX and BAK in early human brain development using iPSC-derived systems. Cell Death Dis 11, 808, doi: 10.1038/s41419-020-03002-x (2020). [DOI] [PMC free article] [PubMed] [Google Scholar]
- 2.Lian X et al. Directed cardiomyocyte differentiation from human pluripotent stem cells by modulating Wnt/beta-catenin signaling under fully defined conditions. Nat Protoc 8, 162–175, doi: 10.1038/nprot.2012.150 (2013). [DOI] [PMC free article] [PubMed] [Google Scholar]
- 3.Lian X et al. Robust cardiomyocyte differentiation from human pluripotent stem cells via temporal modulation of canonical Wnt signaling. Proc Natl Acad Sci U S A 109, E1848–1857, doi: 10.1073/pnas.1200250109 (2012). [DOI] [PMC free article] [PubMed] [Google Scholar]
- 4.Labun K et al. CHOPCHOP v3: expanding the CRISPR web toolbox beyond genome editing. Nucleic Acids Res 47, W171–W174, doi: 10.1093/nar/gkz365 (2019). [DOI] [PMC free article] [PubMed] [Google Scholar]
- 5.Sanjana NE, Shalem O & Zhang F Improved vectors and genome-wide libraries for CRISPR screening. Nat Methods 11, 783–784, doi: 10.1038/nmeth.3047 (2014). [DOI] [PMC free article] [PubMed] [Google Scholar]
Associated Data
This section collects any data citations, data availability statements, or supplementary materials included in this article.
Supplementary Materials
Data Availability Statement
Previously published RNAseq data that were re-analysed in Extended Data 8A are available from the Allen Institute for Cell Science (https://www.allencell.org/genomics.html).
Source data have been provided in Source Data. All other data supporting the findings of this study are available from the corresponding author on reasonable request.


