Abstract
A composite catalyst, Pd/C-SO3H, has been prepared to depolymerize plant-derived polymeric proanthocyanidins (PPC). Different reaction conditions were explored and the catalyst was shown to have good performance and recyclability, as well as good thermal and acid–base stability. UV, FTIR and 1H NMR analyses showed that the depolymerization products (oligomeric proanthocyanidins, OPC) retained a condensed flavanol polyphenol structure and that the basic structural units of the polymers had not been destroyed. The antioxidant activity of the OPC was better than that of the PPC, and also better than that of 2,6-di-tert-butyl-4-methylphenol, which is widely used in industry, including as a food additive. OPC could, therefore, be developed as a commercially useful radical chain-breaking antioxidant. The preparation of Pd/C-SO3H provides an example of the design and development of a new composite catalyst that has high practical value. The study also provides a new technical route for the depolymerization of PPC and thus makes a useful contribution to the high-value utilization of renewable plant resources.
A composite catalyst, Pd/C-SO3H, has been prepared to depolymerize plant-derived polymeric proanthocyanidins (PPC).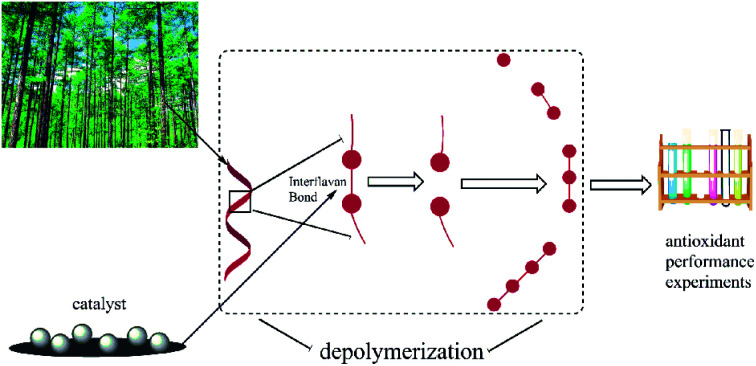
Introduction
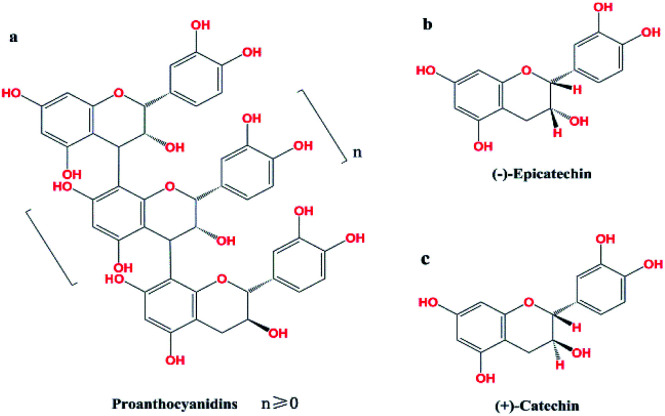
Excessive global consumption of non-renewable resources leads to environmental damage and depletion of these resources. This has prompted scientists around the world to find ways to improve the use of renewable plant resources by converting plant metabolites into energy or functional chemicals.1 Proanthocyanidins, which are abundant in larch bark, are one of the most important classes of plant secondary metabolites and provide a rich source of renewable raw materials that can be developed into a variety of functional chemicals.2,3 Proanthocyanidins are polymers, with catechins or epicatechins as the basic structural units4 (Fig. 1). Polymers with higher numbers of structural units (n ≥ 5) are known as polymeric proanthocyanidins (PPC), and oligomers with fewer structural units (n < 5) are known as oligomeric proanthocyanidins (OPC). Because of their lower degree of polymerization and reduced steric hindrance compared with PPC, OPC interact more readily with biological systems,5 and have improved biological activity and antioxidant performance.6 Since OPC have a wider range of applications than PPC, depolymerization of PPC has important practical significance.
Fig. 1. (a) Structure of proanthocyanidins PPC, n ≥ 5; OPC, n < 5; (b) epicatechin; (c) catechin.
PPC can be depolymerized into OPC under homogeneous reaction conditions, using H2SO4 as the catalyst,7 but this procedure has several drawbacks. Since H2SO4 is a strong inorganic acid, it severely corrodes equipment at high temperatures, the separation and purification of the depolymerized products are difficult, and treatment of wastewater is necessary. Heterogeneous solid acid catalysts (SACs) have acid strengths comparable to that of H2SO4, are easy to recycle, and are environmentally friendly. Carbon-based SACs, especially, have good thermal stability, high densities of acidic sites on the surface, and are also insoluble in water and so will not contaminate wastewater.8,9 Carbon-based SACs would thus appear to be very suitable for catalytic depolymerization of PPC. Noble metal catalysts are widely used10–12 and Pd/C13 has been used to depolymerize PPC, although the yield of depolymerized products under laboratory conditions was less than 40%. Such a low yield would lead to very high production costs in an industrial process and alternative catalysts that can efficiently and quickly depolymerize PPC in high yield would have large commercial benefits.
If Pd could be complexed with a carbon-based SAC to produce a composite catalyst, the Pd and SAC may act synergistically to give enhanced catalytic activity and higher yields in the depolymerization of PPC. Using activated carbon, which has a well-developed pore structure, as the carbon-based carrier would allow the Pd metal to be highly dispersed on the surface of the carrier and should further improve catalytic efficiency.
Here, we prepared a composite catalyst, Pd/C-SO3H, which we predicted would depolymerize PPC with high efficiency. The structure of the catalyst was characterized using X-ray diffractometry (XRD), Brunauer–Emmett–Teller (BET) analysis, scanning electron microscopy (SEM) and thermogravimetric (TG) analysis. The stability of the catalyst and its performance in the depolymerization of PPC were investigated under different conditions. The depolymerization products were characterized by UV, FTIR and 1H NMR spectroscopy, and their antioxidant properties were determined. This research provides a useful exploration of the efficient depolymerization and high-value utilization of PPC.
Results and discussion
Proposed mechanism of catalytic depolymerization of PPC
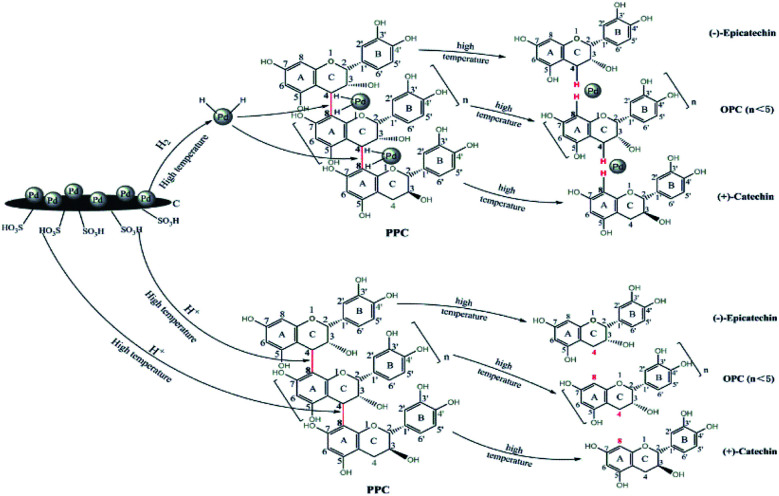
Larch proanthocyanidins are composed of flavan-3-ol structural units linked by C4–A8 bonds.32 When PPC are depolymerized using Pd/C-SO3H, the mechanism of the Pd metal-catalyzed hydrogenolysis is as follows. The Pd metal surface adsorbs a large amount of hydrogen and, under high temperature conditions, the Pd forms a metal–hydrogen complex with hydrogen. Interaction of this complex with the C4–A8 bonds of the PCCs leads to release of hydrogen atoms from the complex and subsequent cleavage of the C4–A8 bonds, producing OPC.13 The mechanism of the C-SO3H-catalyzed depolymerization is as follows. At high temperatures, the hydrophilic –SO3H groups in the C-SO3H solid acid release a large quantity of H+ ions on entering the liquid phase. These H+ ions are highly reactive and break the C4–A8 bonds to produce OPC33 (Fig. 2).
Fig. 2. Diagram showing proposed mechanism of Pd/C-SO3H-catalyzed depolymerization of PPC.
Structural characterization of the catalyst
Determination of total acid group density on C-SO3H surface
The total density of acid groups d(H+) on the surface of C-SO3H was determined to be 6.41 mmol g−1. A large number of –SO3H groups are thus distributed on the surface of the activated carbon, indicating that the carbon-based solid acid C-SO3H had been successfully prepared.
Characterization by X-ray diffractometry
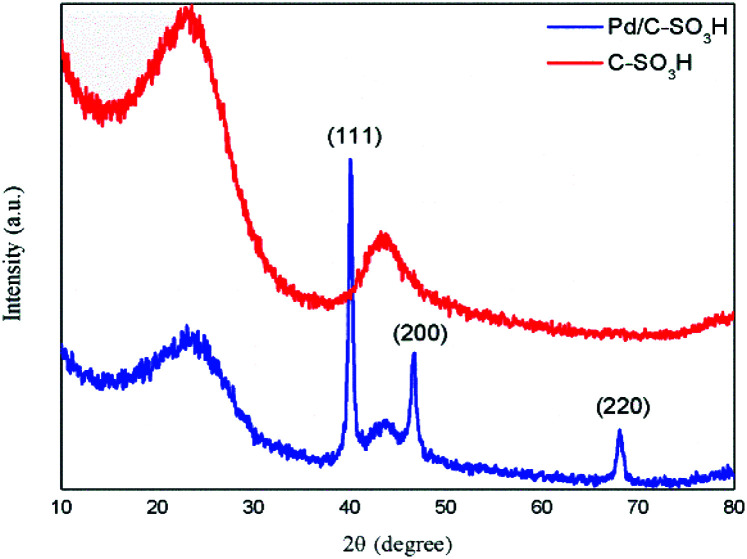
The X-ray diffraction patterns of the carbon-based solid acid C-SO3H and the composite catalyst Pd/C-SO3H are shown in Fig. 3. The crystal structures of both C-SO3H and Pd/C-SO3H have diffraction peaks at 2θ angles 24.17° and 43.95°, which correspond to the C-layer stack structure (002) and crystal plane and layer structure (101) of the crystal face, respectively. The spectrum of Pd/C-SO3H also shows three distinct diffraction peaks at 2θ angles 40.11°, 46.66° and 68.12°. These are the diffraction peaks of the Pd (111), Pd (200) and Pd (220) crystal planes, respectively.34 These data show that the Pd in Pd/C-SO3H exists as a face-centered cubic structure. The Pd supported on the surface of the C-SO3H is in the reduced state, proving that the preparation of the Pd/C-SO3H catalyst was successful.
Fig. 3. XRD patterns of C-SO3H and Pd/C-SO3H.
Brunauer–Emmett–Teller analysis
The results of the physical adsorption analysis of the carbon-based solid acid C-SO3H and the composite catalyst Pd/C-SO3H are shown in Table 1. The surface area of C-SO3H is 939.49 m2 g−1, the micropore area is 723.42 m2 g−1, the pore volume is 0.38 cm3 g−1 and the pore size is 2.17 nm. The surface area of Pd/C-SO3H is 889.97 m2 g−1, the micropore area is 688.86 m2 g−1, the pore volume is 0.36 cm3 g−1 and the pore size is 2.16 nm. All four values are lower for Pd/C-SO3H than for C-SO3H, showing that loading Pd metal onto the surface of C-SO3H results in a decrease in surface area, pore area, pore volume and pore size. The surface area of C-SO3H is governed mainly by the internal porosity. When the C-SO3H surface is loaded with Pd, a large amount of metal will be adsorbed and some Pd will enter the pores of the C-SO3H skeleton. This leads to clogging or narrowing of some of the pores, which means that the surface area, pore area, pore volume and pore size of the C-SO3H are reduced after loading Pd.
BET analysis of C-SO3H and Pd/C-SO3H.
| Catalyst | Surface areaBET (m2 g−1) | Micropore area (m2 g−1) | Pore volume (cm3 g−1) | Pore size (nm) |
|---|---|---|---|---|
| Pd/C-SO3H | 889.97 | 688.86 | 0.36 | 2.16 |
| C-SO3H | 939.49 | 723.42 | 0.38 | 2.17 |
Characterization by scanning electron microscopy
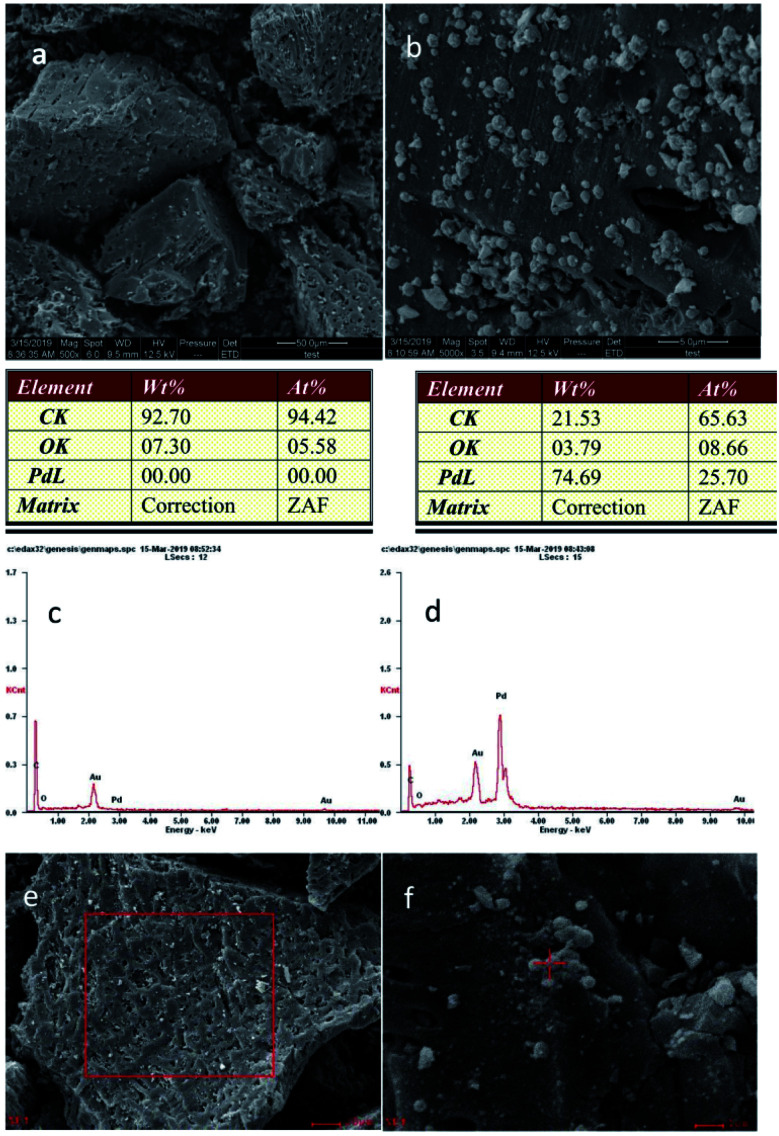
Scanning electron micrographs of C-SO3H (500× magnification) and Pd/C-SO3H (5000× magnification) are shown in Fig. 4a and b, respectively, and the corresponding energy spectra are shown in Fig. 4c and d, respectively. C-SO3H has an open pore structure (Fig. 4a) and the catalyst surface is rough and covered with gullies. These pores and gullies facilitate loading of Pd metal and greatly improve its dispersibility, which means that the Pd can make fuller contact with hydrogen and form sufficient metal–hydrogen complex for efficient catalysis. This type of structure increases the specific surface area available for adsorption of Pd and generates a high surface free energy, which reduces the activation energy of the catalytic reaction, thereby achieving high catalytic efficiency in the depolymerization of PPC.
Fig. 4. SEM images of (a) C-SO3H (500× magnification) and (b) Pd/C-SO3H (5000× magnification); energy spectrum analyses of (c) C-SO3H and (d) Pd/C-SO3H (elemental Au is due to gold plating); (e) EDS images of C-SO3H and (f) EDS images of Pd/C-SO3H.
In Pd/C-SO3H, a large quantity of spherical particles are distributed on the surface of the C-SO3H (Fig. 4b).35 The spherical particles were confirmed to be metallic Pd by comparison with the energy spectrum elements of C-SO3H and Pd/C-SO3H (Fig. 4e and f), demonstrating that Pd metal was successfully loaded onto the C-SO3H to form the composite catalyst Pd/C-SO3H and confirming the results of the XRD and BET analyses.
Determination of catalyst stability
Thermal stability of the catalyst
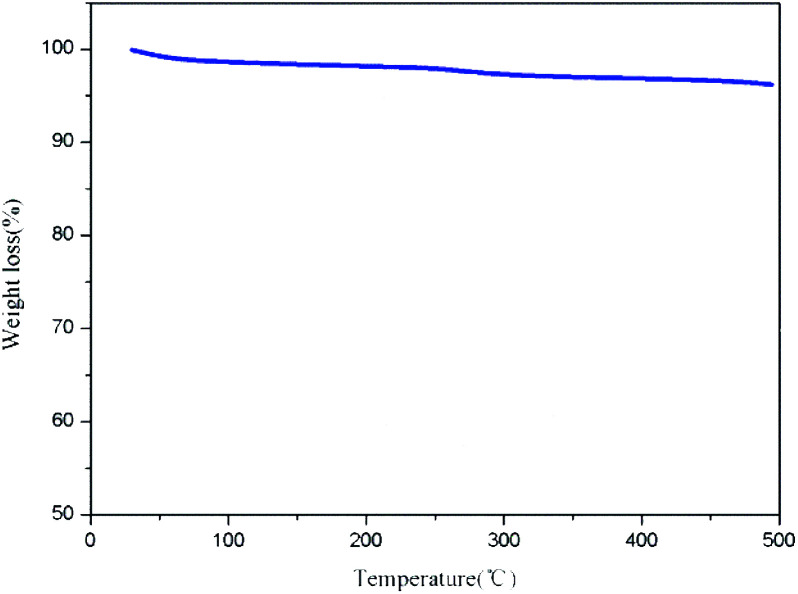
The TG chart (Fig. 5) shows that Pd/C-SO3H loses <4% in weight (reduced from 99.98% to 96.25%) over the temperature range 30–500 °C. This indicates that Pd/C-SO3H has good thermal stability and can be used for the depolymerization of PPC at different temperatures.
Fig. 5. TG chart for Pd/C-SO3H.
Recyclability of the catalyst
After an initial round of depolymerization, in which the mass ratio of Pd/C-SO3H to PPC was 1 : 6, the catalyst was recovered and reused under the same reaction conditions.
With increasing reuse, the mass of the catalyst gradually decreased (Table 2), indicating some losses in during recovery of the catalyst. When the catalyst was reused three times, the average degree of polymerization of the products increased, but was still <5, demonstrating that the depolymerized products were OPC. The depolymerization yield showed a downward trend when the catalyst was reused but did not fall below 40%. These data show that Pd/C-SO3H has some stability towards recycling, which would allow recycling of the catalyst in industrial production processes and thus reduce the cost of depolymerization.
Effect of Pd/C-SO3H recycling on depolymerization of PCCs.
| Number of uses | Catalyst (g) | PPC (g) | Average degree of polymerization of PPC | Average degree of polymerization of OPC | Depolymerization yield (%) |
|---|---|---|---|---|---|
| 1 | 0.25 | 1.5 | 7.60 | 3.14 | 55.58 |
| 2 | 0.22 | 1.5 | 7.60 | 3.98 | 53.15 |
| 3 | 0.18 | 1.5 | 7.60 | 4.36 | 47.77 |
Acid–base stability of the catalyst
Using a mass ratio of Pd/C-SO3H to PPC of 1 : 6, the pH of the reaction solution was varied, whilst keeping other reaction conditions the same. The effects of different pH values on depolymerization are shown in Table 3.
Effect of pH on Pd/C-SO3H-catalyzed depolymerization of PPC.
| pH | Catalyst (g) | PPC (g) | Average degree of polymerization of PPC | Average degree of polymerization of OPC | Depolymerization yield (%) |
|---|---|---|---|---|---|
| 2.70 | 0.25 | 1.5 | 7.60 | 3.62 | 57.52 |
| 4.99 | 0.25 | 1.5 | 7.60 | 3.14 | 55.58 |
| 10.29 | 0.25 | 1.5 | 7.60 | 3.22 | 44.87 |
When the pH of the reaction solution was not adjusted (pH = 4.99), the average degree of polymerization of the product OPC was 3.14 and the depolymerization yield was 55.58%. When the reaction solution was strongly acidic (pH = 2.70), the average degree of polymerization of the OPC was 3.62 and the depolymerization yield increased to 57.52%. When the reaction solution was strongly alkaline (pH = 10.29), the degree of polymerization of the OPC was 3.22 and the depolymerization yield was 44.87%. Although depolymerization occurred under all pH conditions, depolymerization without pH adjustment produced OPC with the lowest degree of polymerization, whereas depolymerization at pH 2.70 gave a slightly higher yield of OPC. Pd/C-SO3H thus has good acid–base stability and can depolymerize PPC under different pH conditions. This means that high yields of OPC can be obtained under both acidic and alkaline conditions and that Pd/C-SO3H is suitable for the depolymerization of PPC in different industrial environments.
Effect of temperature on depolymerization of PPC
The effects of different reaction temperatures (220 °C, 240 °C and 260 °C) on the depolymerization of PPC are shown in Table 4. A reaction temperature of 220 °C gave the lowest average degree of polymerization of the OPC (3.14) and the highest depolymerization yield (55.58%), indicating that 220 °C is the best temperature for depolymerization of PPC.
Effect of temperature on depolymerization of PPC.
| Temperature (°C) | Time (h) | H2 pressure (MPa) | PPC (g) | Catalyst (g) | Average degree of polymerization of PPC | Average degree of polymerization of OPC | Depolymerization yield (%) |
|---|---|---|---|---|---|---|---|
| 200 | 2 | 5 | 1.5 | 0.25 | 7.60 | 4.28 | 44.23 |
| 220 | 2 | 5 | 1.5 | 0.25 | 7.60 | 3.14 | 55.58 |
| 240 | 2 | 5 | 1.5 | 0.25 | 7.60 | 3.64 | 51.98 |
Temperature plays an important role in the depolymerization of PPC since increased temperature provides additional thermal energy for Pd metal and hydrogen to form a metal–hydrogen complex. A high temperature is also required to provide sufficient energy for the release of hydrogen atoms from the complex. When the temperature in the reactor is low, energy cannot be accumulated for the release of hydrogen atoms from the metal complex, limiting the amount of hydrogen atoms available to cleave the C4–A8 bond in the PPC and resulting in OPC with a higher degree of polymerization and a lower depolymerization yield. When the temperature in the reactor is high, an excessive amount of metal–hydrogen complex is formed and too many hydrogen atoms are released. These hydrogen atoms can attack chemical bonds other than the C4–A8 bond, resulting in a higher degree of polymerization of the depolymerized product and a lower depolymerization yield. For acid catalysis by the –SO3H group, higher temperatures provide energy for release of H+ ions and activate these ions to cleave the C4–A8 bond. When the reaction temperature is too low, the smaller amount of reactive H+ ions is insufficient to break all of the C4–A8 bonds, resulting in poor depolymerization yields. When the temperature is too high, excessive amounts of H+ ions cause oxidation of the PPC, leading to by-products such as anthocyanins. A red powder is produced during the depolymerization process,36 resulting in poor depolymerization yields.
Effect of reaction time on depolymerization of PPC
Depolymerization reactions were carried out for 1, 2 and 3 h, whilst keeping other conditions the same (Table 5). When the reaction time was 2 h, the average degree of polymerization of the products was the lowest (3.14) and the depolymerization yield was the highest (55.58%), indicating that 2 h is the best of the tested reaction times for the depolymerization reaction.
Effect of reaction time on depolymerization of PPC.
| Time (h) | Temperature (°C) | H2 pressure (MPa) | PPC (g) | Catalyst (g) | Average degree of polymerization of PPC | Average degree of polymerization of OPC | Depolymerization yield (%) |
|---|---|---|---|---|---|---|---|
| 1 | 220 | 5 | 1.5 | 0.25 | 7.60 | 4.54 | 41.76 |
| 2 | 220 | 5 | 1.5 | 0.25 | 7.60 | 3.14 | 55.58 |
| 3 | 220 | 5 | 1.5 | 0.25 | 7.60 | 3.78 | 50.08 |
The effect of reaction time on the depolymerization of PPC is similar to effect of reaction temperature. When the reaction time is extended from 1 h to 3 h, the average degree of polymerization of the products first decreases and then increases, and the depolymerization yield first increases and then decreases. When the depolymerization time is less than 2 h, insufficient reactive hydrogen atoms and H+ ions have been released from the catalyst to break all of the C4–A8 bonds. As more reactive hydrogen species are released over time, more C4–A8 bonds are broken; the average degree of polymerization of the OPC decreases and the depolymerization yield increases. As the reaction time is extended further, reactive hydrogen species may destroy the OPC and monomers, leading to a decrease in the number of OPC, resulting in a higher average degree of polymerization in the depolymerization products and a decrease in the depolymerization yield.
Effect of hydrogen pressure on depolymerization of PPC
Depolymerization reactions were carried out under hydrogen pressures of 3, 4 and 5 MPa, whilst keeping other conditions the same (Table 6). When the hydrogen pressure was 5 MPa, the average degree of polymerization of the products was the lowest (3.14) and the depolymerization yield was the highest (55.58%), indicating that 5 MPa is the best of the tested hydrogen pressures for the depolymerization reaction.
Effect of hydrogen pressure on depolymerization of PPC.
| H2 pressure (MPa) | Temperature (°C) | Time (h) | PPC (g) | Catalyst (g) | Average degree of polymerization of PPC | Average degree of polymerization of OPC | Depolymerization yield (%) |
|---|---|---|---|---|---|---|---|
| 3 | 220 | 2 | 1.5 | 0.25 | 7.60 | 4.42 | 43.48 |
| 4 | 220 | 2 | 1.5 | 0.25 | 7.60 | 4.04 | 48.27 |
| 5 | 220 | 2 | 1.5 | 0.25 | 7.60 | 3.14 | 55.58 |
The average degree of polymerization of the OPC decreased, and the depolymerization yield increased, with increasing hydrogen pressure. When the hydrogen pressure was <5 MPa, there were insufficient hydrogen molecules to saturate the catalyst, so not all the C4–A8 bonds were broken. As the hydrogen pressure increased, more hydrogen molecules were converted into hydrogen atoms, leading to increased cleavage of the C4–A8 bond. As the hydrogen pressure increased, therefore, the average degree of polymerization of the products decreased and the depolymerization yield increased.
Effect of catalyst loading on depolymerization of PPC
Depolymerization reactions were carried out with catalyst loadings of 0.20%, 0.25% and 0.30% (g mL−1), whilst keeping other conditions the same (Table 7). The average degree of polymerization of the product was the lowest (3.14) and the depolymerization yield was the highest (55.58%) when the catalyst loading was 0.25% (g mL−1).
Effect of catalyst loading on depolymerization of PPC.
| Catalyst (g) | Temperature (°C) | Time (h) | PPC (g) | H2 pressure (MPa) | Average degree of polymerization of PPC | Average degree of polymerization of OPC | Depolymerization yield (%) |
|---|---|---|---|---|---|---|---|
| 0.20 | 220 | 2 | 1.5 | 5 | 7.60 | 4.24 | 41.96 |
| 0.25 | 220 | 2 | 1.5 | 5 | 7.60 | 3.14 | 55.58 |
| 0.30 | 220 | 2 | 1.5 | 5 | 7.60 | 3.73 | 50.12 |
During catalytic hydrogenolysis, hydrogen molecules enter the liquid phase, become adsorbed onto the catalyst surface, and dissociate into hydrogen radicals, which then participate in cleavage of the C4–A8 bond. When the catalyst loading is <0.25% (g mL−1), the contact area between the catalyst and the reaction solution is small. The amount of adsorbed hydrogen is thus small, there is little dissociation into hydrogen radicals, and the reaction efficiency is low, leading to products with a higher average degree of polymerization and a lower depolymerization yield. When the catalyst loading is higher than 0.25% (g mL−1), excess hydrogen radicals prevent formation of a homogeneous reaction system. This damages the procyanidin structure in the newly formed oligomers and monomers, leading to an increase in the average degree of polymerization of the products and a lower depolymerization yield.
In summary, among the experimental conditions tested, the best conditions for catalytic depolymerization of PCCs using Pd/C-SO3H are: reaction temperature, 220 °C; reaction time, 2 h; hydrogen pressure, 5 MPa; and catalyst loading, 0.25% (g mL−1). Using these conditions, the average degree of polymerization of the products was reduced from 7.60 to 3.14, and the depolymerization yield was 55.58%. Li et al.13 used Pd/C to catalyze the depolymerization of sorghum high-polymer proanthocyanidins and achieved a yield of <40%. Compared with depolymerization using Pd/C, catalysis using Pd/C-SO3H requires a higher temperature, but catalyst consumption is reduced, the reaction time is shorter and the depolymerization yield is improved. The cost of catalytic hydrogenolysis of PCCs using Pd/C-SO3H is thus lower than that using Pd/C, which has important commercial significance.
Spectral analysis
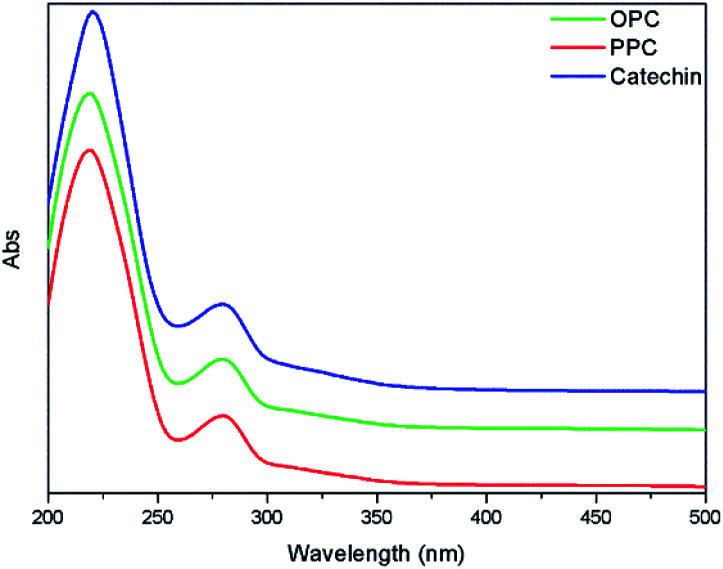
The UV absorption spectra of PPC, OPC and the catechin standard have characteristic absorption peaks at 210 nm and 280 nm (Fig. 6). The absorption peaks at 210 nm are caused by the three conjugated double bonds of the benzene ring, and the absorption peaks at 280 nm are caused by the conjugated structures of the A and B rings of the proanthocyanidins.37 The UV absorption spectra of OPC and PPC are similar since both are condensed flavanol polyphenol structures, with similar basic structural units. The UV absorption spectra are also similar to that of the catechin standard since the basic structural units of OPC and PPC are catechin and epicatechin. Depolymerization using Pd/C-SO3H thus does not destroy the basic structural units of the PPC.
Fig. 6. UV absorption spectra of PPC, OPC and catechin standard.
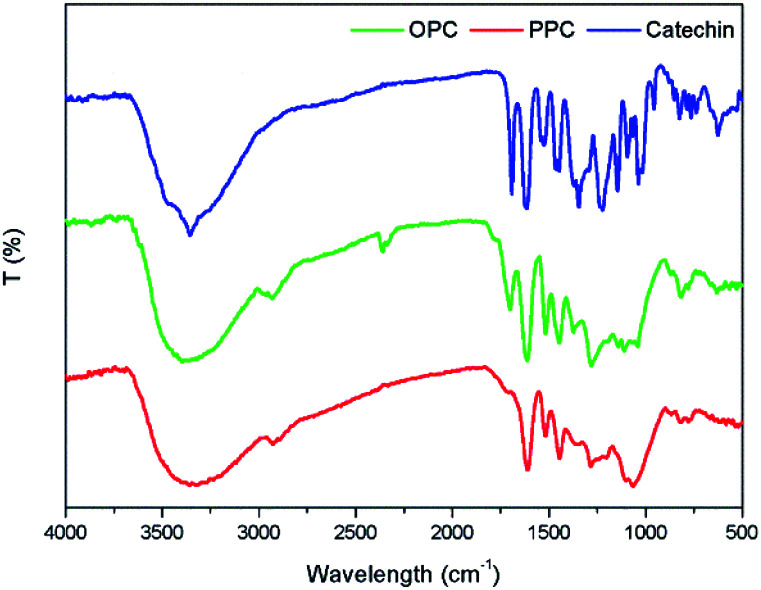
The infrared absorption spectra of PPC, OPC and the catechin standard show peaks that are characteristic of the same functional groups (Fig. 7). The strong absorption peak at 3390 cm−1 is caused by phenolic –OH stretching vibrations, the peak at 2930 cm−1 is the antisymmetric stretching vibration absorption peak of C–H bonds in methylene CH2 groups, the peaks at 1611 cm−1, 1580 cm−1, 1515 cm−1 and 1450 cm−1 are characteristic absorption peaks of C C respiratory vibrations of the benzene ring skeleton, the peak at 1290 cm−1 is the stretching vibration absorption peak of the ether bond C–O–C, and the peak at 1112 cm−1 is the characteristic absorption peak of secondary alcohols.38 The bending vibration absorption peak of the benzene ring C–H is in the fingerprint region at 920–980 cm−1 and the unsaturated C–H out-of-plane deformation vibration absorption peak of the aromatic ring skeleton is at ∼800 cm−1. Since the infrared absorption spectra of all three molecules are essentially the same, the chemical structures of the three molecules are also very similar. The infrared spectra thus provide further evidence that the depolymerization reaction using Pd/C-SO3H as catalyst breaks the C4–A8 bonds between monomers but does not destroy the basic structural units of the PPC. The product OPC retain the structural characteristics of the PPC, which is consistent with the UV absorption spectroscopy results.
Fig. 7. Infrared absorption spectra of PPC, OPC and catechin standard.
1H NMR analysis
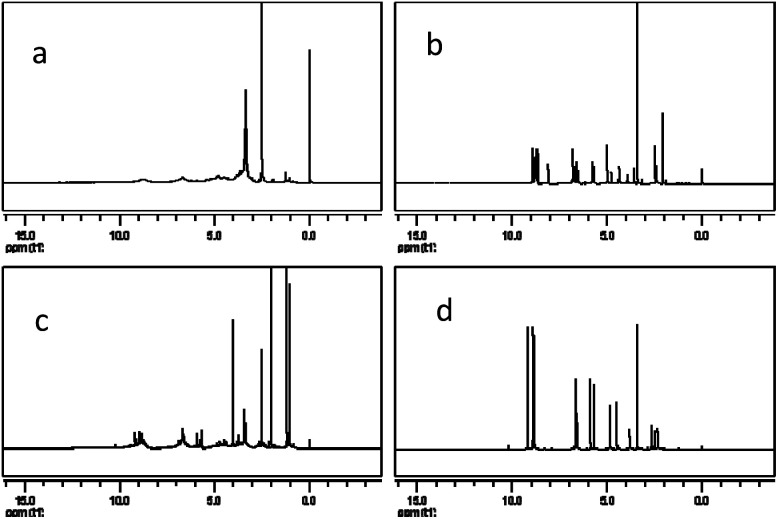
The 1H NMR spectra of PPC, OPC, proanthocyanidin B1 and catechin (Fig. 8) show peaks at 2.5–3.0 ppm (H-4), 3.6–4.3 ppm (H-3), 4.7–5.0 ppm (H-2), 5.8–6.5 ppm (H-6, H-8), 6.7–7.2 ppm (H-2′, H-5′, H-6′) and 8.8–9.2 ppm (–OH).33,39 The spectrum of OPC is similar to those of proanthocyanidin B1 and catechin, showing that the structure of the depolymerization products are similar to those of proanthocyanidin B1 and catechin, and confirming that the depolymerization products are proanthocyanidins with a low degree of polymerization. The 1H NMR spectra thus also demonstrate that catalytic depolymerization using Pd/C-SO3H does not destroy the basic structural units of the PPC and confirms the proposed depolymerization mechanism.
Fig. 8. 1H NMR spectra of (a) PPC, (b) OPC, (c) proanthocyanidin B1 and (d) catechin.
Inductively coupled plasma mass spectrometry analysis
The amount of Pd in the depolymerisation products was determined by ICP-MS. After using the catalyst once, twice and three times, the amount of residual Pd in the OPC was 0.003, 0.012 and 0.016 mg kg−1, respectively (Table 8). The European Food Safety Authority considers that a concentration of Pd in food up to 0.05 mg kg−1 is not of toxicological concern ((EC)no. 629/008). Even after using the catalyst three times, residual Pd is well below this limit, showing that OPC produced using Pd/C-SO3H can be safely used as an antioxidant for foods.
Detection of Pd in depolymerized products.
| Number of catalyst uses | Weight used (g) | Measured concentration (μg L−1) | Pd content in products (mg kg−1) |
|---|---|---|---|
| 1 | 0.2545 | 0.06 | 0.003 |
| 2 | 0.2548 | 0.33 | 0.012 |
| 3 | 0.2542 | 0.59 | 0.016 |
Antioxidant properties of OPC
Reducing ability
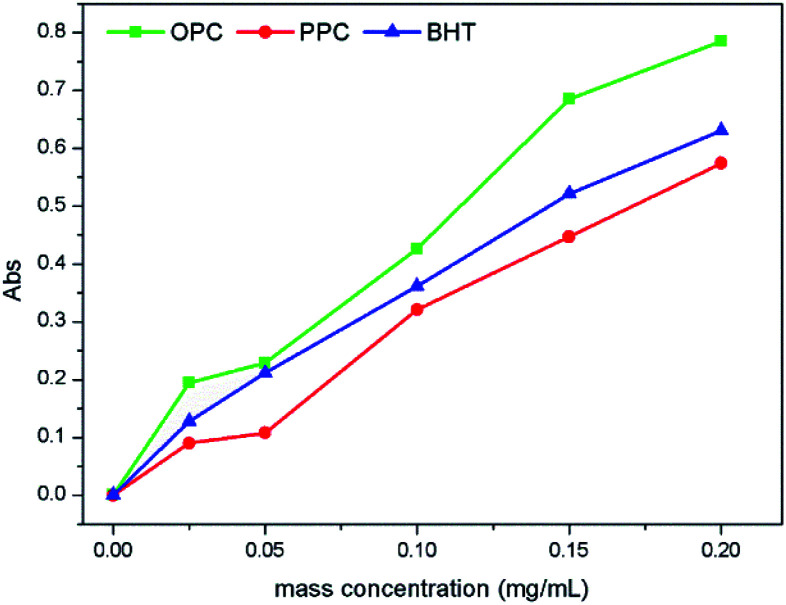
Reducing ability is an important indicator of antioxidant performance; the stronger the reducing ability, the greater the antioxidant capacity. The Prussian blue method was used to measure the reducing power of OPC, PPC and the commonly used antioxidant BHT. The principle underlying this method is that phenolic hydroxyl groups on the proanthocyanidin molecule can reduce Fe3+ to Fe2+, and the resulting change of Fe3+ concentration, which causes a change in absorbance, reflects the reducing power of the proanthocyanidin.40 The reducing ability of OPC, PPC and BHT all increased with increasing mass concentration over the range 0–0.20 mg mL−1 (Fig. 9). At a mass concentration of 0.20 mg mL−1, the absorbance values of BHT, PPC and OPC were 0.63, 0.574, and 0.785, respectively, and reducing ability is thus in the order OPC > BHT > PPC. The main reason for the increased reducing ability of the OPC is that the steric hindrance of the phenolic hydroxyl groups is decreased when PPC are depolymerized by Pd/C-SO3H. Notably, the reducing ability of OPC is better than that of the standard antioxidant BHT at the same concentration.
Fig. 9. Reducing ability of OPC, PPC and BHT at different mass concentrations.
DPPH˙ scavenging capacity
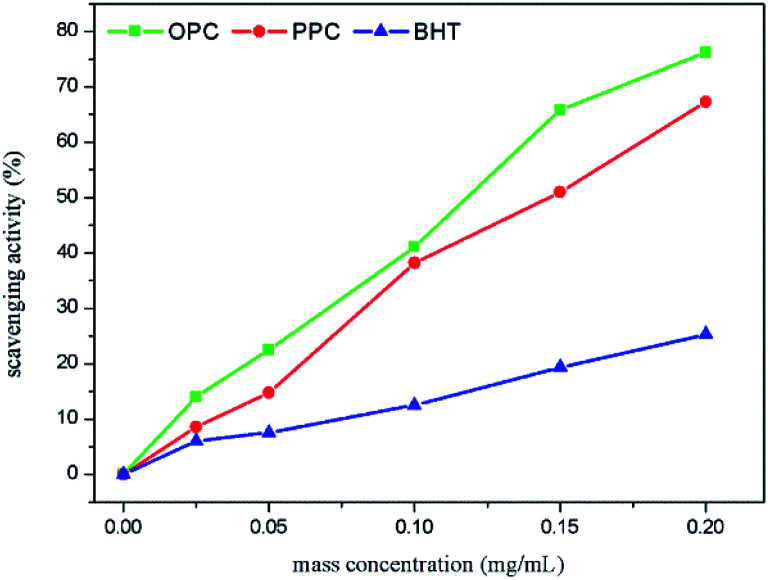
DPPH˙ contains a stable free radical centered on nitrogen. Its stability mainly derives from its conjugated structure and the steric hindrance of three benzene rings, which make it difficult to pair the unpaired electrons on the nitrogen atom.41 The unpaired electrons impart a dark purple color in ethanol solution, with a maximum absorption peak at 517 nm. The addition of antioxidants releases H+ and the reduced form of DPPH˙ (DPPH-H), resulting in a decrease in DPPH˙ concentration and a decrease in absorbance. The ability of antioxidants to remove DPPH˙ can thus be determined by the change in absorbance at 517 nm. The greater the rate of clearance of DPPH˙, the stronger the antioxidant capacity. Over the mass concentration range 0.025–0.20 mg mL−1, the scavenging rate of OPC, PPC and BHT increased with increasing concentration (Fig. 10). At a mass concentration of 0.20 mg mL−1, the scavenging rates of BHT, PPC and OPC were 25.29%, 67.26% and 76.25%, respectively, and the DPPH˙ scavenging ability is thus in the order OPC > PPC > BHT. OPC exhibits better DPPH˙ scavenging ability than PPC because of their lower molecular weight, smaller steric hindrance and more active A-ring and B-ring phenolic hydroxyl groups. Both PPC and OPC showed better DPPH˙ scavenging ability than BHT because the ortho-phenolic hydroxyl groups of the proanthocyanidin B ring act as hydrogen donors, which can accept free radicals and form stable intramolecular hydrogen bonds, semi-steroidal free radicals or o-benzoquinones, thus blocking the free radical chain reaction.42
Fig. 10. DPPH˙ scavenging capacity of OPC, PPC and BHT at different mass concentrations.
After depolymerization of PPC by Pd/C-SO3H to produce OPC, the antioxidant capacity is greatly enhanced, and OPC can be used as a novel chain-breaking antioxidant.
ABTS˙+ scavenging capacity
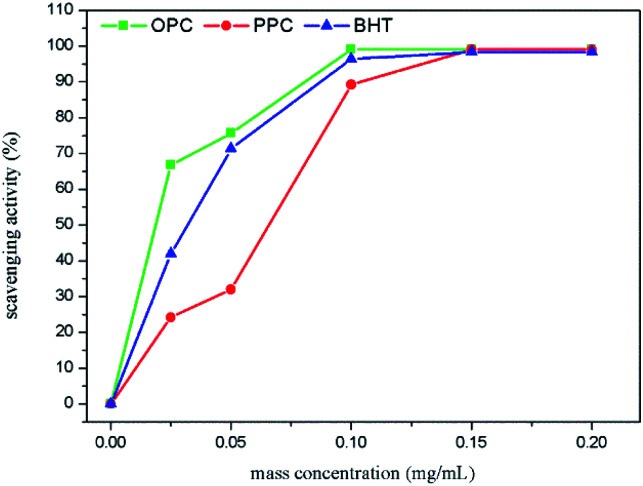
The capacity to remove ABTS˙+ is commonly used to measure total antioxidant capacity. The underlying principle of the assay is that ABTS undergoes oxidation to produce blue-green ABTS˙+, which has a maximum absorption peak at 734 nm. The presence of antioxidants removes the newly formed ABTS˙+, resulting in a lower concentration of ABTS˙+ and a decrease in absorbance. The ability of an antioxidant to clear ABTS˙+ can, therefore, be determined by the change in absorbance at 734 nm; the stronger the clearance, the greater the total antioxidant capacity.43 Over the mass concentration range 0.025–0.20 mg mL−1, the clearance rates of OPC, PPC and BHT increased with increasing concentration (Fig. 11). When the concentration exceeded 0.10 mg mL−1, the curves were shallow, ABTS˙+ radical scavenging had reached saturation and the clearance rate of ABTS˙+ was close to 100%. At concentrations less than 0.10 mg mL−1, the order of ABTS˙+ clearing ability was: OPC > BHT > PPC. The molecular weight of OPC is smaller than that of PPC and the phenolic hydroxyl groups in the A- and B-rings of OPC are more reactive than those of PPC. OPC thus react more readily with ABTS˙+ free radicals and the scavenging rate is higher. Notably, OPC have better antioxidant activity than BHT.
Fig. 11. ABTS˙+ scavenging capacity of OPC, PPC and BHT at different mass concentrations.
Conclusions
A composite catalyst, Pd/C-SO3H, was prepared and used to catalyze the depolymerization of larch bark PPC. The average degree of polymerization of the proanthocyanidins before and after depolymerization was determined by 1H NMR spectroscopy. Both catalyst and depolymerization products (OPC) were characterized, and the antioxidant activity of the OPC was determined. Our results can be summarized as follows:
(1) XRD, BET, SEM and TG analyses showed the presence of Pd metal on the surface of the carbon-based solid acid C-SO3H, indicating that the composite catalyst Pd/C-SO3H had been successfully prepared. Pd/C-SO3H was shown to have good thermal stability, cycle stability and acid–base stability.
(2) Pd/C-SO3H is an effective catalyst for depolymerization of PPC. Under optimized reaction conditions (temperature, 220 °C; time, 2 h; H2 pressure, 5 MPa; stirring speed, 500 rpm) the average degree of polymerization of the proanthocyanidins was reduced from 7.60 to 3.14, with a depolymerization yield of 55.58%.
(3) UV and FTIR analyses showed that Pd/C-SO3H catalyzed depolymerization of PPC mainly breaks the C4–A8 bond in the proanthocyanidin molecules and does not destroy the basic proanthocyanidin structural units. The depolymerized OPC retain a condensed flavanol polyphenol structure, with catechin or epicatechin as the basic structural units.
(4) The depolymerized OPC have better antioxidant properties than the PPC. OPC have less steric hindrance and more reactive phenolic hydroxyl groups than PPC, resulting in higher antioxidant capacity at the same concentration. Notably, OPC have higher antioxidant activity than the commonly used antioxidant BHT, which means that OPC can be used as novel radical chain-breaking antioxidants.
In summary, Pd/C-SO3H was shown to efficiently catalyze the depolymerization of PPC. The well-developed pore structure of the carbon-based solid acid C-SO3H allows better dispersion of Pd metal and increases the catalytic activity. Both Pd and –SO3H groups participate in the depolymerization reaction, thereby increasing the depolymerization yield and reducing the average degree of polymerization of the products. This study provides a new concept and method for the high value utilization of proanthocyanidins and also provides a new route for the development and utilization of new catalysts, with high practical value and prospects for application in a variety of fields.
Experimental
Materials and reagents
Larch bark was obtained from Inner Mongolia and crushed to a particle size of 0.5–1.0 mm. Hainan coconut shell activated carbon was pulverized to a particle size of 0.1–0.5 mm. Distilled water, 1,1-diphenyl-2-trinitrophenylhydrazine (DPPH˙), 2,2′-diazo-bis-3-ethylbenzothiazoline-6-sulfonic acid (ABTS), 2,6-di-tert-butyl-4-methyl phenol (BHT), palladium chloride, ruthenium chloride, ferric chloride, sodium hydroxide, sodium chloride, silver nitrate, potassium ferricyanide, potassium persulfate, sodium dihydrogen phosphate, disodium hydrogen phosphate, phenolphthalein, anhydrous ethanol, petroleum ether, ethyl acetate, trichloroacetic acid, formaldehyde, concentrated sulfuric acid and concentrated hydrochloric acid were all analytical grade.
Extraction of PPC
Crushed larch bark (80 g) and aqueous ethanol (70% v/v, 800 mL) were refluxed in a water bath at 80 °C for 180 min and the mixture was then filtered.14,15 The filter cake was refluxed with aqueous ethanol (70% v/v, 540 mL) for 60 min and then filtered. The combined filtrates were treated with an equal volume of petroleum ether (boiling range 60–90 °C) to precipitate impurities, such as resin and gum. After removal of insoluble material, the organic solvents were evaporated at 45 ± 5 °C under reduced pressure using a rotary evaporator (RE-52AA, Shanghai Yarong Biochemical Instrument Factory, Shanghai, China), and insoluble red matter was removed by filtration. The remaining aqueous solution was extracted six times with equal volumes of ethyl acetate until the ethyl acetate layer was colorless. The resulting aqueous solution was vacuum dried (DZF6210, Shanghai Yiheng Scientific Instrument Co., Ltd., Shanghai, China) at 50 ± 2 °C to provide PPC.
Preparation of catalyst
Preparation of C-SO3H
Activated carbon (16.0 g) was added to 98% sulfuric acid (320 mL) in a hydrothermal reaction kettle and the mixture was heated to 150 °C for 6 h. After cooling, the mixture was diluted with distilled water and filtered. The resulting solid was washed with deionized water at 90 °C until SO42− was not detected and then dried at 110 °C for 12 h to provide carbon-based solid acid C-SO3H.16–18
Preparation of Pd/C-SO3H catalyst
A mixture of PdCl2 (0.5 g), distilled water (15 mL) and concentrated hydrochloric acid (3 mL) was heated until the solid had completely dissolved. C-SO3H (6.0 g) and distilled water (40 mL) were placed in a 200 mL three-necked flask and stirred continuously at 80 °C during the dropwise addition of the solution of PdCl2 in hydrochloric acid. After stirring at 90 °C for 1 h, the pH of the mixture was adjusted to 10 with 10% NaOH solution, using an EL20 pH meter (Mettler-Toledo Instruments Shanghai Co., Ltd., Shanghai, China), and then aged for 12 h.19,20 Formaldehyde (10 mL) was then added dropwise to the mixture over 30 min. The resulting black solid was filtered, washed with distilled water until free of Cl−, and dried at 110 °C for 4 h to provide the Pd/C-SO3H catalyst.
Pd/C-SO3H-catalyzed depolymerization of PPC
Different reaction conditions were investigated using the following general procedure. An accurately weighed quantity of PPC (1.5 g) were dissolved in aqueous ethanol (70% v/v, 100 mL) and an accurately weighed portion of Pd/C-SO3H was added. The reaction mixture was placed in a GCF-1 type high-pressure reaction kettle (Dalian Automatic Control Equipment Factory, Dalian, China) and stirred at 500 rpm under an atmosphere of hydrogen at the temperature under investigation for the required length of time.21 The reaction mixture was then filtered through a 0.45 μm filter membrane to remove the catalyst. The filtrate was extracted with equal volumes of ethyl acetate until colorless22 and then evaporated under vacuum at 50 ± 2 °C to provide OPC.
Structural characterization of the catalyst
Determination of total acid group density on surface of C-SO3H
An accurately weighed portion (0.1 g) of C-SO3H was placed in a conical flask with 2 M aqueous NaCl (15 mL) and shaken for 30 min so that H+ ions in the C-SO3H were completely exchanged by Na+ ions. The solid was then removed by filtration. The filtrate was titrated at room temperature using 0.02 M NaOH as the standard solution and phenolphthalein as the indicator.23 The total acid group density d(H+) of the C-SO3H surface was calculated using formula (1):
 |
1 |
where d(H+) is the total acid group density of the C-SO3H surface (mmol g−1); CNaOH is the concentration of NaOH standard solution (M); VNaOH is the volume of consumed NaOH (L); m is the dry weight of C-SO3H (g).
Characterization using X-ray diffractometry
XRD patterns of Pd/C-SO3H and C-SO3H were recorded using a D/max-2200VPC X-ray diffractometer (Shimadzu Corporation, Japan). The source of radiation was Cu Kα, the tube pressure was 40 kV, the tube flow was 40 mA, the scanning range was 10–80°, the scanning rate was 6° min−1 and the step was 0.02°.
Brunauer–Emmett–Teller analysis
The specific surface area and micropore area of Pd/C-SO3H and C-SO3H were measured using an ASAP 2020 physical adsorption analyzer (Micromeritics Instrument Corp., Norcross, GA, USA).
Characterization by scanning electron microscopy
SEM and energy spectra of Pd/C-SO3H and C-SO3H were recorded using a Quanta 200 scanning electron microscope (FEI Europe B.V., Eindhoven, Netherlands).
Determination of catalyst stability
Determination of thermal stability by thermogravimetric analysis
TG analyses of Pd/C-SO3H and C-SO3H were carried out using a Pyris1 thermogravimetric analyzer (PerkinElmer Inc., Waltham, MA, USA). The temperature range was 30–500 °C and the heating rate was 10 °C min−1.
Determination of recycling stability
The Pd/C-SO3H catalyst was used to depolymerize PCCs three times under the same experimental conditions and the cycle stability of the catalyst was determined by comparing the average degree of polymerization of the product OPC.
Determination of acid–base stability
The catalytic efficiency of Pd/C-SO3H was measured at different pH values, whilst keeping other reaction conditions the same. Three experiments were carried out. In the first experiment, the pH of the solution of PCCs was not adjusted after addition of the catalyst; in the second experiment, the pH of the solution was adjusted to 2–3 using 5% aqueous HCl; in the third experiment, the pH of the solution was adjusted to 10–11 using 5% aqueous NaOH. The acid–base stability of the catalyst was determined by comparing the average degree of polymerization of the product OPC.
Characterization of proanthocyanidins
Determination of average degree of polymerization and degradation yield
A sample of proanthocyanidins (20 mg) was dissolved in DMSO-d6 (0.5 mL) and the 1H-NMR spectrum was recorded using an AVANCE III HD 500 MHz spectrometer (Bruker Scientific Instruments, Germany), with a 5 mm BBO probe. The frequency was 500.192 MHz, the spectral width was 12 335.5 Hz, the pulse width was 13 μs, the sampling time was 17 s, the delay time was 6 s, and the number of scans was 16. The average degree of polymerization24,25 of the sample was calculated using formula (2):
| N = 2 × (A8/Ae)−1 | 2 |
where N is the average degree of polymerization of the sample, A8 is the total peak area of the C8 hydrogen of the A ring in the proanthocyanidin molecule (δ = 5.8–6.5) and Ae is the total peak area of the C4 hydrogen of the C ring of the proanthocyanidin molecule terminal epicatechin unit (δ = 2.5–3.0).
The depolymerization yield was calculated using formula (3):
 |
3 |
where m1 is the mass of PPC before depolymerization (g) and m2 is the mass of OPC after depolymerization (g).
Spectral analysis
UV spectra of PPC, OPC and catechin were recorded over the range 200–800 nm using a TU-1950 dual-beam UV-Vis spectrophotometer (Beijing Pu's General Instrument Co., Ltd., Beijing, China). Sample solutions (40 μg mL−1) were prepared using aqueous ethanol (70% v/v) and aqueous ethanol (70% v/v) was used as the blank control.
Infrared spectra of PPC, OPC and catechin were recorded over the wave number range 4000–400 cm−1, at a resolution of 2 cm−1 with 16 scans, using an FTIR-650 Fourier infrared spectrometer (Tianjin Gangdong Technology Development Co., Ltd., Tianjin, China). Samples (2 mg) were ground thoroughly with IR grade KBr (100 mg) under infrared light and compressed into discs for spectral analysis.
Inductively coupled plasma mass spectrometry
PPC (250 mg) and nitric acid (3 mL) were placed in the inner tank of a pressure digester, covered and allowed to stand overnight. The stainless steel jacket was put in place, and the digester was placed in a constant temperature oven. Digestion was carried out at 80 °C for 2 h, at 120 °C for 2 h and at 160 °C for 2 h, until the solution was clear and transparent. After cooling, the reaction mixture was removed from the digester and heated on a hotplate at 100 °C for 30 min. The sample was then diluted to 10 mL with pure water, to provide a blank test solution.
The amount of Pd in the OPC was measured using a NexION 350D inductively coupled plasma mass spectrometer (Thermo Fisher Scientific, USA), with the following test conditions: RF power, 1600 W; plasma gas flow rate, 18.00 L min−1; auxiliary gas flow rate, 1.20 L min−1; nebulizer flow rate; 0.92 mL min−1; sample cone, 1.1 mm; intercepting cone, 0.8 mm; resolution, 0.6–0.7 amu (10% peak height); data acquisition mode, jump peak; analysis time, 3 min; number of measurements, 3.
Determination of antioxidant properties of proanthocyanidins
Solutions of OPC or PPC (0.025, 0.05, 0.10, 0.15 and 0.20 mg mL−1) in aqueous ethanol (70% v/v) were used to determine the antioxidant properties of the proanthocyanidins.
Determination of reducing ability of proanthocyanidins
Aliquots (1 mL) of OPC or PPC solutions with different mass concentrations were placed in centrifuge tubes and thoroughly mixed at 50 °C with phosphate buffer (0.2 M, 2.5 mL, pH 6.6) and potassium ferricyanide solution (1% w/v, 2.5 mL). Reactions were carried out in a water bath at 50 °C for 20 min and trichloroacetic acid solution (10% w/v, 2.5 mL) was then added. The mixtures were centrifuged at 3000 rpm for 10 min and aliquots (2.5 mL) of the supernatants were transferred by pipette into darkened tubes. Distilled water (2.5 mL) and ferric chloride solution (1% w/v, 1 mL) were added and, after standing for 10 min, the absorbance was measured at 700 nm using a UV-Vis spectrophotometer.26,27
The reducing ability of BHT, measured as described above, was compared with that of the PPC and OPC.
Determination of DPPH˙ scavenging ability of proanthocyanidins
An accurately weighed sample of DPPH˙ (20 mg) was diluted with absolute ethanol to 500 mL in a volumetric flask to prepare a DPPH˙ solution with a concentration of 0.04 mg mL−1. The solution was stored at 0–4 °C in the dark before use. Aliquots (0.25 mL) of OPC or PPC solutions with different mass concentrations were pipetted into darkened test tubes and mixed thoroughly with DPPH˙ solution (4.75 mL). After standing in the dark for 30 min, the absorbance was measured at 517 nm using a UV-Vis spectrophotometer.28,29 Aqueous ethanol (70% v/v) was used as the control. The DPPH˙ scavenging ability was calculated using formula (4):
 |
4 |
where A0 is the absorbance of the control at a wavelength of 517 nm and A1 is the absorbance of the sample solution at a wavelength of 517 nm.
The DPPH˙ scavenging ability of BHT, measured as described above, was compared with that of the PPC and OPC.
Determination of ABTS˙+ scavenging ability of proanthocyanidins
An accurately weighed sample (38.5 mg) of ABTS in distilled water (10 mL) was treated with an accurately weighed sample (6.6 mg) of potassium persulfate and the mixture was allowed to stand at 30 °C for 12 h in the dark to form a blue-green solution of ABTS˙+. The ABTS˙+ solution was diluted with phosphate buffer (pH = 6.6) until its absorbance reached 0.70 ± 0.02 at a wavelength of 734 nm. Scavenging activity was measured by thoroughly mixing aliquots (0.25 mL) of different concentration OPC or PPC solutions with ABTS˙+ solution (4.7 mL) in darkened test tubes, allowing the mixtures to stand in the dark for 6 min and then measuring absorbance at 734 nm using a UV-Vis spectrophotometer.30,31 Aqueous ethanol (70% v/v) was used as the control. ABTS˙+ scavenging ability was calculated using formula (5):
 |
5 |
where A0 is the absorbance of the control solution at a wavelength of 734 nm and A1 is the absorbance of the sample solution at a wavelength of 734 nm.
The ABTS˙+ scavenging ability of BHT, measured as described above, was compared with that of the PPC and OPC.
Conflicts of interest
There are no conflicts to declare.
Supplementary Material
Acknowledgments
This work was supported by the National Key Technology R&D Program of the Thirteenth Five-year Plan Period (Grant No. 2016YFD0600806) and the Natural Science Foundation of Heilongjiang Province of China (Grant No. LH2019C009).
Notes and references
- Zhang A. Li J. Zhang S. Mu Y. Zhang W. Li J. RSC Adv. 2017;7:35135–35146. doi: 10.1039/C7RA03410E. [DOI] [Google Scholar]
- Jing S. Cao X. Zhon L. Peng X. Sun R. Liu J. Ind. Crops Prod. 2018;126:151–157. doi: 10.1016/j.indcrop.2018.10.028. [DOI] [Google Scholar]
- Vidal C. M. Zhu W. Manohar S. Aydin B. Keiderling T. A. Messersmith P. B. Bedran-Russo A. K. Acta Biomater. 2016;41:110–118. doi: 10.1016/j.actbio.2016.05.026. [DOI] [PMC free article] [PubMed] [Google Scholar]
- Longo E. Rossetti F. Merkyte V. Boselli E. J. Am. Soc. Mass Spectrom. 2018;29:2268–2277. doi: 10.1007/s13361-018-2044-5. [DOI] [PubMed] [Google Scholar]
- Ishida Y. Takeshita M. Kataoka H. World J. Hepatol. 2014;6:870–879. doi: 10.4254/wjh.v6.i12.870. [DOI] [PMC free article] [PubMed] [Google Scholar]
- Ni L. Zhao F. Li B. Wei T. Guan H. Ren S. Molecules. 2018;23:2445. doi: 10.3390/molecules23102445. [DOI] [PMC free article] [PubMed] [Google Scholar]
- Luo L. Cui Y. Cheng J. Fang B. Wei Z. Sun B. Food Chem. 2018;256:203–211. doi: 10.1016/j.foodchem.2018.02.097. [DOI] [PubMed] [Google Scholar]
- Zhong R. Sels B. F. Appl. Catal., B. 2018;236:518–545. doi: 10.1016/j.apcatb.2018.05.012. [DOI] [Google Scholar]
- Liu T. Li Z. Li W. Shi C. Wang Y. Bioresour. Technol. 2013;133:618–621. doi: 10.1016/j.biortech.2013.01.163. [DOI] [PubMed] [Google Scholar]
- Piscopo C. G. ChemistryOpen. 2015;4:383–388. doi: 10.1002/open.201402148. [DOI] [PMC free article] [PubMed] [Google Scholar]
- Yang S. Jeong S. Ban C. Kim H. Kim D. H. Catalysts. 2019;9:158. doi: 10.3390/catal9020158. [DOI] [Google Scholar]
- Bin Z. Xueshan C. Jiaojiao X. Cunshan Z. J. Chem. 2018;2018:1–9. doi: 10.1155/2018/2018743. [DOI] [Google Scholar]
- Li Z. Zeng J. Tong Z. Qi Y. Gu L. Food Chem. 2015;188:337–342. doi: 10.1016/j.foodchem.2015.05.021. [DOI] [PubMed] [Google Scholar]
- Bosso A. Guaita M. Petrozziello M. Food Chem. 2016;207:162–169. doi: 10.1016/j.foodchem.2016.03.084. [DOI] [PubMed] [Google Scholar]
- Qu W. Shi S. Li P. Pan Z. Venkitasamy C. Int. J. Food Eng. 2014;10:683–695. [Google Scholar]
- Peng L. Philippaerts A. Ke X. Van Noyen J. De Clippel F. Van Tendeloo G. Jacobs P. A. Sels B. F. Catal. Today. 2010;150:140–146. doi: 10.1016/j.cattod.2009.07.066. [DOI] [Google Scholar]
- Dehkhoda A. M. West A. H. Ellis N. Appl. Catal., A. 2010;382:197–204. doi: 10.1016/j.apcata.2010.04.051. [DOI] [Google Scholar]
- Mo X. Lopez D. Suwannakarn K. Liu Y. Lotero E. Goodwinjr J. Lu C. J. Catal. 2008;254:332–338. doi: 10.1016/j.jcat.2008.01.011. [DOI] [Google Scholar]
- Liang Y. Zhu M. Ma J. Tang Y. Chen Y. Lu T. Electrochim. Acta. 2011;56:4696–4702. doi: 10.1016/j.electacta.2011.03.019. [DOI] [Google Scholar]
- Zhu Y. Kang Y. Zou Z. Zhou Q. Zheng J. Xia B. Yang H. Electrochem. Commun. 2008;10:802–805. doi: 10.1016/j.elecom.2008.02.038. [DOI] [Google Scholar]
- Shu R. Long J. Xu Y. Ma L. Zhang Q. Wang T. Wang C. Yuan Z. Wu Q. Bioresour. Technol. 2016;200:14–22. doi: 10.1016/j.biortech.2015.09.112. [DOI] [PubMed] [Google Scholar]
- Huang J. Zhao C. Lu F. Polymers. 2018;10:1077. doi: 10.3390/polym10101077. [DOI] [PMC free article] [PubMed] [Google Scholar]
- Frini-Srasra N. Srasra E. Surf. Eng. Appl. Electrochem. 2008;44:401–409. doi: 10.3103/S1068375508050116. [DOI] [Google Scholar]
- Locock K. E. Meagher L. Haeussler M. Anal. Chem. 2014;86:2131–2137. doi: 10.1021/ac403735n. [DOI] [PubMed] [Google Scholar]
- Melone F. Saladino R. Lange H. Crestini C. J. Agric. Food Chem. 2013;61:9316–9324. doi: 10.1021/jf401664a. [DOI] [PubMed] [Google Scholar]
- Cho M. Ko S.-B. Kim J.-M. Lee O.-H. Lee D.-W. Kim J.-Y. Appl. Biol. Chem. 2016;59:329–336. doi: 10.1007/s13765-016-0165-8. [DOI] [Google Scholar]
- Jing Y. Huang J. Yu X. Carbohydr. Polym. 2018;194:139–145. doi: 10.1016/j.carbpol.2018.04.037. [DOI] [PubMed] [Google Scholar]
- Waqas M. K. Khan B. A. Akhtar N. Chowdhry F. Khan H. Bakhsh S. Khan S. Rasul A. Postępy Dermatologii i Alergologii. 2017;34:339–345. doi: 10.5114/ada.2017.69314. [DOI] [PMC free article] [PubMed] [Google Scholar]
- Oldoni T. L. Melo P. S. Massarioli A. P. Moreno I. A. Bezerra R. M. Rosalen P. L. da Silva G. V. Nascimento A. M. Alencar S. M. Food Chem. 2016;192:306–312. doi: 10.1016/j.foodchem.2015.07.004. [DOI] [PubMed] [Google Scholar]
- Todorovic V. Redovnikovic I. R. Todorovic Z. Jankovic G. Dodevska M. Sobajic S. J. Food Compos. Anal. 2015;41:137–143. doi: 10.1016/j.jfca.2015.01.018. [DOI] [Google Scholar]
- Abeywickrama G. Debnath S. C. Ambigaipalan P. Shahidi F. J. Agric. Food Chem. 2016;64:9342–9351. doi: 10.1021/acs.jafc.6b04291. [DOI] [PubMed] [Google Scholar]
- Kawakami W. Oshima A. Yanase E. Food Chem. 2018;239:1110–1116. doi: 10.1016/j.foodchem.2017.07.001. [DOI] [PubMed] [Google Scholar]
- Jiang X. Liu Y. Wu Y. Tan H. Meng F. Wang Y. S. Li M. Zhao L. Liu L. Qian Y. Gao L. Xia T. Sci. Rep. 2015;5:8742. doi: 10.1038/srep08742. [DOI] [PMC free article] [PubMed] [Google Scholar]
- Zhu Q. C. Shen B. X. Ling H. Gu R. J. Hazard. Mater. 2010;175:646–650. doi: 10.1016/j.jhazmat.2009.10.057. [DOI] [PubMed] [Google Scholar]
- Jadhav S. N. Kumbhar A. S. Rode C. V. Salunkhe R. S. Green Chem. 2016;18:1898–1911. doi: 10.1039/C5GC02314A. [DOI] [Google Scholar]
- Osman A. M. Wong K. K. Y. Fernyhough A. Enzyme Microb. Technol. 2007;40:1272–1279. doi: 10.1016/j.enzmictec.2006.09.018. [DOI] [Google Scholar]
- Grigsby W. J. Prog. Org. Coat. 2017;110:55–61. doi: 10.1016/j.porgcoat.2017.03.007. [DOI] [Google Scholar]
- Biao L. Tan S. Meng Q. Gao J. Zhang X. Liu Z. Fu Y. Nanomaterials. 2018;8:53. doi: 10.3390/nano8010053. [DOI] [PMC free article] [PubMed] [Google Scholar]
- Esatbeyoglu T. Jaschok-Kentner B. Wray V. Winterhalter P. J. Agric. Food Chem. 2011;59:62–69. doi: 10.1021/jf1032334. [DOI] [PubMed] [Google Scholar]
- Okeleye B. I. Nongogo V. Mkwetshana N. T. Ndip R. N. Afr. J. Tradit., Complementary Altern. Med. 2015;12:1. doi: 10.4314/ajtcam.v12i1.1. [DOI] [Google Scholar]
- Boudier A. Tournebize J. Bartosz G. El Hani S. Bengueddour R. Sapin-Minet A. Leroy P. Anal. Chim. Acta. 2012;711:97–106. doi: 10.1016/j.aca.2011.10.063. [DOI] [PubMed] [Google Scholar]
- Viglianisi C. Menichetti S. Morelli P. Baschieri A. Amorati R. Heteroat. Chem. 2018;29:e21466. doi: 10.1002/hc.21466. [DOI] [Google Scholar]
- Floegel A. Kim D.-O. Chung S.-J. Koo S. I. Chun O. K. J. Food Compos. Anal. 2011;24:1043–1048. doi: 10.1016/j.jfca.2011.01.008. [DOI] [Google Scholar]


