Abstract
The trigonal lithium niobate crystal (LiNbO3, LN) is a multi-functional material that possesses excellent nonlinear optical, pyroelectric and piezoelectric properties. In this work, the irradiation damage mechanism and stability of the electro-elastic properties of LN crystals irradiated with different doses (1013–1016 ions per cm2) of 6 MeV Xe23+ ions were evaluated for potential piezoelectric applications under irradiation conditions below 650 °C. The vacancy formation energies for Li, O, and Nb atoms are much lower than the irradiation energy of 6 MeV, with the lowest vacancy formation energy being obtained for Li, so that a high concentration of vacancies will be generated in LN upon irradiation. The vacancies narrow the band gap and decrease the electrical resistivity after irradiation. In contrast to the electrical resistivity, the relative dielectric permittivity of the LN crystal was found to increase with increasing irradiation dose, due to the weakened chemical bonds and distorted crystal structure, as confirmed by X-ray photoelectron spectroscopy. Despite the irradiation, the effective piezoelectric coefficients of bulk LN crystal remain nearly unchanged, indicating the favorable properties of LN for use under irradiation conditions at temperatures up to 650 °C.
Bulk LiNbO3 (LN) crystals could maintain their electrical and electro-elastic properties even under hard irradiation.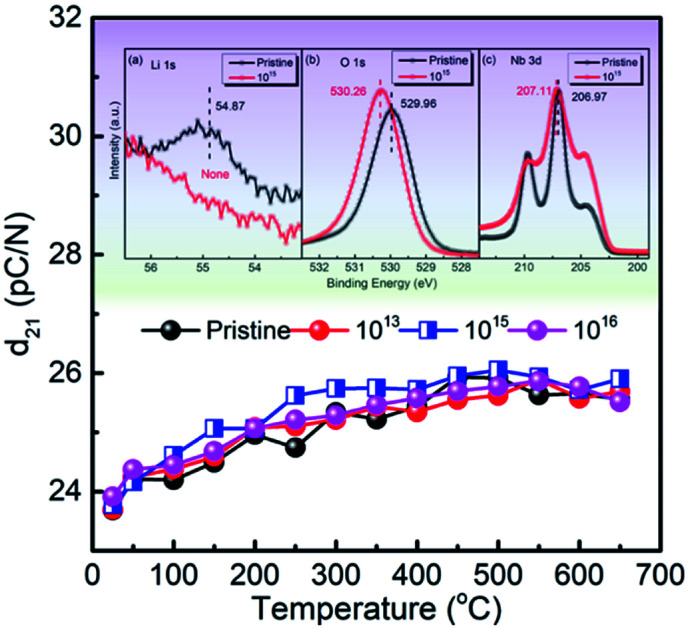
1. Introduction
High-temperature piezoelectric single crystals are required for sensors under critical conditions found in nuclear power plants, and in automotive, aeronautic and space applications. For example, the piezoelectric vibration sensors used in nuclear power plants usually endure irradiation and high temperatures above 400 °C. To satisfy the requirements of these applications, piezoelectric materials must show low dielectric loss and high resistivity as well as high piezoelectric performance with good temperature stability.1,2
Trigonal lithium niobate crystals (LiNbO3, LN) have excellent optical and electrical properties such as the optical waveguiding, photo-refractivity, pyroelectricity, optical storage, and piezoelectric properties etc.3–9 The high ferroelectric-to-paraelectric phase transmission temperature of LN (∼1195 ± 15 °C) enables the operation of LN-based devices at temperatures above 600 °C.7,10 Moreover, the effective piezoelectric coefficient deff of LN is on the order of 70 pC N−1, thirty times higher than that of α-quartz (α-SiO2) (∼2 pC N−1), favoring the use of LN crystal for piezoelectric sensing at high temperatures.11–14
There are many reports on the irradiation damage for LN crystal such as the damage evolution in LN irradiated by Si ions,15 high-energy electron irradiation of stoichiometric LN,16 optical damage in LN induced by X-ray irradiation,17et al. And the extensive testing of different prototypes of piezoelectric sensors based on the LN crystal have been investigated.14,18–21 Irradiation is known to induce defects in crystals, affecting their electrical properties.22–25 However, there have been few reports on the stability of the electrical and piezoelectric properties of LN crystal as well as the relations between irradiation damage and variations of electro-elastic properties under the influence of intense ion irradiation. Therefore, in this work, the irradiation influencing mechanism and stabilities of the electro-elastic properties of an LN crystal irradiated by different does (1013, 1015, and 1016 ions per cm2) of 6 MeV Xe23+ ions were investigated to evaluate the potential use of LN piezoelectric crystal in irradiation conditions in nuclear power industry. Theoretical analysis, stopping and range of ions in matter (SRIM) simulations, and electron paramagnetic resonance (EPR) and X-ray photoelectron spectroscopy (XPS) measurements combined with first-principle calculations were used for this purpose in the present study.
2. Experimental
2.1. Sample preparation
The congruent composition of LN crystal was grown by the classical Czochralski method.26,27 The raw materials for single crystal growth were prepared with stoichiometric ratio. The pulling and rotation rates were 0.6–0.9 mm h−1 and 6–8 rpm, respectively. The Li/Nb ratio of the grown LN crystal was 48.6/51.4.
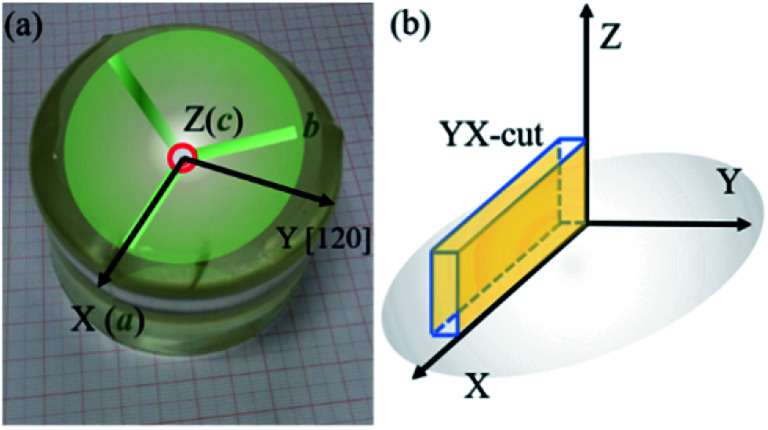
Fig. 1(a) shows the picture of grown LN crystal and the schematic of the cross-section of LN crystal with the relationship between the crystallographic and physical axes determined referring to the IEEE standard on piezoelectricity.28 The rectangular plate-shaped YX-cuts (Fig. 1(b)) with dimension of 12 × 3 × 1.2 mm3 were orientated and prepared for tests.
Fig. 1. The picture of LN crystal and the relationship between the crystallographic (a, b, c) and physical axes (X, Y, Z) (a), the orientations of YX-cut in physical coordinate (b).
2.2. The evaluation of electro-elastic constants
Rectangular YX-cut plate-shaped (15 × 3 × 1.2 mm3) samples were prepared and divided into four groups, with the first three bombarded by Xe23+ ions with the doses of 1013, 1015, and 1016 ions per cm2, respectively, while the last one was not irradiated and was used for comparison.
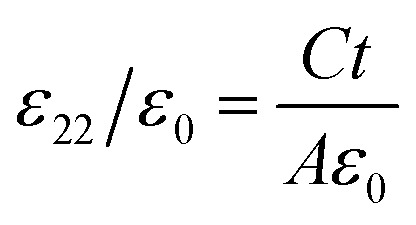
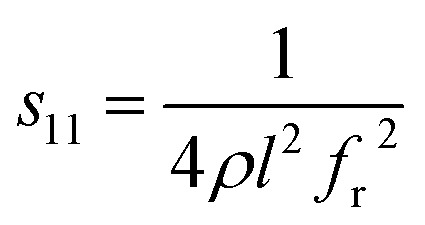
The electrical resistivities ρ22 were obtained by measuring the resistances of the samples using a source meter (Keithley 2410C). To study the electro-elastic properties in the temperature range from room temperature to 650 °C, the capacitances (measured at 100 kHz), and the resonance (fr) and anti-resonance (fa) frequencies at different temperatures were measured using a multi-frequency LCR meter (Agilent 4263B, USA) and an impedance-phase gain analyser (Keysight E4990A) connected to a custom high-temperature furnace. The relative dielectric permittivity was evaluated according to eqn (1), where C, A, t and ε0 are the capacitance, electrode area, thickness and dielectric permittivity in vacuum, respectively. The electromechanical coupling factor k21 and elastic compliance s11 as well as the piezoelectric coefficient d21 of the YX-cut samples were calculated by eqn (2)–(4) using the impedance method, where the l, ρ, fr and fa are the sample length, crystal density, and resonance and anti-resonance frequencies, respectively.
 |
1 |
 |
2 |
 |
3 |
 |
4 |
2.3. SRIM simulation
The nuclear and electronic energy loss profiles induced by the 6 MeV Xe23+ ions in LN crystal were determined using SRIM 2013 with the full-cascade simulation code in which the density of 4.65 g cm−3 and threshold displacement energies of 25, 25, and 28 eV for Li, Nb, and O sublattices, respectively were used.20
2.4. EPR analysis
The EPR spectra of the YX-cut LN crystal samples were recorded using a Bruker EMP plus EPR spectrometer (300 K, X band). The wavelength of the excitation laser beam was 532 nm, the central magnetic field intensity was on the order of 3500 G with sweep width being 150 G.
2.5. First-principles calculations
Density functional theory (DFT) calculations were performed using the Vienna ab initio Simulation Package29,30 with the Li 2s1, O 2s22p4, and Nb 4d45s1 states treated as the valence electrons. The electronic wave functions were expanded in a plane wave basis set up to the cutoff energy of 300 eV. The local-density approximation in the Ceperley–Alder and Perdew–Zunger form31,32 was used to describe the exchange–correlation potential, and to calculate the vacancy formation energies for atoms in LN.
The oxygen vacancy (VO) model of LN crystal was constructed by removing one O atom from the unit cell. We could get the lithium vacancy (VLi) and niobium vacancy (VNb) models following the same way. The vacancy formation energy could be evaluated using the following equation,33
| EV = ED + μi − Ep | 5 |
where Ep and ED are the total energy of the supercell with and free of the corresponding vacancy, μi is the chemical potential of the corresponding atoms. The chemical potentials of Li, and Nb atoms were calculated by using their corresponding elemental phases. Furthermore, a model structure of oxygen molecular with a dimension of 10 × 10 × 10 Å3 was utilized to calculate the chemical potential of oxygen atom being half of the O2 total energy.
2.6. XPS analysis
The XPS spectra of the pristine and Xe23+-irradiated LN crystals were obtained using an ESCALAB 250 X-ray photoelectron spectrometer (Thermo-Fisher, USA) with monochromatized Al Kα X-ray radiation in ultrahigh vacuum (<10−7 Pa). The obtained binding energies were calibrated by the C 1s peak (284.6 eV) of carbon impurities as the reference, and the spectra were de-convoluted after subtracting the background with a mixed Gaussian–Lorentzian function. All the results were analyzed by using the Advantage software.
3. Results and discussion
3.1. Stabilities of electrical and electro-elastic properties after irradiation
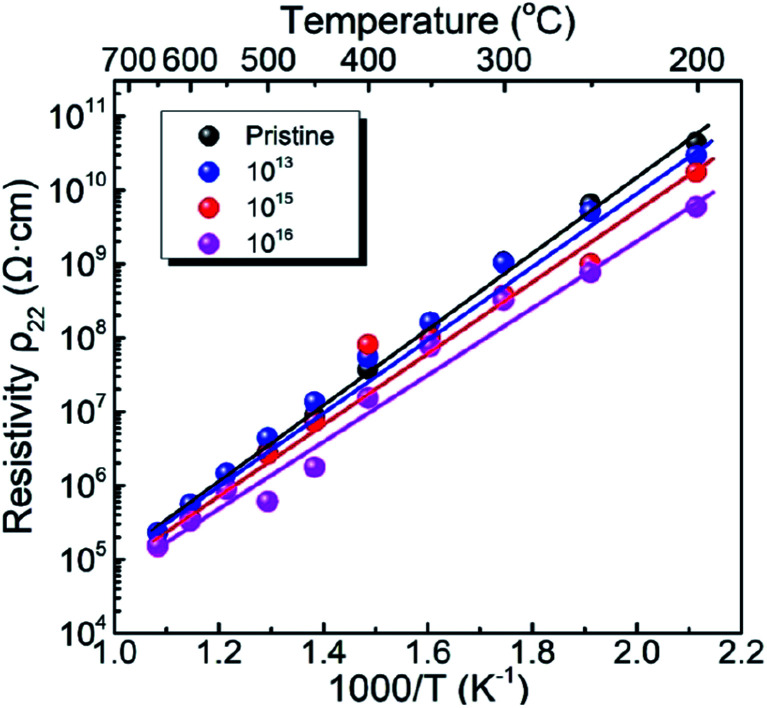
Fig. 2 shows the electrical resistivity plotted as a function of inverse temperature for the pristine LN crystal and for the LN samples irradiated with different doses of Xe23+ (1013, 1015, and 1016 ions per cm2) for the temperature range of 200–650 °C. The electrical resistivity of the LN crystal was 6 × 10⁹ Ω cm at 200 °C after irradiation with a dose of 1016 ions per cm2, decreasing by approximately one order of magnitude compared to the pristine sample (4.4 × 10¹⁰ Ω cm). It was also found that at 650 °C, the electrical resistivities of the LN samples both before and after irradiation were ∼1.5 × 10⁵ Ω cm since the electrical conduction at elevated temperature is attributed to the intrinsic band gap of crystal material rather than the defects induced by the irradiation,15 indicating that the Xe23+ irradiation has little influence on the high-temperature electrical resistivity of the LN crystal. Considering the main contribution of electrons to electrical conductivity, the activation energy for motivating the electrons to participant electrical conductivity was calculated using the Arrhenius law (eqn (6)),
| ρ = Ae−Ea/KT | 6 |
where Ea, A, T, and K are the activation energy, pre-exponential factor, absolute temperature, and the molar gas constant, respectively. The calculated activation energies of the pristine sample and the samples irradiated with the irradiation doses of 1013, 1015, and 1016 ions per cm2 were 0.972, 0.968, 0.949, and 0.883 eV, respectively. It is clear the activation energy decreases with irradiation dose increasing. This phenomenon might be related to the variation of defect levels induced by the 6 MeV Xe23+ irradiation, which decreases the energy needed for the electron to be motivated into the conduction bands.24
Fig. 2. Variation of electrical resistivity as a function of temperature for the pristine LN sample and the LN samples irradiated with the doses of 1013, 1015, and 1016 ions per cm2.
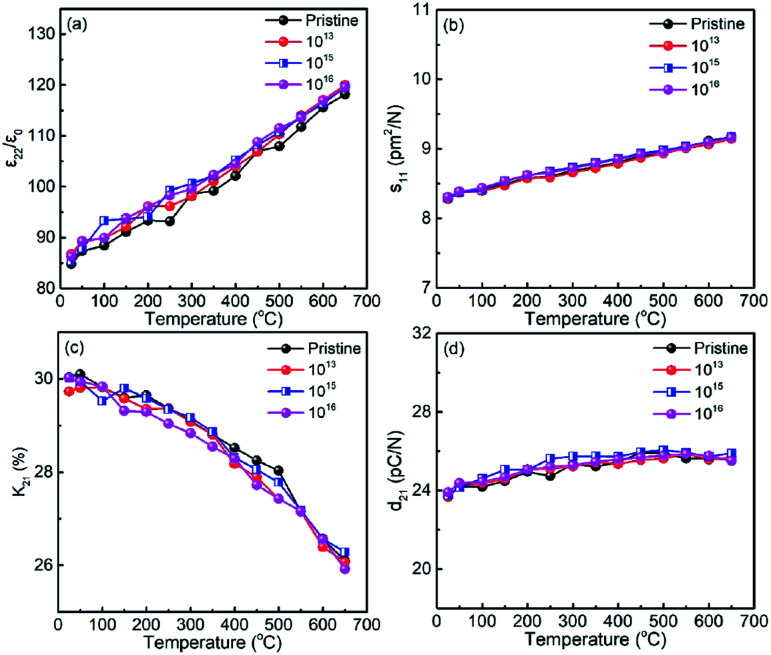
Fig. 3(a–d) show the relative dielectric permittivity (ε22/ε0), elastic compliance (s11), electromechanical coupling factor (k21), and piezoelectric coefficient (d21) plotted as a function of temperature for the pristine sample and for the samples irradiated with different doses. It was observed that ε22/ε0 at room temperature shows a slight increase with increasing irradiation dose (Fig. 2(a)). The ε22/ε0 value of the pristine LN sample is ∼84 at room temperature, and increases slightly to 86 after irradiation with the dose of 1016 ions per cm2, obtaining a change less than 5%. Furthermore, the s11 values of the irradiated samples were found to be the same as the pristine LN crystal (Fig. 2(b)). In contrast to ε22/ε0, k21 was found to decrease slightly with increasing irradiation dose (Fig. 2(c)), contributing to the stability of the d21 value for the irradiated samples according to eqn (4), as shown in Fig. 2(d).
Fig. 3. Variations of electro-elastic constants of pristine and annealed LN samples as a function of temperature (a) relative dielectric permittivity ε22/ε0, (b) elastic compliance s11, (c) electromechanical coupling factor k21, and (d) piezoelectric coefficient d21.
3.2. Irradiation damage analysis
The damage to the LN crystal as well as the nuclear and electronic energy losses induced by 6 MeV Xe23+ irradiation were evaluated. There are two types of stopping mechanisms for the bombardment by heavy ions, namely the nuclear stopping and the electron stopping. The stopping energies of the nuclear and the electronic states are described by eqn (7) and (8),34 respectively,
 |
7 |
| Se(E1) = KE11/2 | 8 |
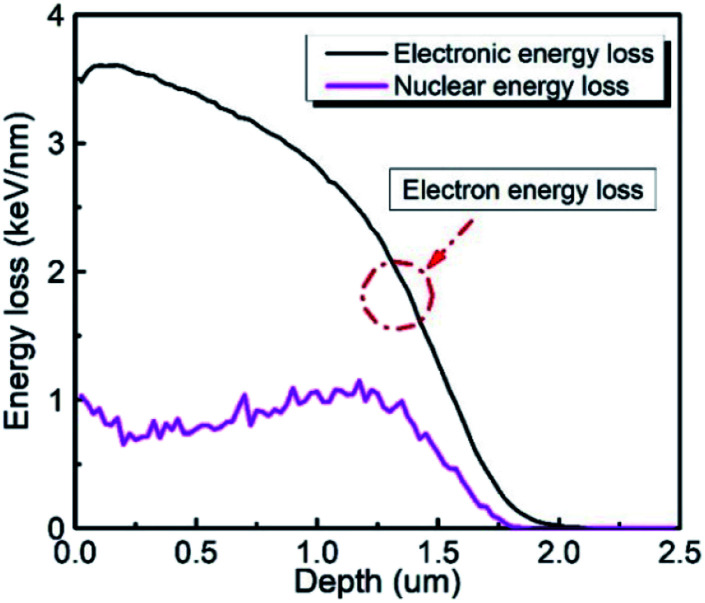
where m1, Z1, and E1 are the mass, atomic number, and energy of the bombarding ion, respectively, and m2 and Z2 are the mass and atomic number of the target material, respectively. K is a constant associated with the interaction between the bombarding ions and the target material. Nuclear plays an important role in stopping bombardment by low-energy ions, while electron stopping is dominant for bombardment by high-energy ions. Hence, the critical threshold energy (Ec) of the bombarding ions was used to evaluate whether the nuclear or electron stopping is the dominant mechanism for preventing the bombardment damage. Here, Ec was calculated to be ∼2.76 × 10⁴ eV based on eqn (7) and (8), which is much smaller than the 6 MeV energy of the ions used in this work, indicating that electronic stopping plays the dominant role in preventing the bombardment-induced damage. This was confirmed by the electron and nuclear energy loss simulation carried out by the SRIM simulation as can be seen in Fig. 4. It is clear the electronic energy loss is much higher than the nuclear energy loss (Fig. 4), indicating that electronic energy loss is dominant when LN is irradiated by the 6 MeV Xe23+.
Fig. 4. Electron energy loss and nuclear energy loss as a function of depth of the LN sample.
The irradiation depth for an LN crystal irradiated by the 6 MeV Xe23+ was evaluated according to eqn (9),
 |
9 |
where N is the number of atoms per cubic centimeter in the target material. The irradiation depth was calculated to be 3.7 μm for the LN crystal bombarded by 6 MeV Xe23+ and is similar to the irradiation depth of ∼2 μm obtained by SRIM simulations. According to both experiments and simulations, it is clear that the irradiation depth is much smaller than the thickness of the tested samples (∼1 mm), indicating that 6 MeV Xe23+ ion bombardment has little influence on the electro-elastic properties of the LN crystal, which contributes to the stable piezoelectric properties of LN crystal when irradiated by the 6 MeV Xe23+. And the Xe23+ irradiation condition only influences on the surface chemical structure of the bulk LN crystal samples.
3.3. EPR and the first principle calculation analysis
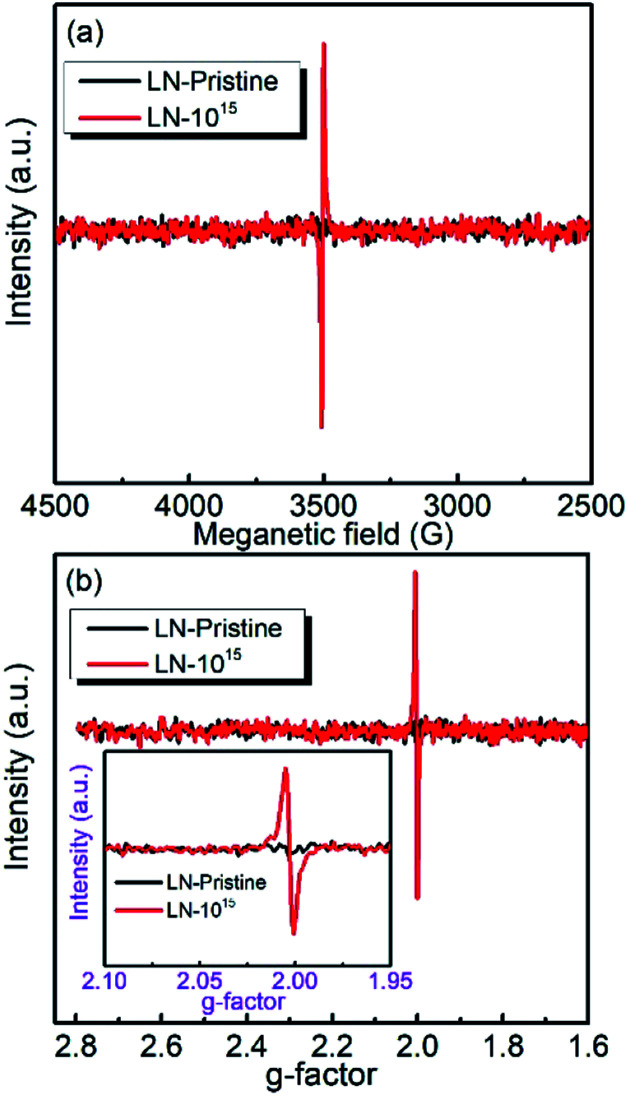
To evaluate the chemical stability of the different atoms in LN crystal, we used DFT calculations to determine the vacancy formation energies of Li, O, and Nb atoms. A higher vacancy formation energy corresponds to higher chemical stability of the atom. The vacancy formation energies of lithium, oxygen, and niobium atoms were calculated to be 5.384, 6.780, and 18.426 eV, respectively. It indicates that under irradiation, a high density of vacancies of all three elements in the LN crystal will be generated because the irradiation energy (6 MeV) is much larger than the vacancy formation energies and the threshold displacement energies being among 25–28 eV20 for all of the atoms. The vacancies provide defect levels in the band gap, decrease the activation energies of carriers for electrical conduction, and reduce the electrical resistivity as well as the activation energy Ea, which is coincided with the electrical resistivity results. DFT calculations also showed that the vacancy formation energy was lowest (5.384 eV) for lithium, indicating that under 6 MeV Xe23+ irradiation, it is easier to remove the lithium atoms from the cell than niobium and oxygen atoms. In addition, the formation of oxygen vacancies by Xe23+ irradiation was confirmed by the comparison of the EPR spectra obtained before and after irradiation, for which the g-factor was calculated to be ∼2.003,35–37 as shown in Fig. 5. Niobium was found to have the largest vacancy formation energy (18.426 eV), indicating that niobium is the most stable atom in LN crystal under irradiation condition.
Fig. 5. (a) EPR spectra of the LN crystal; (b) calculated g-factor obtained at room temperature.
3.4. Electronic structure analysis
The X-ray photoelectron spectroscopy is an effective method for the investigation of the variations in chemical bonding and composition in the crystals affected by different environmental conditions.38,39 When a metal–oxygen (M–O) bond formed (M: Li and Nb), valence electrons are transferred from the metal to oxygen. Therefore, it is difficult to eject an electron from a metal ion because the valence electron density of the metal is shifted towards oxygen, and the binding energy of the metal ion is shifted to a higher value.38,40 Consequently, for stronger M–O chemical bonding, the binding energy of metal M increases, while that of O 1s decreases. Conversely, a higher binding energy value of O 1s is associated with weaker M–O chemical bonding.
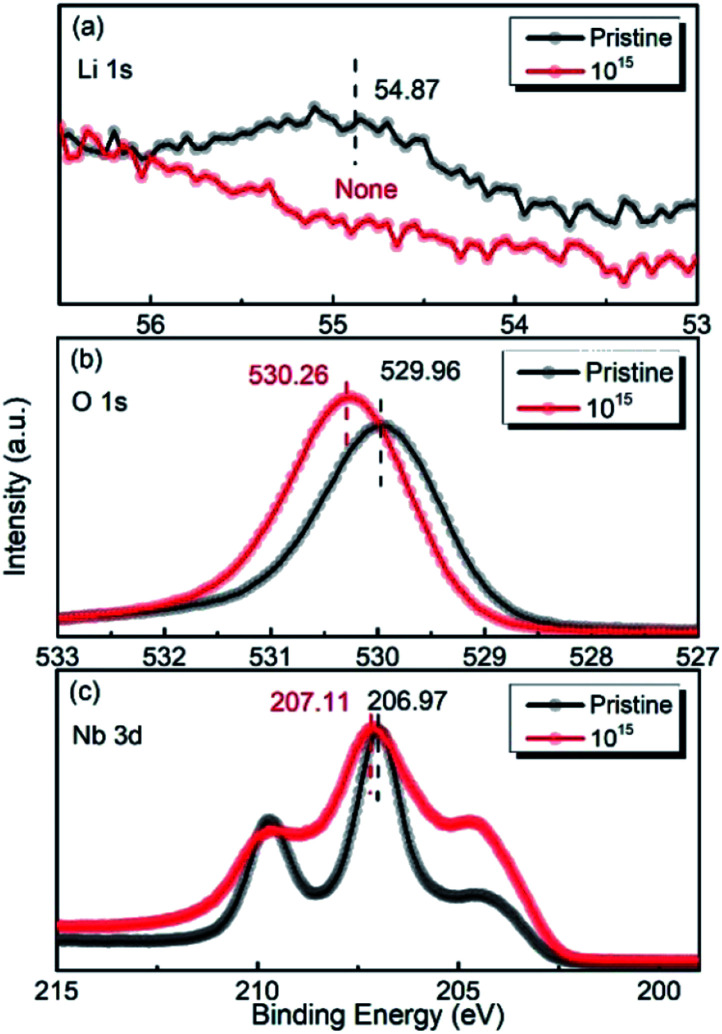
Fig. 6(a–c) show the XPS spectra of Li 1s, O 1s, and Nb 3d for the LN crystal irradiated by 6 MeV Xe23+ (1015 ions per cm2) together with the corresponding spectra of the pristine LN crystal for comparison. It was observed that the binding energies of Li 1s, O 1s, and Nb 3d shows different values from the pristine LN crystal, indicating that the structure of the LN crystal became distorted after irradiation. In particularly, it was found that the signal for lithium is barely detected due to the small content induced by the irradiation (Fig. 6(a)), as can be seen in Table 1. Meanwhile, Fig. 6(b) shows that the binding energy of O 1s increases from 529.96 eV for the pristine LN crystal to 530.26 eV after irradiation, indicating the weakening of the M–O bond, as discussed above. It is clear that the increased dielectric permittivity is associated with the distortion of the crystal structure and the weakened Li–O chemical bonding induced by irradiation as found by XPS.24 So it is reasonable to conclude that despite the neglectable effect on the LN bulk crystals, it needs to point out that such an irradiation depth might affect the properties of thin-film devices. Unlike the Li 1s and O 1s peaks, it was found that the binding energy of Nb 3d hardly changes after irradiation (Fig. 6(c)). This indicates that the Nb atom is the most stable atom in LN crystal under irradiation by the 6 MeV Xe23+, in agreement with the vacancy formation energies obtained by DFT calculations.
Fig. 6. XPS spectra of Li 1s (a), O 1s (b), and Nb 3d (c) before and after irradiation with the dose of 1015 ions per cm2.
Binding energies and peak area fraction for lithium, oxygen, and niobium elements of the LN crystal before and after the irradiation.
| Elements | Binding energy | Contents (±5%) | Variations (±5%) | ||
|---|---|---|---|---|---|
| Pristine | 1015 | Pristine | 1015 | 1015 | |
| Li | 54.87 | — | 19.10 | 0 | −100% |
| O | 529.96 | 530.26 | 67.74 | 82.52 | 21.82 |
| Nb | 206.97 | 207.11 | 13.16 | 17.48 | 32.83 |
4. Conclusions
In this work, the irradiation damage and structural changes as well as the variations of electro-elastic properties for LN crystal induced by 6 MeV Xe23+ irradiation were studied. It was found that irradiation generates a high concentration of lithium, oxygen, and niobium vacancies in the LN crystal since the vacancy formation energies (5.384, 6.780, and 18.426 eV, respectively) and the threshold displacement energies are much lower than the irradiation energy 6 MeV. Such formation of vacancies is likely to be responsible for the observed slight decrease in the electrical resistivity of the crystal upon irradiation. The distortion of the structure and weakened chemical bonding, particularly for the Li–O bonds, were confirmed by XPS results, and contribute to the observed slight increase of ε22/ε0 from 84 to 86 at room temperature and the slight decrease in k21. However, the small irradiation depth due to electronic stopping gives rise to stable d21 even after irradiation by 6 MeV Xe23+ with the dose of 1016 ions per cm2, demonstrating the favorable properties of the bulk piezoelectric LN crystal for use in high-temperature and irradiation conditions.
Conflicts of interest
There are no conflicts to declare.
Supplementary Material
Acknowledgments
The authors would like to thank Dr Wei Song in CETC Deqing Huaying Electronics Co., Ltd for growing LN single crystals. This work was supported by the National Natural Science Foundation of China (Grant No. 51872165), and the Key Research and Development Program of Shandong Province (Grant No. 2019JZZY010313 and 2017CXGC0413).
References
- Jiang X. N. Kim K. Zhang S. J. Johnson J. Salazar G. Sensors. 2014;14:144–169. doi: 10.3390/s140100144. [DOI] [PMC free article] [PubMed] [Google Scholar]
- Zhang S. J., Luo J., Snyder D. W. and Shrout T. R., in Handbook of Advanced Dielectric, Piezoelectric and Ferroelectric Materials-Synthesis, Characterization and Applications, ed. Z. G. Ye, Woodhead Publishing Ltd., Cambridge, England, 2008, pp. 130–157 [Google Scholar]
- Von der Linde D. Glass A. M. Rodgers K. F. Appl. Phys. Lett. 1974;25:155–157. doi: 10.1063/1.1655420. [DOI] [Google Scholar]
- Kaminow I. P. Carruthers J. R. Appl. Phys. Lett. 1973;22:326–328. doi: 10.1063/1.1654657. [DOI] [Google Scholar]
- Rosenblum B. Bräunlich P. Carrico J. P. Appl. Phys. Lett. 1974;25:17–19. doi: 10.1063/1.1655260. [DOI] [Google Scholar]
- Barkan I. B. Vorob'ev A. V. Marennikov S. I. Sov. J. Quant. Electron. 1979;9:492. doi: 10.1070/QE1979v009n04ABEH008916. [DOI] [Google Scholar]
- Chen F. F. Kong L. F. Song W. Jiang C. Tian S. W. Yu F. P. Qin L. Wang C. L. Zhao X. Journal of Materiomics. 2019;5:73–80. doi: 10.1016/j.jmat.2018.10.001. [DOI] [Google Scholar]
- Wang Y. Jiang Y. J. Opt. Mater. 2003;23:403–408. doi: 10.1016/S0925-3467(02)00328-2. [DOI] [Google Scholar]
- Dai L. Yan Z. H. Jiao S. S. Xu C. Xu Y. H. J. Alloys Compd. 2015;644:502–505. doi: 10.1016/j.jallcom.2015.05.036. [DOI] [Google Scholar]
- Miller R. C. Savage A. Appl. Phys. Lett. 1966;9:169–171. doi: 10.1063/1.1754695. [DOI] [Google Scholar]
- Bottom V. E. J. Appl. Phys. 1970;41:3941–3944. doi: 10.1063/1.1658392. [DOI] [Google Scholar]
- Fraser D. B. Warner A. W. J. Appl. Phys. 1966;37:3853–3854. doi: 10.1063/1.1707937. [DOI] [Google Scholar]
- Randles A., Tanaka S., Pokines B. and Esashi M., The 13th International Conference on Solid-State Sensors, Actuators and Microsysteins, 2005, pp. 1380–1383 [Google Scholar]
- Amini M. H. Sinclair A. N. Coyle T. W. IEEE Transactions on Ultrasonics, Ferroelectrics, and Frequency Control. 2016;63:448–455. doi: 10.1109/TUFFC.2016.2519348. [DOI] [PubMed] [Google Scholar]
- Tian S. W. Li L. L. Lu X. Y. Yu F. P. Li Y. L. Jiang C. Duan X. Wang Z. P. Zhang S. J. Zhao X. Acta Mater. 2020;183:165–171. doi: 10.1016/j.actamat.2019.11.013. [DOI] [Google Scholar]
- Hodgson E. Agullo-Lopez F. J. Phys.: Condens. Matter. 1989;1:10015–10020. doi: 10.1088/0953-8984/1/50/004. [DOI] [Google Scholar]
- Ohmori Y. Yamaguchi M. Yoshino K. Inuishi Y. Jpn. J. Appl. Phys. 1977;16:4302–4306. doi: 10.1143/JJAP.16.181. [DOI] [Google Scholar]
- Nakamura K. Adachi Y. Electron. Commun. Jpn. Part III Fundam. Electron. Sci. 1998;81:1–6. [Google Scholar]
- Glass A. M., Linde D. v. d. and Negran T. J., in Landmark Papers On Photorefractive Nonlinear Optics, World Scientific, 1995, pp. 371–373 [Google Scholar]
- Schrempel F. Gischkat T. Hartung H. Kley E. B. Wesch W. Tünnermann A. MRS Online Proc. Libr. 2005:908. [Google Scholar]
- Arizmendi L. Cabrera J. M. Agullo-Lopez F. J. Phys. C Solid State Phys. 1984;17:515–529. doi: 10.1088/0022-3719/17/3/021. [DOI] [Google Scholar]
- Tian S. W. Li L. L. Yu F. P. Li Y. L. Chen F. F. Duan X. L. Cheng X. F. Wang Z. P. Zhang S. J. Zhao X. Appl. Phys. Lett. 2018;113:122905. doi: 10.1063/1.5042284. [DOI] [Google Scholar]
- Rivera A. Olivares J. García G. Cabrera J. M. Agulló-Rueda F. Agulló-López F. Phys. Status Solidi A. 2009;206:1109–1116. doi: 10.1002/pssa.200824409. [DOI] [Google Scholar]
- Tian S. W. Li L. L. Chen F. F. Jiang C. Yu F. P. Li Y. L. Duan X. L. Wang Z. P. Zhang S. J. Zhao X. Journal of Materiomics. 2019;5:363–371. doi: 10.1016/j.jmat.2019.02.007. [DOI] [Google Scholar]
- Hodgson E. R. Agullo-Lopez F. Solid State Commun. 1987;64:965–968. doi: 10.1016/0038-1098(87)90572-2. [DOI] [Google Scholar]
- Ballman A. A. J. Am. Ceram. Soc. 1965;48:112–113. doi: 10.1111/j.1151-2916.1965.tb11814.x. [DOI] [Google Scholar]
- Zhang Y. Xu Y. Li M. Zhao Y. J. Cryst. Growth. 2001;233:537–540. doi: 10.1016/S0022-0248(01)01614-1. [DOI] [Google Scholar]
- Meitzler A. H., Berlincourt D., Welsh F. S., Tiersten H. F., Coquin G. A. and Warner A. W., IEEE Standard on piezoelectricity. An American National Standard, IEEE, New York, 1987, vol. 14 [Google Scholar]
- Kresse G. Furthmüller J. Comput. Mater. Sci. 1996;6:15–50. doi: 10.1016/0927-0256(96)00008-0. [DOI] [Google Scholar]
- Kresse G. Furthmüller J. Phys. Rev. B: Condens. Matter Mater. Phys. 1996;54:11169. doi: 10.1103/PhysRevB.54.11169. [DOI] [PubMed] [Google Scholar]
- Ceperley D. M. Alder B. J. Phys. Rev. Lett. 1980;45:566. doi: 10.1103/PhysRevLett.45.566. [DOI] [Google Scholar]
- Perdew J. P. Zunger A. Phys. Rev. B: Condens. Matter Mater. Phys. 1981;23:5048. doi: 10.1103/PhysRevB.23.5048. [DOI] [Google Scholar]
- Mayeshiba T. Morgan D. Solid State Ionics. 2017;311:105–117. doi: 10.1016/j.ssi.2017.09.021. [DOI] [Google Scholar]
- Wang Y. H. and Hu Z. Q., Ion Implantation and Analysis Basis, Aviation Industry Press Beijing, 1992 [Google Scholar]
- Canevali C. Chiodini N. Di Nola P. Morazzoni F. Scotti R. Bianchi C. L. J. Mater. Chem. 1997;7:997–1002. doi: 10.1039/A608608J. [DOI] [Google Scholar]
- Ivanovskaya M. Branitskii G. Orlik D. Mal'chenko S. Vrublevskii A. Russ. J. Inorg. Chem. 1992;37:577–580. [Google Scholar]
- Che M. and Tench A., in Advances in catalysis, Elsevier, 1983, vol. 32, pp. 1–148 [Google Scholar]
- Liu J. Duan X. L. Zhang Y. Li Z. Q. Yu F. P. Jiang H. D. J. Alloys Compd. 2016;660:356–360. doi: 10.1016/j.jallcom.2015.11.147. [DOI] [Google Scholar]
- Duan X. L. Liu J. Chen Y. Li Z. Q. Zhu P. F. Jiang H. D. Vacuum. 2018;147:38–44. doi: 10.1016/j.vacuum.2017.10.009. [DOI] [Google Scholar]
- Atuchin V. V. Kesler V. G. Meng G. Lin Z. S. J. Phys.: Condens. Matter. 2012;24:405503. doi: 10.1088/0953-8984/24/40/405503. [DOI] [PubMed] [Google Scholar]


