Abstract
The green synthesis of copper nanoparticles (CuNPs) using a leaf extract from Jatropha curcas (JC) has been documented in our present research work. The existence of flavonoids, tannins, glycosides, and alkaloids was confirmed by the phytochemical analysis of the plant extract and these chemicals can be used as reducing, stabilizing and capping agents. After six months, the JC-CuNPs were found to be stable without any evidence of agglomeration. The JC-CuNPs were characterised by XRD, FT-IR, SEM, TEM and UV-vis spectrophotometry. The average particle and crystal sizes of the JC-CuNPs were found to be 10 ± 1 and 12 ± 1 nm, respectively. The SPR peaks were found at 266 and 337 nm, measured using electronic spectroscopy, and the calculated optical band gap was found to be 3.6 eV at 337 nm, indicating the semiconductor behaviour of the JC-CuNPs. JC-CuNPs have potential photocatalytic activity against methylene blue (MB) compared with other dyes in the presence of sunlight and the rate constant (k) value is 2.30 × 10⁻⁴ s−1. The JC-CuNPs also have a binding property with CT-DNA through an intercalation mode and the binding constant (Kb) is 1.024 × 10² M−1.
The green synthesis of copper nanoparticles (CuNPs) using a leaf extract from Jatropha curcas (JC) has been documented in our present research work.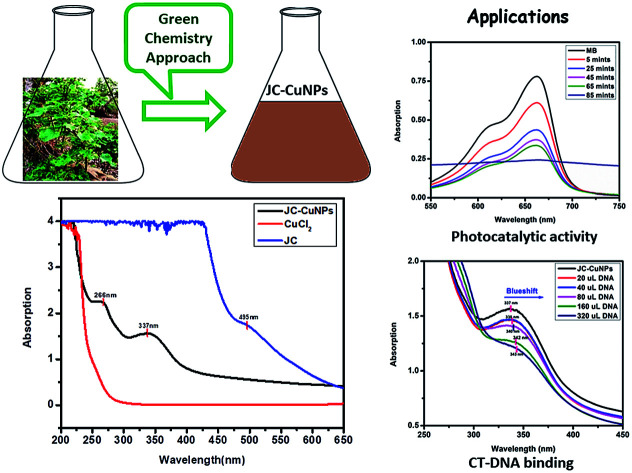
1. Introduction
According to the principles of green chemistry, there are several methods for the synthesis of metal nanoparticles (NPs). Non-toxic and eco-friendly chemicals have been used for the synthesis of nanoparticles through a green approach. Nanoparticles have been synthesised from various sources of animals, plants and microorganisms.1–3 Plant extracts for copper based nanoparticles have numerous applications such as in catalysis, for photocatalytic activity and antimicrobial activity, in DNA binding and sensors, for cytotoxicity, as antioxidants etc.4–10 To date, copper-based nanoparticles have been synthesised from several plant extracts such as Magnolia kobu, Terminalia arjuna, Aloe vera, Bifurcaria bifurcate, Tabernaemontana etc.11–15Jatropha curcas L. (JC) is included in the Euphorbiaceae family and is used as a herbal medicine and as a leaf extract against malaria.16 Goutam et al. has synthesised TiO2 nanoparticles using leaf extracts of J. Curcas and has investigated their photocatalytic properties.17 Similarly, Ag-based nanoparticles were synthesised from leaf extracts of J. Curcas and their antibacterial activity was examined and has been reported by Chauhan et al.18
Currently, a biological method is also followed for the green chemistry synthesis of metal nanoparticles due to it being free from hazardous chemicals. The metal nanoparticle synthesis method from plant extracts has more advantages over the microbial synthesis method because the microbial process is highly expensive due to the cost of microorganism isolation and their culture maintenance.19 Fe, Cu, Zn and Ag nanoparticles have been synthesised using biological sources and have been reported in potential applications such as for antimicrobials, photocatalytic activity etc.20–26 However, the multifunctional activity of green-synthesised nanoparticles is not reported in any of the previous research. Therefore, we focused on the multifunctional activity of JC-CuNPs.
Water pollution is one of the major issues of the world. Scientists around the world have been trying to remove contaminant compounds from water to be able to use it as drinking water. Organic dyes are one of the contaminants that pollute drinking water. Most of the dyes are produced from the painting, textile, rubber, leather, paper, clothing, fibre, cosmetic, and plastic industries, and these dyes are toxic and carcinogenic.27–32
In biomedicine, Ag, Au and Cu nanoparticles from plant extracts are playing a vital role due to the size and morphology of the nanoparticles.9 The active site of an effective anti-cancer drug can bind to the DNA of a cancer cell and reduce its activity.33 The nanoparticles can be bound to DNA molecules through interactive, electrostatic, or groove binding interactions.9,33
Recently, our group synthesised Ag-nanoparticles from a leaf extract of Sonchusarvensis L. and examined their sensor and photocatalytic properties.34 In this present work, we report the synthesis of CuNPs from leaf extracts of Jatropha curcas (JC). The JC-CuNPs are characterized by UV-visible spectroscopy, FT-IR, XRD and SEM. JC-CuNPs are semiconductor materials and their band gap energy is 3.6 eV. The JC-CuNPs have effective photocatalytic activity against methylene blue (MB) in sunlight and it can be completely degraded within 85 minutes. JC-CuNPs are bound to CT-DNA by an intercalation binding mode and the binding constant (Kb) is 1.024 × 10² M−1.
2. Experimental
2.1. Materials and methods
All required chemicals were purchased from Sigma-Aldrich and Merck. All chemicals were used without purification.
2.2. Plant materials
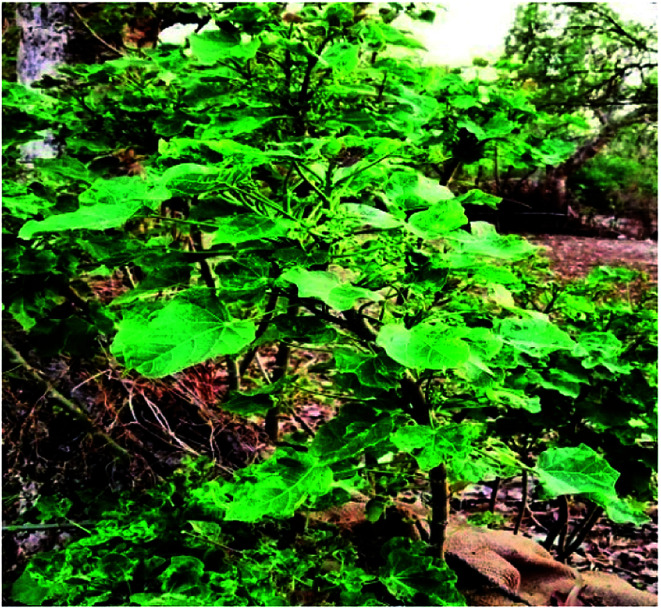
The leaves of J. curcas were collected from Amarkantak near Indira Gandhi National Tribal University, Madhya Pradesh, India in February 2019 (Fig. 1). The authentication of the plant species was done by subject experts, and a voucher specimen (DOB/13/JC/71) was deposited in the Department of Chemistry, Indira Gandhi National Tribal University, Madhya Pradesh, Amarkantak, India.
Fig. 1. Jatropha curcas (JC) plant.
2.3. Preparation of the plant extract
An extract of the Jatropha curcas leaf was used for the green synthesis of JC-CuNPs. Leaves of J. curcas have been used as a medicine against malaria.16 To remove debris and related dust, fresh leaves were washed with double distilled water (DDW) and cut into very fine pieces before being dried in the presence of sunlight. 10 g of the leaves was immersed in 100 mL distilled water and the leaves were incubated at 40 °C for 80 min to prepare for extraction. Furthermore, the extract of the leaves was kept at room temperature for cooling, filtered using Whatman (41) filter paper and used for the synthesis of the JC-CuNPs.
2.4. Phytochemical analysis
The standard protocol for qualitative phytochemical analysis was used to identify the major phytochemicals in the SALE, as shown in Table 1.
Phytochemical analysis of SALE.
| S. no. | Phytochemical test | Result |
|---|---|---|
| 1 | Flavonoids | − |
| 2 | Tannins | + |
| 3 | Phlobatannins | − |
| 4 | Terpenoids | − |
| 5 | Steroids | − |
| 6 | Saponins | + |
| 7 | Glycosides | − |
| 8 | Phenol | + |
| 9 | Alkaloids | + |
| 10 | Phytosterols | − |
| 11 | Anthocyanine | − |
| 12 | Anthraquinone | − |
2.5. Synthesis of copper nanoparticles
In an Erlenmeyer flask, 80 mL of copper chloride (3 mM) was stirred for 2 minutes, and then 20 mL of the J. curcas leaf extract was added to the mixture and constantly stirred for another 24 hours at room temperature. During the reaction, the colour of the solution mixture turned from deep brown to yellowish-brown, indicating the formation of the JC-CuNPs, and this was also confirmed by UV-vis spectroscopy measurements. Afterwards, the final mixture was centrifuged at 10 000–11 000 rpm and the JC-CuNPs were separated from the mixture. Finally, the solution was decanted out and the brown-black JC-CuNPs were collected.
2.6. Characterization of the JC-CuNPs
All the required chemicals were purchased from Sigma-Aldrich and Merck. All the chemicals were used without purification.
The crystal structure of the JC-CuNPs was measured by X-ray diffraction (XRD) at room temperature using a D8 Advance BRUKER diffractometer equipped with Cu Kα (1.54060 Å) as the incident radiation. The Scherrer equation was used for the calculation of the crystal size. The Scherrer equation was D = Kλ/β cos θ, where K = 0.9, D = crystal size (Å), λ = wavelength of the Cu-Kα radiation, and β = corrected half-width of the diffraction peak. The IR spectra were recorded on a SHIMADZU FTIR-8400S spectrometer at room temperature. The fine structure of the prepared samples was analysed by Scanning Electronic Microscopy (SEM) (Carl Zeiss Germany, Model Supra-40). Energy-dispersion X-ray spectroscopy (EDX) of the nanoparticles was carried out on a Sigma ZEISS, Oxford Instruments Field Emission Scanning Electron Microscope. The optical and photocatalytic activities and CT-DNA binding properties of the JC-CuNPs were investigated using a UV-visible spectrophotometer (UV-1800, Shimadzu).
2.7. Photocatalytic experiments of the JC-CuNPs
The photocatalytic experiments of the green synthesised JC-CuNPs were conducted in the presence of sunlight with aqueous solutions of methylene blue (MB), naphthol orange (NO), rhodamine B (Rh–B), and methyl orange (MO) dyes. The stock solutions of the dyes were prepared by dissolving 10 mg of the dyes with 1000 mL DDW. 10 mg of the JC-CuNPs were added to 20 mL solutions of the dyes and these were kept in sunlight. A set of controls was also prepared without the JC-CuNPs. The absorption peaks of the dyes were monitored by UV-visible spectroscopy at regular time intervals.
2.8. DNA binding study
Tris–HCl buffer (pH = 7.25) solution was used to dissolve calf-thymus (CT) DNA and its purity absorbance ratio was recorded from A260/A280 to have a ratio of 1.8–1.9. The stock solutions were kept at 4 °C and were used within 4 days. The JC-CuNPs were dissolved in water and absorption-titration experiments were performed using an increased concentration of CT-DNA with a constant amount of the JC-CuNPs.
3. Results and discussion
3.1. Green synthesis of JC-CuNPs
For the synthesis of the JC-CuNPs, 20 mL of Jatropha curcas leaf extract was added to 80 mL of copper chloride solution in a ratio of 1 : 4 (v/v) with continuous stirring for 24 hours at room temperature. During the reaction, the colour of the solution mixture changed from deep brown to yellowish-brown, indicating the formation of the CuNPs, and this was also confirmed using UV-vis spectroscopy. The electronic spectra of the CuNPs arises due to the excitation of the surface plasmon resonance (SPR) phenomenon.31–36
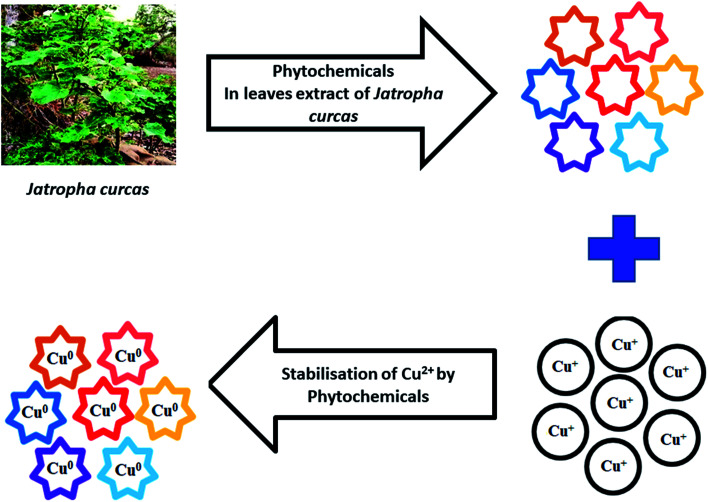
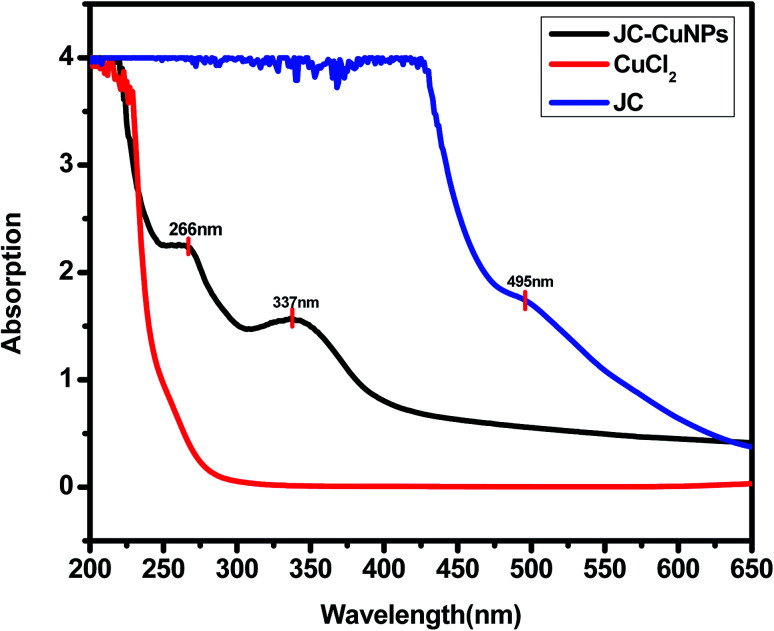
The plant extract contains tannins, saponins, phenol and alkaloid phytochemicals that act as capping and stabilizing agents for the green synthesised JC-CuNPs, and they may also be responsible for the reduction of Cu+ to Cu0.11–15 The accumulation of JC-CuNPs was not observed six months after the synthesis. The possible mechanism for the synthesis of the JC-CuNPs is shown in Fig. 2. In the UV-visible spectrum, JC-CuNPs showed absorption peaks at 337 and 266 nm, but no peaks appeared for copper chloride or the plant extract solution, as shown in Fig. 3.
Fig. 2. Possible mechanism for the synthesis of JC-CuNPs.
Fig. 3. UV-visible spectra of JC-CuNPs.
3.2. XRD analysis
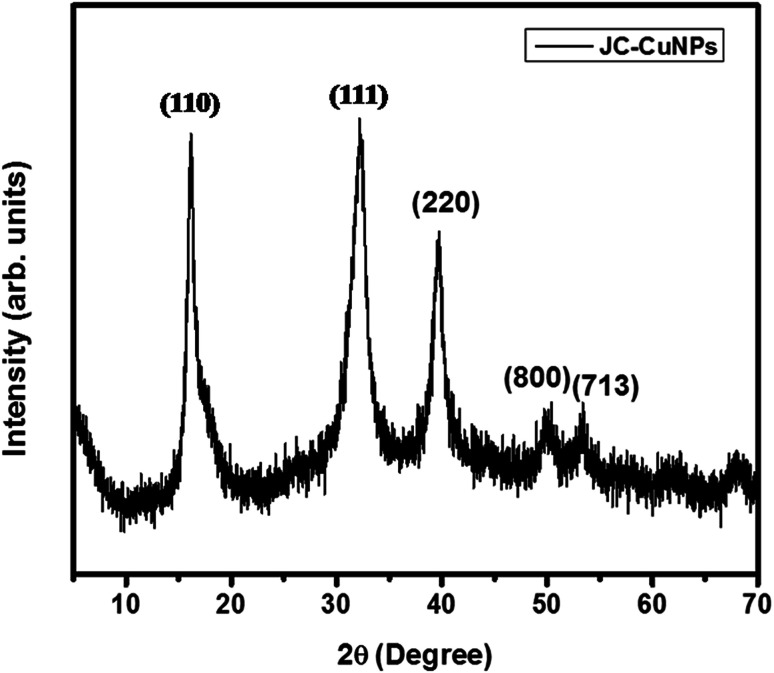
The crystalline phase of the JC-CuNPs was characterized by XRD analysis. The diffraction intensities were recorded from 5 to 70 at 2θ angles, suggesting a monoclinic configuration. Five characteristic peaks were observed at 2θ angles of 16.24°, 32.34°, 39.73°, 49.91° and 53.25°, and these correspond to the h, k, l, values of the reflections from (110), (111), (220), (800) and (713), corroborating with the values of the JCPDS card (card no. 89-5899)13 (Fig. 4). The Scherrer formula (D = 0.9 λ/β cos θ, where λ = wavelength and β = full width at half maximum at the θ angle) was used to calculate the average crystalline size of the JC-CuNPs, showing 12 ± 1 nm on the (111) plane.
Fig. 4. XRD of the JC-CuNPs.
3.3. FT-IR analysis
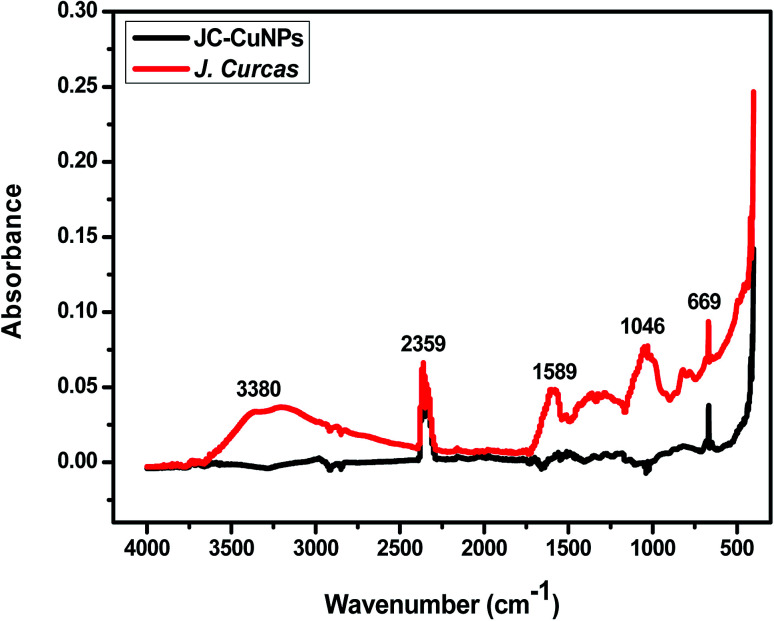
The comparative FT-IR spectra of J. Curcas and JC-CuNPs are depicted in Fig. 5. Table 2 displays the major peaks, wavenumbers, and the interpretation of the possible functional groups. The FT-IR data also shows that the phytochemicals of the JC or their functional groups are responsible for reducing and stabilizing the JC-CuNPs. The absorption bands of JC at 3380, 2359, 1589, 1046, 669 and 418 cm−1 are due to O–H, C–H, C N, C–O and C–Cl functional groups, respectively. Simultaneously, absorption bands for the JC-CuNPs at 2980, 2361, 1567, 667 and 408 cm−1 correspond to the functional groups of O–H, C–H, C N, C–O and C–Cl and might be responsible for the bioreduction of Cu+ to JC-CuNPs.
Fig. 5. Comparative FT-IR spectra of JC leaf powder and JC-CuNPs.
FT-IR analysis and probable functional groups of JC-leaf powder and JC-CuNPs.
| JC-leaf wavenumber (cm−1) | Probable functional group | JC-CuNPs wavenumber (cm−1) | Probable functional group |
|---|---|---|---|
| 3380 | Broad for O–H | 2980 | Broad for O–H |
| 2359 | Strong for C–H | 2361 | Strong for C–H |
| 1589 | Medium for C N | 1567 | Broad C N |
| 1046 | Medium for C–O | — | — |
| 669 | Strong for C–Cl | 667 | Strong for C–Cl |
| 418 | Strong | 408 | Strong Cu–O |
3.4. Morphology (SEM and EDX) analysis of JC-CuNPs
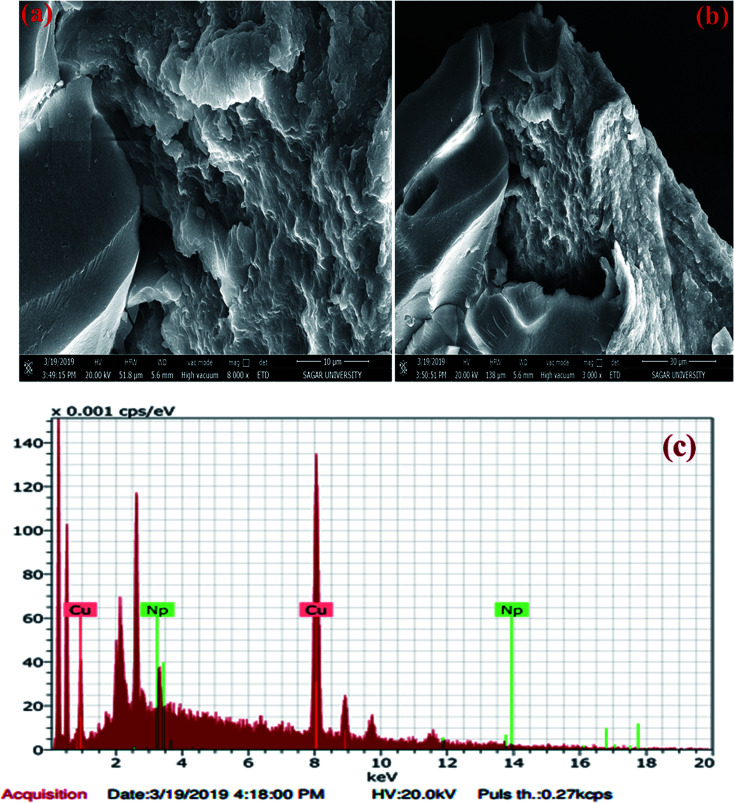
The morphology of the JC-CuNPs was examined using Field Emission Scanning Electron Microscopy (FESEM). Fig. 6(a) and (b) represent the SEM images of the JC-CuNPs at different resolutions. The constituents of the green synthesised JC-CuNPs were examined using Energy Dispersive X-ray Analysis (EDX). Fig. 6c shows the EDX spectra displaying the % of composition and major elemental peak at 8 keV that is specific to the Cu metal. Other small peaks appeared for biomolecules that were used for the capping of the JC-CuNPs. The percentages of Cu and other biomolecules are given in Table 3.
Fig. 6. (a and b) SEM and (c) EDX results for JC-CuNPs.
Elemental analysis and determination of weight% and atomic% of JC-CuNPs.
| Element | Weight% | Atomic% |
|---|---|---|
| Copper | 95.07 | 98.03 |
| Other | 4.93 | 1.37 |
| Total | 100 | 100 |
3.5. TEM analysis of the JC-CuNPs
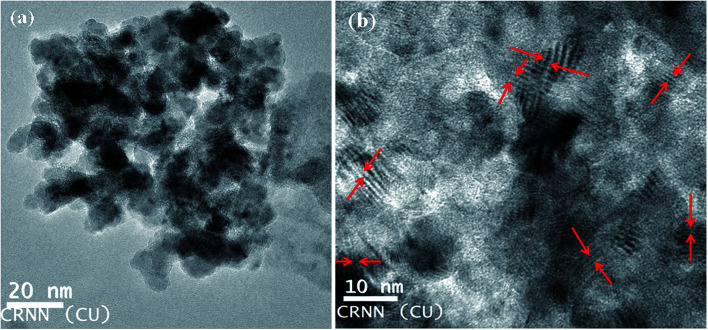
Transmission Electron Microscopy (TEM) is an important characterization tool for the direct imaging of nanomaterials to obtain quantitative measures of particle size, size distribution, shape and lattice fringes. The particle size and lattice fringes are measured using HRTEM (Model Philips TM-30, Philips Research Laboratories). The bright-field (BF) electron micrograph of the JC-CuNPs produced at 100 °C shows an almost spherical particle shape, with average particle sizes of 10 ± 1 nm (Fig. 7a), and the corresponding lattice fringes of the JC-CuNPs obtained from HRTEM are shown in Fig. 7b. The lattice fringes are oriented in different directions marked by red arrows and are clearly visible. The particles have been separated by well-defined boundaries, and are visible and uniformly distributed.
Fig. 7. HRTEM of JC-CuNPs. (a) Normal mode and (b) high resolution mode (Snapshot).
3.6. Optical properties
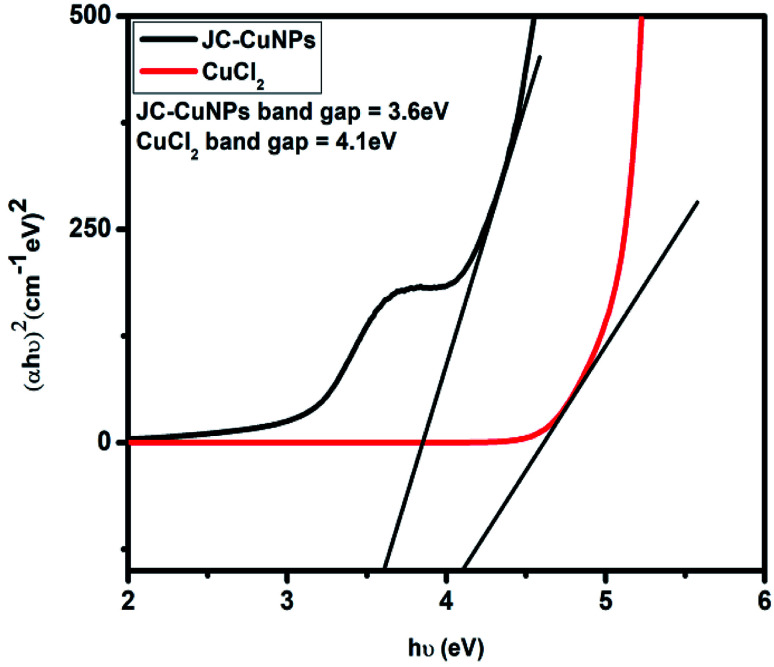
The UV-visible spectrum of the JC-CuNPs is displayed in Fig. 8. We calculated the band gap energy using the UV-spectrum data. Tauc's relation, shown in eqn (1), was used to calculate the band gap energy,
| (αhν)n = A(hν − Eg) | 1 |
where α represents the absorption coefficient, A is a constant, Eg shows the optical band gap energy, n is the exponent that depends on transition and h symbolises Planck's constant. Fig. 8 shows that the optical band gap was calculated using the Tauc relation by plotting (αhν)2vs. hν and extrapolating the linear portion of the curve to (αhν)2 = 0. Hence, the optical energy band gaps of the JC-CuNPs and copper chloride were 3.6 and 4.1 eV, respectively. The band gap energy reveals that the JC-CuNPs have semiconductor properties and act as active photocatalysts for the degradation of MB.
Fig. 8. Band gap energy for the JC-CuNPs and for copper chloride.
3.7. Photocatalytic activity of JC-CuNPs
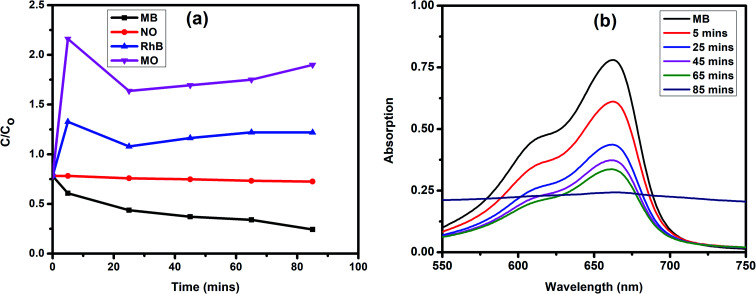
The band gap value of JC-CuNPs suggests that the material has semiconductor properties. Therefore, we investigated the photocatalytic activity of JC-CuNPs against different types of organic dyes such as MB, RhB, NO and MO under sunlight. Firstly, we studied the catalytic efficiency among all the dyes and found that the degradation efficiency of JC-CuNPs was at a maximum with MB in comparison with the other dyes, as shown in Fig. 9a. Afterwards, we optimised the catalyst loading, enabling a better degradation result with the minimum amount of time, and we observed that 10 mg of the catalyst loaded into a 20 mL MB solution showed the highest photocatalytic activity. We also tested the concentration of the dyes and the pH values of the dye solutions, and found that 10 mg L−1 of the dyes in aqueous solution at pH 7 gave the maximum efficiency of the catalysts. MB was completely degraded within 85 minutes by the JC-CuNPs and in the presence of sunlight. In the absence of JC-CuNPs, MB aqueous solution was kept under sunlight for more than two hours, however the colour and amount of absorption remained unchanged.
Fig. 9. (a) Degradation of different dyes in the presence of JC-CuNPs with sunlight. (b) UV-visible spectra of MB in the presence of JC-CuNPs.
The efficiency of the JC-CuNPs for the degradation of MB can be calculated using the following equation (eqn (2)),
 |
2 |
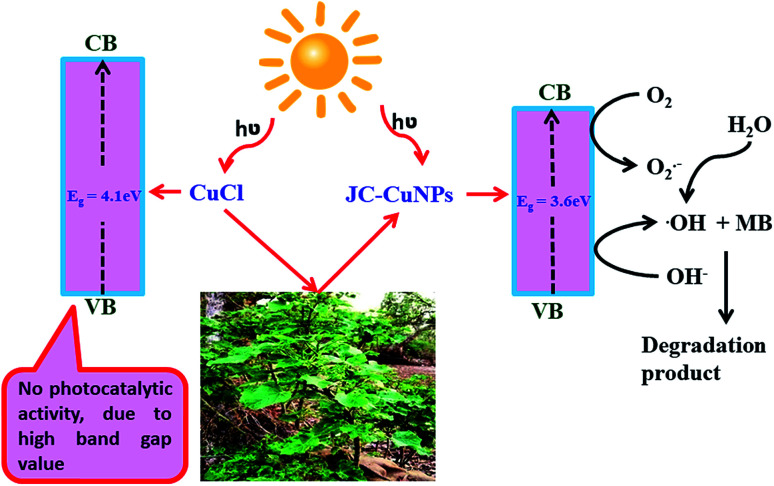
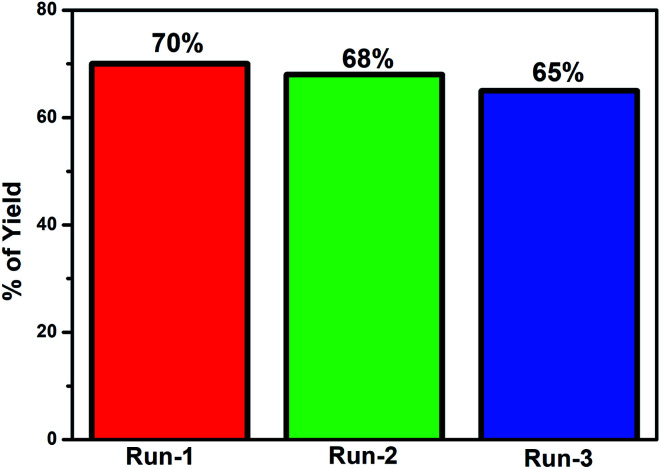
where At and A0 are the absorbances at the time denoted t and at the initial time, respectively. The degradation efficiency of the JC-CuNPs was about 70% for MB. The photocatalytic activity of the JC-CuNPs on MB followed the pseudo-first order kinetics and its rate constant (k) was 2.30 × 10⁻⁴ s−1, which was calculated after completion of the degradation of the dye. The degradation rate of JC-CuNPs was faster due to the lower band gap value (3.6 eV) and corresponds to the electron of the JC-CuNPs being easily transmitted from the VB to the CB in the presence of sunlight, degrading the MB. However, no catalytic activity was detected in the presence of copper chloride when the other conditions remained the same. The proposed mechanism for the degradation of MB in the presence of JC-CuNPs and sunlight is shown in Fig. 10. At the same time, we measured the quality of the catalyst by checking the recyclability of the catalyst. After completion of the first run, the JC-CuNPs were recovered by simple filtration and were washed repeatedly with water and dried at 80 °C in a hot air oven. Subsequently, two more runs of the reusable catalyst were also used for the degradation of MB and it was found that they occurred without appreciable loss of catalytic activity (Fig. 11). A small difference in the efficiency of the catalyst was observed among the 1st and 3rd cycles due to some loss of the catalyst during filtration.
Fig. 10. Proposed mechanism for the degradation of MB in the presence of JC-CuNPs and sunlight.
Fig. 11. Recycling of the JC-CuNPs in the MB degradation process.
3.8. DNA binding study of the JC-CuNPs
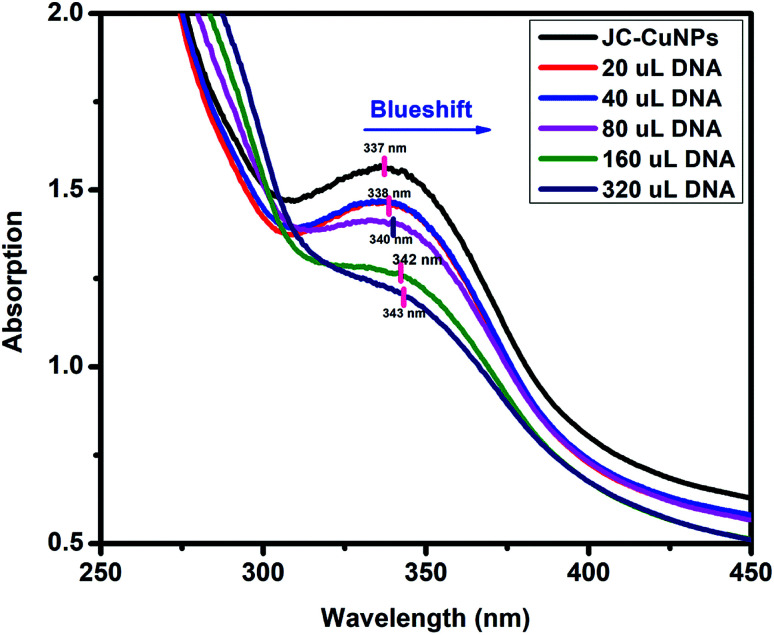
UV-visible spectroscopy is a useful technique for studying the binding of any drug molecule to DNA. Therefore, we investigated the CT-DNA binding property of the green synthesised JC-CuNPs using UV-visible spectroscopy. The stability of the JC-CuNPs in Tris–HCl buffer solution was investigated using UV-visible spectroscopy and the absorption peak did not change at room temperature after 1 hour (measured at 15 minute time intervals with UV-visible analysis), and this means that the JC-CuNPs were stable in Tris–HCl buffer solution. The binding efficiency was observed by spectral changes of the JC-CuNPs during titration with an increasing amount of CT-DNA. Fig. 12 indicates that the JC-CuNPs have an absorption peak at 337 nm due to the d–d transition. To demonstrate the binding characteristics of the JC-CuNPs with CT-DNA, we used electronic absorption spectroscopy with changes in the absorbance and shifts in the wavelength. The wavelength of the JC-CuNPs undergoes a blueshift (the wavelength shifts from 337 nm to 338, 338, 340, 342 and 343 nm with an increase in the concentration of CT-DNA to 20 μL, 40 μL, 80 μL, 160 μL and to 320 μL, respectively) when the concentration of the CT-DNA was increased, as shown in Fig. 12.
Fig. 12. DNA binding of the JC-CuNPs.
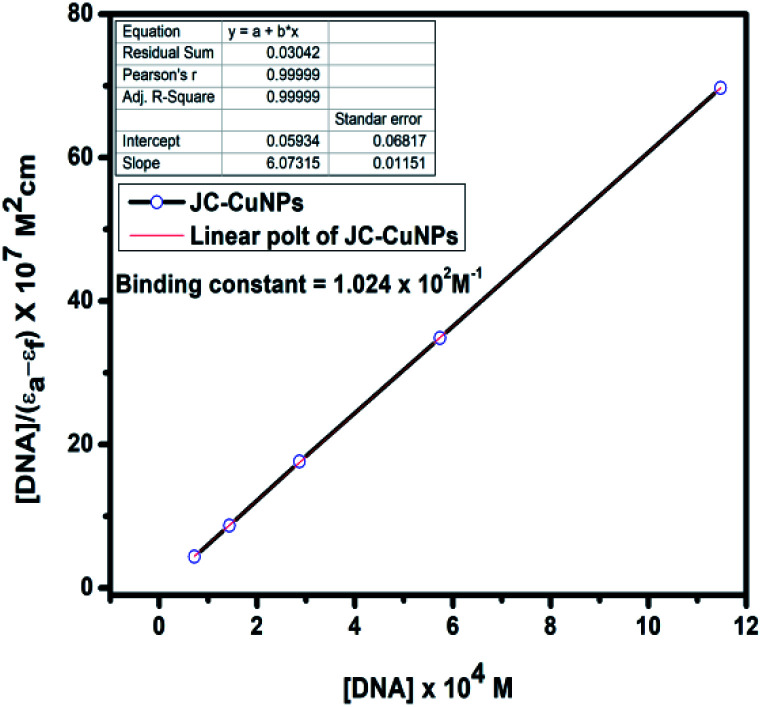
The absorption spectra of the DNA binding study reveal that a blueshift occurs due to strong stacking interactions between the NPs and base pairs of the DNA. The binding constant (Kb) of the complexes was determined using the following eqn (3),37
| [DNA] × (εa − εf)−1 = [DNA] × (εb − εf)−1 + Kb−1 × (εb − εf)−1 | 3 |
where εa,εf and εb were denoted as the extinction coefficients of the complex, CT-DNA and of the bound complex, respectively. The binding constant for the JC-NPs was 1.024 × 10², as shown in Table 4. Thus, the DNA binding constant value indicates that the JC-CuNPs can bind to CT-DNA in either the classical or partial intercalative modes.38,39
Absorption titration data of the JC-CuNPs.
| JC-CuNPs | ||||
|---|---|---|---|---|
| Absorption | [DNA]/(εa − εf) × 107 M2 cm | [DNA] × 104 M | K b (M−1) | |
| 1.562 | 0.000 | 0.00 | 1.024 × 10² M−1 |
|
| 1.467 | 4.359 | 0.7173 | ||
| 1.464 | 8.718 | 1.434 | ||
| 1.403 | 17.636 | 2.869 | ||
| 1.261 | 34.872 | 5.738 | ||
| 1.204 | 69.744 | 11.476 | ||
4. Conclusion
In summary, novel JC-CuNPs were synthesised from a J. curcas leaf extract by a simple green chemistry approach. During the reaction, the colour of the solution mixture turned from a deep brown colour to a yellowish-brown, indicating the formation of the JC-CuNPs, and this was also confirmed from UV-vis spectroscopy measurements. The absorption peaks at 266 and 337 nm in the UV-visible spectroscopy results confirmed the formation of stable JC-CuNPs. Additional FT-IR spectroscopy also confirmed the green synthesis of the JC-CuNPs. The JC-CuNPs were found to be stable for up to six months without agglomeration, due to the presence of natural capping and reducing agents in the plant extract. The average particle and crystallite sizes of the JC-CuNPs were found to be 10 ± 1 and 12 ± 1 nm, confirmed from TEM and XRD measurements. The JC-CuNPs have effective photocatalytic activity against MB compared with other dyes in the presence of sunlight, with a rate constant (k) of 2.30 × 10⁻⁴ s−1. The binding constant (Kb) was 1.024 × 10² M−1, indicating that the JC-CuNPs may bind to CT-DNA in either the classical or partial intercalative modes. Finally, we have concluded that biosynthesised JC-CuNPs may act as a stable and efficient green catalyst for the degradation of MB under sunlight, and can be actively involved in CT-DNA binding.
Funding
This work was fully supported by the Madhya Pradesh Council of Science & Technology, Govt. of India, Madhya Pradesh (File No. A/R&D/RP-2/Phy & Engg./2017-18/271) and the Indira Gandhi National Tribal University, Amarkantak, Madhya Pradesh, India.
Conflicts of interest
The authors declare no conflict of financial interest.
Supplementary Material
Acknowledgments
This work was fully supported by the Madhya Pradesh Council of Science & Technology, Govt. of India, Madhya Pradesh (File No. A/R&D/RP-2/Phy & Engg./2017-18/271) and by the Indira Gandhi National Tribal University, Amarkantak, Madhya Pradesh, India. The authors are also thankful to Dr Hari Singh Gour University (Central University), Madhya Pradesh, India for the characterization studies.
References
- Podstawczyk D. Pawłowska A. Bastrzyk A. Czeryba M. Oszmiański J. ACS Sustainable Chem. Eng. 2019;7:17535–17543. doi: 10.1021/acssuschemeng.9b05078. [DOI] [Google Scholar]
- Cheirmadurai K. Biswas S. Murali R. Thanikaivelan P. RSC Adv. 2014;4:19507–19511. doi: 10.1039/C4RA01414F. [DOI] [Google Scholar]
- Molnár Z. Bódai V. Szakacs G. Erdélyi B. Fogarassy Z. Sáfrán G. Varga T. Kónya Z. Tóth-Szeles E. Szűcs R. Lagzi I. Sci. Rep. 2018;8:3943. doi: 10.1038/s41598-018-22112-3. [DOI] [PMC free article] [PubMed] [Google Scholar]
- Ghosh M. K. Jain K. Khan S. Das K. Ghorai T. K. ACS Omega. 2020;5:4973–4981. doi: 10.1021/acsomega.9b03875. [DOI] [PMC free article] [PubMed] [Google Scholar]
- Nazar N. Bibi I. Kamal S. Iqbal M. Nouren S. Jilani K. Umair M. Ata S. Int. J. Biol. Macromol. 2018;106:1203–1210. doi: 10.1016/j.ijbiomac.2017.08.126. [DOI] [PubMed] [Google Scholar]
- Vasantharaj S. Sathiyavimal S. Saravanan M. Senthilkumar P. Gnanasekaran K. Shanmugavel M. Manikandan E. Pugazhendhi A. J. Photochem. Photobiol., B. 2019;191:143–149. doi: 10.1016/j.jphotobiol.2018.12.026. [DOI] [PubMed] [Google Scholar]
- Zhao L. Hu Q. Huang Y. Fulton A. N. Hannah-Bick C. Adeleye A. S. Keller A. A. Environ. Sci.: Nano. 2017;4:1750–1760. doi: 10.1039/C7EN00358G. [DOI] [Google Scholar]
- Ingle A. P. Duran N. Rai M. Appl. Microbiol. Biotechnol. 2014;98:1001–1009. doi: 10.1007/s00253-013-5422-8. [DOI] [PubMed] [Google Scholar]
- Duman F. Ocsoy I. Kup F. O. Mater. Sci. Eng., C. 2016;60:333–338. doi: 10.1016/j.msec.2015.11.052. [DOI] [PubMed] [Google Scholar]
- Dayakar T. Rao K. V. Bikshalu K. Rajendar V. Park S. H. J. Mater. Sci.: Mater. Med. 2017;28:109. doi: 10.1007/s10856-017-5907-6. [DOI] [PubMed] [Google Scholar]
- Lee H. J. Song J. Y. Kim B. S. J. Chem. Technol. Biotechnol. 2013;88:1971–1977. [Google Scholar]
- Yallappa S. Manjanna J. Sindhe M. A. Satyanarayan N. D. Pramod S. N. Nagaraja K. Spectrochim. Acta, Part A. 2013;110:108–115. doi: 10.1016/j.saa.2013.03.005. [DOI] [PubMed] [Google Scholar]
- Ramyadevi J. Jeyasubramanian K. Marikani A. Rajakumar G. Rahuman A. A. Santhoshkumar T. Kirthi A. V. Jayaseelan C. Marimuthu S. Parasitol. Res. 2011;109:1403–1415. doi: 10.1007/s00436-011-2387-3. [DOI] [PubMed] [Google Scholar]
- Abboud Y. Saffaj T. Chagraoui A. El Bouari A. Brouzi K. Tanane O. Ihssane B. Appl. Nanosci. 2014;4:571–576. doi: 10.1007/s13204-013-0233-x. [DOI] [Google Scholar]
- Sivaraj R. Rahman P. K. Rajiv P. Salam H. A. Venckatesh R. Spectrochim. Acta, Part A. 2014;133:178–181. doi: 10.1016/j.saa.2014.05.048. [DOI] [PubMed] [Google Scholar]
- Abobatta W.,Jatrophacurcas: an overview, 2019 [Google Scholar]
- Goutam S. P. Saxena G. Singh V. Yadav A. K. Bharagava R. N. Thapa K. B. Chem. Eng. J. 2018;336:386–396. doi: 10.1016/j.cej.2017.12.029. [DOI] [Google Scholar]
- Chauhan N. Tyagi A. K. Kumar P. Malik A. Front. Microbiol. 2016;7:1748. doi: 10.3389/fmicb.2016.01748. [DOI] [PMC free article] [PubMed] [Google Scholar]
- Chandraker S. K. Lal M. Shukla R. RSC Adv. 2019;9:23408–23417. doi: 10.1039/C9RA03590G. [DOI] [PMC free article] [PubMed] [Google Scholar]
- Senthilkumar N. Nandhakumar E. Priya P. Soni D. Vimalan M. Potheher I. V. New J. Chem. 2017;41:10347–10356. doi: 10.1039/C7NJ02664A. [DOI] [Google Scholar]
- Ganapathy M. Senthilkumar N. Vimalan M. Jeysekaran R. Potheher I. V. Mater. Res. Express. 2018;5:045020. doi: 10.1088/2053-1591/aab91b. [DOI] [Google Scholar]
- Jayapriya M. Dhanasekaran D. Arulmozhi M. Nandhakumar E. Senthilkumar N. Sureshkumar K. Res. Chem. Intermed. 2019;45:3617–3631. doi: 10.1007/s11164-019-03812-5. [DOI] [Google Scholar]
- Nandhakumar E. Priya P. Selvakumar P. Vaishnavi E. Sasikumar A. Senthilkumar N. Mater. Res. Express. 2019;6:095036. doi: 10.1088/2053-1591/ab2eb9. [DOI] [Google Scholar]
- Nandhakumar E. Priya P. Rajeswari R. Aravindhan V. Sasikumar A. Senthilkumar N. Res. Chem. Intermed. 2019;45:2657–2671. doi: 10.1007/s11164-019-03756-w. [DOI] [Google Scholar]
- Senthilkumar N. Aravindhan V. Ruckmani K. Potheher I. V. Mater. Res. Express. 2018;5:055032. doi: 10.1088/2053-1591/aac312. [DOI] [Google Scholar]
- Balraj B. Senthilkumar N. Potheher I. V. Arulmozhi M. Mater. Sci. Eng., B. 2018;231:121–127. doi: 10.1016/j.mseb.2018.10.011. [DOI] [Google Scholar]
- Oh N. Kim J. H. Jin S. Yoon C. S. Small. 2009;5:1311–1317. doi: 10.1002/smll.200801536. [DOI] [PubMed] [Google Scholar]
- Ghosh M. K. Chandraker S. K. Shukla R. Mandal M. Mandal V. Ghorai T. K. J. Cluster Sci. 2019:1–15. [Google Scholar]
- Hasnat M. A. Uddin M. M. Samed A. J. F. Alam S. S. Hossain S. J. Hazard. Mater. 2007;147:471–477. doi: 10.1016/j.jhazmat.2007.01.040. [DOI] [PubMed] [Google Scholar]
- Yang L. Li X. Sun C. Y. Wu H. Wang C. G. Su Z. M. New J. Chem. 2017;41:3661–3666. doi: 10.1039/C7NJ00389G. [DOI] [Google Scholar]
- Ghorai T. K. Pathak S. Sikdar S. Adv. Sci. Lett. 2016;22:167–174. doi: 10.1166/asl.2016.6770. [DOI] [Google Scholar]
- Afkhami A. Moosavi R. J. Hazard. Mater. 2010;174:398–403. doi: 10.1016/j.jhazmat.2009.09.066. [DOI] [PubMed] [Google Scholar]
- Ghosh M. K. Pathak S. Ghorai T. K. ACS Omega. 2019;4:16068–16079. doi: 10.1021/acsomega.9b02268. [DOI] [PMC free article] [PubMed] [Google Scholar]
- Chandraker S. K. Ghosh M. K. Lal M. Ghorai T. K. Shukla R. New J. Chem. 2019;43:18175–18183. doi: 10.1039/C9NJ01338E. [DOI] [Google Scholar]
- Chatterjee S. Chatterjee S. Chatterjee B. P. Guha A. K. Colloids Surf., A. 2007;299:146–152. doi: 10.1016/j.colsurfa.2006.11.036. [DOI] [Google Scholar]
- Afkhami A. Moosavi R. J. Hazard. Mater. 2010;174:398–403. doi: 10.1016/j.jhazmat.2009.09.066. [DOI] [PubMed] [Google Scholar]
- Wolfe A. ShimerJr G. H. Meehan T. Biochem. 1987;26:6392–6396. doi: 10.1021/bi00394a013. [DOI] [PubMed] [Google Scholar]
- Jiang C. W. Chao H. Li H. Ji L. N. J. Inorg. Biochem. 2003;93:247–255. doi: 10.1016/S0162-0134(02)00577-9. [DOI] [PubMed] [Google Scholar]
- Martins D. A. Gouvea L. R. Batista D. D. G. J. Da Silva P. B. Louro S. R. Maria de Nazaré C. S. Teixeira L. R. BioMetals. 2012;25(5):951–960. doi: 10.1007/s10534-012-9565-3. [DOI] [PubMed] [Google Scholar]


