Abstract
In this study, a series of Fe-doped g-C3N4 (Fe–C3N4) samples was synthesized and characterized via X-ray powder diffraction (XRD), scanning electron microscopy (SEM), Fourier transform infrared (FTIR) spectroscopy, X-ray photoelectron spectroscopy (XPS), UV-vis diffuse reflection spectroscopy (UV-vis DRS), and photoluminescence (PL) spectroscopy. The photocatalytic activity of the synthesized Fe–C3N4 was investigated toward methylene blue (MB) degradation with hydrogen peroxide (H2O2) assistance. The results showed that the Fe–C3N4 heterogeneous photo-Fenton-like system showed excellent catalytic performance when the pH value was varied from 3.0 to 9.0. Evaluating the effects of various inorganic anions in the Fe–C3N4 heterogeneous photo-Fenton-like system, HCO3− showed a dual effect on MB degradation, and Cl− and NO3− showed an inhibitory effect on MB degradation. Evaluating the effects of inorganic cations, Al3+, Mg2+, and Ca2+ strongly inhibited MB degradation. Recycling experiments demonstrated that Fe–C3N4 possesses good reusability and stability. Quenching experiments were carried out, and it was found that hydroxyl radicals (·OH) were the primary active species in the system. Besides, nine intermediates were identified via LC/MS, and a possible MB degradation pathway in the system was proposed. This study could promote the application of this Fe–C3N4 heterogeneous photo-Fenton-like system in realistic dye wastewater.
The influence of reaction parameters, especially the presence of inorganic ions, on the activity of a Fe–C3N4 photo-Fenton system has been systematically studied.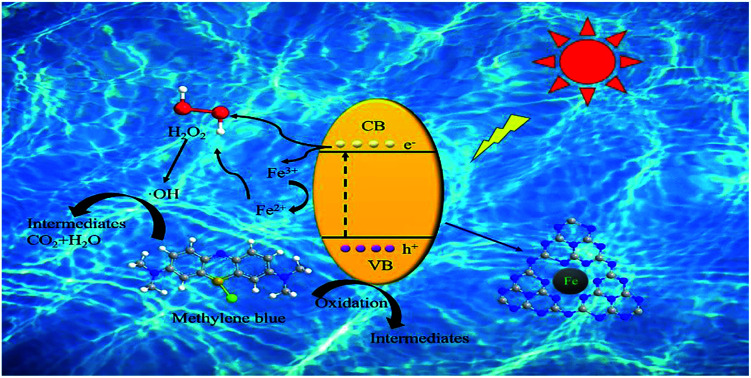
1. Introduction
Nowadays, advanced oxidation processes (AOPs) are commonly recognized as potential alternative technologies for the treatment of refractory organic pollutants because of their simplicity, high efficiency, and easy handling.1–5 Among the various available AOPs, the visible-light-induced heterogeneous photo-Fenton-like process is considered an effective method for pollutant treatment. Compared with the traditional Fenton and photo-Fenton processes in homogeneous systems, it has shown many advantages, such as the efficient mineralization of organic pollutants, lower cost, good reusability, excellent chemical stability, and only precipitating small amounts of iron.6 However, the strict pH operating range (acidic or near-neutral conditions), high levels of iron leaching (>2 ppm), smaller number of iron active sites, and low cycling efficiency of Fe3+/Fe2+ have limited the application of this process.7,8 Therefore, exploring a highly efficient and low-cost catalyst for use in this system is essential.
Polymeric graphitic carbon nitride (g-C3N4) as a visible-light-driven photocatalyst has been applied widely in water splitting, organic degradation, and the conversion of CO2.9–11 However, rapid charge recombination has limited its application in AOPs.12,13 To overcome this drawback, external element doping and copolymerization approaches have been taken into account and proved to be applicable.14–17 Fe is an environmentally friendly and earth-abundant element. It has been extensively investigated with the aim of improving the photocatalytic performance of g-C3N4via element doping. Meanwhile, it was certified in previous studies that the photocatalytic activity of g-C3N4 towards dye degradation could be remarkably improved via Fe doping, and Fe can exist in Fe–C3N4 in the form of Fe–N ligands.18–21 Also, photo-induced electrons from Fe–C3N4 can reduce Fe3+ to Fe2+ under visible light illumination.22 Hence, Fe–C3N4 can work as an efficient catalyst in a heterogeneous photo-Fenton-like system. It has already been reported that Fe–C3N4 is an active catalyst for the removal of organic pollutants in a photo-Fenton system. However, previous studies have focused on the preparation and optimization of Fe–C3N4 or coupled Fe–C3N4 materials.23–25 The influence of reaction parameters, especially involving various inorganic ions in natural water, on the activity and degradation pathway of a specific contaminant (MB) in a Fe–C3N4 based photo-Fenton system have not been systematically studied.
In this study, Fe–C3N4 was reported as an efficient photo-Fenton-like photocatalyst for MB degradation under simulated sunlight. Various Fe–C3N4 catalysts with different Fe doping amounts were synthesized and characterized. The effects of essential parameters, including the amount of Fe doping, H2O2 concentration, catalyst dosage, pH, MB concentration, the presence of naturally occurring inorganic ions (Cl−, NO3−, HCO3−, Al3+, Mg2+, and Ca2+) and the stability of Fe–C3N4, were investigated. In addition, scavenging tests were conducted to identify the active species for MB degradation in this catalytic process and, coupled with the intermediates observed via LC-MS, a possible degradation pathway for MB was proposed.
2. Experimental
2.1. Materials
The chemicals used were of commercially available analytical grade and were used as purchased without further purification. Melamine, ferric nitrate (Fe(NO3)3·9H2O2), hydrogen peroxide (H2O2, 30% w/w), sodium hydroxide (NaOH), hydrochloric acid (HCl), tertiary butanol (TBA), p-benzoquinone, sodium chloride (NaCl), sodium bicarbonate (NaHCO3), sodium nitrate (NaNO3), calcium chloride (CaCl2, P96.0%), magnesium chloride (MgCl2, P98.0%), aluminum chloride (AlCl3, P97.0%), potassium iodide (KI), and methylene blue (MB) were supplied by Nanning Lantian Experiment Equipment Co., Ltd (Nanning, China).
2.2. Synthesis of Fe–C3N4
The Fe–C3N4 catalyst was synthesized according to a method previously reported.26,27 Typically, 6 g of melamine was dispersed in 30 mL of deionized water under magnetic stirring. Then, different dosages of ferric nitrate (0.03, 0.06, 0.12, and 0.3 g) were added. The mixture was heated to 100 °C to remove water. The obtained solid product was milled and put into a 25 mL crucible, placed into a muffle furnace, and heated to 520 °C, where it was maintained for 2 h. Finally, yellow powder of Fe–C3N4 was obtained. The products were labeled x wt% Fe–C3N4, where x was the mass percent of ferric nitrate to melamine. Pristine g-C3N4 was synthesized via heating melamine directly under the same conditions without ferric nitrate.
2.3. Characterization of the catalyst
XRD with a 40 kV operating voltage and 300 mA current (DX-2700A) was applied to determine the crystal structure of g-C3N4 and x wt% Fe–C3N4. The morphologies of all the catalysts were characterized via S-3400N scanning electron microscopy. The functional groups and chemical states of C, N, and Fe on the catalyst surface were analyzed using a Nicolet iS 50 Fourier transform infrared spectrometer and ESCALAB 250XI+ X-ray photoelectron spectrometer. UV-vis absorption spectra were investigated via UV-2501 PC apparatus to determine the light adsorption region of the catalysts. Photoluminescence data were obtained using a ZLX-PL-I fluorescence spectrometer to evaluate the changes in charge carrier recombination in the prepared catalysts.
2.4. Experimental procedures
MB was chosen as the model compound to evaluate the efficiency of the heterogeneous photo-Fenton-like system. Investigations into the degradation of MB were conducted in a 250 mL quartz reactor at room temperature under magnetic stirring. MB solutions of different concentrations (20, 30, and 40 mg L−1) were prepared. During each experiment, 200 mL of MB was placed in the reactor. The initial pH of the MB solution was either not adjusted (initial pH of 6.86) or it was adjusted with 1 M NaOH and HCl solutions. To achieve adsorption equilibrium, Fe–C3N4 or g-C3N4 was added into MB solution under constant stirring for 30 min in the dark. After that, H2O2 was added, and the suspension was exposed to a 150 W xenon lamp (Fig. S1†). At a given time, about 5 mL of the suspension was removed. The suspension was filtered with a 0.22 μm filter immediately. To investigate the influence of inorganic ions on MB degradation, different concentrations of NaCl, NaNO3, NaHCO3, CaCl2, MgCl2, and AlCl3 were added. To carry out recycling experiments, Fe–C3N4 was removed from solution via centrifugation. Then, Fe–C3N4 was washed, dried, and applied in the next operation without purification.
2.5. Analytical methods
The absorbance of the MB solution was obtained using a 722N Vis spectrophotometer at the wavelength of 665 nm. The removal efficiency of MB was calculated viaeqn (1), where C0 and C are the initial concentration of MB and the concentration of MB after irradiation for a given time, respectively.
 |
1 |
Kinetics analysis of MB degradation was done using the pseudo-first-order rate model in eqn (2), where k is the pseudo-first-order rate constant.
 |
2 |
The reactive species were investigated via trapping experiments. For this, 2 mM TBA, 2 mM p-benzoquinone, and 2 mM KI were used as quenchers of ˙OH, ˙O2−, and h+, respectively. Liquid chromatography coupled with tandem mass spectrometry (LC/MS, AGILENT 6460, America) was applied to analyze the reaction intermediates formed during MB degradation. The related testing parameters are referred to in a previous report.28
3. Results and discussion
3.1. Characterization of g-C3N4 and Fe–C3N4
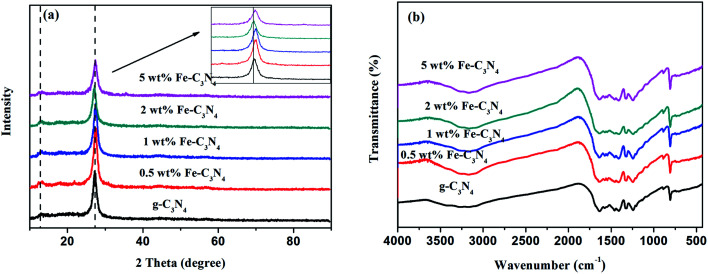
The morphologies and structures of g-C3N4 and x% Fe–C3N4 were observed via SEM (Fig. S2†). The results revealed that all prepared samples had a typical layered structure. The crystal phase structures of g-C3N4 and x wt% Fe–C3N4 were investigated via XRD, as displayed in Fig. 1(a). Two typical peaks were observed obviously in the XRD patterns of all catalysts. The weak peaks at 13.2° and 27.4° are the (100) and (002) facet diffraction peaks of g-C3N4, respectively.29 With an increase in the amount of Fe doping, the diffraction peak intensity of the (002) facet gradually weakened. This phenomenon indicated the inhibitory effects of Fe species on polymeric condensation and host–guest interactions.27 Furthermore, other characteristic Fe species peaks were not found, which may be caused by the limited amount of doped iron. Therefore, Fe was probably chemically coordinated to the g-C3N4 structure in the form of Fe–N bonds.30
Fig. 1. XRD patterns (a) and FT-IR spectra (b) of g-C3N4 and Fe–C3N4 samples.
The chemical compositions and structures of pristine g-C3N4 and x wt% Fe–C3N4 samples were investigated via FT-IR spectroscopy. As shown in Fig. 1(b), all materials exhibited characteristic peaks near 3000–3300, 1200–1700, 892, and 806 cm−1. Pristine g-C3N4 and x wt% Fe–C3N4 samples had similar characteristic peaks. This result indicated that Fe–C3N4 and pristine g-C3N4 had the same structure. The broad peak between 3000 and 3300 cm−1 was indicative of terminal N–H stretching vibrations. The peak from 1200 to 1700 cm−1 was due to the characteristic breathing modes of tri-s-triazine rings. The peak at 892 cm−1 was assigned to the cross-linked deformation mode of N–H. Additionally, the peak at 806 cm−1 was due to tri-s-triazine ring breathing vibrations.31,32
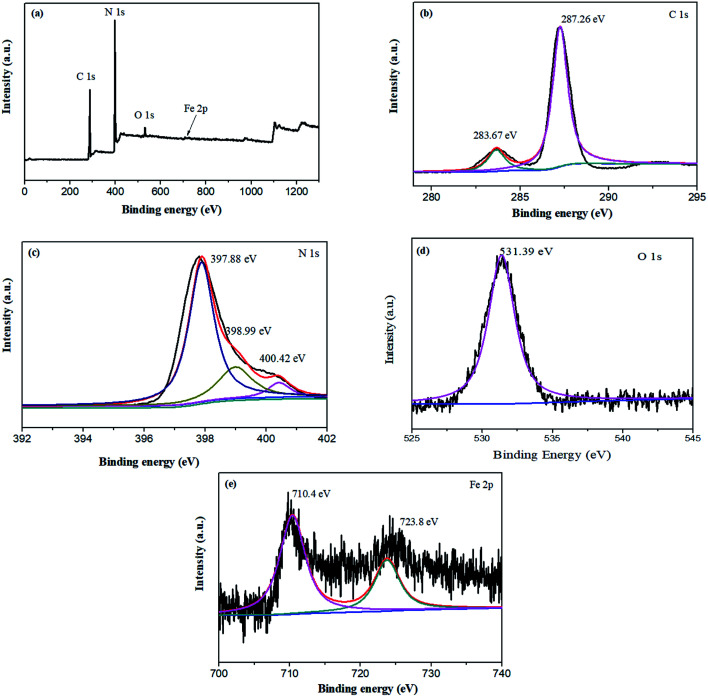
To analyze the elemental compositions and surface states of x wt% Fe–C3N4, an XPS investigation of 5 wt% Fe–C3N4 was carried out. As shown in Fig. 2(a), four elements were present in the XPS survey spectrum of 5% Fe–C3N4: C, N, O, and Fe. This result was the same as the EDS analysis, showing that Fe was successfully doped into the structure of 5 wt% Fe–C3N4 (Fig. S3†). The O signal was ascribed to O2 or H2O absorbed on the surface of 5 wt% Fe–C3N4.33 The Fe signal was weak because of the low amount of Fe doping. The C 1s XPS spectrum could be deconvoluted into two peaks with binding energies of 283.7 and 287.3 eV, as shown in Fig. 2(b). The peak at 283.7 eV is the characteristic peak of graphitic carbon (C C), and the peak at 287.3 eV is ascribed to sp2 bonded carbon (N–C C).3,34Fig. 2(c) shows that the N 1s XPS spectrum could be deconvoluted into three peaks with binding energies of 397.9, 399.1, and 400.4 eV. The main peak at 397.9 eV is due to sp2-bonded N atoms in the triazine rings. The peak at 399.1 eV is attributed to the presence of N–(C)3 or H–N–(C)2. The weaker peak at 400.4 eV is ascribed to –NH2 or NH groups.35 As seen in Fig. 2(d), the O 1s spectrum exhibits one characteristic peak at 531.39 eV, which was ascribed to surface adsorbed water in Fe–C3N4. Fe–O–Fe and Fe–OH were not found in Fe–C3N4 due to the absence of the characteristic diffraction peak of Fe–O–Fe and Fe–OH at 529.8 eV.24 Fe 2p3/2 XPS spectrum of 5% Fe–C3N4 shows a peak centered at 710.4 eV, as shown in Fig. 2(e). The binding energy peak of Fe3+ is in the range from 710.3 to 711.8 eV. Thus, the primary Fe state on the surface of Fe–C3N4 was Fe3+.23,27,36 Meanwhile, the binding energy of Fe species stabilized in the g-C3N4 structure through Fe–N bonds was close to 710.4 eV.20,37 Therefore, Fe had been successfully doped into g-C3N4 and Fe3+ was connected to N atoms via Fe–N(iii) coordinate bonds.
Fig. 2. XPS spectra of the 5 wt% Fe–C3N4 sample: (a) survey scan, (b) C 1s, (c) N 1s, (d) O 1s, and (e) Fe 2p.
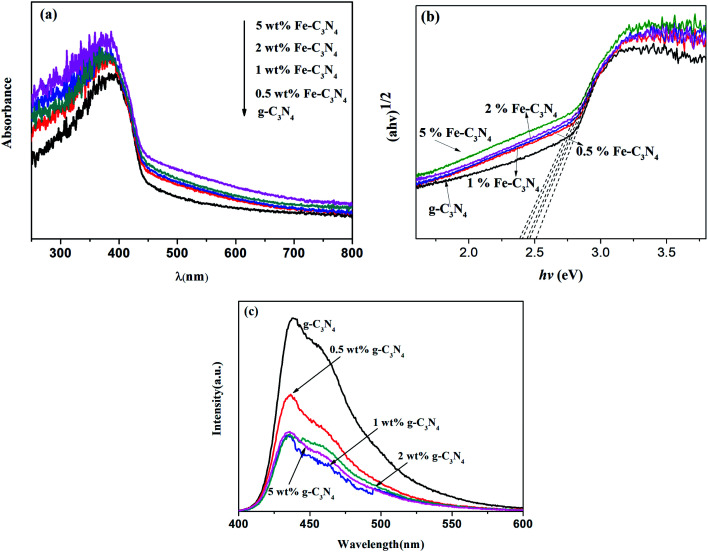
To estimate the optical properties of all the samples, UV-vis DRS studies were conducted. Fig. 3(a) shows the UV-vis DRS spectra of g-C3N4 and x wt% Fe–C3N4. The band gap energy (Eg) values of the prepared samples were obtained according to Tauc plots,38 as shown in Fig. 3(b). The Eg values of g-C3N4, 0.5 wt% Fe–C3N4, 1 wt% Fe–C3N4, 2 wt% Fe–C3N4, and 5 wt% Fe–C3N4 were 2.51, 2.46, 2.44, 2.40, and 2.38 eV, respectively. Light absorbance by all samples was observed to occur in the range of 250–800 nm. As the amount of iron doping increases, the light absorption range gradually increases. This phenomenon indicated that Fe doping could effectively enhance the light-harvesting abilities of g-C3N4. Pristine g-C3N4 showed an apparent absorption edge at approximately 456 nm. With an increase in the Fe doping, the adsorption edge of Fe–C3N4 displayed an obvious redshift from 456 to 477 nm. This result was caused by the formation of impurity energy levels due to Fe doping.26
Fig. 3. UV-vis diffuse reflectance spectra (a), Tauc plots (b), and photoluminescence emission spectra (c) of g-C3N4 and Fe–C3N4 samples.
The transfer and separation efficiencies of photogenerated charge carriers in g-C3N4 and Fe–C3N4 were investigated via photoluminescence (PL) measurements. As shown in Fig. 3(c), all samples showed a broad emission peak centered at approximately 438 nm. This result was due to the characteristic band–band PL phenomenon involving the photoexcited charge carriers in g-C3N4. The peak intensities of Fe–C3N4 were far weaker than that of pristine g-C3N4, obeying the order: g-C3N4 > 0.5% Fe–C3N4 > 5% Fe–C3N4 > 1% Fe–C3N4 ≈ 2% Fe–C3N4. The separation and transport efficiencies of photoexcited carriers were enhanced by Fe doping. This result suggested that Fe doping sites in the catalyst could trap photogenerated electrons and reduce the recombination of photogenerated electron–hole pairs.27 However, when the doping content of Fe is excessive, electron–hole recombination centers may be generated to suppress the separation of photogenerated charges.39
3.2. Catalytic performance of Fe-doped g-C3N4
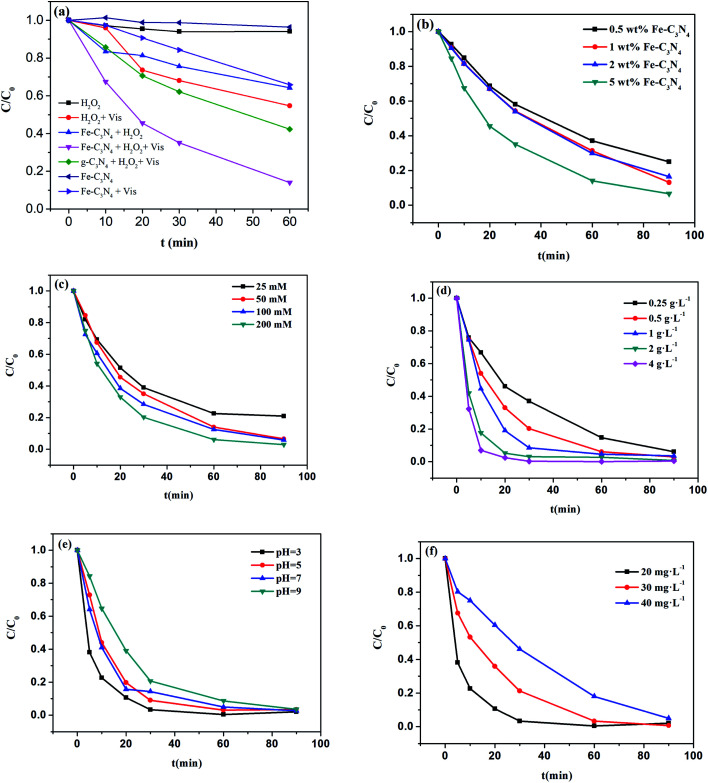
It was expected that Fe–C3N4 would show good performance for the removal of organic molecules in the photo-Fenton-like system. Cationic MB was chosen as a model pollutant for evaluating the catalytic activities of the synthesized materials. Experiments involving MB oxidation were conducted without pH control (initial pH = 6.86) and the results are shown in Fig. 4(a). The degradation efficiencies toward MB of H2O2 in the dark, H2O2 under simulated sunlight irradiation, Fe–C3N4 in the dark, Fe–C3N4 under irradiation, and Fe–C3N4 assisting H2O2 in the dark were 5.9%, 45.3%, 4.7%, 42.8%, and 35.8%, respectively. The degradation efficiency toward MB of the g-C3N4, H2O2, and simulated sunlight irradiation system was 71.6%. The Fe–C3N4 heterogeneous photo-Fenton-like system displayed excellent performance towards MB degradation compared to other reaction systems, and the degradation efficiency reached 85.9%. From the results, it was inferred that a synergetic effect was involved between Fe–C3N4 and H2O2 under simulated sunlight irradiation. The high MB removal efficiency in the Fe–C3N4 heterogeneous photo-Fenton-like system may have arisen from the following: (1) the photocatalytic efficiency of g-C3N4 was improved by Fe doping; (2) the photo-generated electrons of Fe–C3N4 were captured by H2O2, and the separation of photo-generated electrons and holes was enhanced; and (3) H2O2 was activated to generate ˙OH by photo-generated electrons and the Fe3+/Fe2+ cycle under light irradiation.
Fig. 4. The decolorization of MB in different systems (a), the effect of the amount of Fe doping (b), the effect of H2O2 concentration (c), the effect of catalyst dosage (d), the effect of pH (e), and the effect of the MB initial concentration (f). Experimental conditions: (a) [MB] = 20 mg L−1, [5 wt% Fe–C3N4] = 0.5 g L−1, [H2O2] = 50 mM, pH = 6.86; (b) [MB] = 20 mg L−1, [Fe–C3N4] = 0.5 g L−1, [H2O2] = 50 mM, pH = 6.86; (c) [MB] = 20 mg L−1, [5 wt% Fe–C3N4] = 0.5 g L−1, pH = 6.86; (d) [MB] = 20 mg L−1, [H2O2] = 200 mM, pH = 6.86; (e) [MB] = 20 mg L−1, [5 wt% Fe–C3N4] = 2 g L−1, [H2O2] = 200 mM; and (f) [5 wt% Fe–C3N4] = 2 g L−1, [H2O2] = 200 mM, pH = 3.
3.3. Effects of reagent doses and pH on the degradation of MB
The effect of the amount of Fe doping on MB degradation was investigated in the range of 0.5–5 wt%, and the results are shown in Fig. 4(b). From the results, increasing the amount of Fe doping had a promoting effect on the degradation of MB. With an increase in the amount of Fe doping from 0.5 wt% to 5 wt%, the MB degradation efficiency increased from 75% to 95%. This result demonstrated that the amount of Fe doping plays a major role in the degradation of MB, and that Fe–N bonds in the catalyst can activate H2O2 to produce hydroxyl radicals. As the content of Fe3+ doping increased, more ·OH was generated in the system for the degradation of MB.
The effect of H2O2 concentration was investigated in the range of 25 to 200 mM, as shown in Fig. 4(c). The MB degradation performance was enhanced upon increasing the concentration of H2O2. The degradation efficiency increased from 79.2% to 97.1% when the concentration of H2O2 increased from 25 to 200 mM. This result may be attributed to an increase in the amount of ·OH produced by Fe–C3N4 and H2O2 under simulation sunlight irradiation. However, the degradation efficiency showed little change when the dosage of H2O2 was increased from 100 to 200 mM. Therefore, there was no requirement to continue increasing the concentration of H2O2 further.
To investigate the influence of the dosage of Fe–C3N4, five different values were tested, as shown in Fig. 4(d). An increase in the Fe–C3N4 dosage from 0.25 to 2 g L−1 had a promoting effect on the degradation of MB. The degradation efficiency increased significantly from 62.99% to 96.95% within 30 minutes. The number of active sites in the Fe–C3N4 heterogenous photo-Fenton-like system affected the degradation rate of MB, and the degradation rate was limited at a low Fe–C3N4 dosage by reason of a lack of active sites. However, with an increase in the Fe–C3N4 dosage from 2 to 4 g L−1, the MB degradation curves showed very similar profiles across 90 minutes. The MB photocatalytic degradation performance was determined by the number of active sites on the catalyst and the penetration of simulated solar irradiation. Upon increasing the dosage of Fe–C3N4, the number of active sites is increased and more photoelectrons are generated, resulting in more ˙OH being produced from H2O2. However, light reflectance and shielding effects can occur at excess Fe–C3N4 dosages. Therefore, the degradation efficiency of MB showed no noticeable change with an increase of Fe–C3N4 from 2 to 4 g L−1.
The effect of pH within the range of 3–9 on MB degradation in the Fe–C3N4 heterogeneous photo-Fenton-like system was investigated. As shown in Fig. 4(e), the catalyst remains highly active towards MB degradation over a broad initial pH range, from 3 to 9. When the pH was increased from 3 to 9, the efficiency of MB degradation decreased slightly. Interestingly, in the first 30 min, the heterogeneous photo-Fenton-like system degradation efficiencies at pH = 3, 5, 7, and 9 were 97%, 91%, 85%, and 79%, respectively. This phenomenon was attributed to the formation of different Fe–N ligands in the system. Under acidic conditions, the produced Fe–N ligands were more conducive to the activation of H2O2 compared to the ligands formed under alkaline conditions. Besides, H2O2 can be consumed and decomposed to H2O and O2 under alkaline conditions. In general, after 90 min, the MB decolorization rates of all samples were more than 90% as the pH rose from 3 to 9. Hence, the Fe–C3N4 heterogeneous photo-Fenton-like system showed a wide pH operating range compared to conventional Fenton systems.
The effect of the initial MB concentration on degradation was examined in the range of 20 to 40 mg L−1. As shown in Fig. 4(f), the MB degradation efficiency within 90 min reached almost 100% at all increasing MB concentrations from 20 to 40 mg L−1. However, in the first 30 min, the degradation efficiency decreased from 96.7% to 53.9% as the MB concentration was increased from 20 to 40 mg L−1. This result was attributed to the number of active species. With an increase in the initial MB concentration, more active species were required for the degradation of MB. However, the number of active species in the system theoretically remained constant at a fixed Fe–C3N4 dosage, H2O2 concentration, and light intensity. Thus, the number of active species was inadequate for higher MB concentrations.
3.4. Effects of inorganic ions on the degradation of MB
Various inorganic ions may co-exist with dye wastewater. Thus, examining the effects of co-existing ions on MB degradation is very important and beneficial for a realistic dye treatment process. Previous studies have confirmed that the presence of some inorganic ions in the photocatalytic system can affect the degradation of MB.40–43 To investigate the effects of various co-existing inorganic ions on MB degradation, the photocatalytic degradation of MB was conducted with six typical inorganic ions: nitrate (NO3−), chloride (Cl−), bicarbonate (HCO3−), aluminum (Al3+), magnesium (Mg2+), and calcium (Ca2+). Considering that natural water does not contain buffer solution, and that the introduction of buffer solution will make the system more complicated, the influence of inorganic ions was not investigated in buffer solution.
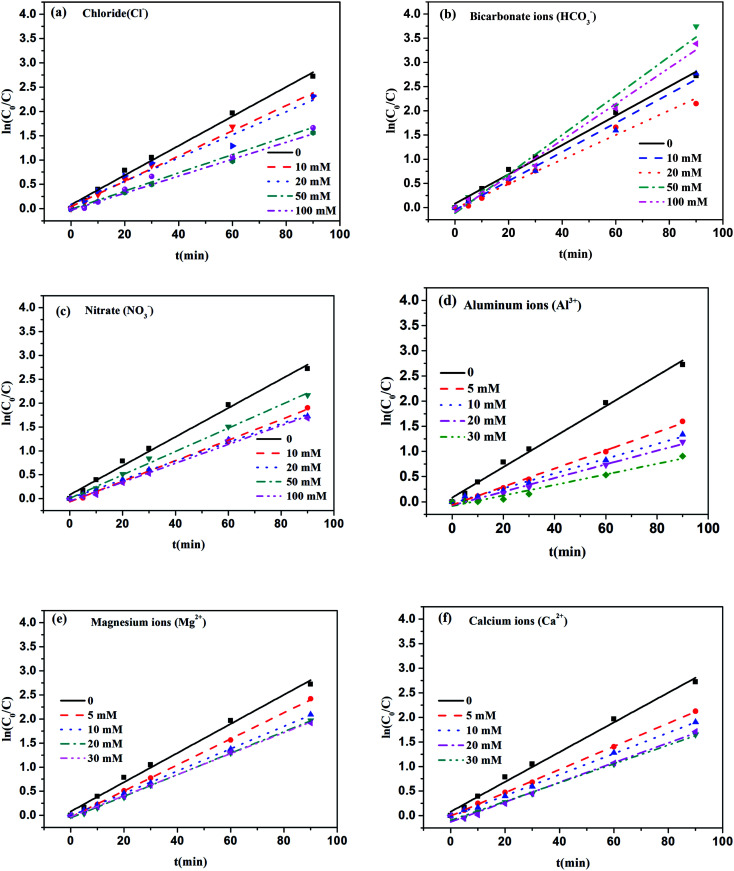
The effect of Cl− on the degradation of MB in the Fe–C3N4 heterogenous photo-Fenton-like system was investigated at different Cl− concentrations from 0 to 100 mM. Fig. 5(a) shows that the efficient degradation of MB was inhibited by Cl−. Adding different concentrations of Cl− obviously decreased the k value of the MB degradation rate (Fig. 5(a) and Table S1†). The k value of the MB degradation rate decreased from 0.0302 to 0.0187 min−1 upon increasing the concentration of Cl− from 0 to 100 mM. This phenomenon could be attributed to the reaction of ·OH with Cl−, which generated ClOH˙− (eqn (3)), whose reactivity is not as high as ˙OH. Under these circumstances, Cl− act as an ·OH scavenger, inhibiting MB degradation.43
Fig. 5. Effects of inorganic anions and cations on MB degradation under simulated solar light irradiation. Experimental conditions: [MB] = 20 mg L−1; [5 wt% Fe–C3N4] = 0.5 g L−1; no pH adjustment (original pH = 6.86); [Cl−] (a), [HCO3−] (b), and [NO3−] (c) = 10, 20, 50, and 100 mM; [Al3+] (d), [Mg2+] (e), and [Ca2+] (f) = 5, 10, 20, and 30 mM.
Fig. 5(b) shows the effect of HCO3− on MB degradation in the Fe–C3N4 heterogenous photo-Fenton-like system. With an increase in the HCO3− concentration from 0 to 20 mM, the k value of the MB degradation rate decreased from 0.0303 to 0.0299 min−1 (Table S1†). However, the k value improved with a further increase in the HCO3− concentration. It has been found that HCO3− could react with ˙OH to produce the carbonate radical (CO3−˙) (eqn (4)). Meanwhile, the ionization reactions of carbonic acid to reach equilibration can occur (eqn (5)–(8)),43 and the concentration of HCO3− could influence the pH of the reaction system. Therefore, the effect of different HCO3− concentrations on the degradation of MB can be explained based on the following reasons: (1) at a low HCO3− concentration (10 and 20 mM), HCO3− mostly plays the role of being an ˙OH scavenger, and the produced CO3−˙ is not involved in the degradation of MB. The degradation rate of MB decreased due to ˙OH scavenging; (2) at a high HCO3− concentration (50 and 100 mM), the degradation rate increased because abundant CO3−· was produced and participated in MB degradation. Besides, with an increase in the HCO3− concentration, the pH of the reaction system changed from neutral to alkaline, which could result in negatively charged Fe–C3N4, so more MB molecules could be contacted and degraded.
As for NO3−, Fig. 5(c) shows how the MB degradation rate k value varies at different concentrations from 0 to 100 mM. NO3− showed an inhibitory effect on the Fe–C3N4 heterogenous photo-Fenton system. With an increase in the NO3− concentration from 0 to 20 mM, the k value of the MB degradation rate decreased from 0.0303 to 0.0195 min−1 (Table S1†). This result might be attributed to a reaction between ·OH and NO3−. ·OH could react with NO3− to produce the nitrate radical (NO3−·) (eqn (9)), whose redox ability is weaker than ·OH.43 However, when the NO3− concentration was further increased from 20 to 50 mM, the k value of the MB degradation rate increased from 0.0195 to 0.0245 min−1. When the concentration of NO3− was more than 20 mM, the k value of MB degradation was improved. This phenomenon might be due to the formation of ·OH under simulated solar irradiation (eqn (10)).43 Interestingly, upon further increasing the NO3− concentration to 100 mM, the k value of MB degradation rate decreased to 0.0198 min−1. When the concentration of NO3− was further increased, more ·OH was consumed by NO3− rather than being produced. Therefore, the MB removal efficiency was irregularly inhibited by NO3−.
The influence of inorganic cations on the degradation of MB in the Fe–C3N4 heterogenous photo-Fenton system was investigated at various concentrations from 0 to 30 mM. Inorganic cations, including Al3+, Mg2+, and Ca2+, exhibited an inhibitory effect on the degradation of MB, as shown in Fig. 5(d–f) and Table S2.† Among the three kinds of cations, Al3+ ions showed the strongest negative effect on the k value of the MB degradation rate; the k value decreased from 0.0303 to 0.0105 min−1 upon increasing the concentration of Al3+ from 5 to 30 mM. Compared with Mg2+ and Ca2+, the k value decreased 2.88-fold with 30 mM Al3+ addition. This result could be explained based on Al3+, Mg2+ and Ca2+ being absorbed onto the Fe–C3N4 surface. At the same time, the accompanying shielding effect, reduction in the number of active sites, and reduced penetration of light irradiation caused the low photocatalytic efficiency.42,44–47
| ˙OH + Cl− → ClOH˙− | 3 |
| ˙OH + HCO3− → CO3−˙ + H2O | 4 |
| H2CO3 ↔ H+ + HCO3−, pka1 = 6.38 | 5 |
| HCO3− ↔ H+ + CO32−, pka2 = 10.38 | 6 |
| CO32− + H2O → OH− + HCO3− | 7 |
| HCO3− + H2O → OH− + H2CO3 | 8 |
| ˙OH + NO3– → NO3−˙ | 9 |
| NO3− + H2O + hv → NO2˙ + OH− + ·OH | 10 |
3.5. Stability of the Fe–C3N4 catalyst
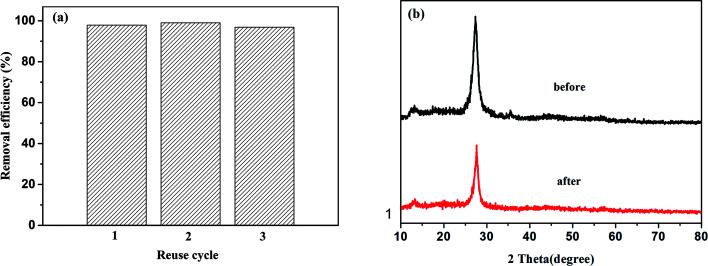
Focusing on the practical application of the Fe–C3N4 heterogeneous photo-Fenton-like system, the stability of the catalyst was examined. As shown in the results in Fig. 6(a), the MB degradation efficiency was still more than 90% within 90 min after three cycles. The residual amount of iron ions in solution after the reaction was measured via atomic absorption spectrophotometry (AA-700, Shimadzu International Trading Co., Ltd.), and the concentration of irons ion was 0.4781 mg L−1. The concentration of leached Fe was lower than the drinking water limitations in the EU and US (<2 ppm).8,23,48 Also, XRD results from used Fe–C3N4 showed that the XRD pattern of Fe–C3N4 had not obviously changed, as shown in Fig. 6(b). These results demonstrated that Fe–C3N4 has good reusability and stability.
Fig. 6. The degradation efficiency of MB during recycling experiments (a) and XRD survey scans of Fe–C3N4 before and after the decolorization of MB in the Fe–C3N4 heterogenous photo-Fenton-like system (b). Experimental conditions: (a) and (b) [MB] = 20 mg L−1, [5 wt% Fe–C3N4] = 2 g L−1, [H2O2] = 200 mM, pH = 3.
3.6. Degradation mechanism of the Fe–C3N4 heterogeneous photo-Fenton-like system
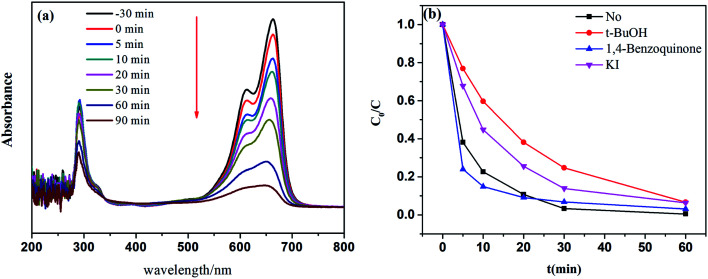
It was considered that MB molecules were broken up and degraded into smaller molecules in the Fe–C3N4 heterogenous photo-Fenton-like system. To demonstrate this hypothesis, UV-vis absorption spectra were obtained, as shown in Fig. 7(a). The results showed the MB spectral absorption variations with irradiation time. Two main absorbance peaks were observed at 665 and 290 nm. The peak at 665 nm was attributed to the chromophore (–C S) of MB, and the peak at 290 nm was attributed to the unsaturated conjugated aromatic rings.28,49,50 It was evident that the adsorption peaks at 665 and 290 nm decreased significantly with irradiation time, suggesting that the conjugate structure of MB was destroyed and the aromatic rings of MB were degraded in the system. Besides, as the reaction time increased, the position of the maximum absorbance peak at 665 nm did not shift. Related research has shown that blue-shifting of the MB peak at 665 nm is related to the occurrence of N-demethylation intermediates of MB.28 Thus, we inferred that the initial step of MB degradation in the Fe–C3N4 heterogeneous photo-Fenton system might not involve N-demethylation. To investigate the reactive MB degradation species in the system, quenching experiments involving TBA, KI and 1,4-benzoquinone were conducted.51 As shown in Fig. 7(b), in the first 30 min, the MB degradation efficiency decreased from 96.7% to 93.2%, 86.1%, and 75.3% after adding 1,4-benzoquinone, KI, and TBA, respectively. It was found that 1,4-benzoquinone had little effect on MB removal in this system, and TBA showed a significant inhibitory effect on MB degradation. This result implies the fact that ˙OH is a primary active species in the system. When 1,4-benzoquinone was added to the reaction system, the degradation efficiency of MB was mildly affected, but it did not decrease within 30 min and was nearly similar to the performance of the control experiment. This result demonstrated that O2−˙ was rarely or not at all formed in this reaction system. However, the MB degradation efficiency was enhanced when 1,4-benzoquinone was added into the catalytic system in the first 20 min. This phenomenon may be due to the activation of H2O2 by 1,4-benzoquinone. Several literature studies have reported that peroxydisulfate and H2O2 can be activated by organic quinones. For instance, Zhou et al. found that peroxymonosulfate could be activated by benzoquinone.52 Fang et al. reported that 1,4-benzoquinone, 2-methyl-1,4-benzoquinone, and 2-chloro-1,4-benzoquinone could enhance the 2,4,4′-trichlorobiphenyl degradation efficiency when using peroxydisulfate.53 Zhu et al. reported that halogenated quinones could activate H2O2 to produce ˙OH.54 Besides, Chen et al. investigated the degradation of tetracycline using H2O2 alone, and a similar phenomenon was found: the tetracycline degradation efficiency was enhanced in the first 45 min when benzoquinone was added into the catalytic system.55
Fig. 7. The temporal evolution of UV-vis spectra during the decolorization of MB in the Fe–C3N4 heterogenous photo-Fenton-like system (a) and influence of radical scavengers on the decolorization of MB (b). Experimental conditions: (a) [MB] = 20 mg L−1, [5 wt% Fe–C3N4] = 0.5 g L−1, [H2O2] = 50 mM, pH = 3; (b) [MB] = 20 mg L−1, [5 wt% Fe–C3N4] = 2 g L−1, [H2O2] = 200 mM, [t-BuOH] = 2 mM, [1,4-benzoquinone] = 2 mM, [KI] = 2 mM, pH = 3.
For degradation pathway analysis, the intermediate products resulting from MB degradation over 60 min were analyzed via LC-MS. According to the results, nine primary intermediate product ions at m/z values of 305.16, 301.17, 143.09, 135.12, 130.16, 109.10, 95.09, 93.04, and 75.03 were detected at different retention times, which probably correspond to C16H23N3SO, C16H19N3SO, C6H6O4, C7H5NS, C6H13NO2, C6H7NO, C6H6O, C6H7N, and C2H2O3, respectively (Table S3†). It has been confirmed that the benzene ring of MB could be hydroxylated by ˙OH in previous work.28,56,57 However, we did not observe the corresponding intense fragments in this study. Thus, ˙OH may play a role in aromatic ring-opening and oxidation. Meanwhile, based on intermediates from previous work,58–65 the possible pathway of MB degradation in the Fe–C3N4 heterogenous photo-Fenton-like system is proposed in Fig. S4.† Cl in the MB molecule was firstly ionized, and after that C–N+ C and C–S+–C were destroyed. Then, the –N (CH3)2 groups were also degraded, inducing the breakup of the aromatic rings. In the process, intermediates such as dl-norleucine, phenol, and benzothiadiazole were produced, which were partly further mineralized to carbon dioxide, water, and inorganic anions (SO42−, NH4+, and NO3−).
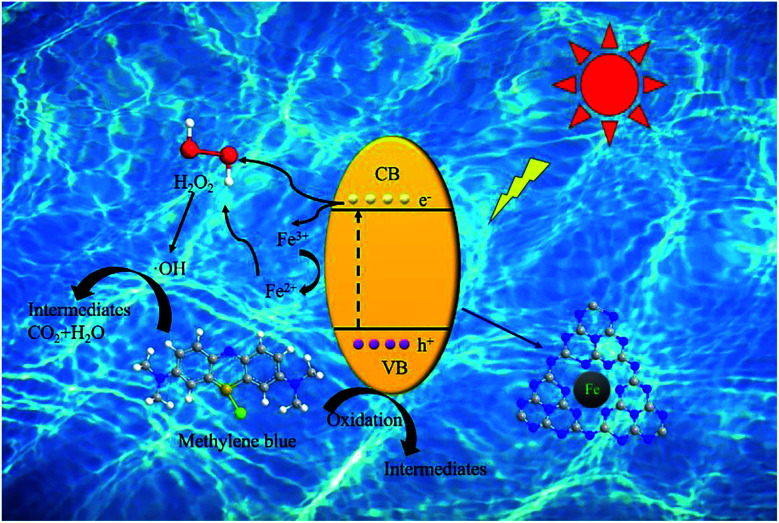
The XPS results showed that Fe(iii)–N was the main active site for the photo-Fenton-like reaction. By combining the XPS results and previous work,23,66,67 we propose a possible mechanism in this catalytic system (Fig. 8). There are two pathways for generating ·OH (eqn 11–13): (1) Fe–C3N4 was excited to generate electrons and holes under simulated sunlight. Fe(iii)–N accepted electrons and transformed to Fe(ii)–N. Fe(ii)–N and H2O2 combined to generate Fe(iii)–N and ·OH via electron transfer. At the same time, a series of chain reactions was initiated, including the formation of redox cycles of ·OH and Fe(iii)/Fe(ii); (2) H2O2 decomposed to ·OH under simulated sunlight and was activated by photogenerated electrons from Fe–C3N4. Theoretically, the VB of g-C3N4 is at +1.57 V and the redox potential of ·OH/OH− is +1.99 V. Thus, ·OH cannot be generated from VB holes in g-C3N4. In the Fe–C3N4 heterogenous photo-Fenton-like system, MB was absorbed on the surface of Fe–C3N4 firstly. Then, MB was attacked by ·OH and transformed into small organic molecules, inorganic ions, CO2, and H2O.
| Fe(iii)–N + e− → Fe(ii)–N | 11 |
| Fe(ii)–N + H2O2 → ˙OH + Fe(iii)–N | 12 |
| H2O2 + e− → ˙OH + OH− | 13 |
Fig. 8. A schematic diagram of the Fe–C3N4 catalyzed heterogeneous photo-Fenton-like reaction.
4. Conclusions
In this study, Fe–C3N4 was fabricated and applied in a heterogeneous photo-Fenton-like system. Fe–C3N4 exhibited superb performance for the degradation of MB in the pH range of 3–9. The effects of various inorganic ions on the degradation of MB were studied; Cl− and NO3− inhibited the degradation of MB and HCO3− exhibited a dual effect. The presence of cations (Al3+, Mg2+, and Ca2+) inhibits the degradation of MB, and the order of the inhibitory effect was: Al3+ > Ca2+ > Mg2+. Catalyst cycling experiments illustrated that Fe–C3N4 was highly stable, showing the consistently high degradation of MB. According to quenching experiments, the dominant active species was ·OH. In short, this photo-assisted heterogeneous Fenton-like process showed the highly efficient removal of MB while overcoming common issues that occur in conventional Fenton systems.
Conflicts of interest
There are no conflicts to declare.
Supplementary Material
Acknowledgments
This study was funded by the National Natural Science Foundation of China (grant number 21367003), Guangxi Major Project Science and Technology (grant number AA17129001), and Guangxi Key Laboratory of Clean Pulp & Papermaking and Pollution Control Open Foundation (grant number KF201724).
Electronic supplementary information (ESI) available. See DOI: 10.1039/d0ra00993h
References
- Miklos D. B. Remy C. Jekel M. Linden K. G. Drewes J. E. Hübner U. Water Res. 2018;139:118–131. doi: 10.1016/j.watres.2018.03.042. [DOI] [PubMed] [Google Scholar]
- Guo T. Wang K. Zhang G. Wu X. Appl. Surf. Sci. 2019;469:331–339. doi: 10.1016/j.apsusc.2018.10.183. [DOI] [Google Scholar]
- Xiong Z. Wang Z. Muthu M. Zhang Y. J. Hazard. Mater. 2019;373:565–571. doi: 10.1016/j.jhazmat.2019.03.114. [DOI] [PubMed] [Google Scholar]
- Yang S. Wu P. Liu J. Chen M. Ahmed Z. Zhu N. Chem. Eng. J. 2018;350:484–495. doi: 10.1016/j.cej.2018.04.175. [DOI] [Google Scholar]
- Liu J. Wu P. Yang S. Rehman S. Ahmed Z. Zhu N. Dang Z. Liu Z. Appl. Catal., B. 2020;261:118232. doi: 10.1016/j.apcatb.2019.118232. [DOI] [Google Scholar]
- Cai C. Zhang Z. Liu J. Shan N. Zhang H. Dionysiou D. D. Appl. Catal., B. 2016;182:456–468. doi: 10.1016/j.apcatb.2015.09.056. [DOI] [Google Scholar]
- Li X. Y. Pi Y. H. Wu L. Q. Xia Q. B. Wu J. L. Li Z. Xiao J. Appl. Catal., B. 2017;202:653–663. doi: 10.1016/j.apcatb.2016.09.073. [DOI] [Google Scholar]
- Li X. Liu X. Xu L. Wen Y. Ma J. Wu Z. Appl. Catal., B. 2015;165:79–86. doi: 10.1016/j.apcatb.2014.09.071. [DOI] [Google Scholar]
- Fu J. Yu J. Jiang C. Cheng B. Adv. Energy Mater. 2018;8:1701503. doi: 10.1002/aenm.201701503. [DOI] [Google Scholar]
- Sun Z. Wang H. Wu Z. Wang L. Catal. Today. 2018;300:160–172. doi: 10.1016/j.cattod.2017.05.033. [DOI] [Google Scholar]
- Zhang X. Zhang X. Li J. Sun J. Bian J. Wang J. Qu Y. Yan R. Qin C. Jing L. Appl. Catal., B. 2018;237:50–58. doi: 10.1016/j.apcatb.2018.05.034. [DOI] [Google Scholar]
- Nikokavoura A. Trapalis C. Appl. Surf. Sci. 2018;430:18–52. doi: 10.1016/j.apsusc.2017.08.192. [DOI] [Google Scholar]
- Yu Y. Yan W. Wang X. Li P. Gao W. Zou H. Wu S. Ding K. Adv. Mater. 2018;30:1705060. doi: 10.1002/adma.201705060. [DOI] [PubMed] [Google Scholar]
- Ma X. Lv Y. Xu J. Liu Y. Zhang R. Zhu Y. J. Phys. Chem. C. 2012;116:23485–23493. doi: 10.1021/jp308334x. [DOI] [Google Scholar]
- Jiang J. Cao S. Hu C. Chen C. Chin. J. Catal. 2017;38:1981–1989. doi: 10.1016/S1872-2067(17)62936-X. [DOI] [Google Scholar]
- Yan W. Yan L. Jing C. Appl. Catal., B. 2019;244:475–485. doi: 10.1016/j.apcatb.2018.11.069. [DOI] [Google Scholar]
- Wang Y. Zhao S. Zhang Y. Chen W. Yuan S. Zhou Y. Huang Z. Appl. Surf. Sci. 2019;463:1–8. doi: 10.1016/j.apsusc.2018.08.215. [DOI] [Google Scholar]
- Hu S. Ma L. You J. Li F. Fan Z. Lu G. Liu D. Gui J. Appl. Surf. Sci. 2014;311:164–171. doi: 10.1016/j.apsusc.2014.05.036. [DOI] [Google Scholar]
- Liu Q. Chen T. Guo Y. Zhang Z. Fang X. Appl. Catal., B. 2017;205:173–181. doi: 10.1016/j.apcatb.2016.12.028. [DOI] [Google Scholar]
- Gao J. Wang Y. Zhou S. Lin W. Kong Y. ChemCatChem. 2017;9:1708–1715. doi: 10.1002/cctc.201700492. [DOI] [Google Scholar]
- Oh W. D. Chang V. W. C. Hu Z.-T. Goei R. Lim T. T. Chem. Eng. J. 2017;323:260–269. doi: 10.1016/j.cej.2017.04.107. [DOI] [Google Scholar]
- Chen X. Zhang J. Fu X. Antonietti M. Wang X. J. Am. Chem. Soc. 2009;131:11658–11659. doi: 10.1021/ja903923s. [DOI] [PubMed] [Google Scholar]
- Ma J. Yang Q. Wen Y. Liu W. Appl. Catal., B. 2017;201:232–240. doi: 10.1016/j.apcatb.2016.08.048. [DOI] [Google Scholar]
- Qian X. Wu Y. Kan M. Fang M. Yue D. Zeng J. Zhao Y. Appl. Catal., B. 2018;237:513–520. doi: 10.1016/j.apcatb.2018.05.074. [DOI] [Google Scholar]
- Li X. Pi Y. Wu L. Xia Q. Wu J. Li Z. Xiao J. Appl. Catal., B. 2017;202:653–663. doi: 10.1016/j.apcatb.2016.09.073. [DOI] [Google Scholar]
- Song X. Tao H. Chen L. Sun Y. Mater. Lett. 2014;116:265–267. doi: 10.1016/j.matlet.2013.11.043. [DOI] [Google Scholar]
- Hu S. Jin R. Lu G. Liu D. Gui J. RSC Adv. 2014;4:24863–24869. doi: 10.1039/C4RA03290J. [DOI] [Google Scholar]
- Liu Y. Jin W. Zhao Y. Zhang G. Zhang W. Appl. Catal., B. 2017;206:642–652. doi: 10.1016/j.apcatb.2017.01.075. [DOI] [Google Scholar]
- Yan S. Li Z. Zou Z. Langmuir. 2009;25:10397–10401. doi: 10.1021/la900923z. [DOI] [PubMed] [Google Scholar]
- Li H. Shan C. Pan B. Environ. Sci. Technol. 2018;52:2197–2205. doi: 10.1021/acs.est.7b05563. [DOI] [PubMed] [Google Scholar]
- Wang K. Li Q. Liu B. Cheng B. Ho W. Yu J. Appl. Catal., B. 2015;176–177:44–52. [Google Scholar]
- Cui Y. Ding Z. Liu P. Antonietti M. Fu X. Wang X. Phys. Chem. Chem. Phys. 2012;14:1455–1462. doi: 10.1039/C1CP22820J. [DOI] [PubMed] [Google Scholar]
- Hu S. Chen X. Li Q. Li F. Fan Z. Wang H. Wang Y. Zheng B. Wu G. Appl. Catal., B. 2017;201:58–69. doi: 10.1016/j.apcatb.2016.08.002. [DOI] [Google Scholar]
- Du X. Yi X. Wang P. Deng J. Wang C.-c. Chin. J. Catal. 2019;40:70–79. doi: 10.1016/S1872-2067(18)63160-2. [DOI] [Google Scholar]
- Mirzaei A. Chen Z. Haghighat F. Yerushalmi L. Appl. Catal., B. 2019;242:337–348. doi: 10.1016/j.apcatb.2018.10.009. [DOI] [Google Scholar]
- Chen M. Wu P. Yu L. Liu S. Ruan B. Hu H. Zhu N. Lin Z. J. Environ. Manag. 2017;192:31–38. doi: 10.1016/j.jenvman.2017.01.038. [DOI] [PubMed] [Google Scholar]
- Wang X. Chen X. Thomas A. Fu X. Antonietti M. Adv. Mater. 2009;21:1609–1612. doi: 10.1002/adma.200802627. [DOI] [Google Scholar]
- Guo T. Wang K. Zhang G. Wu X. Appl. Surf. Sci. 2019;469:331–339. doi: 10.1016/j.apsusc.2018.10.183. [DOI] [Google Scholar]
- Ong W. J. Tan L. L. Ng Y. H. Yong S.-T. Chai S. P. Chem. Rev. 2016;116:7159–7329. doi: 10.1021/acs.chemrev.6b00075. [DOI] [PubMed] [Google Scholar]
- Guillard C. Lachheb H. Houas A. Ksibi M. Elaloui E. Herrmann J.-M. J. Photochem. Photobiol. Chem. 2003;158:27–36. doi: 10.1016/S1010-6030(03)00016-9. [DOI] [Google Scholar]
- Rincón A. G. Pulgarin C. Appl. Catal., B. 2004;51:283–302. doi: 10.1016/j.apcatb.2004.03.007. [DOI] [Google Scholar]
- Konstantinou I. K. Albanis T. A. Appl. Catal., B. 2004;49:1–14. doi: 10.1016/j.apcatb.2003.11.010. [DOI] [Google Scholar]
- Hu C. Yu J. C. Hao Z. Wong P. K. Appl. Catal., B. 2003;46:35–47. doi: 10.1016/S0926-3373(03)00139-5. [DOI] [Google Scholar]
- Gao X. Zhang X. Wang Y. Peng S. Yue B. Fan C. Chem. Eng. J. 2015;273:156–165. doi: 10.1016/j.cej.2015.03.063. [DOI] [Google Scholar]
- Liu S. Wu P. Chen M. Yu L. Kang C. Zhu N. Dang Z. Environ. Pollut. 2017;228:277–286. doi: 10.1016/j.envpol.2017.03.082. [DOI] [PubMed] [Google Scholar]
- Liu C. Wu P. Zhu Y. Tran L. Chemosphere. 2016;144:1026–1032. doi: 10.1016/j.chemosphere.2015.09.063. [DOI] [PubMed] [Google Scholar]
- Chen L. Wu P. Chen M. Lai X. Ahmed Z. Zhu N. Dang Z. Bi Y. Liu T. Appl. Clay Sci. 2018;159:74–82. doi: 10.1016/j.clay.2017.12.050. [DOI] [Google Scholar]
- Yang X. J. Xu X. M. Xu J. Han Y.-f. J. Am. Chem. Soc. 2013;135:16058–16061. doi: 10.1021/ja409130c. [DOI] [PubMed] [Google Scholar]
- Li Y. Zhang F. S. Chem. Eng. J. 2010;158:148–153. doi: 10.1016/j.cej.2009.12.021. [DOI] [Google Scholar]
- Zhou B. Zhao X. Liu H. Qu J. Huang C. P. Appl. Catal., B. 2010;99:214–221. doi: 10.1016/j.apcatb.2010.06.022. [DOI] [Google Scholar]
- Wang J. Xia Y. Zhao H. Wang G. Xiang L. Xu J. Komarneni S. Appl. Catal., B. 2017;206:406–416. doi: 10.1016/j.apcatb.2017.01.067. [DOI] [Google Scholar]
- Zhou Y. Jiang J. Gao Y. Ma J. Pang S. Y. Li J. Lu X. T. Yuan L. P. Environ. Sci. Technol. 2015;49:12941–12950. doi: 10.1021/acs.est.5b03595. [DOI] [PubMed] [Google Scholar]
- Fang G. Gao J. Dionysiou D. D. Liu C. Zhou D. Environ. Sci. Technol. 2013;47:4605–4611. doi: 10.1021/es400262n. [DOI] [PubMed] [Google Scholar]
- Zhu B. Z. Zhao H. T. Kalyanaraman B. Frei B. Free Radic. Biol. Med. 2002;32:465–473. doi: 10.1016/S0891-5849(01)00824-3. [DOI] [PubMed] [Google Scholar]
- Chen Y. Y. Ma Y. L. Yang J. Wang L. Q. Lv J. M. Ren C. J. Chem. Eng. J. 2017;307:15–23. doi: 10.1016/j.cej.2016.08.046. [DOI] [Google Scholar]
- Oliveira L. C. A. Gonçalves M. Guerreiro M. C. Ramalho T. C. Fabris J. D. Pereira M. C. Sapag K. Appl. Catal., A. 2007;316:117–124. doi: 10.1016/j.apcata.2006.09.027. [DOI] [Google Scholar]
- Bicalho H. A. Lopez J. L. Binatti I. Batista P. F. R. Ardisson J. D. Resende R. R. Lorençon E. Mol. Catal. 2017;435:156–165. doi: 10.1016/j.mcat.2017.04.003. [DOI] [Google Scholar]
- Xia S. Zhang L. Pan G. Qian P. Ni Z. Phys. Chem. Chem. Phys. 2015;17:5345–5351. doi: 10.1039/C4CP03877K. [DOI] [PubMed] [Google Scholar]
- Rauf M. A. Meetani M. A. Khaleel A. Ahmed A. Chem. Eng. J. 2010;157:373–378. doi: 10.1016/j.cej.2009.11.017. [DOI] [Google Scholar]
- Houas A. Lachheb H. Ksibi M. Elaloui E. Guillard C. Herrmann J.-M. Appl. Catal., B. 2001;31:145–157. doi: 10.1016/S0926-3373(00)00276-9. [DOI] [Google Scholar]
- Huang H. Leung D. Y. C. Kwong P. C. W. Xiong J. Zhang L. Catal. Today. 2013;201:189–194. doi: 10.1016/j.cattod.2012.06.022. [DOI] [Google Scholar]
- Xu A. Li X. Xiong H. Yin G. Chemosphere. 2011;82:1190–1195. doi: 10.1016/j.chemosphere.2010.11.066. [DOI] [PubMed] [Google Scholar]
- Bakre P. V. Volvoikar P. S. Vernekar A. A. Tilve S. G. J. Colloid Interface Sci. 2016;474:58–67. doi: 10.1016/j.jcis.2016.04.011. [DOI] [PubMed] [Google Scholar]
- Yu K. Yang S. Liu C. Chen H. Li H. Sun C. Boyd S. A. Environ. Sci. Technol. 2012;46:7318–7326. doi: 10.1021/es3001954. [DOI] [PubMed] [Google Scholar]
- Wang Q. Tian S. L. Ning P. Ind. Eng. Chem. Res. 2014;53:643–649. doi: 10.1021/ie403402q. [DOI] [Google Scholar]
- Hu J. Zhang P. An W. Liu L. Liang Y. Cui W. Appl. Catal., B. 2019;245:130–142. doi: 10.1016/j.apcatb.2018.12.029. [DOI] [Google Scholar]
- Qian X. Wu Y. Kan M. Fang M. Yue D. Zeng J. Zhao Y. Appl. Catal., B. 2018;237:513–520. doi: 10.1016/j.apcatb.2018.05.074. [DOI] [Google Scholar]
Associated Data
This section collects any data citations, data availability statements, or supplementary materials included in this article.


