Abstract
Curcumin (Cur) can be used as a photosensitizer in the photodynamic therapy (PDT) of cancer, but its low bioavailability limits further clinical application. A mesoporous silica-based drug delivery system (PEGylated mesoporous silica nanoparticles, MSN-PEG@Cur) was designed to solve the problem. The successful preparation of MSN-PEG@Cur was characterized by several physico-chemistry techniques. The endocytosis, ROS generation and in vitro anti-cancer efficacy of MSN-PEG@Cur were evaluated in detail step by step. The results indicated that MSN-PEG@Cur could be effectively endocytosed into cells and release Cur, which can promptly generate ROS upon irradiation, achieving effective PDT in cancer treatment. This MSNs-based drug delivery system provides an alternative strategy for Cur loading and PDT of cancer.
We developed a Cur loaded PEGylated mesoporous silica nanoparticle system (MSN-PEG@Cur) for effective photodynamic therapy in cancer treatment.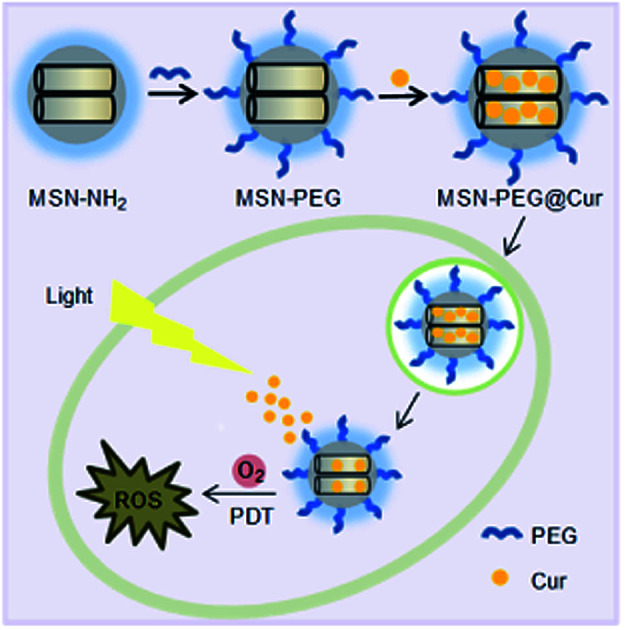
Introduction
Recently, non-invasive photodynamic therapy (PDT) has been considered as a promising treatment strategy to cure a variety of cancers.1,2 The factors determining the therapeutic effect of PDT include light, photosensitizer (PS) and tissue oxygen. During PDT, the PS is excited by light at a specific wavelength, leading to the generation of cytotoxic reactive oxygen species (ROS), which consequently induces apoptosis or necroptosis of cancer cells.3 Nowadays, various compounds such as dyes, drugs and chemicals have been applied as PSs in PDT.4 Curcumin (Cur), a kind of traditional Chinese medicine, has been confirmed not only as a broad spectrum antineoplastic agent but also as a PS.5–7 However, Cur is not currently used in clinical practice on account of its low bioavailability.8 In attempting to solve the problem, drug delivery systems (DDSs) could be employed to load Cur towards enhancing its PDT efficiency.
In recent years, various nanomaterials such as liposomes, micelles, polymeric nanoparticles, and inorganic nanoparticles have been widely engineered as DDSs in cancer therapy fields,9–11 which can load diverse drugs and deliver them to cancer tissue efficiently via enhanced permeability and retention (EPR) effect-mediated passive targeting or active targeting after DDSs decorating with target ligands.12,13 Owing to the superiorities of high specific surface area, large pore volume, and easily chemical modification, mesoporous silica nanoparticles (MSNs) could encapsulate/load vast amounts of drugs and/or PS to achieve high drug payload.14,15 Besides, because of the interaction between the drugs and mesoporous surface, such as hydrogen bonding, ionic bonding, electrostatic interaction and hydrophobic effect, the MSNs could be designed as controllable carriers for drug delivery.16–18 By utilizing these famous merits, many multifunctional MSNs were devised and developed for Cur delivery to improve bioavailability and enhance anti-cancer effect of Cur.19 Jung et al. developed mesoporous silica-based pH responsive release system (P-MHS) which was functionalized with phenanthroline and based on the ‘host–guest’ concept. The Cur loaded into P-MHS could be effectively controlled to release by cleavage of the coordination bonds between the phenanthroline group of P-MHS and Cu2+ under acidic pH conditions.20 Karmakar et al. prepared different mesoporous silica nanoparticles with different charge to improve the bioavailability of Cur. As a result, the Cur-loaded MCM-41 nanoparticles significantly enhanced the cell cytotoxicity against SCC25 cells.21 Noorwali et al. synthesized multifunctional PEG–MSNPs–Cur that can offered pH-triggered Cur release in an acidic tumor microenvironment and be utilized as self-fluorescence probe. The results revealed that the PEG–MSNPs–Cur potentiates tumor growth inhibition significantly as an efficient chemopreventive and therapeutic agent.22 However, Cur loaded by MSNs and acts as PS has not been fully investigated.
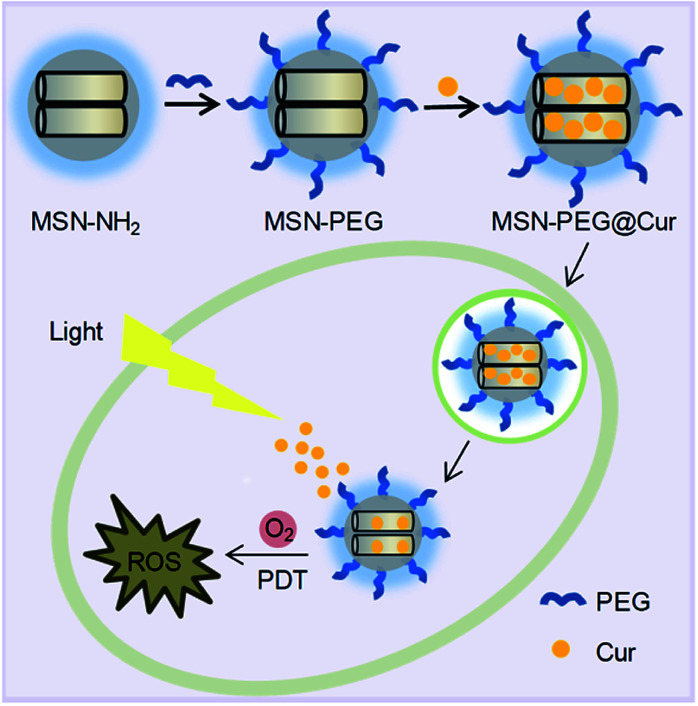
Herein, we developed a Cur-loaded PEGylation (PEG = polyethylene glycol) mesoporous silica nanoparticles system (MSN-PEG@Cur) for effective PDT in cancer therapy (Scheme 1). The PEGylation on the surface MSNs was helpful for MSN-PEG@Cur to escape from phagocytosis, leading to increased solubility and improved bioavailability of Cur.23–25 After cellular uptake, the Cur could be sustaining released from MSN-PEG@Cur, which was beneficial for the production of sufficient ROS upon irradiation that further enhance the anti-tumor efficiency of PDT. These results demonstrated that MSNs was a promising nanocarrier to load Cur for PDT.
Scheme 1. The preparation process of MSN-PEG@Cur and schematic representation of the intracellular PDT process after endocytosis of MSN-PEG@Cur.
Experimental
Materials
Cur (99%) was purchased from Sinopharm Chemical Reagent Limited Company. Poly(ethylene glycol) monomethyl ether (mPEG2k–OH), 3-aminopropyl trimethoxysilane (APTES), succinic anhydride, 1-ethyl-3-(3-dimethylaminopropyl) carbodiimide hydrochloride (EDC·HCl), and N-hydroxysuccinimide (NHS) were purchased from Sigma. Tetraethyl orthosilicate (TEOS) and N-cetyltrimethylammonium bromide (CTAB) were purchased from Aladdin and YiLi Fine Chemicals Co. Ltd, respectively. Dichlorofluorescein diacetate (DCF-DA) was purchased from Shanghai Biyuntian Biological Co. Ltd. 3-(4,5-Dimethylthiazol-2-yl)-2,5-diphenyltetrazolium bromide (MTT) and Hoechst were bought from Sigma-Aldrich. Cervical cancer cell line Hela was purchased from the Institute of Biochemistry and Cell Biology, Chinese Academy of Sciences, Shanghai, China. The cells were cultured with Dulbecco's Modified Eagle Medium (DMEM, supplemented with 10% fetal bovine serum) in a humidified atmosphere containing 5% CO2 at 37 °C.
Measurements
1H-NMR spectra was measured by a Unity-400 MHz NMR spectrometer (Bruker) in CDCl3. Fourier transform infrared spectrophotometer (FT-IR) measurement was recorded on a Bruker Vertex70 Win-IR instrument. The particles were observed using a field emission scanning electron microscope (SEM, Model XL 30 ESEM FEG from Micro FEI Philips). Transmission electron microscopy (TEM) studies were performed on a JEM-1011 electron microscope operating at an acceleration voltage of 100 kV. Particle sizes were conducted on a Malvern Zetasizer Nano ZS. N2 adsorption–desorption isotherms were recorded on a Micromeritics ASAP 2020M automated sorption analyzer. The samples were degassed at 150 °C for 5 hours. The specific surface areas were calculated from the adsorption data in low pressure range using Brunauer–Emmett–Teller (BET) model, and pore size was determined following the Barrett–Joyner–Halemda (BJH) method. The ultraviolet (UV) spectrum was determined using a UV-Vis spectrophotometer (UV-2450PC, Shimadzu). The confocal laser scanning microscope (CLSM) images were visualized by a Zeiss 710 confocal laser scanning microscope imaging system (Japan).
Synthesis of MSN–NH2 and MSN–PEG
Aminated MSN (MSN–NH2) was synthesized according to a reference procedure. Briefly, CTAB (1.0 g) was first dissolved in distilled water (500 mL) by ultrasound. NaOH solution (3.5 mL, 2.00 M) was added to above CTAB solution and followed by heating to 80 °C with vigorously stir. Then TEOS (5.0 mL) was dripped into the mixed liquor slowly and maintained at 80 °C for 2 h. The precipitation was isolated by centrifugation (9000 rpm, 10 min), washed stepwise with deionized water and ethanol, and then dried under vacuum. The obtained white powder MSN (1.6 g) and APTES (1.0 mL) were added into dry toluene (100 mL) and stirring for 24 h at 90 °C under nitrogen. Then, the products were collected by centrifugation and washed with toluene, acetone and ethanol. The crude products were dispersed in a solution containing methanol (160 mL) and HCl (10 mL, 37.4%), and refluxed for 12 h to eliminate the CTAB at 80 °C. The products were purified by centrifugation and washed with ethanol three times, and denoted as MSN–NH2.
mPEG2k–OH was modified with succinic anhydride and the prepared compound was named mPEG2k–COOH. Briefy, mPEG2k–OH (2.0 g, 1.0 mmol) was stirred with succinic anhydride (400 mg, 4.0 mmol) in toluene (20 mL) at 65 °C for 24 h. After removed toluene by vacuum distillation, dichloromethane (5 mL) was added and the solution was dropped into an excess of diethyl ether. The precipitate was isolated and re-dissolved in dichloromethane and reprecipitated twice, and finally dried in vacuum to obtain a white power of mPEG2k–COOH.
MSN–NH2 (1.6 g), mPEG2k–COOH (8.0 g, 4 mmol), EDC·HCl (764 mg, 4 mmol), and NHS (460 mg, 4 mmol) were dissolved in dried DMSO and stirred for 48 h at room temperature. PEGylated MSN (MSN–PEG) were collected by centrifugation, washed with water and dried under vacuum overnight.
Cur loading and release
Cur (10 mg) and MSN–PEG (100 mg) were dissolved in DMSO (5 mL) by ultrasound. The liquor was stirred at room temperature for 24 h and centrifuged (12 000 rpm, 15 min). The resultant deposits were washed with ethanol repeatedly and then dried under vacuum. These particles were named as MSN-PEG@Cur. The drug loading content (DLC) and drug loading efficiency (DLE) of Cur in the drug-loaded particles were measured by UV-Vis spectrophotometer. The loaded Cur was extracted with DMF. After removing the particles by centrifugation, the supernatant were collected to measure by UV-Vis spectrophotometer at the wavelength of 425 nm. The DLC and DLE were further calculated by the following equation:DLC (%) = (Cur weight in particles/total weight of particles) × 100%DLE (%) = (Cur weight in particles/initial feeding amount of Cur) × 100%
The MSN-PEG@Cur (2.0 mg) was dissolved in 1.0 mL of phosphate buffer saline (PBS, pH 7.4) or acetate buffer solution (ABS, pH 5.0). Dialysis bags (MWCO = 3500) were used to place the above solutions and then immersed into the corresponding buffer solution (19 mL). The release mediums were incubated in a thermostatic shaker at 37 °C. At predetermined time, 1 mL of buffer solution outside the dialysis bag was taken out for UV-Vis measurement and replaced with the same volume of buffer solution. The release amount of Cur was determined from the absorbance at 425 nm with the help of a calibration curve of Cur in the same buffers.
Cellular uptake
The endocytosis and intracellular drug release of MSN-PEG@Cur were measured by CLSM. Hela cells were seeded in the 6-well culture plates (5 × 10⁴ cells per well) and cultured for 24 h. Then the cells were incubated with MSN-PEG@Cur or free Cur at a final Cur concentration of 3.0 μg mL−1 for 0.5 h or 4 h at 37 °C. The culture medium was removed, and the cells were washed with PBS and fixed with 4% formaldehyde for 30 min at room temperature. After staining the nucleus with Hoechst, the slides were mounted and observed by CLSM.
Detection of ROS
To evaluate the ROS generation ability of free Cur and MSN-PEG@Cur, a chemical method using indocyanine green (ICG) as reactive oxygen species indicator was employed and monitored by UV-vis spectroscopy. Equal amount of free Cur (5 μg mL−1) and MSN-PEG@Cur (Cur concentration was 5 μg mL−1) were blended with a ICG solution (10 μg mL−1) and then irradiated with a 430 nm light at 20 mW cm−2 for different time intervals. To increase the solubility of Cur in water, Cur was first dissolved in DMSO, and then it was added to an aqueous containing ICG. The absorption intensity of the ICG was detected. The mixed solution of MSN-PEG@Cur and ICG incubated with acetate buffer solution (ABS, pH 5.0) in a thermostatic shaker at 37 °C for 4 h was investigated to compare the ROS generation ability with MSN-PEG@Cur without Cur release.
The intracellular ROS were detected by DCF-DA (cellular reactive oxygen species assay kit). Hela cells were seeded in the 6-well plates (5 × 10⁴ cells per well) and cultured for 24 h. Then the cells were incubated with MSN-PEG@Cur or free Cur at a final Cur concentration of 3.0 μg mL−1 for 4 h at 37 °C in the dark. The culture mediums were replaced by DMEM (1 mL, including 1 μL DCF-DA) and incubated for another 30 min. After being washed with PBS, the cells were observed by CLSM. Compared with the groups without irradiation, the groups with irradiation were exposed to illumination (430 nm, 20 mW cm−2) for 30 min before the replacement of DMEM containing DCF-DA.
Cell cytotoxicity
The anti-cancer activity was accessed with MTT assay against Hela cells. The cells were seeded into 96-well plates (5 × 10³ cells per well) and cultured for 24 h. MSN-PEG@Cur or free Cur at the final gradient Cur concentrations from 25 μg mL−1 to 0.39 μg mL−1 were added to the culture medium for 4 h of incubation. For the groups without irradiation, cells were then washed with PBS and incubated with fresh DMEM in the dark for another 72 h. For the groups with irradiation, cells were exposed to illumination (430 nm, 20 mW cm−2) for 30 min before being cultured in the dark for 72 h. At the indicated time, cells were stained with 20 μL MTT (0.5 mg mL−1 in PBS), and incubated for 4 h at 37 °C. After removing the culture solutions, 150 μL DMSO were added to dissolve the formed formazan crystals. The plates were shaken for 10 min, and the absorbance of formazan crystals was measured at 490 nm by a microplate reader.
Results
Preparation and characterization of MSN–PEG
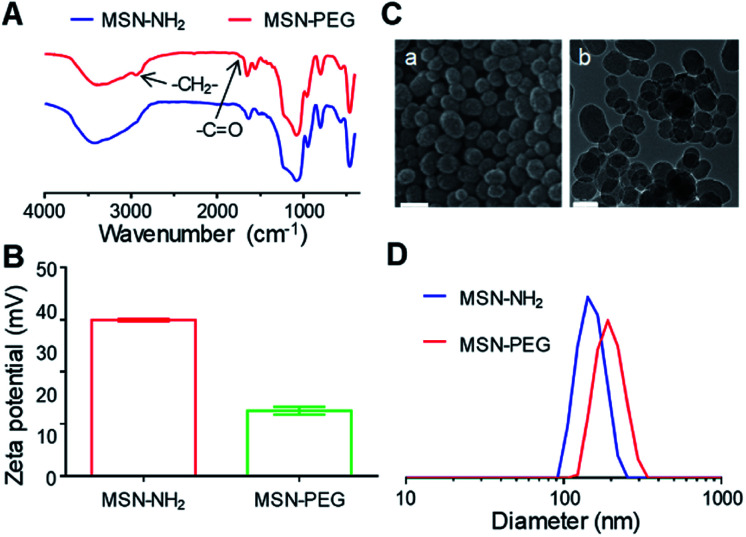
After the preparation of MSN–NH2, the particles were functionalized with mPEG2k–COOH (Fig. S1†) to improve the solubility, stability and blood circulation time of Cur. After modification with mPEG2k–COOH, the Fourier transform infrared spectrophotometer (FT-IR) spectra of the MSN–PEG showed the characteristic peak of mPEG2k–COOH at 2930 cm−1 and 1740 cm−1 (Fig. 1A). Besides, the zeta potential changes were also verified the successful preparation of MSN–NH2 and MSN–PEG (Fig. 1B and S2†). As shown in Fig. 1C(a) and S3A,† both of the MSN–NH2 and MSN–PEG had a regular spherical morphology in the scanning electron microscope (SEM) images. Transmission electron microscopy (TEM) analyses indicated that the particle sizes showed no visible change after the PEGylation, and both of them had uniform particle sizes of about 100 nm (Fig. 1C(b) and S3B†). Particle size distribution of various samples was also measured by dynamic light scattering (DLS, Fig. 1D) with the mean diameters of 150 nm and 197 nm for MSN–NH2 and MSN–PEG, respectively.
Fig. 1. The successful preparation of MSN–PEG. (A) FT-IR spectra of MSN–NH2 and MSN–PEG. (B) Zeta potential of MSN–NH2 and MSN–PEG. (C) SEM (a: scale bar = 100 nm) and TEM (b: scale bar = 100 nm) of MSN–PEG. (D) Size distributions of MSN–NH2 and MSN–PEG.
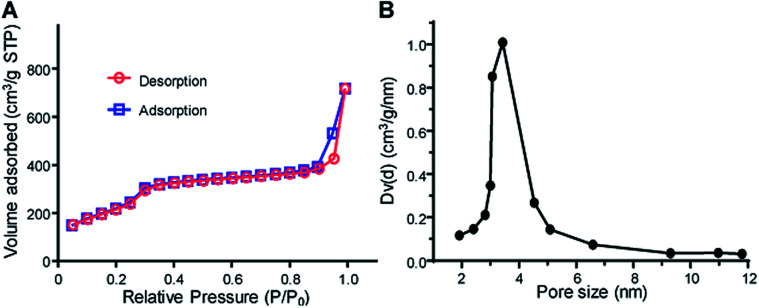
As showed in Fig. 1C(b) and S3C,† MSN–PEG showed uniform mesoporous channels aligned radially from the center to the outside of the particles, indicating the PEGylation had no impact on the ordering of mesoporous structures. To further evaluate the characteristics of mesoporous structures, the surface area and average pore diameter of MSN–PEG were measured by nitrogen adsorption–desorption isotherms. The isotherm (Fig. 2A) exhibited the characteristic type of IV N2 adsorption–desorption patterns according to the international union of pure and applied chemistry (IUPAC) classification, which manifested that the particles possessed uniform mesoporous channels and narrow pore size distribution. The surface area was calculated to be 813 m2 g−1 by Brunauer–Emmett–Teller (BET) model and the average pore size was about 3.42 nm by Barrett–Joyner–Halemda (BJH) method (Fig. 2B). The above data indicated that MSN–PEG with a mesoporous nature were successfully prepared.
Fig. 2. Mesoporous characteristics of MSH–PEG. (A) Nitrogen adsorption–desorption isotherms of MSN–PEG. (B) Pore size distribution of the corresponding samples.
Cur loading and release
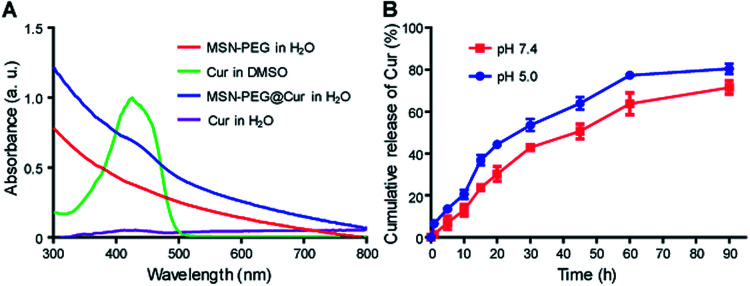
After the successful fabrication of MSN–PEG, Cur was loaded into the particles. Cur could be efficiently loaded into particle pores through hydrophobic interaction by dipping centrifugation method. As shown in Fig. 3A, after Cur loading, the characteristic absorbance of Cur in MSN-PEG@Cur could be observed. The drug loading content (DLC) and drug loading efficiency (DLE) of Cur in the MSN-PEG@Cur were calculated to be 8.1% and 89.1%, respectively. As shown in Fig. S4,† compared with free Cur that can easily precipitated in water, the MSN-PEG@Cur was much more stable and few of them was precipitated even after incubation for 4 h, indicating the increased solubility of Cur in MSN-PEG@Cur which will improve its bioavailability for effective PDT. Afterwards, the release profiles of Cur were investigated at different release mediums. Phosphate buffer saline (PBS, pH 7.4) and acetate buffer solution (ABS, pH 5.0) were chose to simulate the physiological condition in blood circulation and the abnormal acid environment in cancer tissue or cancer cells, respectively. As shown in Fig. 3B, MSN-PEG@Cur displayed a smooth and steady release in PBS 7.4, and released 30.2% after 20 h and 71.5% after 90 h. Compared to PBS 7.4, the release rate of Cur was slightly speeded up in the ABS 5.0. It could thus be seen that Cur release was pH dependent and increased with the decrease of pH.
Fig. 3. Cur loading and release. (A) UV-Vis spectra of MSN–PEG, Cur and MSN-PEG@Cur. (B) Cur release profiles of MSN-PEG@Cur in PBS 7.4 or ABS 5.0.
Cellular uptake and intracellular drug release
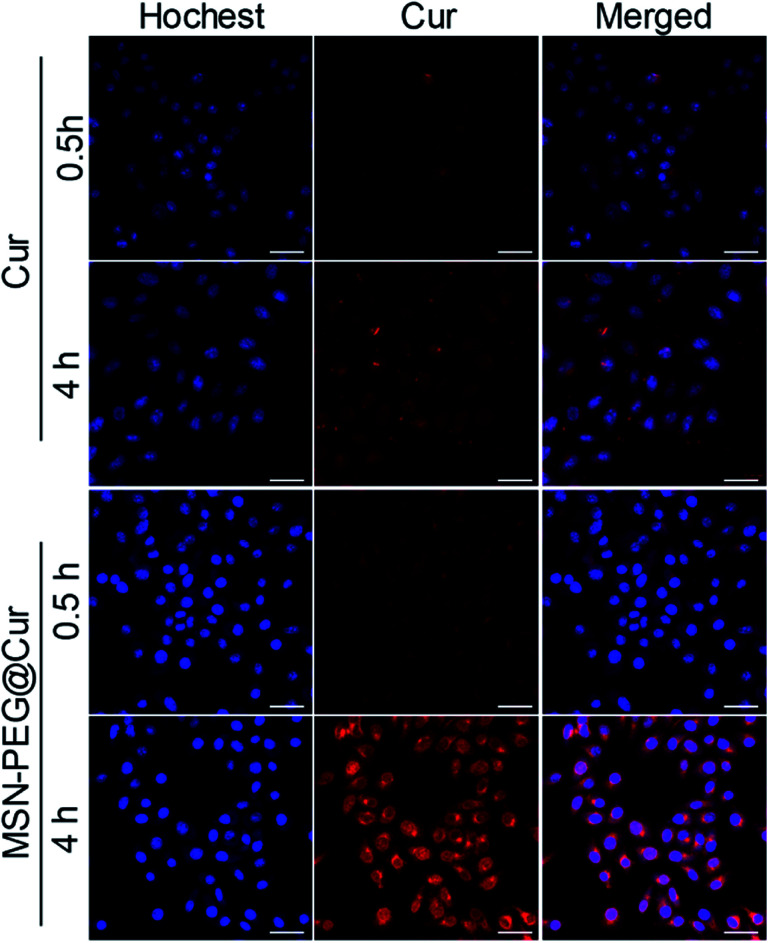
The cellular uptake and intracellular drug release behavior of MSN-PEG@Cur in Hela cells were investigated by confocal laser scanning microscope (CLSM, Fig. 4). Because of the poor solubility of Cur, the intensity of the red fluorescence of Cur treated cells was relative low even after 4 h incubation. By contrast, the red florescence of the MSN-PEG@Cur treated cells were much stronger than that of Cur treatment both after 0.5 or 4 h incubation, besides, many of the Cur was released from MSN-PEG@Cur and distributed to the perinuclei and nuclei. These results indicated that the Cur could be efficient loaded into MSN-PEG@Cur and be effective delivered into cells, by which way will significant increase the solubility and improve the bioavailability of Cur for PDT.
Fig. 4. CLSM images of Hela cells incubated with Cur or MSN-PEG@Cur for 0.5 h and 4 h (scale bar = 50 um).
Detection of ROS
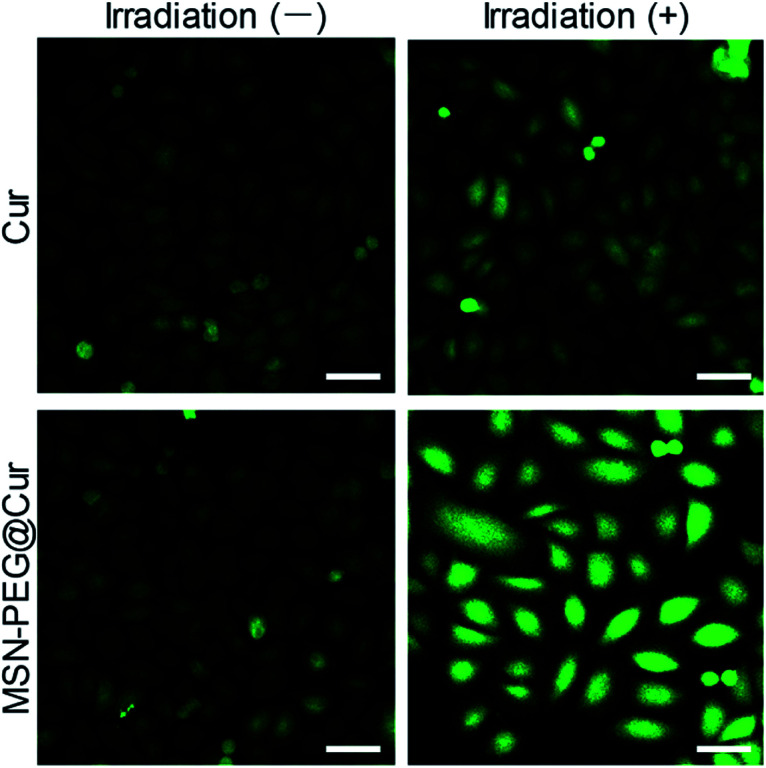
As previously mentioned, Cur could react with molecular oxygen to generate cytotoxic ROS upon irradiation. As shown in Fig. S5A,† the absorbance of ICG was rapidly decreased with the increasing of irradiation time, indicating the effective generation of ROS. By contrast, the generation of ROS from MSN-PEG@Cur was relative slow before the Cur release (Fig. S5B†). After the mixed solution of MSN-PEG@Cur and ICG incubated with acetate buffer solution (ABS, pH 5.0) in a thermostatic shaker at 37 °C for 4 h, the gradually released Cur increased the production of ROS significantly, which accelerated the decrease of absorbance of ICG (Fig. S5C†). These results indicated that the ROS was generated from Cur released from MSN-PEG@Cur. Therefore, owing to the increased bioavailability of Cur after loaded by MSN–PEG, the MSN-PEG@Cur could be more effective endocytosed, and sustaining release Cur for the production of sufficient ROS upon irradiation. To verify this, dichlorofluorescein diacetate (DCF-DA) was used to evaluate the intracellular ROS level by free Cur and MSN-PEG@Cur after endocytosis. DCF-DA itself has no fluorescence and could be hydrolyzed into DCF in the cells. In the presence of ROS, DCF-DA without fluorescence could be oxidized to the DCF with fluorescence and the fluorescence intensity was proportional to the ROS level. As showed in Fig. 5, the cur and MSN-PEG@Cur groups without irradiation revealed very weak green fluorescence after 4 h incubation because of a small quantity of intrinsic intracellular ROS. In consistent with the results of cellular uptake and intracellular drug release, much stronger fluorescence was observed in MSN-PEG@Cur treated cells with (blue light 430 nm, Fig. S6†) irradiation compared with that of Cur treatment group, which verified the quick production of a large amount of ROS under light irradiation of MSN-PEG@Cur.
Fig. 5. ROS generation after Hela cells incubation with Cur or MSN-PEG@Cur for 4 h and without or with irradiation for 30 min (scale bar = 50 um). Irradiation (−) indicates without irradiation. Irradiation (+) indicates with irradiation.
Cell cytotoxicity
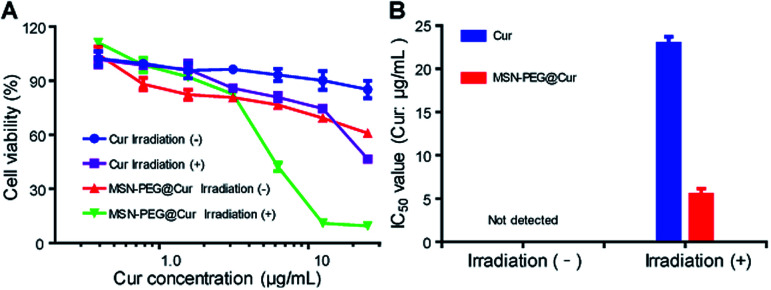
Encouraged by the enhanced cellular uptake and ROS generation of MSN-PEG@Cur, the anticancer activity of MSN-PEG@Cur was investigated against Hela cells by MTT assay. Fig. 6A shows the cell viability of Hela cells after 72 h incubation with different drugs at various Cur concentrations. The IC50 values of different groups were exhibited in Fig. 6B. Regardless of irradiation or not, the cell viability decreased with the increase of MSN-PEG@Cur or free Cur concentration. Although the MSN-PEG@Cur treatment group displayed better anticancer activity than that of Cur treatment in dark condition, the IC50 MSN-PEG@Cur treatment group was also could not detected. However, after irradiation, the cytotoxicity of MSN-PEG@Cur and Cur markedly increased, and the IC50 value of MSN-PEG@Cur (5.5 μg mL−1) was significantly lower than that of without irradiation and 4.2-fold less than that of Cur treatment group (22.9 μg mL−1). These results suggested that the hybrid particles MSN-PEG@Cur possessed enhanced PDT activity in comparison with Cur.
Fig. 6. Cell cytotoxicity of MSN-PEG@Cur. (A) In vitro cytotoxicity of different drugs with or without irradiation against Hela cells for 72 h. (B) IC50 values of Cur (Cur μg mL−1) and MSN-PEG@Cur (Cur μg mL−1) against Hela cells after 72 h of incubation with or without irradiation. Irradiation (−) indicates without irradiation. Irradiation (+) indicates with irradiation.
Discussion
Cur is a bioactive component extracted from Curcuma longa and it has diverse biological applications as an antioxidant, antidiabetic, antibacterial, antifungal and especially as an anticancer agent.26–29 Multiple studies have demonstrated that Cur is cytotoxic to various cancer cells, such as gastrointestinal tumors, melanoma, urinary tumors, breast cancer, lung cancer, hematological tumors, nervous system tumors and sarcomas.30 Dose dependent toxicity studies in normal cell lines suggest Cur is well tolerated at high doses without any toxic effect. In a clinical trial, Cur was orally given to healthy subjects 12 g a day without significant adverse reactions.31 Compared with traditional chemotherapy drugs, such as cisplatin and doxorubicin, Cur has a lower systemic bioavailability, which is related to its poor solubility and stability.32 To overcome the limitations, researchers have been engaged in making different formulations such as polymeric nanoparticles, inorganic–organic hybrid nanoparticles and inorganic nanomaterials to load Cur.33–35 At the same time, these formulations can also significantly increase the blood concentration of Cur. In a previous study, healthy subjects were given orally Cur-loaded nanoparticles containing 650 mg of curcumin with a maximum blood drug concentration of 22 ng mL−1, while it was not detected in blood at the same amount of fresh Cur.36
Except as an anticancer agent, recent studies have shown that Cur can be used as a PS in PDT under the condition of light stimulation. Similarly, in terms of PDT, Cur also faces the problem of poor solubility and stability, which greatly limits its clinical application. As mentioned above, Cur-loaded nanoparticles can be an important research direction to enhance PDT efficiency. A different approach for developing novel drug-delivery systems is the use of mesoporous silica materials because of their interesting properties, such as high specific surface area, large pore volume, and easily chemical modification and controlled drug release. In addition, considering that PEGylation would increase the blood circulation time of Cur-loaded MSNs,37,38 we prepared Cur-loaded PEGylated mesoporous silica nanoparticles (MSN-PEG@Cur) for PDT.
Firstly, MSN–NH2 and MSN–PEG were synthesized and characterized by several physico-chemical techniques. The results of FT-IR demonstrated the successful graft of PEG. SEM and TEM showed the regular spherical morphology and the mesoporous nature of the mesoporous silica-based materials. By BET nitrogen adsorption–desorption isotherms and BJH pore size distribution analysis, the prepared MSNs have large surface area and small average pore size, which are benefit for Cur loading. Then, Cur was entrapped into MSN–PEG and release kinetic studies revealed a slow and sustained release of Cur in a blood simulated fluid (PBS 7.4). And the medium of ABS 5.0 speeded up the release of Cur slightly. That might be explained by the decrease of electrostatic interactions under acid conditions. This specialty availed the quick release of drugs in the acid condition of cancer tissue or cancer cells. Afterwards, cell experiments were performed. As expected, the cellular uptake of MSN-PEG@Cur was much better than that of Cur and much more Cur will release from MSN-PEG@Cur to cytoplasm, perinuclei and nuclei. Therefore, upon light irradiation, MSN-PEG@Cur could quick react with molecular oxygen to effective generate cytotoxic ROS.
Thereafter, the cytotoxicity of MSN-PEG@Cur was evaluated against Hela cells using MTT assay. Without irradiation, Cur and MSN-PEG@Cur showed rather low cytotoxicity, which is consistent with previous literatures.32 Upon irradiation, their cytotoxicity was significantly strengthened contributing to the rapidly produced ROS. On account of the sustained release of Cur from MSN-PEG@Cur, the Cur concentration in the cells was significant higher than that of Cur group during the irradiation. The MSN-PEG@Cur displayed markedly better anticancer activity than that of Cur, and the IC50 of MSN-PEG@Cur was 4.2-fold less than that of free Cur under light irradiation.
Conclusions
In summary, the current work demonstrated the MSN-polymer hybrid nanoparticles (MSN-PEG@Cur) for efficient PDT in cancer therapy. The MSN-PEG@Cur could be efficient taken up by cells and specifically released Cur intracellularly. Cell experiments displayed that MSN-PEG@Cur rapidly produced ROS upon irradiation and presented favorable anti-tumor activity in vitro. These results demonstrated that MSN-PEG@Cur could be a promising nanocarrier for Cur-mediated PDT. This work provided an extensive method for utilizing MSNs to load PS for PDT in cancer therapy.
Conflicts of interest
There are no conflicts to declare.
Supplementary Material
Acknowledgments
This research was funded by Major Project of Scientific and Technological of Henan Province, grant number 201701033.
Electronic supplementary information (ESI) available. See DOI: 10.1039/d0ra04778c
Notes and references
- Ethirajan M. Chen Y. Joshi P. Pandey R. K. Chem. Soc. Rev. 2011;40:340–362. doi: 10.1039/B915149B. [DOI] [PubMed] [Google Scholar]
- Kwiatkowski S. Knap B. Przystupski D. Saczko J. Kedzierska E. Knap-Czop K. Kotlinska J. Michel O. Kotowski K. Kulbacka J. Biomed. Pharmacother. 2018;106:1098–1107. doi: 10.1016/j.biopha.2018.07.049. [DOI] [PubMed] [Google Scholar]
- Lucky S. S. Soo K. C. Zhang Y. Chem. Rev. 2015;115:1990. doi: 10.1021/cr5004198. [DOI] [PubMed] [Google Scholar]
- Dolmans D. E. Fukumura D. Jain R. K. Nat. Rev. Cancer. 2003;3:375. doi: 10.1038/nrc1071. [DOI] [PubMed] [Google Scholar]
- Bar-Sela G. Epelbaum R. Schaffer M. Curr. Med. Chem. 2010;17:190. doi: 10.2174/092986710790149738. [DOI] [PubMed] [Google Scholar]
- Shishodia S. Chaturvedi M. M. Aggarwal B. B. Curr. Probl. Cancer. 2007;31:243–305. doi: 10.1016/j.currproblcancer.2007.04.001. [DOI] [PubMed] [Google Scholar]
- Santezi C. Reina B. D. Dovigo L. N. Photodiagn. Photodyn. 2018;21:409–415. doi: 10.1016/j.pdpdt.2018.01.016. [DOI] [PubMed] [Google Scholar]
- Naksuriya O. Okonogi S. Schiffelers R. M. Hennink W. E. Biomaterials. 2014;35:3365–3383. doi: 10.1016/j.biomaterials.2013.12.090. [DOI] [PubMed] [Google Scholar]
- Shi J. Kantoff P. W. Wooster R. Farokhzad O. C. Nat. Rev. Cancer. 2017;17:20. doi: 10.1038/nrc.2016.108. [DOI] [PMC free article] [PubMed] [Google Scholar]
- Zhang Q. Kuang G. He S. Lu H. Cheng Y. Zhou D. Huang Y. Nano Lett. 2020;20:3039–3049. doi: 10.1021/acs.nanolett.9b04981. [DOI] [PubMed] [Google Scholar]
- Zhang Q. He S. Kuang G. Liu S. Lu H. Li X. Zhou D. Huang Y. J. Mater. Chem. B. 2020 doi: 10.1039/d0tb00746c. [DOI] [PubMed] [Google Scholar]
- Zhang Y. Chan H. F. Leong K. W. Adv. Drug Delivery Rev. 2013;65:104–120. doi: 10.1016/j.addr.2012.10.003. [DOI] [PMC free article] [PubMed] [Google Scholar]
- Schütz C. A. Juillerat-Jeanneret L. Mueller H. Lynch I. Riediker M. Nanomed-Nanotechnol. 2013;8:449–467. doi: 10.2217/nnm.13.8. [DOI] [PubMed] [Google Scholar]
- Li Z. Zhang Y. Feng N. Expert Opin. Drug Delivery. 2019;16:219–237. doi: 10.1080/17425247.2019.1575806. [DOI] [PubMed] [Google Scholar]
- Soenen S. J. Parak W. J. Rejman J. Manshian B. Chem. Rev. 2015;115:2109–2135. doi: 10.1021/cr400714j. [DOI] [PubMed] [Google Scholar]
- Tang F. Li L. Chen D. Adv. Mater. 2012;24:1504–1534. doi: 10.1002/adma.201104763. [DOI] [PubMed] [Google Scholar]
- He X. Nie H. Wang K. Tan W. Wu X. Zhang P. Anal. Chem. 2008;80:9597–9603. doi: 10.1021/ac801882g. [DOI] [PubMed] [Google Scholar]
- Barros C. H. N. Devlin H. Hiebner D. W. Vitale S. Quinn L. Casey E. Nanoscale Adv. 2020;2:1694–1708. doi: 10.1039/D0NA00041H. [DOI] [PMC free article] [PubMed] [Google Scholar]
- Chen Y. Lu Y. Lee R. J. Xiang G. Int. J. Nanomed. 2020;15:3099–3120. doi: 10.2147/IJN.S210320. [DOI] [PMC free article] [PubMed] [Google Scholar]
- Jin D. Lee J. H. Seo M. L. Jaworski J. Jung J. H. New J. Chem. 2012;36:1616–1620. doi: 10.1039/C2NJ20976D. [DOI] [Google Scholar]
- Jambhrunkar S. Qu Z. Popat A. Yang J. Noonan O. Acauan L. Ahmad Nor Y. Yu C. Karmakar S. Mol. Pharmaceutics. 2014;11:3642–3655. doi: 10.1021/mp500385n. [DOI] [PubMed] [Google Scholar]
- Elbialy N. S. Aboushoushah S. F. Sofi B. F. Noorwali A. Microporous Mesoporous Mater. 2020;291:109540. doi: 10.1016/j.micromeso.2019.06.002. [DOI] [Google Scholar]
- Mishra P. Nayak B. Dey R. Asian J. Pharm. Life Sci. 2016;11:337–348. doi: 10.1016/j.ajps.2015.08.011. [DOI] [Google Scholar]
- Harris J. M. Chess R. B. Nat. Rev. Drug Discovery. 2003;2:214–221. doi: 10.1038/nrd1033. [DOI] [PubMed] [Google Scholar]
- Jesse V Jokerst T. L. Zare R. N. Gambhir S. S. Nanomedicine. 2011;6:715. doi: 10.2217/nnm.11.19. [DOI] [PMC free article] [PubMed] [Google Scholar]
- Mukherjee S. Baidoo J. N. E. Fried A. Banerjee P. Biochem. Pharmacol. 2020;176:113824. doi: 10.1016/j.bcp.2020.113824. [DOI] [PubMed] [Google Scholar]
- Kunnumakkara A. B. Bordoloi D. Padmavathi G. Monisha J. Roy N. K. Prasad S. Aggarwal B. B. Br. J. Pharmacol. 2017;174:1325–1348. doi: 10.1111/bph.13621. [DOI] [PMC free article] [PubMed] [Google Scholar]
- Li H. Sureda A. Devkota H. P. Pittala V. Barreca D. Silva A. S. Tewari D. Xu S. Nabavi S. M. Biotechnol. Adv. 2020;38:107343. doi: 10.1016/j.biotechadv.2019.01.010. [DOI] [PubMed] [Google Scholar]
- Salehi B. Stojanovic-Radic Z. Matejic J. Sharifi-Rad M. Anil Kumar N. V. Martins N. Sharifi-Rad J. Eur. J. Med. Chem. 2019;163:527–545. doi: 10.1016/j.ejmech.2018.12.016. [DOI] [PubMed] [Google Scholar]
- Duvoix A. Blasius R. Delhalle S. Schnekenburger M. Morceau F. Henry E. Dicato M. Diederich M. Cancer Lett. 2005;223:181–190. doi: 10.1016/j.canlet.2004.09.041. [DOI] [PubMed] [Google Scholar]
- Lao C. D. Ruffin M. T. Normolle D. Heath D. D. Murray S. I. Bailey J. M. Boggs M. E. Crowell J. Rock C. L. Brenner D. E. BMC Complementary Altern. Med. 2006;6:1–4. doi: 10.1186/1472-6882-6-1. [DOI] [PMC free article] [PubMed] [Google Scholar]
- Kunnumakkara A. B. Harsha C. Banik K. Vikkurthi R. Sailo B. L. Bordoloi D. Gupta S. C. Aggarwal B. B. Expert Opin. Drug Metab. Toxicol. 2019;15:705–733. doi: 10.1080/17425255.2019.1650914. [DOI] [PubMed] [Google Scholar]
- Kotcherlakota R. Barui A. K. Prashar S. Fajardo M. Briones D. Rodriguez-Dieguez A. Patra C. R. Gomez-Ruiz S. Biomater. Sci. 2016;4:448–459. doi: 10.1039/C5BM00552C. [DOI] [PubMed] [Google Scholar]
- Lababidi N. Sigal V. Koenneke A. Schwarzkopf K. Manz A. Schneider M. Beilstein J. Nanotechnol. 2019;10:2280–2293. doi: 10.3762/bjnano.10.220. [DOI] [PMC free article] [PubMed] [Google Scholar]
- Rafiee Z. Nejatian M. Daeihamed M. Jafari S. M. Crit. Rev. Food Sci. Nutr. 2019;59:3468–3497. doi: 10.1080/10408398.2018.1495174. [DOI] [PubMed] [Google Scholar]
- Gota V. S. Maru G. B. Soni T. G. Gandhi T. R. Kochar N. Agarwal M. G. J. Agric. Food Chem. 2010;58:2095–2099. doi: 10.1021/jf9024807. [DOI] [PubMed] [Google Scholar]
- Veronese F. M. Pasut G. Drug Discovery Today. 2005;10:1451–1458. doi: 10.1016/S1359-6446(05)03575-0. [DOI] [PubMed] [Google Scholar]
- He Q. Zhang Z. Gao F. Li Y. Shi J. Small. 2011;7:271–280. doi: 10.1002/smll.201001459. [DOI] [PubMed] [Google Scholar]
Associated Data
This section collects any data citations, data availability statements, or supplementary materials included in this article.


