Abstract
Tunable copper doped Zn1−xCdxS alloy quantum dots (QDs) were successfully synthesized by the wet chemical method. A one-step method is developed to synthesize doped ternary QDs which is more preferable than a two-step method. The influence of experimental parameters like the Zn/Cd ratio and Cu dopant concentration has been investigated using various spectroscopic techniques like UV-visible, photoluminescence, X-ray diffraction and Raman spectroscopy. The absorption and emission properties can be tuned by changing the concentration of components of the ternary QDs. The high concentration of dopant completely quenched the emission of the ternary QDs. EDX gives confirmation of the elemental composition of the synthesized samples. The obtained results suggest the successful doping of the ternary QDs. Interestingly, the study results revealed that the crystal structure (ZB and/or WZ) and the dual emission of the Cu-doped Zn1−xCdxSe alloy QDs could be controlled by varying the dopant concentration and chemical composition of the host. Doping also leads to enhancement in emission properties and provides more stability to ternary QDs. The enhancement in the photoluminescence (PL) decay lifetime of Cu-doped ternary QDs can be advantageous for optoelectronic and biosensor applications.
Tunable copper doped Zn1−xCdxS alloy quantum dots (QDs) were successfully synthesized by the wet chemical method.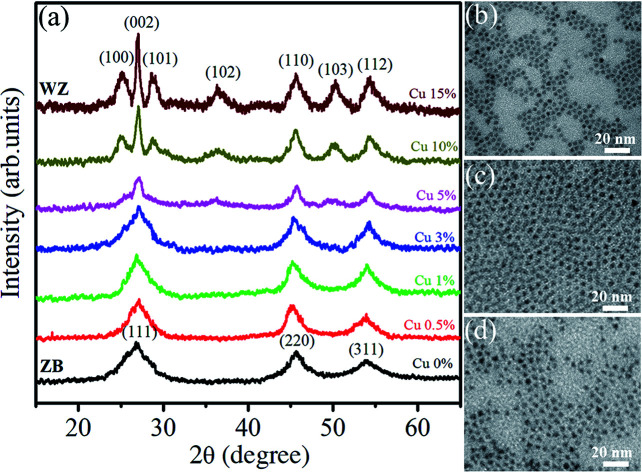
1. Introduction
In this era of nanotechnology, researchers have paid considerable attention to QDs owing to their distinctive and unique properties showing remarkable uses.1 Semiconductor QDs of the II–VI group of the periodic table have attracted much attention from scientists because of their unique and tunable properties. The II–VI elements have shown their potential abilities in various fields including electronic, biomedical, solar cells, water purification, chemical sensing, biosensing, etc. Binary semiconductor QDs are one of the most studied materials owing to their appealing electronic and optical properties like high absorption coefficient and high efficiency of radiative recombination.2–4 From the list of various chalcogenide materials, cadmium (Cd) based compounds have been studied the most and are also used as building blocks for various applications like photovoltaics and biolabeling due to their narrow emission and broad absorption spectra.5
But nowadays researchers are focusing on semiconductor ternary QDs as the chemistry and physical properties of ternary nanoclusters remain undeveloped and unexplored. Ternary nanoclusters have not yet been fully developed until date because of the lack of synthetic strategies. Many researchers have reported that alloyed ternary QDs are advantageous over binary QDs.6–8 The optical properties of binary QDs can be tuned by changing the size of QDs but for ternary QDs, the properties can be tailored by changing their composition. The alloyed ternary QDs of ZnCdS, ZnCdSe, ZnCdTe, and CdSeTe are being explored by controlling their constituents.9 The optical and structural properties of ternary QDs can be controlled by the ratio of their constituents. The development in the synthesis process of ternary semiconductor QDs that allow doping has attracted the scientific community to a great extent. Various synthesis routes are effective for the preparation of ternary QDs like solid-state reaction, solvothermal, thermolysis, and hot injection techniques.10–13 Most of the methods for synthesis of ternary QDs follow two-step methods: (i) forming the core/shell structure and (ii) further heating to form an alloy.14 But for the production of large-scale QDs, one-step method is always preferred over two-step method.
Compared to pure QDs, alloyed QDs have been reported as more stable and flexible for altering their band gap. The band gap can be tuned by doping them with some band gap sensitive elements for optoelectronic applications.15 Ma et al.16 reported the synthesis of PbSxSe1−x ternary-alloyed QDs. They reported that ternary alloyed QDs show 2-fold improvement in efficiency over devices composed of either pure PbS or pure PbSe QDs for solar cells. Ternary alloyed QDs are also advantageous over core/shell structures as they eliminate the issue of stress and lattice mismatch.17,18 ZnCdSe is a ternary semiconductor compound with a wide band gap, an attractive material because its tunable band gap depends on the composition and covers the visible spectrum. Therefore, their tunable optical properties are valuable for various optoelectronic devices, visible light-emitting diodes and lasers. For biological applications, the molar ratio of Cd/Zn during synthesis is also a matter of concern due to Cd toxicity.
Doping of ternary QDs with a suitable dopant opens a new path for researchers to enhance the optical properties of these luminescent materials. The optical and electrical properties after doping are different from those of the corresponding host material. Doped semiconductor QDs have been identified as promising luminescent materials because the dopants create deep trap levels and act as luminescence centers. Doping of semiconductor QDs with impurities can affect the various properties of host materials like high photoluminescence (PL) quantum yield (QY), long luminescence excited state lifetimes, large Stokes shifts, thermally stable luminescence, and tunable emission colors.19–22 Doping can also affect the crystal growth of semiconductor QDs as the surface energy is changed. Therefore, the growth and shape of the QDs may be affected. Doping of ternary QDs with copper (Cu), the dopant can act as both acceptor and donor, mainly due to Cu acts as a deep electron acceptor approximately 0.5 eV below the conduction band minimum.23 Until now, a extensive research has been done to explore Cu-doped binary QDs, but still very limited studies conducted to explore the properties of Cu-doped ternary QDs.
This paper reports the synthesis of Cu-y% (0 ≤ y ≤ 15) doped ZnxCd1−xSe (0 ≤ x ≤ 1) alloyed QDs using a chemical route method. Optical properties i.e. absorption and emission spectra of Cu-doped ZnxCd1−xSe alloyed QDs by changing the molar ratio of Zn/Cd in the host material. The structural properties were characterized using X-ray diffractometer and Raman spectroscopy. The elemental composition of the synthesized samples has been verified using energy dispersive X-ray spectrometry (EDX) technique. The effect of dopant concentration on the optical and structural properties of ZnxCd1−xSe ternary QDs was also studied. The PL lifetime decay kinetics were also investigated to explore the stability of doped ternary QDs.
2. Experimental
2.1. Materials
The reagents used for the synthesis and characterization of QDs are of analytical grade and used directly without any further purification. Cadmium oxide (CdO, 99.99%, powder), zinc oxide (ZnO, 99.9%, powder), 1-octadecene (ODE, 90%), oleic acid (OA, 90%), selenium (Se, 99.99%, powder), copper acetate (Cu(CH3COO)2, 99.98%), toluene (99.8%), isopropanol (99.7%) and tri-n-octylphosphine (TOP, 97%) were purchased from Sigma-Aldrich.
2.2. Synthesis of Cu-doped Zn1−xCdxSe-alloyed QDs
Colloidal Cu-doped Zn1−xCdxSe-alloyed QDs were prepared by the modified methods, which were presented in ref. 21 and 24. Briefly, a mixture of ZnO, CdO, OA, and ODE in a three-neck flask was heated to 280 °C and stirred under nitrogen flow to create the solution containing Cd2+ and Zn2+ ions. The amount of ZnO and CdO precursors was taken depending on the Cd/(Zn + Cd) ratio.
Separately, Cu(CH3COO)2 and TOP were mixed with ODE in a three-necked flask under nitrogen flow and stirring. Similarly, the amount of Cu(CH3COO)2 was taken depending on the Cu2+/(Cd2++Zn2+) ratio. The mixture was heated to 200 °C and maintained at this temperature until it turned into a clear solution. This solution was quickly injected into the reaction solution containing Cd2+ and Zn2+ ions. Next, the stock solution of TOPSe (Se in TOP) was rapidly injected into the reaction flask containing Cd, Zn and Cu precursors at 280 °C and stirred for 60 min. Then, the reacted solution containing Cu-doped Zn1−xCdxSe-alloyed QDs was cooled down to room temperature. After centrifuging the solution in isopropanol at a speed of 10 000 rpm for 5 min and removing the supernatant and remnants, the collected sediment of Cu-doped Zn1−xCdxSe-alloyed QDs was redispersed in toluene for study the optical properties.
2.3. Characterization
The crystal structure of the QDs was investigated using X-ray diffraction (XRD, Siemens D5005 diffractometer) equipped with a Cu-Kα radiation source. Energy dispersive X-ray spectrometry (EDX) spectra was measured on a PV97-61700ME instrument. Ultraviolet-visible (UV-vis) absorption spectra were analyzed using a Jasco V-770 spectrometer (Varian). Room-temperature photoluminescence (PL) measurement was measured using a Jobin Yvon Fluorolog-3 system. The excitation sources used were a 325 nm He–Cd laser and a 450 W xenon lamp. Toluene was used as a reference for both UV-vis and PL measurements. The lifetime measurements of the samples were recorded by a home-built time-resolved PL system with excitation wavelengths of 325 nm and 488 nm. Raman spectra of the dried samples in powder were acquired with a LABRAM-HR800 spectrometer (Jobin Yvon) working at a wavelength λ = 488 nm.
3. Results and discussion
3.1. Effect of Cd/(Cd + Zn) ratio
3.1.1. UV-visible absorption spectra
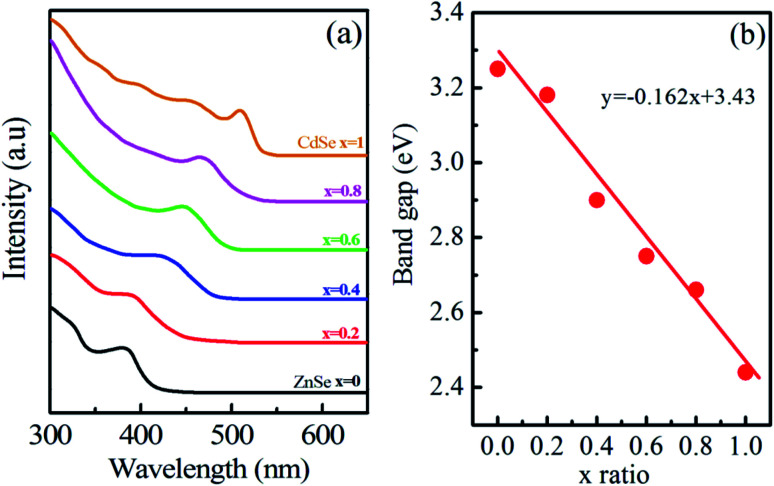
Room-temperature absorbance spectra of synthesized Zn1−xCdxSe (0 ≤ x ≤ 1):Cu 0.5% alloy QDs dispersed in toluene are shown in Fig. 1(a). The absorption spectra have been taken at different ratio of Cd/Zn. The doping concentration of the dopant Cu i.e. 0.5% is maintained the same in all the samples. A broad absorption spectrum was observed for the sample with x = 1 (CdSe) in the UV region extended to the visible region with the first excitonic absorption peak and absorption edge at 509 nm and 534 nm, respectively. Compared to bulk CdSe (λbulk ∼ 690 nm), the synthesized sample shows a shift towards shorter wavelength, that confirming the formation of nanostructures.25Table 1 summarizes the absorption peak and absorption edge for each concentration. For x = 0.8, as the concentration of Zn increases and Cd decreases, the absorption peak shifts towards shorter wavelength λ ∼ 470 nm. The overall absorption spectrum of all the samples follows the same trend, except for the shift in the absorption peak and edge after changing the Cd/Zn ratio.
Fig. 1. (a) UV-vis absorption spectra and (b) optical band gap of Zn1−xCdxSe (0 ≤ x ≤ 1):Cu 0.5% alloy QDs.
Absorption peak and absorption edge of Zn1−xCdxSe (0 ≤ x ≤ 1):Cu 0.5% alloy QDs.
| S. no. | Sample | Absorption peak (nm) | Absorption edge (nm) | Optical band gap (eV) |
|---|---|---|---|---|
| Zn1−xCdxSe | ||||
| i | x = 1 (CdSe) | 509 | 534 | 2.44 |
| ii | x = 0.8 | 465 | 523 | 2.66 |
| iii | x = 0.6 | 448 | 495 | 2.77 |
| iv | x = 0.4 | 423 | 477 | 2.90 |
| v | x = 0.2 | 391 | 442 | 3.16 |
| vi | x = 0 (ZnSe) | 382 | 429 | 3.25 |
This trend of blue shift in the excitonic peak confirms the formation of alloyed nanostructure, not core/shell structure.26 In core/shell structures due to the partial leakage of the exciton into the shell matrix, the absorption peak shifts towards longer wavelength compared to the core structure. Sharp excitonic peaks were observed for x = 1 (CdSe) and x = 0 (ZnSe) due to their narrow size distribution.
Parameters like optical band gap and particle size were calculated using absorption spectra. The optical direct band gap of the nanostructures can be calculated from the absorption spectra using the Tauc relation given as:27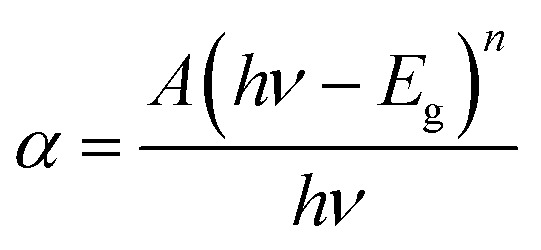 , where Eg is the optical band gap of the material, h is Planck's constant, α is the absorption coefficient, and exponent n depends on the type of transition i.e. for allowed direct transition n = 1/2 and for allowed indirect transition n = 2. Eg was obtained by extrapolating the linear region of (αhν)2vs. hν. The obtained values of the optical band gap for Zn1−xCdxSe (0 ≤ x ≤ 1):Cu 0.5% are summarized in Table 1. It is worth noting that with the Cd/Zn ratio, the band gap changes as depicted in Fig. 1(b). Therefore, the band gap of the alloyed ternary QDs can be altered by stoichiometrically changing the composition, while for binary QDs band gap can only be tuned by changing the size of the QDs.
The average particle size of Zn1−xCdxSe (0 ≤ x ≤ 1):Cu 0.5% QDs for x = 0 and x = 1 was calculated using the effective mass approximation model (EMA) given as: where Eg(bulk) is the band gap energy of the bulk (1.74 eV for CdSe and 2.70 eV for ZnSe), Egis the optical band gap (calculated using Tauc relation) of the QDs,
  is the effective electron mass (0.13mo for CdSe and 0.17mo for ZnSe),
  is the effective hole mass (0.45mo for CdSe and 1.44mo for ZnSe),24mo is the rest mass of electron (9.1 × 10⁻³¹ kg), and R is the radius of the particle. The particle sizes obtained for CdSe and ZnSe QDs calculated using EMA model were found to be 4.62 nm and 4.24 nm, respectively. The obtained particle size confirms that the synthesized particles are in the quantum regime.
3.1.2. Emission spectra
Emission properties of QDs play a major role in optoelectronic and biological applications. The emission spectra of liquid samples of Zn1−xCdxSe (0 ≤ x ≤ 1):Cu 0.5% QDs with different Cd/Zn ratios are shown in Fig. 2. The spectra show that all the samples consist of two emission peaks, one at shorter wavelength (λ1) and one at longer wavelength (λ2). For x = 1, a low-intensity emission peak is observed at λ1 ∼ 523 nm and a broad high-intensity peak at λ2 ∼ 710 nm. The peak at the shorter wavelength is close to the absorption edge and therefore associated with near-band edge excitons, while the broad peak at longer wavelength is associated with trap states of dopant or intrinsic defects.28
Fig. 2. Room-temperature emission spectra of Zn1−xCdxSe (0 ≤ x ≤ 1):Cu 0.5% alloy QDs excited at 325 nm.
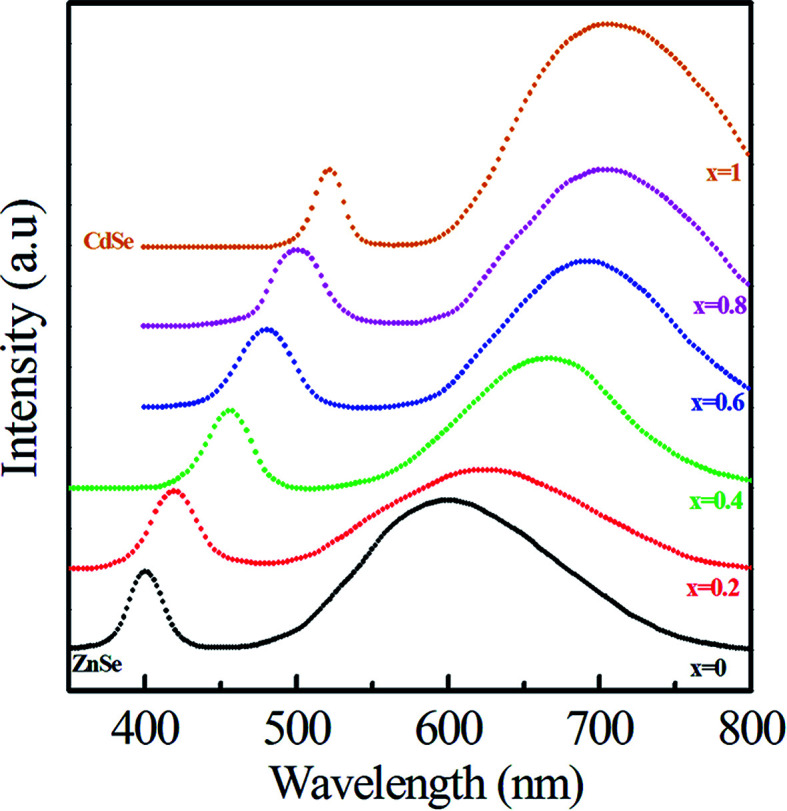
As x decreases, both emission peaks show a blue shift towards shorter wavelengths. The excitonic and dopant emission peaks shift to a shorter wavelength: 523–399.6 nm and 710–600 nm, respectively, when x decreases from 1.0 to 0.0. This trend is due to the substitution of smaller ions (Zn2+) for larger ions (Cd2+), leading to a decrease in the crystal lattice constant and an increase in the bandgap of QDs as well as increasing the distance between the conduction band and Cu dopant states. Table 2 summarizes the emission peaks observed for all the samples. The samples for x = 0.8 to x = 0.2 also consist of only two major emission peaks. If CdSe and ZnSe have been nucleated separately for x = 0.8 to x = 0.2, then the spectrum should have different emission and absorption peaks for CdSe and ZnSe QDs. The same trend of blue shift has been observed for peaks at longer wavelengths, due to the presence of dopant. The PL emission intensity for Cu-doped binary CdSe and ZnSe QDs is higher than that of ternary Zn1−xCdxSe (0 ≤ x ≤ 1) alloy QDs shown in Fig. 2. Owing to the quantum confinement effect, the emission wavelength for ZnSe QDs is less than 443 nm.29 For samples (x = 1 to x = 0.4), the emission peak at λ1 lies at wavelengths greater than 450 nm, thus ruling out the possibility of the formation of ZnSe QDs. For samples (x = 0.2 and x = 0), the emission peak lies at wavelengths of 421 nm and 400 nm, respectively. The concentration of Zn for samples (x = 0.2 and x = 0) is much longer than Cd. Therefore, for x = 0.2 and x = 0, the PL emission peak below 443 nm shows a dominance in the formation of ZnSe QDs. It should be noted that the bandgap of ternary alloy QDs may be smaller than that of either material comprising it. This phenomenon may be explained by the bowing effect, which is due to the differences in atomic radii, the lattice mismatch between binary subcompounds, and the electronegativities of the alloying elements. However, the results in Fig. 2 show that the bandgap of Zn1−xCdxSe (0.2 ≤ x ≤ 0.8) QDs is within the bandgaps of ZnSe and CdSe because the emission peaks of alloy Zn1−xCdxSe QDs are located between those of ZnSe and CdSe QDs. This result proves that the synthesized Zn1−xCdxSe QDs are homogeneous alloy instead of gradient alloy.20,21
Emission peaks of Zn1−xCdxSe (0 ≤ x ≤ 1):Cu 0.5% alloy QDs.
| S. no. | Sample | Emission peak | |
|---|---|---|---|
| Zn1−xCdxSe | λ 1 (nm) | λ 2 (nm) | |
| i | x = 1 (CdSe) | 523 | 710 |
| ii | x = 0.8 | 501.4 | 703 |
| iii | x = 0.6 | 480.8 | 693 |
| iv | x = 0.4 | 455 | 666 |
| v | x = 0.2 | 421 | 626 |
| vi | x = 0 (ZnSe) | 399.6 | 600 |
As the Cd/Zn ratio changes from x = 0 to x = 1, an observable red shift (600 nm-710 nm) was observed in the emission peak at longer wavelength λ2. The red shift in the emission peak results in the reduction of the band gap as the Cd/Zn ratio changes from x = 0 to x = 1. The decrease in the band gap is mostly due to the shift of the conduction band towards a lesser negative potential because the effective mass of electrons is much smaller than holes. Thus, recombination of the electron in the conduction band of host material and hole in Cu ‘T2’ state shifts the emission peak and produces a color tunable emission.30 The observed systematic composition-controlled shift of the absorption spectrum and emission maximum to shorter wavelength can be explained by the formation of Zn1-xCdxSe composite nanocrystals via intermixing wider band-gap ZnSe with narrower band-gap CdSe nanocrystals, rather than forming separate CdSe and ZnSe nanoparticles or core–shell structure CdSe/ZnSe.
3.1.3. X-ray diffraction
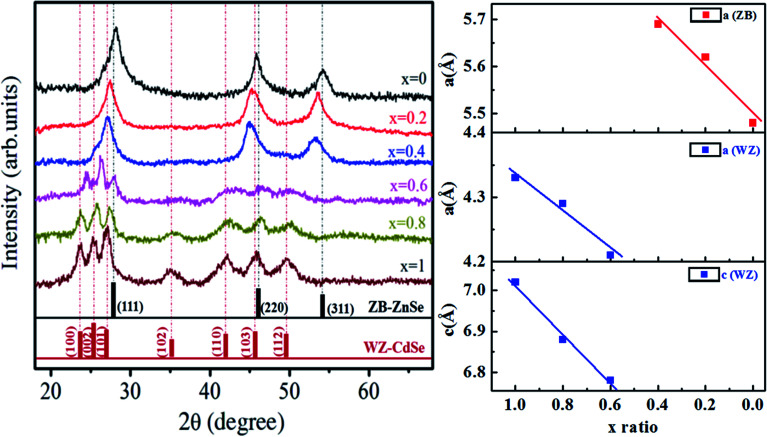
Fig. 3 shows the XRD spectra of Zn1−xCdxSe (0 ≤ x ≤ 1):Cu 0.5% alloy QDs to identify the structure of the synthesized doped ternary QDs. The presence of sharp peaks in the spectrum indicates the high crystallinity of synthesized specimens. The spectra of Zn1−xCdxSe:Cu 0.5% for x = 0 contains three major peaks at 28.16°, 45.84° and 54.34° corresponding to [111], [220] and [311], respectively. The peaks are well matched with JCPDS cards 77-2307 for CdSe and 80-0008 for ZnSe. The presence of these planes depicts the dominance of the zinc blende (ZB) cubic structure. For x = 0.2 and x = 0.4, it is observed that there is no new additional peak, but the diffraction peaks are slightly shifted towards shorter 2θ values.
Fig. 3. (Left) XRD pattern and (Right) plot of lattice parameters ‘a’ and ‘c’ versus composition of Zn1−xCdxSe (0 ≤ x ≤ 1):Cu 0.5% alloy QDs for hexagonal and cubic structure.
For x = 0.6, the diffraction spectra show some additional peaks at 2θ ∼ 24.36°, 26.24° and 27.98° corresponding to the [100], [002] and [101] planes. A broad hump for 2θ between 40° and 50° is observed for x = 0.6 due to the superposition of the [110], [103] and [200] planes. At higher concentrations of Cd i.e. for x = 0.8 and x = 1, clear prominent peaks observed between 23.5° and 28° shows the presence of [100], [002], [101] planes corresponding to the wurtzite (WZ) structure. The enhanced intensity of the peaks for x = 0.8 and x = 1 also represents better crystallinity. The relative intensities of the peaks change because of the change in the ZB/WZ phase. WZ structures are thermally more stable than ZB structures.31 The reason for the change in the structure from ZB to stable WZ after the incorporation of Cd at (x = 0.6) is because the bond dissociation energy of Cd–Se (310 kJ mol−1) is greater than that of Zn–Se (136 kJ mol−1).32 Therefore, it has been concluded that ternary alloy QDs of Zn1−xCdxSe (0 ≤ x ≤ 1):Cu 0.5% alloy QDs for 0 ≤ x ≤ 0.4, the crystal structure is ZB and for 0.6 ≤ x ≤ 1, the structure changes to WZ. Thus, the intermediate composition can be considered as a stage of structural transformation.
From the XRD spectra, the crystallite size of Zn1−xCdxSe (0 ≤ x ≤ 1):Cu 0.5% QDs was calculated using Debye Scherrer's formula, gives as: 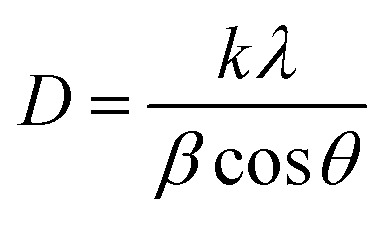 , where D is the average crystallite size, k is the Scherrer constant (∼0.91), λ is the X-ray wavelength (1.54 Å), β is the full width half maximum (FWHM), and θ is the Bragg's diffraction angle. The calculated values of dhkl using the Bragg's law show that the lattice spacing decreases with an increase in the concentration of Zn. The trend of a gradual decrease in the lattice spacing follows Vegard's law, thereby confirming the formation of an alloyed structure.33 The lattice parameter values ‘a’ for the ZB structure and ‘a’ and ‘c’ for the WZ phase of ternary alloy ZnxCd1−xSe:Cu 0.5% of different compositions were calculated and their dependence on composition was found to be in good agreement with Vegard's law, as shown in Fig. 3. Muthukumarasamy et al.34 reported a similar transformation of the crystal structure from cubic to hexagonal for CdSexTe1−x thin films at different concentrations. The different parameters calculated from the XRD spectra are summarized in Table 3. The obtained values of the lattice parameters for CdSe and ZnSe are well matched with the values reported in the literature.35,36 The calculated crystallite size shows that there is no significant variation in the crystallite size of the synthesized alloyed QDs with the Cd/Zn ratio. Therefore, it is concluded that, the change in the band gap is mostly due to the Cd/Zn ratio. The incorporation of Zn ions with smaller ionic radii as compared to Cd decreases the lattice parameters, thus reducing the unit cell. The presence of dopant also plays a role in the transformation of the structure. Accordingly, both dopant and host composition influence the formation of doped QDs. This finding is very noteworthy for the synthesis of QDs with the desired crystal structure.
Lattice parameters and crystallite size of Zn1−xCdxSe (0 ≤ x ≤ 1):Cu 0.5% alloy QDs.
| S. no. | Zn1−xCdxSe | 2θ | hkl | d hkl | Lattice parameters | Average crystallite size |
|---|---|---|---|---|---|---|
| i | x = 1 (CdSe) | 23.72°, 25.36°, 27.06° | [100], [002], [101] | 3.51 | a = 4.33 | 0.81 |
| 35.20° | [102] | c = 7.02 | ||||
| 42.24°, 46°, 49.76° | [103], [103], [112] | |||||
| ii | x = 0.8 | 23.64°, 25.84°, 27.34° | [100], [002], [101] | 3.44 | a = 4.29 | 0.94 |
| 35.36° | [102] | c = 6.89 | ||||
| 42.54°, 46.54°, 50.2° | [103], [103], [112] | |||||
| iii | x = 0.6 | 24.36° | [100] | 3.39 | a = 4.21 | 1.21 |
| 26.24° | [002] | c = 6.78 | ||||
| 27.98° | [101] | |||||
| Broad hump between 40° to 50° | Superposition of [110], [103] and [200] planes | |||||
| iv | x = 0.4 | 27.12° | [111] | 3.28 | a = 5.69 | 0.52 |
| 45.00° | [220] | |||||
| 53.24° | [311] | |||||
| v | x = 0.2 | 27.46° | [111] | 3.24 | a = 5.62 | 1.01 |
| 45.36° | [220] | |||||
| 53.6° | [311] | |||||
| vi | x = 0 (ZnSe) | 28.16° | [111] | 3.16 | a = 5.48 | 0.63 |
| 45.84° | [220] | |||||
| 54.34° | [311] |
3.1.4. Energy dispersive X-ray
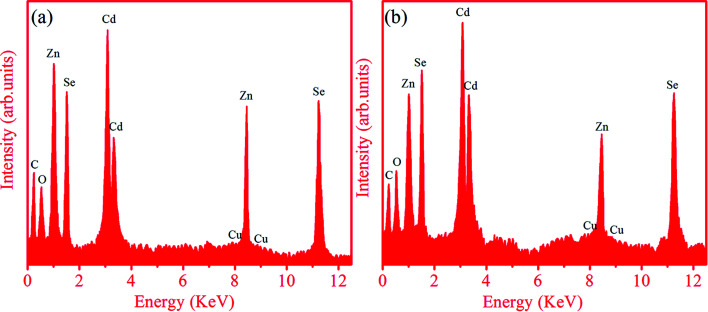
The EDX technique was employed to find the composition of the synthesized ternary QDs doped with 0.05% Cu. Fig. 4 represents the elemental composition of (a) Zn0.6Cd0.4Se:Cu 0.5%, and (b) Zn0.4Cd0.6Se:Cu 0.5% QDs recorded in the energy range of E = 0–12 keV. The peaks observed in the spectra clearly show the presence of Cu dopant in addition to Zn, Cd and Se in the entire width of the samples. The relative intensity of the Cd/Zn peak for the sample with x = 0.4 is smaller than that for the sample with x = 0.6, which matches the composition of the elements in the sample. The small presence of Cu in the spectra for both samples means that the dopant is not adsorbed over the surface, but the core doping of ZnCdSe.37 The average atomic percentages for all constituents of the Zn1−xCdxSe (0 ≤ x ≤ 1):Cu 0.5% alloy QDs for x = 0.4 and 0.6 are listed in Table 4.
Fig. 4. EDX spectra of QDs: (a) Zn0.6Cd0.4Se:Cu 0.5%, and (b) Zn0.4Cd0.6Se:Cu 0.5% QDs.
Atomic (%) and weight (%) of Zn0.4Cd0.6Se:Cu 0.5% and Zn0.6Cd0.4Se:Cu 0.5% QDs.
| Sample | Element | Atomic% | Weight% |
|---|---|---|---|
| Zn0.4Cd0.6Se:Cu 0.5% | Cd | 33.41 | 46.09 |
| Zn | 17.99 | 14.43 | |
| Se | 38.72 | 37.52 | |
| Cu | 0.42 | 0.33 | |
| C | 4.33 | 0.64 | |
| O | 5.13 | 1.01 | |
| Zn0.6Cd0.4Se:Cu 0.5% | Cd | 26.32 | 36.31 |
| Zn | 28.53 | 22.89 | |
| Se | 35.54 | 34.44 | |
| Cu | 0.44 | 0.34 | |
| C | 4.91 | 0.72 | |
| O | 4.26 | 0.84 |
The weight percentages for the samples were also calculated using atomic (%). The measured compositions were relatively close to the stoichiometric ratios of the prepared samples. The calculated percentages of elements are in accordance with the composition used for synthesis. This suggests our success in using a wet chemical method to prepare doped ternary alloy semiconductors with different Zn/Cd compositions.
3.1.5. Raman spectra
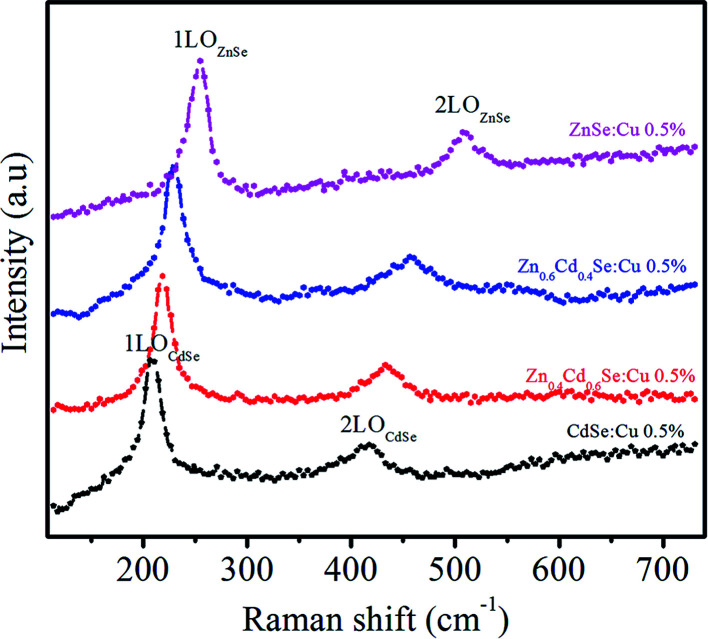
The crystal quality was assessed by investigating the RS spectra of the synthesized ternary QDs. Fig. 5 shows the RS spectra of synthesized samples Zn1−xCdxSe (with x = 0, 0.4, 0.6 and 1):Cu 0.5% alloy QDs excited at 2.54 eV (488 nm). For sample CdSe (x = 1), the peak observed at 207 cm−1 corresponds to the first longitudinal optical phonon (1LOCdSe) mode and is ∼3 cm−1 shorter than the corresponding peak of bulk CdSe (210 cm−1).38,39
Fig. 5. RS of Zn1−xCdxSe (with x = 0, 0.4, 0.6 and 1):Cu 0.5% alloy QDs.
This red shift in the phonon mode is due to the confinement of optical phonons. The second peak at 415 cm−1 associated with the 2LO phonon mode is under resonant excitation conditions. The optical mode frequencies of ZnSe (x = 0) are observed at ω1LO ∼ 250 cm−1 and ω2LO ∼ 501 cm−1, which are associated with the 1LO and 2LO-phonon modes of ZnSe QDs. For samples with x = 0.6 and 0.4, the two peaks are still observed and slightly shifted to longer wavenumbers i.e. 218 cm−1, 434 cm−1 and 228 cm−1, 458 cm−1, respectively. The frequencies obtained for LO modes for x = 0.6 and 0.4 in the alloy do not correspond to the average frequency between the modes of the binary compounds. It has been observed that as the composition changes, the frequencies of alloys shift from the optical mode energy of CdSe towards ZnSe energy. The shift towards longer wavenumbers after the incorporation of Zn is because the atomic mass of the substituted Zn ion is smaller than Cd.40 However, the lattice parameters also change after mixing ZnSe and CdSe as compared to the bulk; therefore, the phonon frequency is altered and depends on the alloy composition. Xu41et al. observed a similar shift in the phonon frequency of ZnxCd1−xSe alloys by changing their composition.
3.2. Effect of dopant concentration
3.2.1. Absorption and emission spectra
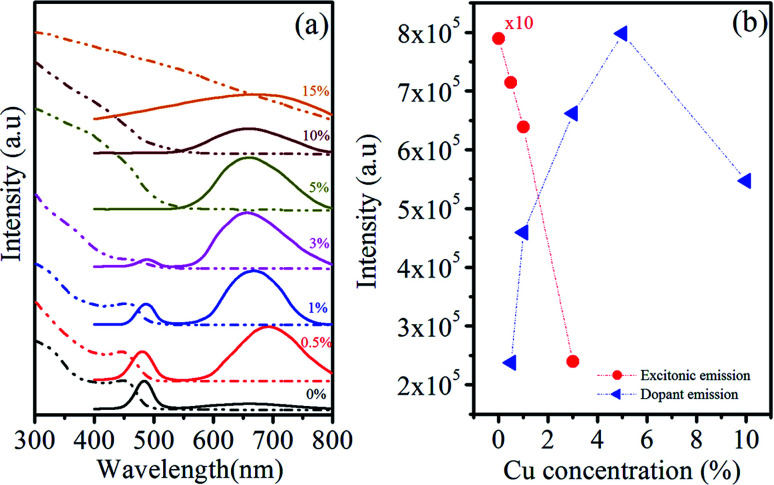
Fig. 6(a) shows the absorption and emission spectra of Zn0.5Cd0.5Se:Cu (y%, y = 0–15) alloy QDs with varying amounts of Cu dopant. The absorption results reveal that a sharp first exciton absorption peak and absorption edge are observed at 455 nm and 490 nm, respectively, in the absence of dopant Cu for ternary QDs (y = 0%). A negligible shift in the excitonic absorption peak and edge have been noticed for the Cu concentration (0–1%). As the concentration of Cu increases to 3%, the first exciton peak start diminishing.
Fig. 6. (a) Room-temperature UV-vis absorption and PL spectra, (b) emission intensity variation of Zn0.5Cd0.5Se:Cu (y%, y = 0–15) alloy QDs.
Therefore, it can be interpreted that the incorporation of 1% Cu dopant does not affect the absorption properties of host Zn0.5Cd0.5Se as photon absorption arises mainly from the ternary QDs. It is seen that the size and composition of the host ternary QDs do not depend on the dopant because the 1% Cu dopant does not affect the position and intensity of excitonic absorption. As the concentration of Cu is further enhanced (y = 3% to 5%), the absorption edge disappeared and a broadened absorption tail towards long wavelengths is observed. The red shift observed in the absorption edge for Cu (3% to 15%) is due to the narrowed band gap associated with the Cu2+ level occupying in the band gap.
It is well known that the intrinsic defects, size-dependent band gap, and surface defects of QDs are all involved in the PL emission. Datas in Table 5 show that the emission peak is observed at λ1 ∼ 483 nm for Zn0.5Cd0.5Se:Cu y% at y = 0% and for y = 0.5% and y = 1%, two emission peaks are observed at shorter and longer wavelengths at λ1 ∼ 481 nm, λ2 ∼ 692 nm and λ1 ∼ 484 nm, λ2 ∼ 668 nm, respectively. This emission peak at shorter wavelengths arises from the host material associated with near-band-edge excitons and is classically termed as self-activated luminescence. The peak positions at shorter wavelength (Table 5) shows that there is no significant change in the position of the peak with the increase in the Cu concentration. Chawla et al.42 observed a similar trend in the emission spectra of Zn0.9Cd0.1S QDs doped with different concentrations of Cu. The luminescence band centered at longer wavelength λ2 is associated with the trap states of Cu, called dopant emission. Similar peaks due to Cu-related luminescence centres have been reported in the literature.43,44 The PL emission peak at longer wavelength λ2 blue-shifted from 692 nm to 659 nm with increasing Cu concentration. The blue shift is due to the more replacement of Cd ions with smaller radius ions of Cu with increasing concentrations of Cu. Thus, the concentration of free electrons increases and enhances the bandgap of Cu-doped Zn0.5Cd0.5Se QDs.
Absorption and emission peaks of Zn0.5Cd0.5Se:Cu (y%, y = 0–15) alloy QDs.
| S. no. | Sample | Absorption peak (nm) | Emission peak (nm) | |
|---|---|---|---|---|
| λ 1 | λ 2 | |||
| i | y = 0 | 455 | 483 | — |
| ii | y = 0.5 | 450 | 481 | 692 |
| iii | y = 1 | 456 | 484 | 668 |
| iv | y = 3 | — | 486 | 656 |
| v | y = 5 | — | — | 662 |
| vi | y = 10 | — | — | 659 |
| vii | y = 15 | — | Broad spectra | |
Fig. 6(b) shows the change in the emission intensity at λ1 and λ2 with changes in the dopant concentration. As the concentration of Cu increases from y = 3–10%, the emission at shorter wavelength λ1 completely quenches, while at longer wavelengths λ2 emission peak is still observed. This reveals that after a particular concentration of dopant in the host material CuS or Cu2S formed at the surface of the host material and quenched the emission from the host material. The dopant emission intensity increases with the Cu concentration from y = 0.5% to y = 10%. The Cu concentration at y = 15% completely quenches the PL emission of Zn0.5Cd0.5Se:Cu y% ternary alloy QDs. The high concentration of Cu in the host material enhances the nonradiative transitions between neighbouring dopant ions and quenches the PL intensity.45
It is found that excitonic emission is much weaker and narrower than Cu-related emission. The broadness in the dopant emission is due to the different energies in the T2 and E levels of Cu ions. The absorption and emission spectra show similar dependence on the amount of Cu dopant and this dependence is summarized in Table 5. The obtained spectra reveal the dual emission from Cu-doped ternary QDs, which covers the entire visible spectral window. The tunable and dual emission of Cu-doped ternary QDs can be a potential for colour tunable emitters with applications such as light-emitting devices, lasers, and biomedical fluorescent labels.
3.2.2. X-ray spectra
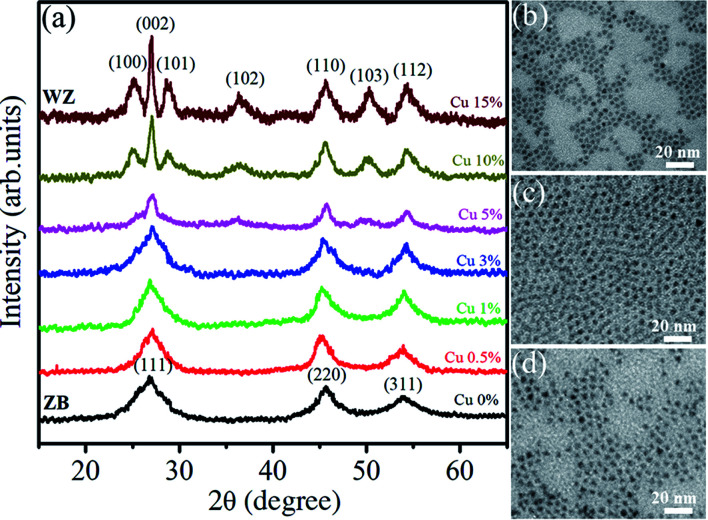
Fig. 7(a) shows the XRD spectra of Zn0.5Cd0.5Se:Cu y% (y = 0–15) alloy QDs. The sharp peaks indicate the crystalline nature of the synthesized samples. For the Zn0.5Cd0.5Se:Cu (y = 0%) major peaks are located at 26.92°, 45.64°, and 53.94° corresponding to the [111], [220] and [311] planes, respectively. The obtained planes correspond to the cubic structure of ternary QDs in the absence of dopant. For Cu (y = 0.5 to 3%), the three major peaks do not show a major shift in 2θ. Thus the Cu concentration of (0.5% to 3%) does not affect the structure of the synthesized ternary alloys. For y = 5%, the sharpness of the peaks reduced due to the poor crystallinity of the nanostructure. For y = 10%, the peaks observed at 25.08°, 27°, 28.74°, 36.32°, 45.64°, 50.24° and 54.36° corresponds to [100], [002], [101], [102], [110], [103] and [112], respectively. The planes observed for y = 10% and 15% show the dominance of the hexagonal structure. For samples y = 0% to 3%, the diffraction peak for plane [111] slightly shifts towards higher 2θ values, reflecting the reduction in lattice parameters. A similar trend was observed for hexagonal structures i.e. for y = 10% and 15%. Therefore, the XRD results demonstrate that it follows Vegard's law. Vegard's law indicates that for alloys such as a linear relationship exists between the lattice parameter and the composition of the alloy at a constant temperature.
Fig. 7. (a) XRD pattern of Zn0.5Cd0.5Se:Cu (y%, y = 0–15) alloy QDs. TEM images: (b) Zn0.5Cd0.5Se, (c) Zn0.5Cd0.5Se:Cu 5%, and (d) Zn0.5Cd0.5Se:Cu 15%.
TEM images of three typical Zn0.5Cd0.5Se:Cu (y%, y = 0, 5 and 15) QDs with the same scale bar of 20 nm are shown in Fig. 7(b)–(d). Micrographs indicate that the samples consist of cube and triangular shaped QDs. Their average size is about 5 nm and is less changed by varying Cu concentration.
3.2.3. PL decay
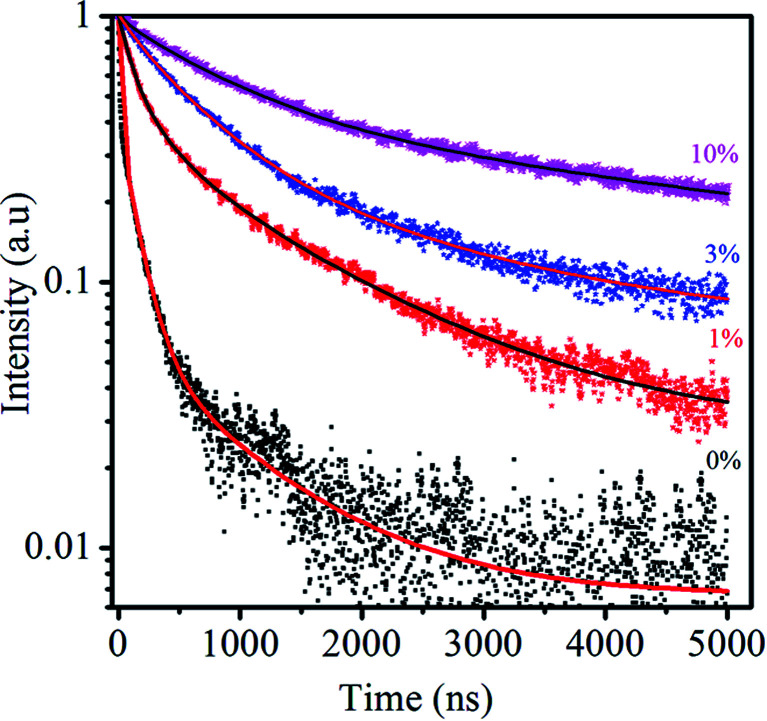
Fig. 8 shows the PL decay kinetics of Zn0.5Cd0.5Se:Cu (y%, y = 0, 1, 3, 10) alloy QDs excited at 488 nm. The PL lifetime provides useful information to investigate the PL mechanism because the different PL decay lifetimes may result from different electron–hole recombination mechanisms.45 As reported earlier for semiconductor QDs, the PL lifetime of excitonic emission as well as the surface trap emission fall on the order of 1 and 10 nanoseconds (ns), respectively.46,47 After the incorporation of the dopant, an additional energy state will be added by the dopant, which enhances the excited state lifetime. The spectra reveal that the ternary QDs decay faster than the doped QDs and obey a multiexponential function. Dopant Cu provides intrinsic radiative stability to ternary QDs.
Fig. 8. PL-decay kinetics of Zn0.5Cd0.5Se:Cu (y%, y = 0, 1, 3, 10) alloy QDs excited at 488 nm, measured at the emission peak of Cu and/or the surface. The solid lines are fitting curves to a multi-exponential function.
The PL decay can be fitted to a triexponential function: 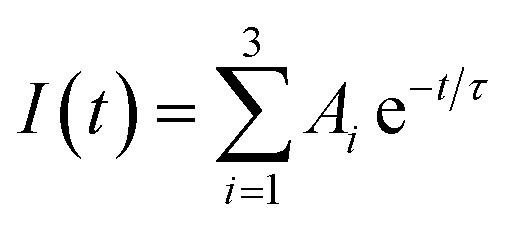 . The average PL decay lifetime can be calculated by equation:
 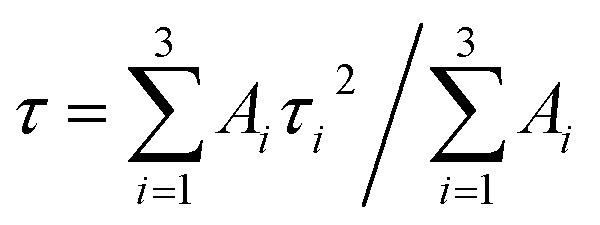 .48Ai and τi are the magnitude and lifetime of the ith component, respectively. The PL decay time (i.e., the excited state lifetimes, τ1/e), at which the PL intensity decreases to 1/e of its initial value, was used to compare the lifetimes. Table 6 shows the PL decay time for all the samples. The shortest lifetime is observed for undoped ternary QDs with τ1 = 8.9 ns attributed to the band edge emission of excitons, while τ2 = 921.6 and τ3 = 140.4 ns correspond to deep trap emission associated with surface defects and dark exciton states in QDs, respectively.49,50 The longest lifetime is observed for the dopant Cu (10%) with an average lifetime of 2394.5 ns. The change in the lifetime ternary QDs after the incorporation of the Cu dopant (1–10%) increases from 5 to 22 times as compared to undoped ternary QDs. This observed longer lifetime confirms the emission associated with the Cu dopant transition, but not from the surface states of the host QDs. The PL lifetimes were dependent on the composition/structure of the host QDs.
Experimental values of time constants obtained for Zn0.5Cd0.5Se:Cu (y%, y = 0, 1, 3, 10) alloy QDs. The numbers in brackets are the amplitude percentage of each component.
| y (%) | τ 1 (ns) | τ 2 (ns) | τ 3 (ns) | 〈τ〉 (ns) |
|---|---|---|---|---|
| 0 | 8.9 (58.5%) | 921.6 (5.4%) | 140.4 (35.8%) | 105.2 |
| 1 | 107.6 (37.4%) | 282.9 (29.1%) | 1345.5 (33.5%) | 573.3 |
| 3 | 135.9 (6.7%) | 589.2 (66.5%) | 2106.5 (26.8%) | 965.5 |
| 10 | 156.1 (4.6%) | 953 (50.3%) | 4230.7 (45.1%) | 2394.5 |
4. Conclusion
In summary, one-step chemical route method was adopted to synthesize ternary Zn1−xCdxSe (0 ≤ x ≤ 1) the QDs doped with y% Cu (y = 0% to 15%). The stoichiometric ratio of Zn/Cd precursors in the host Zn1−xCdxSe tune the emission and absorption properties of doped ternary QDs. Two emission peaks observed from Cu-doped ternary QDs, covering the entire visible spectrum, suggest the great potential in optoelectronic applications. The constituent ratio of the host and dopant concentration changes the crystal structure from ZB to WZ. The dopant concentration also influences the optical properties. The intensity of the emission peaks increases for dopant concentration upto 5% and completely quenches the emission at y = 15%. The formation of the Cu-doped ternary alloy and the elemental composition are deduced from the EDX. The crystal structure changes from cubic to hexagonal depending on the concentration of the host components and dopant. The PL lifetime decay for Cu-doped Zn1−xCdxSe (0 ≤ x ≤ 1) QDs increases from 5 to 22 times for different dopant concentrations. With an increase in stability, the doped QDs could be promising structures for biosensor and optoelectronic applications.
Conflicts of interest
There are no conflicts to declare.
Supplementary Material
Acknowledgments
This work is supported by Thai Nguyen University of Technology (Grant No. T2019-B18).
References
- Zhu C. Chen Z. Gao S. Goh B. L. Samsudin I. B. Lwe K. W. Wu Y. Wu C. Su X. Recent advances in non-toxic quantum dots and their biomedical applications. Prog. Nat. Sci.: Mater. Int. 2019;29:628–640. doi: 10.1016/j.pnsc.2019.11.007. [DOI] [Google Scholar]
- Ke J., Semiconductor Nanocrystal-Based Nanosensors and Metal Ions Sensing, in Advanced Nanomaterials for Pollutant Sensing and Environmental Catalysis, 2020, pp. 79–117 [Google Scholar]
- Ca N. X. Hien N. T. Tan P. M. Phan T. L. Thanh L. D. Do P. V. Bau N. Q. Lien V. T. K. Van H. T. Tunable dual emission in type-I/type-II CdSe/CdS/ZnSe nanocrystals. J. Alloys Compd. 2019;791:144–151. doi: 10.1016/j.jallcom.2019.03.333. [DOI] [Google Scholar]
- Kondratenko T. S. Zvyagin A. I. Smirnov M. S. Grevtseva I. G. Perepelitsa A. S. Ovchinnikov O. V. Luminescence and nonlinear optical properties of colloidal Ag2S quantum dots. J. Lumin. 2019;208:193–200. doi: 10.1016/j.jlumin.2018.12.042. [DOI] [Google Scholar]
- Akbari M. Nasrabadi M. R. Pourmasud S. Arani M. E. Banafshe H. R. Ahmadi F. Ganjali M. R. Sobhani nasab A. CdTe quantum dots prepared using herbal species and microorganisms and their anti-cancer, drug delivery and antibacterial applications; a review. Ceram. Int. 2020;46:9979–9989. doi: 10.1016/j.ceramint.2020.01.051. [DOI] [Google Scholar]
- Chung S. R. Wang K. W. Chen H. S. Chen H. H. Novel red-emission of ternary ZnCdSe semiconductor Nanocrystals. J. Nanopart. Res. 2015;17:1–9. doi: 10.1007/s11051-015-2906-8. [DOI] [Google Scholar]
- Wang X. Ren X. Kahen K. Hahn M. A. Rajeswaran M. Maccagnano-Zacher S. Silcox J. Cragg G. E. Efros A. L. Krauss T. D. Non-blinking semiconductor nanocrystals. Nature. 2009;459:686–689. doi: 10.1038/nature08072. [DOI] [PubMed] [Google Scholar]
- Swafford L. A. Weigand L. A. Bowers M. J. McBride J. R. Rapaport J. L. Watt T. L. Dixit S. K. Feldman L. C. Rosenthal S. J. J. Homogeneously Alloyed CdSxSe1−x Nanocrystals: Synthesis, Characterization, and Composition/Size-Dependent Band Gap. J. Am. Chem. Soc. 2006;128:12299–12306. doi: 10.1021/ja063939e. [DOI] [PubMed] [Google Scholar]
- Putri L. K. Ng B. J. Ong W. J. Lee H. W. Chang W. S. Mohamed A. R. Chai S. P. Energy level tuning of CdSe colloidal quantum dots in ternary 0D–2D–2D CdSe QD/B-rGO/O-gC3N4 as photocatalysts for enhanced hydrogen generation. Appl. Catal., A. 2020;265:118592. doi: 10.1016/j.apcatb.2020.118592. [DOI] [Google Scholar]
- Song X. Ma Z. Li L. Tian T. Yan Y. Su J. Deng J. Xia C. Aqueous synthesis of alloyed CdSexTe1−x colloidal quantum dots and their in situ assembly within mesoporous TiO2 for solar cells. Sol. Energy. 2020;196:513–520. doi: 10.1016/j.solener.2019.12.049. [DOI] [Google Scholar]
- Shoja A. Habibi-Yangjeh A. Mousavi M. Vadivel S. Preparation of novel ternary TiO2 QDs/CDs/AgI nanocomposites with superior visible-light induced photocatalytic activity. J. Photochem. Photobiol., A. 2019;385:112070. doi: 10.1016/j.jphotochem.2019.112070. [DOI] [Google Scholar]
- Tsolekile N. Parani S. Matoetoe M. C. Songca S. P. Oluwafemi O. S. Evolution of ternary I–III–VI QDs: Synthesis, characterization and application. Nano-Struct. Nano-Objects. 2017;12:46–56. doi: 10.1016/j.nanoso.2017.08.012. [DOI] [Google Scholar]
- Girma W. M. Fahmi M. Z. Permadi A. Abate M. A. Chang J. Y. Synthetic strategies and biomedical applications of I–III–VI ternary quantum dots. J. Mater. Chem. B. 2017;5:6193–6216. doi: 10.1039/C7TB01156C. [DOI] [PubMed] [Google Scholar]
- Wang J. Lin W. Dong M. Xing Y. Zhang Q. Facile synthesize of CdS QDs decorated Bi2MoO6/Bi2Mo3O12 heterojunction photocatalysts and enhanced performance of visible light removal of organic pollutants. Environ. Technol. 2020:1–14. doi: 10.1080/09593330.2020.1737243. [DOI] [PubMed] [Google Scholar]
- Wageh S. Karabulut A. Dere A. Al-Sehemi A. G. Al-Ghamdi A. A. El-Tantawy F. Yakuphanoglu F. Photodiode based on Pb0.9Cd0.1S ternary alloy semiconductor for solar tracking systems. J. Mater. Sci.: Mater. Electron. 2018;29:16880–16893. doi: 10.1007/s10854-018-9783-8. [DOI] [Google Scholar]
- Ma W. Luther J. M. Zheng H. Wu Y. Alivisatos A. P. Photovoltaic Devices Employing Ternary PbSxSe1−x Nanocrystals. Nano Lett. 2009;9:1699–1703. doi: 10.1021/nl900388a. [DOI] [PubMed] [Google Scholar]
- Ca N. X. Hien N. T. Luyen N. T. Lien V. T. K. Thanh L. D. Do P. V. Bau N. Q. Pham T. T. Photoluminescence properties of CdTe/CdTeSe/CdSe core/alloyed/shell type-II quantum dots. J. Alloys Compd. 2019;787:823–830. doi: 10.1016/j.jallcom.2019.02.139. [DOI] [Google Scholar]
- Ca N. X. Hien N. T. Loan P. N. Tan P. M. Thuy U. T. D. Phan T. L. Nguyen Q. B. Optical and Ferromagnetic Properties of Ni-Doped CdTeSe Quantum Dots. J. Electron. Mater. 2019;48:2593–2599. doi: 10.1007/s11664-019-07017-9. [DOI] [Google Scholar]
- Zhang K. Zhou D. Qiu J. Long Z. Zhu R. Wang Q. Lai J. Wu H. Zhu C. Silver nanoparticles enhanced luminescence and stability of CsPbBr3 perovskite quantum dots in borosilicate glass. J. Am. Ceram. Soc. 2020;103:2463–2470. doi: 10.1111/jace.16966. [DOI] [Google Scholar]
- Grandhi G. K. Viswanatha R. Tunable infrared phosphors using Cu doping in semiconductor nanocrystals: Surface electronic structure evaluation. J. Phys. Chem. Lett. 2013;4:409–415. doi: 10.1021/jz3021588. [DOI] [PubMed] [Google Scholar]
- Zhang W. Zhou X. Zhong X. One-Pot Noninjection Synthesis of Cu-Doped ZnxCd1−xS Nanocrystals with Emission Color Tunable over Entire Visible Spectrum. Inorg. Chem. 2012;51:3579–3587. doi: 10.1021/ic2024023. [DOI] [PubMed] [Google Scholar]
- Hu Y. Hu B. Wu B. Wei Z. Li J. Hydrothermal preparation of ZnS: Mn quantum dots and the effects of reaction temperature on its structural and optical properties. J. Mater. Sci.: Mater. Electron. 2018;29:16715–16720. doi: 10.1007/s10854-018-9764-y. [DOI] [Google Scholar]
- Babu B. Kadam A. N. Ravikumar R. V. S. S. N. Byon C. Enhanced visible light photocatalytic activity of Cu-doped SnO2 quantum dots by solution combustion synthesis. J. Alloys Compd. 2017;703:330–336. doi: 10.1016/j.jallcom.2017.01.311. [DOI] [Google Scholar]
- Sonawane K. G. Patil K. R. Mahamuni S. One pot synthesis, growth mechanism and optical properties of Zn1−xCdxSe graded core/shell and alloy nanocrystals. J. Lumin. 2013;135:154–159. doi: 10.1016/j.jlumin.2012.10.042. [DOI] [Google Scholar]
- Bharti S. Kaur G. Gupta S. Tripathi S. K. PEGylation of CdSe/ZnS core/shell nanoparticles and its behavior at different pH. J. Lumin. 2017;181:459–466. doi: 10.1016/j.jlumin.2016.09.005. [DOI] [Google Scholar]
- Sharma A. B. Sharma S. K. Sharma M. Pandey R. K. Reddy D. S. Structural and optical investigation of semiconductor CdSe/CdS core–shell quantum dot thin films. Spectrochim. Acta, Part A. 2009;72:285–290. doi: 10.1016/j.saa.2008.09.031. [DOI] [PubMed] [Google Scholar]
- Makuła P. Pacia M. Macyk W. How to correctly determine the band gap energy of modified semiconductor photocatalysts based on UV-vis spectra. J. Phys. Chem. Lett. 2018;9:6814–6817. doi: 10.1021/acs.jpclett.8b02892. [DOI] [PubMed] [Google Scholar]
- Califano M. Franceschetti A. Zunger A. Temperature Dependence of Excitonic Radiative Decay in CdSe Quantum Dots: The Role of Surface Hole Traps. Nano Lett. 2005;5:2360–2364. doi: 10.1021/nl051027p. [DOI] [PubMed] [Google Scholar]
- Chung S. R. Wang K. W. Chen H. S. Green Light Emission of ZnxCd1−xSe Nanocrystals Synthesized by One-Pot Method. J. Nanomater. 2013;2013:1–9. doi: 10.1155/2013/526862. [DOI] [Google Scholar]
- Wu Z. Liu H. Li T. Liu J. Yin J. Mohammed O. F. Bakr O. M. Liu Y. Yang B. Zhang H. Contribution of Metal Defects in the Assembly Induced Emission of Cu Nanoclusters. J. Am. Chem. Soc. 2017;139:4318–4321. doi: 10.1021/jacs.7b00773. [DOI] [PubMed] [Google Scholar]
- Grossmann B. Schalk N. Czettl C. Pohler M. Mitterer C. Phase composition and thermal stability of arc evaporated Ti1−xAlxN hard coatings with 0.4 ≤ x ≤ 0.67. Surf. Coat. Technol. 2017;309:687–693. doi: 10.1016/j.surfcoat.2016.11.015. [DOI] [Google Scholar]
- Gao F. Liu Y. Fan Y. Zhao D. Synthesis of N-acetyl-l-cysteine-capped ZnCdSe quantum dots via hydrothermal method and their characterization. Sci. Technol. Adv. Mater. 2014;15:055001. doi: 10.1088/1468-6996/15/5/055001. [DOI] [PMC free article] [PubMed] [Google Scholar]
- Tho P. T. Vinh N. D. Van H. T. Tan P. M. Hoa V. X. Kien N. T. Hien N. T. Van N. T. K. Ca N. X. Effects of chemical affinity and injection speed of Se and Te precursors on the development kinetic and optical properties of ternary alloyed CdTe1−xSex nanocrystals. J. Phys. Chem. Solids. 2020;139:109332. doi: 10.1016/j.jpcs.2020.109332. [DOI] [Google Scholar]
- Muthukumarasamy N. Jayakumar S. Kannan M. D. Balasundaraprabhu R. Structural phase change and optical band gap bowing in hot wall deposited CdSexTe1−x thin films. Sol. Energy. 2009;83:522–526. doi: 10.1016/j.solener.2008.10.004. [DOI] [Google Scholar]
- Kandasamy K. Singh H. B. Kulshreshtha S. K. Synthesis and characterization of CdS and CdSe nanoparticles prepared from novel intramolecularly stabilized single-source precursors. J. Chem. Sci. 2009;121:293–296. doi: 10.1007/s12039-009-0032-9. [DOI] [Google Scholar]
- Verma M. Kaswan A. Patidar D. Sharma K. B. Saxena N. S. Phase transformation and thermal stability of ZnSe QDs due to annealing: emergence of ZnO. J. Mater. Sci.: Mater. Electron. 2016;27:8871–8878. doi: 10.1007/s10854-016-4912-8. [DOI] [Google Scholar]
- Verma S. K. Verma R. Li N. Xiong D. Tian S. Xiang W. Zhang Z. Xie Y. Zhao X. Fabrication and band engineering of Cu-doped CdSe0.6Te0.4-alloyed quantum dots for solar cells. Sol. Energy Mater. Sol. Cells. 2016;157:161–170. doi: 10.1016/j.solmat.2016.05.029. [DOI] [Google Scholar]
- Camacho J. Loa I. Cantarero A. Syassen K. Hernandez-Calderon I. Gonzalez L. Pressure dependence of optical phonons in ZnCdSe alloys. Phys. Status Solidi B. 2003;235:432–436. doi: 10.1002/pssb.200301597. [DOI] [Google Scholar]
- Ca N. X., Hien N. T., Luyen N. T. and Tan P. M., Near-Infrared Emitting Type-II CdTe/CdSe Core/Shell Nanocrystals: Synthesis and Optical Properties, ICERA 2018, 2019, vol. LNNS 63, pp. 398–407 [Google Scholar]
- Kaœbyshev V. K. Travnikov V. V. Davydov V. Yu. Resonant Raman scattering spectra in a ZnCdSe/ZnSe structure with a quantum well and open nanowires. Phys. Solid State. 2003;45:1374–1378. doi: 10.1134/1.1594257. [DOI] [Google Scholar]
- Xu J. Yang X. Wang H. Chen X. Luan C. Xu Z. Lu Z. Roy V. A. L. Zhang W. Lee C. S. Arrays of ZnO/ZnxCd1−xSe Nanocables: Band Gap Engineering and Photovoltaic Applications. Nano Lett. 2011;11:4138–4143. doi: 10.1021/nl201934k. [DOI] [PubMed] [Google Scholar]
- Chawla A. K. Singhal S. Nagar S. Gupta H. O. Chandra R. Study of composition dependent structural, optical, and magnetic properties of Cu doped Zn1−xCdxS nanoparticles. J. Appl. Phys. 2010;108:123519. doi: 10.1063/1.3524516. [DOI] [Google Scholar]
- Mandal P. Talwar S. S. Major S. S. Srinivasa R. S. Orange-red luminescence from Cu doped CdS nanophosphor prepared using mixed Langmuir–Blodgett multilayers. J. Chem. Phys. 2008;128:114703. doi: 10.1063/1.2888930. [DOI] [PubMed] [Google Scholar]
- Hien N. T. Tan P. M. Van H. T. Lien V. T. K. Do P. V. Loan P. N. Kien N. T. Luyen N. T. Ca N. X. Photoluminescence properties of Cu-doped CdTeSe alloyed quantum dots versus laser excitation power and temperature. J. Lumin. 2020;218:116838. doi: 10.1016/j.jlumin.2019.116838. [DOI] [Google Scholar]
- Lien V. T. K. Tan P. M. Hien N. T. Hoa V. X. Chi T. T. K. Truong N. X. Oanh V. T. K. Thuy N. T. M. Ca N. X. Tunable photoluminescent Cu-doped CdS/ZnSe type-II core/shell quantum dots. J. Lumin. 2019;215:116627. doi: 10.1016/j.jlumin.2019.116627. [DOI] [Google Scholar]
- Kim H. Investigation of the relation between photoluminescence intensity and decay time reduction with plasmon effect in InGaAs quantum dots. Curr. Appl. Phys. 2019;19:946–949. doi: 10.1016/j.cap.2019.05.005. [DOI] [Google Scholar]
- Aldeek F. Balan L. Medjahdi G. Roques-Carmes T. Malval J. P. Mustin C. Ghanbaja J. Schneider R. Enhanced Optical Properties of Core/Shell/Shell CdTe/CdS/ZnO Quantum Dots Prepared in Aqueous Solution. J. Phys. Chem. C. 2009;113:19458–19467. doi: 10.1021/jp905695f. [DOI] [Google Scholar]
- Yakoubi A. Chaabane T. B. Aboulaich A. Mahiou R. Balan L. Medjahdi G. Schneider R. Aqueous synthesis of Cu-doped CdZnS quantum dots with controlled and efficient photoluminescence. J. Lumin. 2016;175:193–202. doi: 10.1016/j.jlumin.2016.02.035. [DOI] [Google Scholar]
- Kaur G. Tripathi S. K. Probing photoluminescence dynamics of colloidal CdSe/ZnS core/shell nanoparticles. J. Lumin. 2014;155:330–337. doi: 10.1016/j.jlumin.2014.06.052. [DOI] [Google Scholar]
- Jiang T. Song J. Wang H. Ye X. Wang H. Zhang W. Yang M. Xia R. Zhu L. Xu X. Aqueous synthesis of color tunable Cu doped Zn–In–S/ZnS nanoparticles in the whole visible region for cellular imaging. J. Mater. Chem. B. 2015;3:2402–2410. doi: 10.1039/C4TB01957A. [DOI] [PubMed] [Google Scholar]


