Abstract
This study employs a commercial multifilament cotton thread as a low-cost microbial identification assay integrated with smartphone-based imaging for high throughput and rapid detection of pathogens. The thread device with inter-twined fibers was drop-cast with test media and a pH indicator. The target pathogens scavenge the media components with different sugars and release acidic by-products, which in turn act as markers for pH-based color change. The developed thread-based proof-of-concept was demonstrated for the visual color detection (red to yellow) of Candida albicans (≈16 hours) and Escherichia coli (≈5 hours). Besides that, using a smart-phone to capture images of the thread-based colorimetric assay facilitates early detection of turning point of the pH-based color change and further reduces the detection time of pathogens viz. Candida albicans (≈10 hours) and Escherichia coli (≈1.5 hours). The reported thread and smartphone integrated image analysis works towards identifying the turning point of the colorimetric change rather than the end-point analysis. Using this approach, the interpretation time can be significantly reduced compared to the existing conventional microbial methods (≈24 hours). The thread-based colorimetric microbial assay represents a ready-to-use, low-cost and straightforward technology with applicability in resource-constrained environments, surpassing the need for frequent fresh media preparation, expensive instrumentation, complex fabrication techniques and expert intervention. The proposed method possesses high scalability and reproducibility, which can be further extended to bio(chemical) assays.
A proof-of-concept unifying thread devices and smart-phone imaging for low-cost microbial detection based on simple colour change.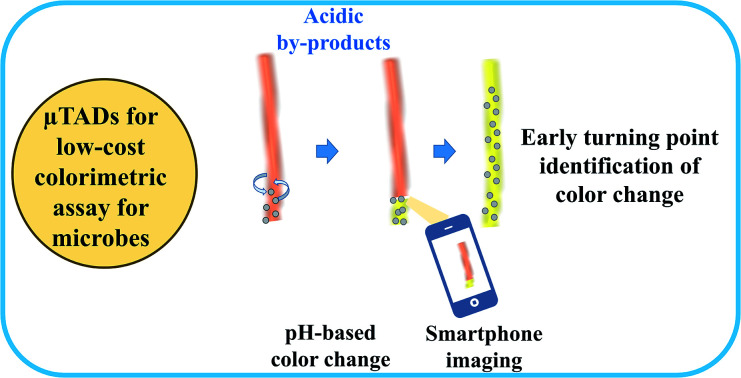
Introduction
The last decade has seen a renewed importance in pathogen identification due to advancements in biosensors1,2 and microfluidics.3–6 Owing to advantages like less sample volume consumption, cost-effectiveness, facile operating procedure, ease of multiplexing with potential automation and portability in nature, microfluidic platforms are regarded as a trailblazer in wide range of fields.7,8 Traditionally, microfluidic devices are constructed using glass and polymeric materials like polymethyl methacrylate, polydimethyl siloxane, polyethylene terephthalate etc.9 However, they demand arduous, exorbitant and tedious fabrication methods like photolithography, etching, micromachining and 3D printing, thereby hindering the deployment of polymer-based microfluidic devices for cost-effective POC assays. To overcome the aforementioned limitations, researchers explored the utility of cellulose-based substrates for developing open microfluidic platforms. “Paper” being a primary choice, emerged as robust “Paper-based microfluidic analytical devices or μPADs” by the efforts of Whiteside's group.10 Later, μPADs expanded its horizon from diagnosis to environmental monitoring even food analysis due to their advantages like affordability, simplicity and availability of fabrication techniques. However, factors like necessity of hydrophobic barriers, low surface tension and mechanical strength limit their usage as microfluidic devices.11–15 Owing to its advantages like flexibility, portability, biodegradability, lightweight, high tensile strength and availability, many attempts have been made to leverage thread for frugal diagnostics or detection among other low-cost materials like paper and plastic.16–19 Additionally, thread or intertwined cellulose fibre possess wicking property (does not require an external pump), and ease of immobilization or incorporation of reagents in different architectures converted a plain thread into a robust and versatile tool for sensing applications.20–24 Moreover, just with the assistance of household tools like sewing needles or sewing machines, thread-based analytical devices (μTAD) have been fabricated.25–28
In recent years there has been growing interest in using μTADs for numerous assays,9 including enzyme-linked immune-sorbent assay (ELISA) for detecting antibodies,29 immuno-chromatographic assays,30,31 glucose assays32–34 and other applications.34–44 Furthermore, literature reveals that the utilization of TADs for colorimetric assays, with simple thread acting as a medium for holding test reagents and the white color of it providing a perfect background for colorimetric signal development and processing.25,45–47 In addition, smartphones have also been employed for image analysis of thread-based colorimetric assays.48–50 Conventionally, colorimetric responses are usually recorded at the end point of a color change for test interpretation. However, pH based titrimetric analyses indicate noting the titrimetric value of a titration at the turning point of the color change of the indicators.51–53
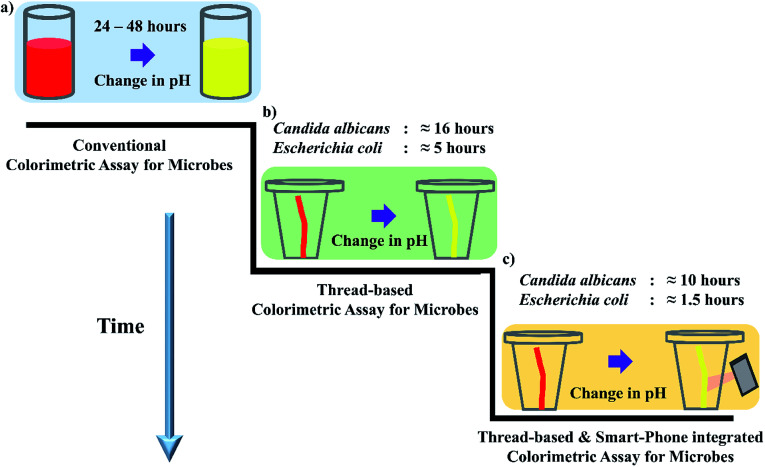
Hence, based on this principle of pH-dependent color change, we have integrated thread substrate with a colorimetric microbial assay by employing the conventional metabolic sugar fermenting profile of microbes54–56 (Fig. 1a). Utility of μTADs are sparsely explored for microbial assays or microbial identification. In this approach, we first leveraged the thread's hydrophilicity and by drop casting media components with different sugars, which served as a ready-to-use device for microbial identification by a qualitative and straightforward color change (Fig. 1b). Later, we employed smart-phone based imaging for validating the thread-based colorimetric test of Candida albicans and Escherichia coli with the existing standard protocols. Strikingly, this hybrid approach of employing both thread and smart phone significantly reduces the detection time. This is achieved by identifying the initial colour turning point of the pH indicator, hence avoiding end-point analysis all together (Fig. 1c).
Fig. 1. Schematic diagram of colorimetric test (a) conventional (b) thread-based device (c) thread-based device and smart-phone imaging. Components present: microbial inoculum, sugar media and pH indicator.
Experimental
Selection of threads and characterization
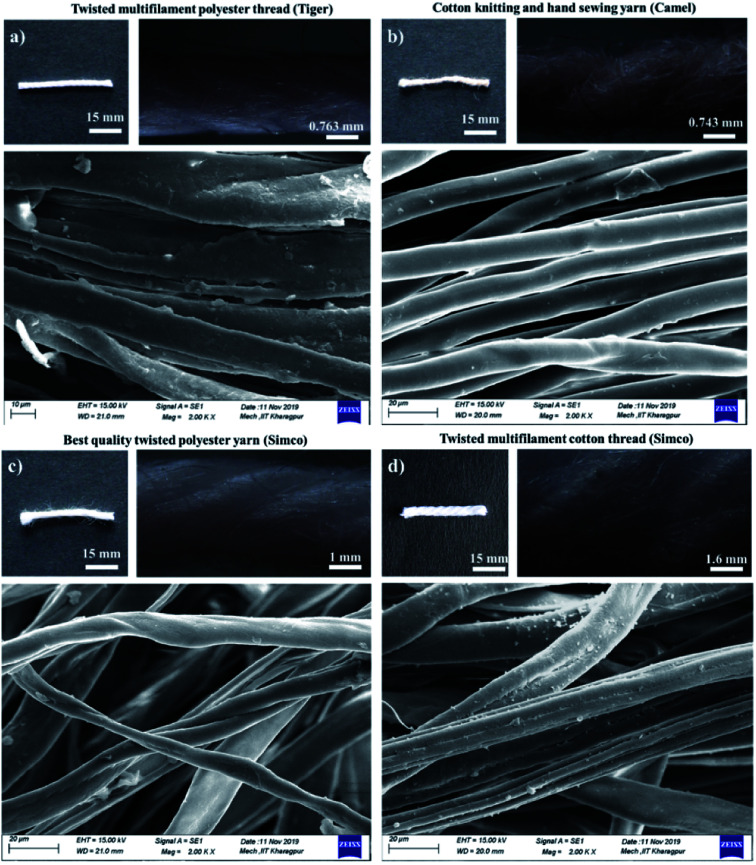
Four types of thread were used in this study, namely twisted multifilament polyester thread – TMPT (brand: Tiger), cotton knitting and hand sewing yarn – CKAHSY (brand: Camel), best quality twisted polyester yarn – BQTPY and twisted multifilament cotton thread – TMCT (brand: Simco) for our work. The threads were further characterized using Scanning Electron Microscopy (SEM) and the width of the thread pieces was measured using FIJI software with the images captured using dark field microscopy at 4× magnification. The penetration rate of phenol red dye (PR) solution through the different thread pieces (15 mm) were measured using FIJI software. The different thread pieces were placed over an OHP sheet, a volume of 60 μL of PR solution was added and the images were captured at defined time intervals using Canon Eos 3000D DSLR camera at a fixed distance and ambient lighting.
Microbial cell sample preparation
Candida albicans (ATCC 24433) and Escherichia coli were used as the test organisms for the sugar fermentation test. C. albicans strain was obtained from Department of Microbiology (Kasturba Medical College, Manipal, India) and Escherichia coli was obtained from Department of Biotechnology (Manipal Institute of Technology, Manipal, India). Pure cultures of C. albicans and E. coli grown on sabouraud dextrose agar (SDA) with chloramphenicol (Himedia) and nutrient agar (Titan Biotech) plates were inoculated into Sabouraud's broth [30 g L−1 sodium chloride (Merck), 10 g L−1 peptone (Himedia), 40 g L−1 dextrose (Himedia), pH 5.6] and nutrient broth [10 g L−1 peptic digest of animal tissue, 10 g L−1 beef extract, 5 g L−1 sodium chloride (Titan Biotech), pH 7.4] respectively and incubated at 37 °C for 4 h. The cell suspensions were centrifuged at 6000 rpm for 5 min, supernatant discarded and the cell pellet was resuspended in 1× Phosphate buffered saline (PBS) (pH 7.4). This step was repeated twice for washing the cell pellet. Turbidity of the inoculum suspension was adjusted to Mc. Farland Std. 4.
Thread-based colorimetric test
60 μL of the sugar fermentation broth [10 g L−1 peptone (Himedia), 5 g L−1 sodium chloride (Merck), 20 g L−1 sugar (dextrose, sucrose, maltose, lactose) (Himedia, Merck), 0.018 g L−1 phenol red indicator (Sigma Aldrich), pH 7.4] was pipetted onto the surface of an OHP sheet and TMCT thread piece (15 mm, sterilized using autoclave) was placed over it to allow the wicking of the broth through the entire length of the thread, followed by partial drying at room temperature for 15 min. 7 μL of the prepared inoculum suspension was taken in a vial and the thread piece with the wicked up broth was placed in the vial with one end of the thread piece dipped in the inoculum. This setup was incubated at room temperature and was observed for visual color change (red to yellow). Suitable pH strips were used to measure the pH of the threads at different time interval.
Smart-phone based imaging and analysis
The images of the threads were captured using a smartphone (phone: Samsung Galaxy On5, 8 MP, mode: Pro, Metering mode: Spot, exposure: −2, ISO: Auto, WB: Auto) every 30 min starting from 1.5 h with focus on the lower portion of the thread piece dipped in the inoculum to check for the color change of the test broth medium from red to yellow. The images were acquired in a well-lit room without any specialized illumination source. The absence of a specially designed image acquisition system ensures the adaptability of the proposed work in a resource constrained settings. The color change from red to yellow was determined using image analysis from the sequence of images captured at regular interval and the images were analyzed in MATLAB R2017b. This colorimetric test was accomplished in two steps: first, the acquired image was segmented and subsequently, the segmented regions were examined to confirm the presence of the yellow color.
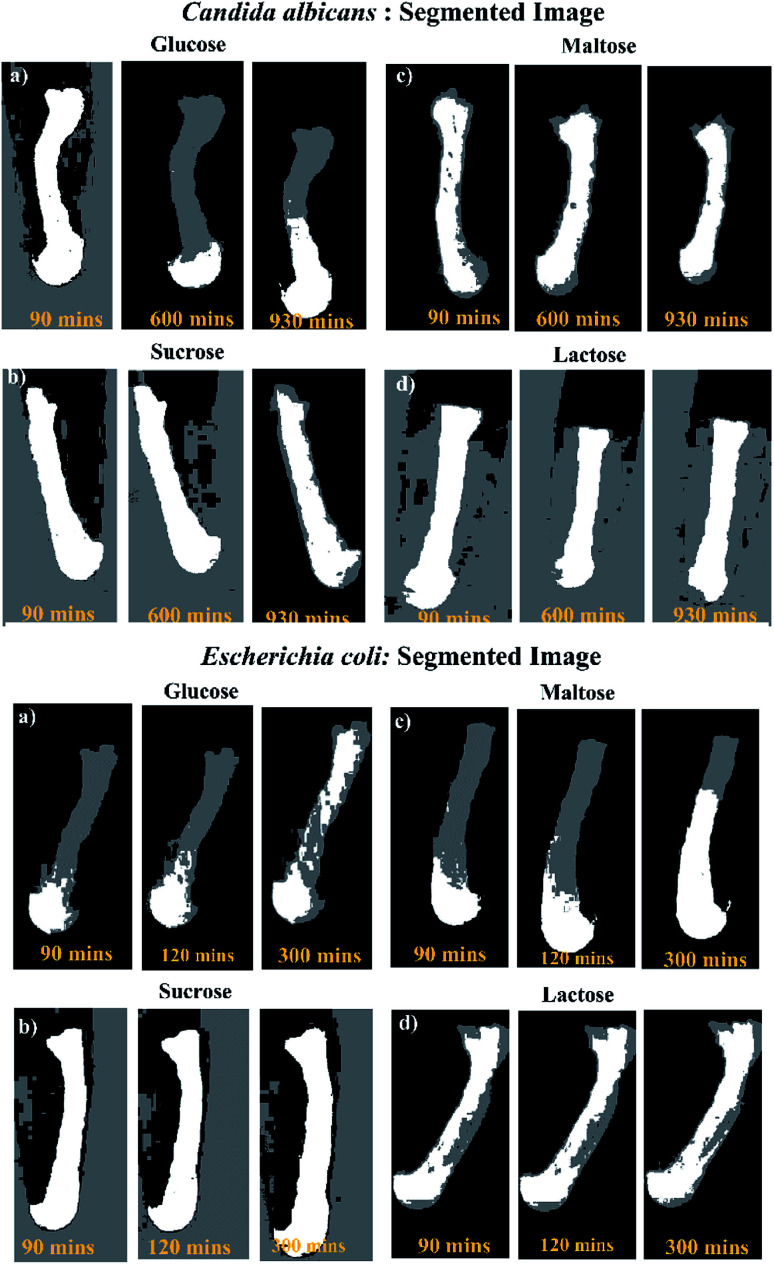
The size of the acquired image was 2448 × 3264 pixels. To limit the analysis to the region of interest (thread), a region of 400 × 900 pixels was manually extracted around the thread. These cropped images (Fig. 3) were subsequently segmented into three distinct regions using k-means segmentation. The k-means segmentation is a clustering method that partitions the data points into k separate groups by minimizing the distance between the cluster center and the data points. In the case of image segmentation, each image pixel is represented by a data point or feature vector containing all measurements relevant in describing the pixel. In this work, the feature vector for a pixel was represented by AB coordinates of LAB color space. This choice of feature vector ensures that partitioning was based on color information alone. In case of a positive result, this segmentation approach results in three distinct regions corresponding to the background, red thread, and yellow thread. However, as expected for a negative result (no color change), the segmentation was not coherent.
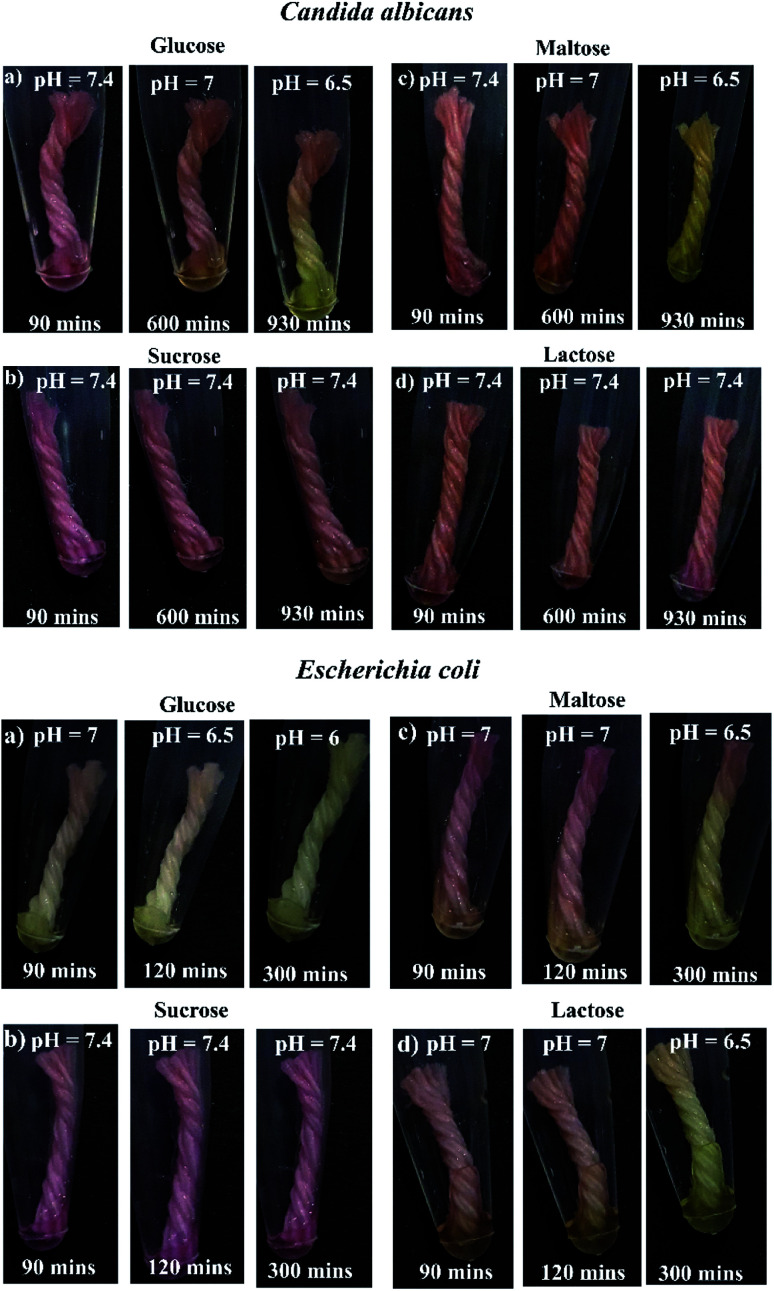
Fig. 3. Colorimetric assay of Candida albicans and Escherichia coli in thread device (a) glucose (b) sucrose (c) maltose (d) lactose. Yellow color depicts positive, red color depicts negative.
It is evident that the segmentation procedure can segment the yellow thread in case of a positive result. However, a confirmation is needed to ensure that the segmented region is indeed a yellowish color. This confirmation was accomplished by examining the cluster centers and within-cluster sums of point-to-centroid distances. Let us represent the three cluster centers by ck = {(xk,yk), k = 1, 2, 3} and the feature vector as di = (dai, dbi) for each pixel i, where da, db represents a and b coordinate in LAB color space. Then, the within-cluster sums of the point-to-centroid distance for kth cluster are defined as
 |
1 |
where dik is the ith data point in kth cluster.
In addition to the within-cluster sums, the y-coordinate of the cluster center is also examined to verify the yellowish color. Indeed, the y-coordinate representing the b value of LAB color space represents the yellowness-blueness. Therefore, a high value of the y-coordinate indicates the presence of yellow color. Consequently, among the three cluster centers ck = {(xk,yk), k = 1, 2, 3}, the cluster center with the maximum value of y-coordinate is assumed as the candidate cluster with the yellow color. Let us denote the cluster center of this candidate cluster as cj = (xj,yj). Finally, the presence of yellow color is confirmed in this candidate cluster represented by the center cj = (xj,yj) if it satisfies the following two conditions
| yj > α | 2 |
| (sj < λ) & (yj > β) | 3 |
where α, λ and β are constants determined experimentally (refer ESI Table 1†) with α > β and & is a logical AND operator.
The first condition compares the value of y-coordinate with a predetermined threshold (α) to ensure that the b coordinate of LAB color space of the cluster center j is indeed on the higher side. In addition, another threshold (λ) is evaluated on the within-class distance and with a lower value of threshold (β) on b (eqn (3)). Indeed, in case of a positive result, the cluster will be tightly grouped with a low within-class distance. These two conditions aid in confirming the presence of yellow color in the candidate cluster, thus enabling us to determine the time at which there is a change in color from red to yellow.
Statistical analysis
Experimental data were represented as mean ± standard error of mean (SEM). Statistical significance between visual and smart-phone aided image analysis was computed by the Student's unpaired two tailed t-test using GraphPAD Prism 4 software. Statistical significance was considered at p < 0.05.
Results and discussion
Characterization of threads
Apart from wicking property, thread's characteristics form a crucial part of the thread-based device design. Fig. 2 shows the different threads investigated for the work, the width of the threads characterized using the dark-field microscopy images and the thread structure observed using SEM technique. TMPT, CKAHSY, BQTPY and TMCT threads were found to have 12, 2, 6 and 12 primary fibres in their fibre network respectively, depicting the multifilament nature of the threads. We have assessed the penetration rate of PR dye solution observed in different threads (Fig. S1†). We observe that the rate of penetration in BQTPY thread was rapid, though the dye solution was not held firmly inside the thread fibre network for a more extended period with subsequent leakage. The dye solution did not wick into the TMPT and CKAHSY threads, which may be due to the presence of a waxy coating on the thread's surface. TMCT thread was chosen as the best-suited substrate for the fabrication of thread-based colorimetric microbial assays due to its multifilament nature (comparatively having more number of fibers), relatively slower penetration rate (initial penetration rate of 0.098 mm s−1 till 120 s followed by a rate of 0.025 mm s−1 – Fig. S1†) that promotes the site-wise incubation of the microbes on the thread aiding in the take up of the impregnated sugar substrate and ability to hold the wicked up media formulation for longer period of time without leakage. The holding capacity of the 15 mm thread piece of TMCT thread was estimated by measuring the distance moved by different volumes of the PR dye solution (20, 40 and 60 μL) using FIJI software. 60 μL volume was chosen as the appropriate media holding capacity of the thread for the developed assay (Fig. S2†).
Fig. 2. Types of threads & their respective SEM images (a) twisted multifilament polyester thread (b) cotton knitting and hand sewing yarn (c) best quality twisted polyester yarn (d) twisted multifilament cotton thread.
Thread-based colorimetric microbial assay
In order to develop a simple, low-cost and robust thread-based device for microbial identification, especially for the detection of Candida albicans (a fungi) & Escherichia coli (a bacteria), we have integrated a pH based colorimetric test (Fig. S3†), which relies on a discrete metabolic pattern of microbes with thread-based devices. Literature suggests that among glucose, sucrose, maltose, and lactose sugars, Candida albicans can only metabolize glucose and maltose, whereas Escherichia coli can metabolize glucose, maltose and lactose thereby causing a color change of the indicator with the decrease in pH around pH 6.8.57 Generally, the conventional or culture-based microbial and biochemical identification assay requires long end-point analysis time (24–48 hours) to ascertain the microbes. With an objective to reduce long end-point analysis time, we have examined the utility of thread as a robust detection tool by simply drop casting the media components followed by sample introduction (Candida albicans). Fig. 3 (top) suggests the occurrence of step-wise color change for Candida albicans. The results suggest that tests for both glucose and maltose substrates were positive i.e., color change from red to yellow, however the tests for sucrose and lactose substrates were negative i.e., no color change.
We performed triplicates in thread-based devices using all the four substrates and visually observed for color change in the captured image. Interestingly, for the glucose substrate, the color change was detected at 930, 870 and 900 min (≈15 hours). Similarly, for maltose, the color change was detected at approximately 930, 900 and 930 min (≈15.5 hours) (Table 1). On the contrary, other substrates including sucrose and lactose, did not show any color change. Likewise, for Escherichia coli, positive results were obtained for glucose, maltose, and lactose i.e., color change from red to yellow. However, sucrose substrate was negative i.e., no color change (Fig. 3 bottom). The prominent color change was detected at 300, 310 and 320 min for glucose, maltose, and lactose respectively (Table 1).
Detection time of the colorimetric test (3 trials) for Candida albicans and E. coli using thread-devices.
| Trial | Glucose | Sucrose | Maltose | Lactose |
|---|---|---|---|---|
| Thread-based devices (min): Candida albicans | ||||
| 1 | 930 | — | 930 | — |
| 2 | 900 | — | 900 | — |
| 3 | 870 | — | 930 | — |
| Thread-based devices (min): E. coli | ||||
| 1 | 330 | — | 300 | 330 |
| 2 | 270 | — | 330 | 300 |
| 3 | 300 | — | 300 | 330 |
The main underlying principle of our study relies on the release of acid products by microbes. Consequently, the change or decrease in pH produces an observable colour change in the thread (due to the presence of phenol red, a pH indicator). We have conducted a pH study for both Candida albicans, and Escherichia coli using pH strips. We have measured the pH at regular time intervals for both the microbes (as per Fig. 3). In the case of Candida albicans, the initial pH was found to be 7.4 (red colour) and further changed to 6.5 (yellow colour) for glucose and maltose substrates. However, there is no change in pH for sucrose and lactose substrates (remains red colour). In the case of Escherichia coli, the initial pH was found to be 7.4 (red colour) and further changed to 6.5 for glucose, maltose and lactose substrates (yellow colour). However, there is no change in pH for sucrose substrate (remains red colour). This study confirms that acidic by-products released by microbes influence pH-based colour change.57
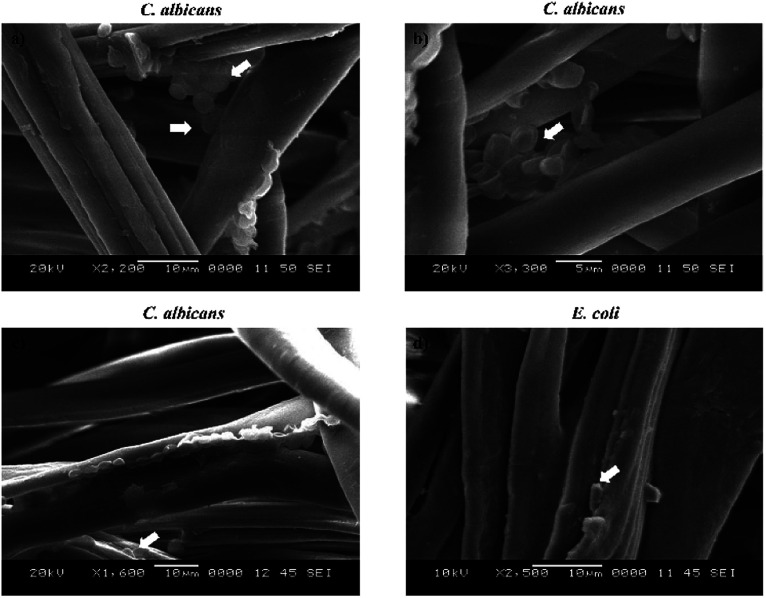
To understand the mechanism of the color change in the thread-based device, we investigated the movement of the cells in the thread piece using scanning electron microscopy. The images of the thread piece with the wicked up suspension of cells was captured using JEOL scanning electron microscope (Fig. 4). The images reveal the presence of C. albicans and E. coli cells almost near the mid-region of the thread piece, proving the fact that the cells move through the inter-fiber gaps of the thread and scavenge the imbibed test media. After which, they release acidic by-products, causing the color change of the phenol red indicator from red to yellow for the positive tests. To the best of our knowledge this is the first report on microbial movement in multi-filament threads.
Fig. 4. SEM images of multi-filament thread with (a–c) Candida albicans (d) Escherichia coli (depicted by arrows).
Thread-based and smart-phone integrated imaging of colorimetric microbial assay
Generally, qualitative detection methods often rely on simple color change, which is analyzed by naked eye. At times, these observations can be subjective and may lead to erroneous results. Recently, the amalgamation of smart-phone to paper-based and thread-based devices has demonstrated significant growth and accuracy in quantifying the intensity of the color.9 In order to reduce the subjectivity in the detection of turning point, we have utilized a smart-phone to photograph the thread-devices for monitoring the color change. Later, we have utilized the image analysis procedure described in section above for detecting the color change in the captured images of thread devices.
The colorimetric detection is performed in two steps: first the image is segmented into three regions (Fig. 5) and subsequently, the regions are analyzed to confirm the presence of yellow color. Strikingly, this hybrid approach was able to detect both positive and negative signal for both the organisms. Candida albicans has shown positive color change for glucose and maltose, whereas negative for sucrose and lactose. These results are in line with visual observation and conventional methods. Another intriguing aspect of thread-based devices and smart-phone imaging is that the detection time has significantly been reduced ≈10 hours for glucose and maltose. The same approach was leveraged for Escherichia coli, and interestingly positive results were obtained only for glucose, maltose, and lactose (Fig. 5 bottom), similar to visual observation and conventional methods. We have performed three trials and noticed the same trend for Candida albicans and Escherichia coli (ESI Tables 2 and 3†).
Fig. 5. Segmented images with three regions of colorimetric assay of Candida albicans and Escherichia coli in thread device. For a positive detection, white, grey, and black pixels correspond to yellow thread, red thread and background respectively.
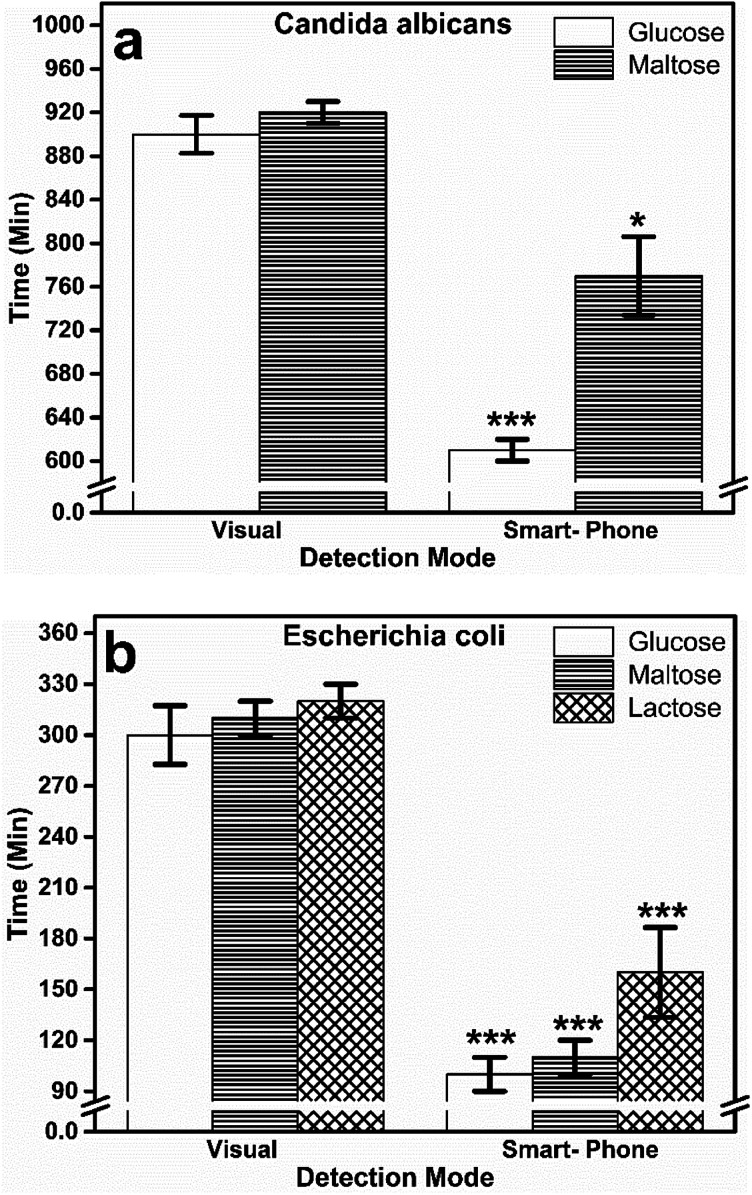
Additionally, we have compared the variation in detection time between visual observation and smart-phone based imaging. This approach can detect the subtle color change during the colorimetric turning point of the pH indicator within 10 and 2 hours for Candida albicans and Escherichia coli respectively. Fig. 6 shows the comparison of visual and smart-phone based detection of thread-based colorimetric test. For C. albicans, (Fig. 6a) color change through visual observation was recorded at 900 ± 17.32 and 920 ± 10.00 min for glucose and maltose substrates, respectively. In the smart-phone aided imaging method, the color change was recorded at 610 ± 10.00 and 770 ± 36.05 min for glucose and maltose substrates, respectively. This reduction in detection time through smart-phone aided imaging method for glucose (p < 0.001) and maltose (p < 0.05) was found to be statistically significant compared to the visual observation method.
Fig. 6. Comparison of detection time using visual and smart-phone mode of thread-based colorimetric assay for (a) Candida albicans and (b) Escherichia coli. Data mean ± SEM. Level of significance *p < 0.05, ***p < 0.001, and no symbol = insignificant compared to the visual observation group.
Similarly, for the E. coli (Fig. 6b) color change recorded by the naked eye was 300 ± 17.32, 310 ± 10, and 320 ± 10.00 min for glucose, maltose, and lactose substrates. On the contrary, the early color change was captured by smart phone aided image analysis with 100 ± 10.00, 110 ± 10.00, and 160 ± 26.45 min for glucose, maltose, and lactose substrates. The reduction in time duration to measure accurate color change aided by smart-phone based image analysis for all the three substrates was found to be statistically significant (p < 0.001) compared to visual observation method. Overall, it is clear from the results that the hybrid approach of using thread and smart-phone imaging significantly reduces the detection time for both Candida albicans and Escherichia coli by analyzing the tinge of color change that appears at the turning point of the colorimetric pH indicator, rather than waiting for the complete color change to be estimated through end-point analysis or visual observation.
To check the long-term utility of thread-based device as a presumptive identification tool, we have drop casted the media components with four different sugars on the thread and stored it at 4 °C for 20 days. We have performed the three trials of sugar based colorimetric assay by adding Candida albicans and E. coli inoculum on the stored devices. Interestingly, we have obtained visual color change (i.e., from red to yellow for positive tests) for both the organisms (Fig. S4†). However, there was a variation in the observed color intensity as compared to freshly prepared thread-devices. As a consequence, the visual detection time was longer than the freshly prepared thread-devices. The possible reasons for this ambiguity may be due to evaporation or degradation of media components.
Conventionally, several methods are used for pathogen detection, including culture-based (blood and plate culture), microscopic examination, biochemical assays and fully automated systems.58 Culture-based detection methods and microscopic examination are tiresome and often demand well qualified personnel and equipped laboratories.59 On the other hand, automated analysers (BacTALERT and VITEK system) are relatively rapid and sensitive but expensive and unavailable in resource-constrained settings. Despite poor sensitivity, simple colorimetric (qualitative) test for detecting the biomarkers and analyte in body fluids has been utilized commonly in resource limited settings and greatly serves the purpose. Biochemical techniques such as pH indicator based microbial identification assays are one of the mainstay identification procedure for microbial characterization in diagnostic microbiology laboratories especially in developing countries across the world. An accurate identification based on biochemical methods is of paramount importance and has a bearing on microbial identification and clinical management of the infectious ethology. The methods described in scientific literature for setting up a laboratory based biochemical identification assay had been cumbersome, time-consuming and require considerable prior moist heat methods of sterilisation during preparation and ancillary lab consumables. The volumes of biohazardous wastes get generated making it inconvenient and less economical and undesirable for daily laboratory usage.
The existing methods for setting up tests based on sugar metabolism potential of pathogens requires the elaborate preparation of bulk test media in test tubes for the fermentation and assimilation of various sugars, hence making it quite cumbersome and time-consuming. Later, automated systems for biochemical characterization of microbes have been introduced in the form of Auxacolor and API systems.60 These systems basically monitor the color change or the increase in the turbidity of the test medium to give different biochemical profiles based on the identified microbe. The systems involve up to 24–72 hours of incubation time before the pathogen identification and sometimes need a secondary morphological/culture-based test to confirm the pathogen identified in case of inaccurate results obtained in the automated system, further adding to the detection time. Furthermore, molecular methods, though comparatively rapid, need technical expertise for handling and analysis.59
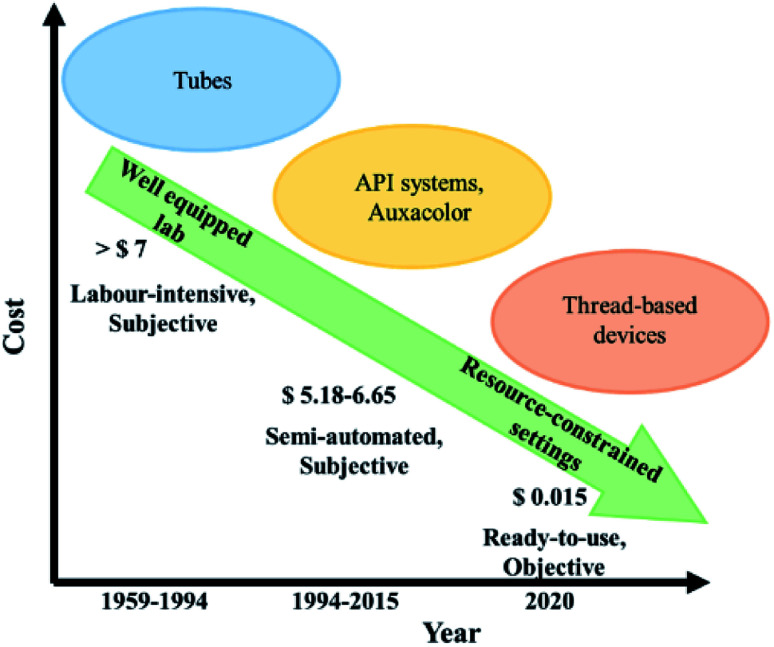
To circumvent above limitations, we hereby describe a simple and quick to perform yet robust, less hazardous and economical thread integrated smart-phone imaging colorimetric assay for microbes. The thread-based device can be simply incinerated after use, avoiding the requirement of elaborate decontamination protocol involved in the conventional laboratory-based methods (Fig. S5†). Through our findings, we infer that media components imbibed on simple thread can be leveraged as frugal diagnostic tool. Unlike conventional experiments, which require fresh media preparation, the proposed thread-based device has the potential to be used as a frugal ready-to-use tool. We have also compared the estimated cost of the developed thread-based microbial assay with the conventional and other semi-automated systems (Fig. 7).61
Fig. 7. Cost analysis of thread-based device for low-cost microbial assay.
Conclusion
Our research has highlighted the importance and the utility of employing ‘thread’ as a cost-effective and biodegradable way of identifying Candida albicans and Escherichia coli through a pH-based colorimetric assay. For the first time, a thread-based device has been leveraged for performing a prolonged microbial assay. The visual colorimetric response results from the formation of acidic by-products through the utilization of specific sugar substrates by the microbes. We have drop-casted the nutritional media components comprising of four different sugar substrates and a pH indicator and monitored visible color change. In addition, the color change was assessed by ‘Smart-phone based imaging’. Our comprehensive results prove that, by the use of smartphone-based image analysis, the analysis time or detection time for microbes (based on metabolic potential) can be significantly reduced to ≈10 hours for Candida albicans and ≈2 hours for Escherichia coli by the interpretation of the turning point of the color change in contrast to the end point analysis. Hence, the developed technology offers a promising and reproducible alternative for the conventional microbial assay (detection time: 24–48 hours). As an added benefit, the cost of a device (with four sugars) is 0.015 US$ and requires only 60 μL of impregnated media reagents, further employing a smart-phone for image analysis adds more accuracy and great objectivity to the results. Our preliminary results on threads stored for 20 days (imbibed with media components) suggest that a “simple thread” can be used as a ready-to-use tool in resource-constrained settings. Furthermore, our findings can pave the way for future research involving cassettes for thread devices (to prevent evaporation), calibrated color imaging processing techniques, which may undoubtedly promote cheaper, faster and reliable results for point-of-care detection.
Conflicts of interest
There are no conflicts to declare.
Supplementary Material
Acknowledgments
We acknowledge the financial support from Manipal-McGill Center for Infectious Diseases [Grant/Award Number: MAC ID/SGA/2017/21]. Dr NKM & AP acknowledge the financial support from Vision Group on Science and Technology, Government of Karnataka under SMYSR and RGS/F Scheme [Sanction Letter no. KSTePS/VGST/SMYSR-2016-17/GRD-595/2017-18, KSTePS/VGST-RGS/F/GRD No. 711/2017-18]. AP acknowledges Indian Council of Medical Research (ICMR) for providing Senior Research Fellowship [File no. 5/3/8/91/ITR-F/2020]. The authors gratefully acknowledge Prof. Suman Chakraborty for providing SEM facility. We extend our special thanks to Department of Biotechnology, Manipal Institute of Technology for providing the facility to carry out the study. Dr GN acknowledge the Science and Engineering Research Board (SERB), Department of Science and Technology (DST), Government of India for the National Post-Doctoral Fellow (Sanction Letter no. PDF/2018/001486). NKM thanks Dr Praveen Kumar and Dr Thangaraju for their fruitful discussions. We also thank Dr Raghu Chandrashekhar for providing Fluorescence microscopy facility.
Electronic supplementary information (ESI) available. See DOI: 10.1039/d0ra05190j
Notes and references
- Lazcka O. Del Campo F. J. Muñoz F. X. Biosens. Bioelectron. 2007;22:1205–1217. doi: 10.1016/j.bios.2006.06.036. [DOI] [PubMed] [Google Scholar]
- Goluch E. D. Trends Biotechnol. 2017;35:1125–1128. doi: 10.1016/j.tibtech.2017.08.001. [DOI] [PubMed] [Google Scholar]
- Wang Y. Salazar J. K. Compr. Rev. Food Sci. Food Saf. 2016;15:183–205. doi: 10.1111/1541-4337.12175. [DOI] [PubMed] [Google Scholar]
- Posch W. Heimdörfer D. Wilflingseder D. Lass-Flörl C. Expert Rev. Anti-Infect. Ther. 2017;15:829–838. doi: 10.1080/14787210.2017.1370373. [DOI] [PubMed] [Google Scholar]
- Yager P. Edwards T. Fu E. Helton K. Nelson K. Tam M. R. Weigl B. H. Nature. 2006;442:412–418. doi: 10.1038/nature05064. [DOI] [PubMed] [Google Scholar]
- Mani N. K. Rudiuk S. Baigl D. Chem. Commun. 2013;49:6858. doi: 10.1039/C3CC44016H. [DOI] [PubMed] [Google Scholar]
- Foudeh A. M. Fatanat Didar T. Veres T. Tabrizian M. Lab Chip. 2012;12:3249–3266. doi: 10.1039/C2LC40630F. [DOI] [PubMed] [Google Scholar]
- Naeimirad M. Abuzade R. Babaahmadi V. Dabirian F. Mater. Des. Process. Commun. 2019;1:e78. [Google Scholar]
- Weng X. Kang Y. Guo Q. Peng B. Jiang H. Biosens. Bioelectron. 2019;132:171–185. doi: 10.1016/j.bios.2019.03.009. [DOI] [PMC free article] [PubMed] [Google Scholar]
- Martinez A. W. Phillips S. T. Butte M. J. Whitesides G. M. Angew. Chem., Int. Ed. 2007;46:1318–1320. doi: 10.1002/anie.200603817. [DOI] [PMC free article] [PubMed] [Google Scholar]
- Prabhu A. Giri Nandagopal M. S. Peralam Yegneswaran P. Singhal H. R. Mani N. K. Cellulose. 2020:1–11. [Google Scholar]
- Mani N. K. Prabhu A. Biswas S. K. Chakraborty S. Sci. Rep. 2019;9:1752. doi: 10.1038/s41598-018-38308-6. [DOI] [PMC free article] [PubMed] [Google Scholar]
- Mani N. K. Das S. S. Dawn S. Chakraborty S. Electrophoresis. 2020;41:615–620. doi: 10.1002/elps.201900356. [DOI] [PubMed] [Google Scholar]
- Kaur N. Toley B. J. Analyst. 2018;143:2213–2234. doi: 10.1039/C7AN01943B. [DOI] [PubMed] [Google Scholar]
- Mora M. F. Garcia C. D. Schaumburg F. Kler P. A. Berli C. L. A. Hashimoto M. Carrilho E. Anal. Chem. 2019;91:8298–8303. doi: 10.1021/acs.analchem.9b01020. [DOI] [PubMed] [Google Scholar]
- Nilghaz A. Ballerini D. R. Shen W. Biomicrofluidics. 2013;7:051501. doi: 10.1063/1.4820413. [DOI] [PMC free article] [PubMed] [Google Scholar]
- Lin S.-C. Hsu M.-Y. Kuan C.-M. Wang H.-K. Chang C.-L. Tseng F.-G. Cheng C.-M. Sci. Rep. 2015;4:6976. doi: 10.1038/srep06976. [DOI] [PMC free article] [PubMed] [Google Scholar]
- Agustini D. Bergamini M. F. Marcolino-Junior L. H. Lab Chip. 2016;16:345–352. doi: 10.1039/C5LC01348H. [DOI] [PubMed] [Google Scholar]
- Agustini D. Bergamini M. F. Marcolino-Junior L. H. Anal. Chim. Acta. 2017;951:108–115. doi: 10.1016/j.aca.2016.11.046. [DOI] [PubMed] [Google Scholar]
- Agustini D. Fedalto L. Bergamini M. F. Marcolino-Junior L. H. Lab Chip. 2018;18:670–678. doi: 10.1039/C7LC01267E. [DOI] [PubMed] [Google Scholar]
- Berthier J. Brakke K. A. Gosselin D. Navarro F. Belgacem N. Chaussy D. Berthier E. Med. Eng. Phys. 2017;48:75–80. doi: 10.1016/j.medengphy.2017.05.005. [DOI] [PubMed] [Google Scholar]
- Taheri N. S. Wang Y. Berean K. Chan P. P. Y. Kalantar-Zadeh K. ACS Appl. Nano Mater. 2019;2:2044–2053. doi: 10.1021/acsanm.9b00049. [DOI] [Google Scholar]
- Owens T. L. Leisen J. Beckham H. W. Breedveld V. ACS Appl. Mater. Interfaces. 2011;3:3796–3803. doi: 10.1021/am201003b. [DOI] [PubMed] [Google Scholar]
- Vatansever F. Burtovyy R. Zdyrko B. Ramaratnam K. Andrukh T. Minko S. Owens J. R. Kornev K. G. Luzinov I. ACS Appl. Mater. Interfaces. 2012;4:4541–4548. doi: 10.1021/am3008664. [DOI] [PubMed] [Google Scholar]
- Li X. Tian J. Shen W. ACS Appl. Mater. Interfaces. 2010;2:1–6. doi: 10.1021/am9006148. [DOI] [PubMed] [Google Scholar]
- Ballerini D. R. Li X. Shen W. Biomicrofluidics. 2011;5:014105. doi: 10.1063/1.3567094. [DOI] [PMC free article] [PubMed] [Google Scholar]
- Ballerini D. R. Li X. Shen W. Anal. Bioanal. Chem. 2011;399:1869–1875. doi: 10.1007/s00216-010-4588-5. [DOI] [PubMed] [Google Scholar]
- Mao X. Du T. E. Wang Y. Meng L. Biosens. Bioelectron. 2015;65:390–396. doi: 10.1016/j.bios.2014.10.053. [DOI] [PubMed] [Google Scholar]
- Gonzalez A. Gaines M. Gallegos L. Y. Guevara R. Gomez F. A. Electrophoresis. 2018;39:476–484. doi: 10.1002/elps.201700354. [DOI] [PubMed] [Google Scholar]
- Zhou G. Mao X. Juncker D. Anal. Chem. 2012;84:7736–7743. doi: 10.1021/ac301082d. [DOI] [PubMed] [Google Scholar]
- Choi J. R. Nilghaz A. Chen L. Chou K. C. Lu X. Sens. Actuators, B. 2018;260:1043–1051. doi: 10.1016/j.snb.2018.01.102. [DOI] [Google Scholar]
- Gonzalez A. Estala L. Gaines M. Gomez F. A. Electrophoresis. 2016;37:1685–1690. doi: 10.1002/elps.201600029. [DOI] [PubMed] [Google Scholar]
- Xiao G. He J. Chen X. Qiao Y. Wang F. Xia Q. Yu L. Lu Z. Cellulose. 2019;26:4553–4562. doi: 10.1007/s10570-019-02396-y. [DOI] [Google Scholar]
- Gonzalez A. Gaines M. Gomez F. A. Electrophoresis. 2017;38:996–1001. doi: 10.1002/elps.201600476. [DOI] [PubMed] [Google Scholar]
- Yu A. Shang J. Cheng F. Paik B. A. Kaplan J. M. Andrade R. B. Ratner D. M. Langmuir. 2012;28:11265–11273. doi: 10.1021/la301661x. [DOI] [PMC free article] [PubMed] [Google Scholar]
- Tomimuro K. Tenda K. Ni Y. Hiruta Y. Merkx M. Citterio D. ACS Sens. 2020;5:1786–1794. doi: 10.1021/acssensors.0c00564. [DOI] [PubMed] [Google Scholar]
- Li Y. D. Li W. Y. Chai H. H. Fang C. Kang Y. J. Li C. M. Yu L. Cellulose. 2018;25:4831–4840. doi: 10.1007/s10570-018-1891-3. [DOI] [Google Scholar]
- Berthier J. Brakke K. A. Gosselin D. Berthier E. Navarro F. Med. Eng. Phys. 2017;48:55–61. doi: 10.1016/j.medengphy.2017.08.004. [DOI] [PubMed] [Google Scholar]
- Malon R. S. P. Heng L. Y. Córcoles E. P. Rev. Anal. Chem. 2017;36:1–19. [Google Scholar]
- Cabot J. M. Breadmore M. C. Paull B. Anal. Chim. Acta. 2018;1000:283–292. doi: 10.1016/j.aca.2017.10.029. [DOI] [PubMed] [Google Scholar]
- Nilghaz A. Zhang L. Li M. Ballerini D. R. Shen W. ACS Appl. Mater. Interfaces. 2014;6:22209–22215. doi: 10.1021/am505849e. [DOI] [PubMed] [Google Scholar]
- Seth M. Mdetele D. Buza J. Microfluid. Nanofluid. 2018;22:45. doi: 10.1007/s10404-018-2065-1. [DOI] [Google Scholar]
- Erenas M. M. De Orbe-Payá I. Capitan-Vallvey L. F. Anal. Chem. 2016;88:5331–5337. doi: 10.1021/acs.analchem.6b00633. [DOI] [PubMed] [Google Scholar]
- Farajikhah S. Cabot J. M. Innis P. C. Paull B. Wallace G. ACS Comb. Sci. 2019;21:229–240. doi: 10.1021/acscombsci.8b00126. [DOI] [PubMed] [Google Scholar]
- Zhou G. Mao X. Juncker D. Anal. Chem. 2012;84:7736–7743. doi: 10.1021/ac301082d. [DOI] [PubMed] [Google Scholar]
- Xu C. Huang W. Zhu S. Li Z. Cai L. Zhong M. AIP Adv. 2018;8:105016. doi: 10.1063/1.5052525. [DOI] [Google Scholar]
- Reches M. Mirica K. A. Dasgupta R. Dickey M. D. Butte M. J. Whitesides G. M. ACS Appl. Mater. Interfaces. 2010;2:1722–1728. doi: 10.1021/am1002266. [DOI] [PubMed] [Google Scholar]
- Owyeung R. E. Panzer M. J. Sonkusale S. R. Sci. Rep. 2019;9:1–8. doi: 10.1038/s41598-018-37186-2. [DOI] [PMC free article] [PubMed] [Google Scholar]
- Huang X. Xu D. Chen J. Liu J. Li Y. Song J. Ma X. Guo J. Analyst. 2018;143:5339–5351. doi: 10.1039/C8AN01269E. [DOI] [PubMed] [Google Scholar]
- Sateanchok S. Wangkarn S. Saenjum C. Grudpan K. Talanta. 2018;177:171–175. doi: 10.1016/j.talanta.2017.08.073. [DOI] [PubMed] [Google Scholar]
- Jarujamrus P. Prakobkij A. Puchum S. Chaisamdaeng S. Meelapsom R. Anutrasakda W. Amatatongchai M. Chairam S. Citterio D. Analyst. 2020;145:4457–4466. doi: 10.1039/D0AN00522C. [DOI] [PubMed] [Google Scholar]
- Zhang M. L. Jin F. Zheng M. L. Duan X. M. RSC Adv. 2014;4:20567–20572. doi: 10.1039/C4RA03013C. [DOI] [Google Scholar]
- Pallás I. Marcos M. D. Martínez-Máñez R. Ros-Lis J. V. Sensors. 2017;17:1–11. doi: 10.3390/s17092134. [DOI] [PMC free article] [PubMed] [Google Scholar]
- Rutter J. M. J. Med. Microbiol. 1970;3:283–289. doi: 10.1099/00222615-3-2-283. [DOI] [PubMed] [Google Scholar]
- Slifkin M. Pouchet G. R. J. Clin. Microbiol. 1977;5:15–19. doi: 10.1128/jcm.5.1.15-19.1977. [DOI] [PMC free article] [PubMed] [Google Scholar]
- Kali A. Srirangaraj S. Charles P. Indian J. Med. Microbiol. 2015;33:293. doi: 10.4103/0255-0857.154884. [DOI] [PubMed] [Google Scholar]
- Winn W. C. and Koneman E. W., Koneman's color atlas and textbook of diagnostic microbiology, Lippincott Williams & Wilkins, 2006 [Google Scholar]
- Franco-Duarte R. Černáková L. Kadam S. Kaushik K. S. Salehi B. Bevilacqua A. Corbo M. R. Antolak H. Dybka-Stępień K. Leszczewicz M. Relison Tintino S. Alexandrino de Souza V. C. Sharifi-Rad J. Melo Coutinho H. D. Martins N. Rodrigues C. F. Microorganisms. 2019;7:130. doi: 10.3390/microorganisms7050130. [DOI] [PMC free article] [PubMed] [Google Scholar]
- Rajapaksha P. Elbourne A. Gangadoo S. Brown R. Cozzolino D. Chapman J. Analyst. 2019;144:396–411. doi: 10.1039/C8AN01488D. [DOI] [PubMed] [Google Scholar]
- Safavieh M. Coarsey C. Esiobu N. Memic A. Vyas J. M. Shafiee H. Asghar W. Crit. Rev. Biotechnol. 2017;37:441–458. doi: 10.3109/07388551.2016.1167667. [DOI] [PMC free article] [PubMed] [Google Scholar]
- O'Hara C. M. Clin. Microbiol. Rev. 2005;18:147–162. doi: 10.1128/CMR.18.1.147-162.2005. [DOI] [PMC free article] [PubMed] [Google Scholar]
Associated Data
This section collects any data citations, data availability statements, or supplementary materials included in this article.


