Erratum in: “Carboplatin- and Etoposide-Loaded Lactoferrin Protein Nanoparticles for Targeting Cancer Stem Cells in Retinoblastoma In Vitro” by Revu V. L. Narayana, Pritikana Jana, Neha Tomar, Varsha Prabhu, Rohini M. Nair, Radhika Manukonda, Swathi Kaliki, Sarah E. Coupland, Jodi Alexander, Helen Kalirai, Anand K. Kondapi, and Geeta K. Vemuganti (Invest Ophthalmol Vis Sci. 2021;62(14):13), https://doi.org/10.1167/iovs.62.14.13.
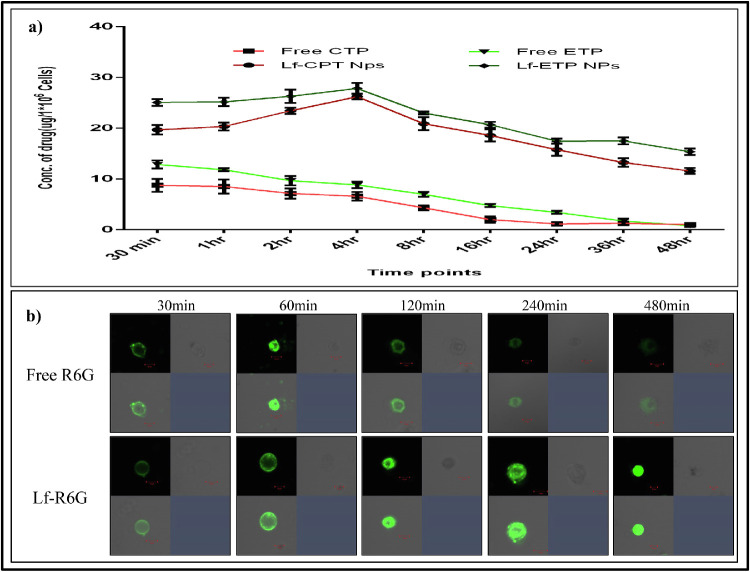
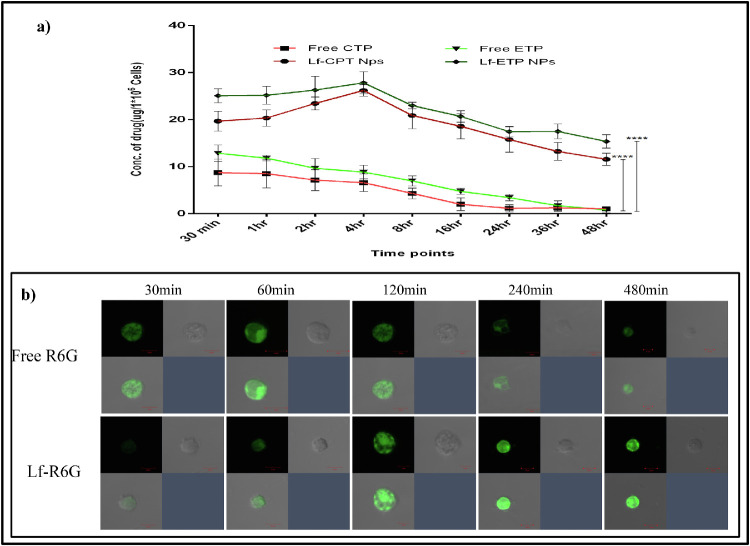
An error was made in the generation of Figure 5b: Two identical confocal microscope images were mistakenly included in the panels for the free R6G at 30 minutes and 120 minutes. The figure has been revised from another set of experiments and corrected in the article online.
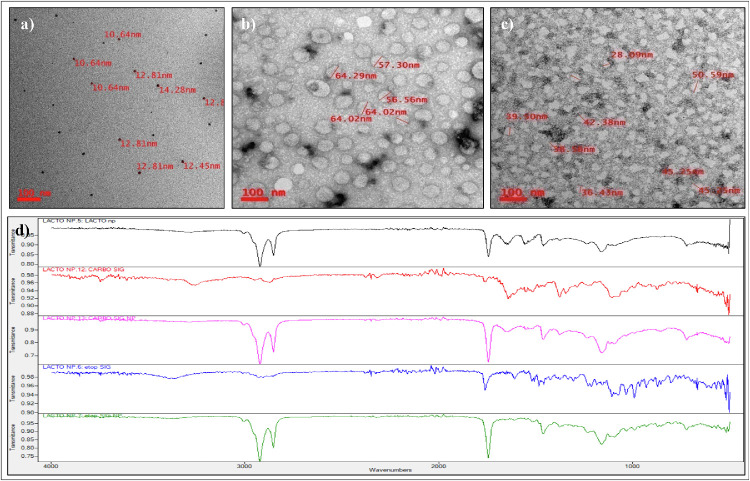
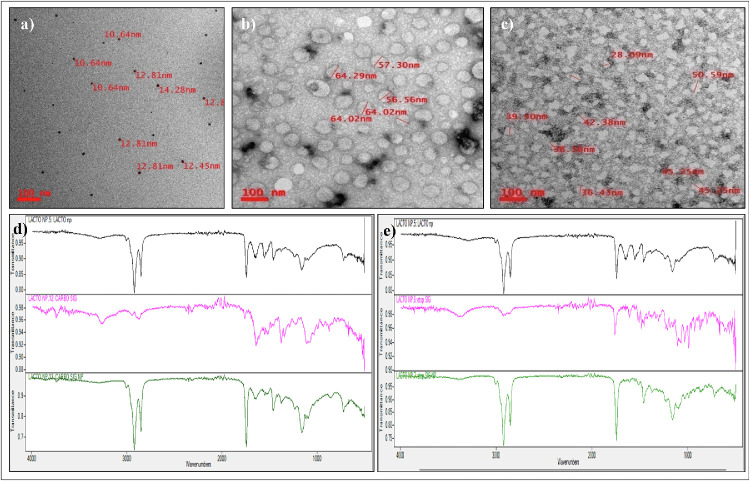
Figure 2 has also been changed to include only one copy of the FTIR spectrum for the blank nanoparticles. In the original version of the figure, the same spectrum was used twice for independent comparison with the CPT and ETP loaded nanoparticles.
Corrected Figure 5

Figure 5. Quantitative measurement of drug uptake. (a) Quantitative measurement of cellular drug uptake of standard drug and drug-loaded Lf-Nps. (b) Cellular uptake of soluble R6G and Lf-R6G in Rb Y79 cells at different time points.
Original Figure 5

Figure 5. Quantitative measurement of drug uptake. (a) Quantitative measurement of cellular drug uptake of standard drug and drug-loaded Lf-Nps (CPT versus Lf-CPT, ****P < 0.0001; ETP versus Lf-ETP, ****P < 0.0001). (b) Cellular uptake of soluble R6G and Lf-R6G in Rb Y79 cells at different time points.
Corrected Figure 2

Figure 2. Physicochemical characterization of CPT- or ETP-loaded Lf-Nps. Transmission electron microscopy images of (a) Lf-Nps, (b) Lf-CPT, (c) Lf-ETP and (d) FTIR spectrum analysis of Lf-CPT and Lf-ETP (blank nanoparticle, black; CPT, red; Lf-CPT, pink; ETP, blue; Lf-ETP, green).
Original Figure 2

Figure 2. Physicochemical characterization of CPT- or ETP-loaded Lf-Nps. Transmission electron microscopy images of (a) Lf-Nps, (b) Lf-CPT, and (c) Lf-ETP. FTIR spectrum analysis of (d) Lf-CPT and (e) Lf-ETP (blank nanoparticle, black; pure drugs, pink; drug-loaded nanoparticles, green).


