Abstract
Liposomes are among the most successful nanocarriers; several products have been marketed, all of which were prepared by active loading methods. However, poorly water-soluble drugs without ionizable groups are usually incorporated into the lipid bi-layer of liposomes by passive loading methods, with serious drug leakage during blood circulation. Furthermore, there have been few improvements in their anti-cancer activity and safety. Herein, we designed and synthesized three weak-acid modified paclitaxel (PTX) derivatives with a one-step reaction for the remote loading of liposomal formulations. By comparison, PTX-succinic acid liposomes (PTX-SA LPs) exhibited the highest encapsulation efficiency (97.2 ± 1.8%) and drug loading (8.84 ± 0.16%); meanwhile, there was almost no change in their particle size or zeta potential within one month. Furthermore, compared with Taxol®, the PTX-SA LPs showed a 4.35-fold prolonged half-time, enhanced tumor accumulation, and an increased maximum tolerated dose (MTD) of more than 30 mg kg−1. As a result, the PTX-SA LPs displayed significantly improved in vivo anti-cancer efficacy in comparison with Taxol®. Therefore, weak-acid modification is proved to be a simple and effective method to achieve remote loading and high encapsulation efficiency of poorly soluble drugs, showing great potential for clinical application.
A remote loading liposomal formulation of weak-acid paclitaxel derivative with high encapsulation efficiency and high drug loading, improved therapeutic efficiency and negligible toxicity.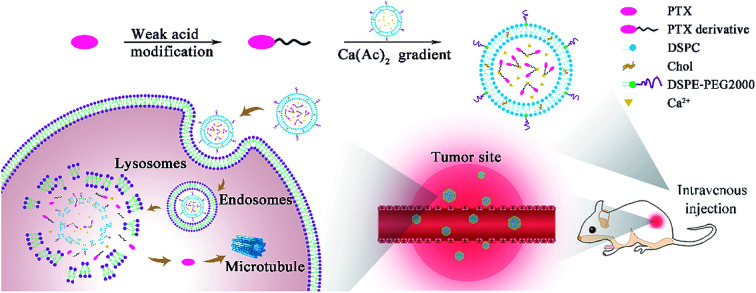
1. Introduction
Liposomes are an efficient nano-drug delivery system (nano-DDS) for cancer therapy; they have the advantages of good biocompatibility and biodegradability, non-toxicity, and sustained drug release.1–3 Drugs can be loaded into liposomes by active or passive loading methods. The active loading method refers to loading drugs by the driven force of an ion/compound gradient between the intra- and extra-liposomal aqueous phases. In the passive loading method, drugs are first dissolved in water or an organic phase; then, drug-containing liposomes are prepared by suitable methods. Generally, active drug loading is suitable for drugs that are water-soluble and contain weakly acidic or alkaline groups. In addition to the traditional pH gradient, the ammonium ion gradient is often used as the transmembrane driving force of weakly basic drugs,4,5 while weakly acidic drugs usually adopt the acetate ion gradient.2,6 Liposomes prepared by ammonium/acetate ion gradients can stabilize drugs in the intraliposomal aqueous phase by forming impermeable complexation or precipitation with counter ions in order to avoid the leakage of drugs.6,7 Several liposomal formulations prepared by active loading methods have been approved by the FDA for clinical cancer therapy, such as Doxil®,8,9 Onivyde®,10,11 Marqibo®,11 and Vyxeos®.12 However, poorly water-soluble drugs are normally incorporated into the lipid bilayers of liposomes with limited drug loading capacity and poor drug retention, resulting in few improvements in anti-cancer activity and safety.13,14
Appropriate amphiphilicity (partition coefficient, log P) and acid-basicity (defined by their pKa) of drugs are necessary for successful remote loading; this limits the use of many first-line chemotherapeutic drugs for active loading liposomal formulations.5,15 In the past decades, chemical modification strategies have been developed by introducing an ionizable functional group and improving the membrane permeability of drugs for remote loading. Irinotecan is one of the most successful examples; its marketed liposomal formulation, Onivyde®, was modified based on SN-38 with a weakly basic 4-piperidinopiperidine group via ester bonds.16 In addition, a hydrophobic drug, docetaxel, was encapsulated into the intraliposomal aqueous phase by chemically modifying a piperazine or tertiary amine group at the C-2′ position using an ammonium sulfate (AS) or triethylamine sucrose-octa-sulfate (TEA-SOS) gradient.17–19 Gemcitabine (GEM), a highly water-soluble drug with poor membrane permeability, is normally prepared as a liposomal formulation via a passive loading strategy with low encapsulation efficiency and a low drug-to-lipid ratio.20,21 Considerable improvement was accomplished in the remote loading of GEM by introducing a weak base moiety at the N4 position, and the prepared liposomes possessed high drug-to-lipid ratios and good stability.15 Although great progress has been made, there are still complicated steps in the synthesis of some derivatives, and the potential toxicity of the modified groups is unclear.
Paclitaxel (PTX), a first-line chemotherapeutic drug, has been widely utilized to treat multiple types of tumors in the clinic.22–24 The first commercial formulation of PTX, Taxol®, was formulated with poly-oxy-ethylated castor oil (CrEL) and dehydrated ethanol at a ratio of 1 : 1 (v/v).25,26 However, Taxol® is associated with a series of serious adverse pharmacological and toxicological effects, which limits its clinical application.27,28 In addition, a liposomal PTX formulation, Lipusu®, has been marketed in China, and some other liposomal formulations are in clinical trials.29–31 However, the loading capacities for these formulations are all less than 5%.31 Furthermore, all of them are prepared by passive loading methods, with poor drug retention. From this perspective, it is essential to develop a novel formulation of PTX with high drug loading as well as high delivery efficiency.
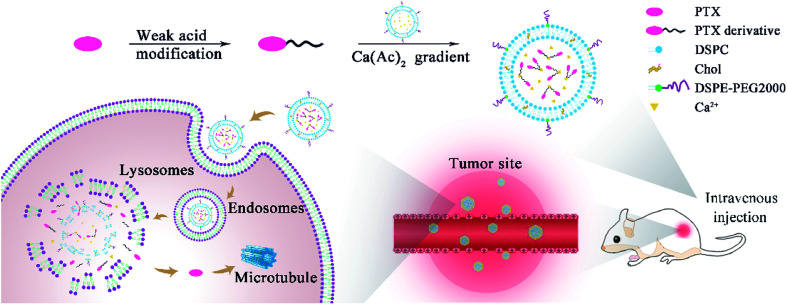
Based on the problems mentioned above, we designed and synthesized three simple weak-acid-modified PTX derivatives, PTX-succinic acid (PTX-SA), PTX-glutaric acid (PTX-GA), and PTX-trans-2-butene-1,4-dicarboxylic acid (PTX-DA) with one-step reactions, and we attempted to encapsulate them into liposomes by remote loading (Scheme 1). After screening, the PTX-SA liposomes (PTX-SA LPs) exhibited the highest encapsulation efficiency (97.2 ± 1.8%) and drug loading (8.84 ± 0.16%). Thus, the PTX-SA LPs were chosen for the following experiments. The PTX-SA LPs displayed excellent stability and sustained drug release in vitro. Moreover, the PTX-SA LPs demonstrated 4.35-fold-prolonged drug half-time and an area under the curve (AUC) enhanced by more than 200 times compared to that of free PTX. Furthermore, the PTX-SA LPs displayed improved in vivo anti-cancer efficacy in comparison with Taxol®. Therefore, the PTX-SA LPs are proved to be a more effective formulation, with negligible toxicity to normal tissues.
Scheme 1. The diagram for the preparation of remote loading liposomes and their application in cancer therapy.
2. Results and discussion
2.1. Synthesis of PTX-SA, PTX-GA and PTX-DA
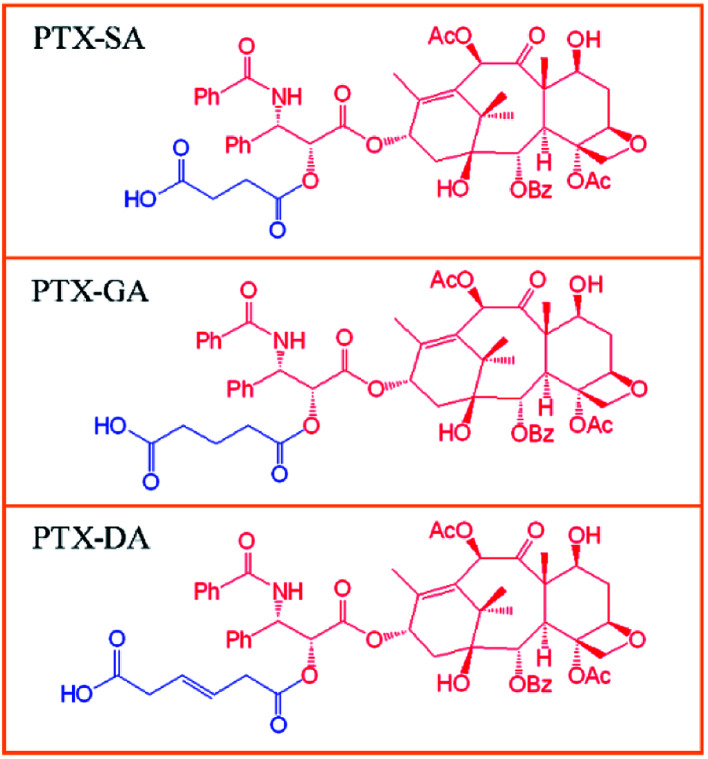
Three weak-acid modified PTX derivatives, PTX-SA, PTX-GA and PTX-DA, were successfully synthesized by conjugating PTX with succinic acid (SA), glutaric acid (GA) and trans-2-butene-1,4-dicarboxybic acid (DA) via ester bonds, respectively (Chart 1). It has been reported that SA can play important roles in the fields of immunology and cancer, which deserves more detailed studies.32,33 Additionally, SA is a biocompatible organic acid because it is an intermediate metabolite in the tricarboxylic acid (TCA) cycle. This can ensure that the degradation product is non-toxic to the body. Thus, SA was chosen for the synthesis of the weak-acid derivative of paclitaxel. Meanwhile, for comparison, GA and DA were also chosen in order to investigate the influences of the carbon chain length and double bonds on the encapsulation efficiency and stability of the liposomes. The chemical structures of PTX-SA, PTX-GA and PTX-DA were verified by 1H nuclear magnetic resonance (1H NMR) spectra and mass spectra (MS). The 1H NMR spectra and MS results are shown in Fig. S1–S3.† The results showed that the yields of PTX-SA and PTX-GA were higher than that of PTX-DA. This can be attributed to the higher reactivity of anhydride than of carboxylic acid. Thus, in order to increase the yield, the carboxyl group of DA must be activated in an ice bath first. Moreover, more by-products were generated in the PTX-DA reaction. It was difficult to separate the targeted product by pre-HPLC methods. Thus, column chromatography was used.
Chart 1. Chemical structures of the weak-acid modified PTX derivatives: PTX-SA, PTX-GA, and PTX-DA.
2.2. Preparation and characterization of liposomes
2.2.1. The principle of remote drug loading
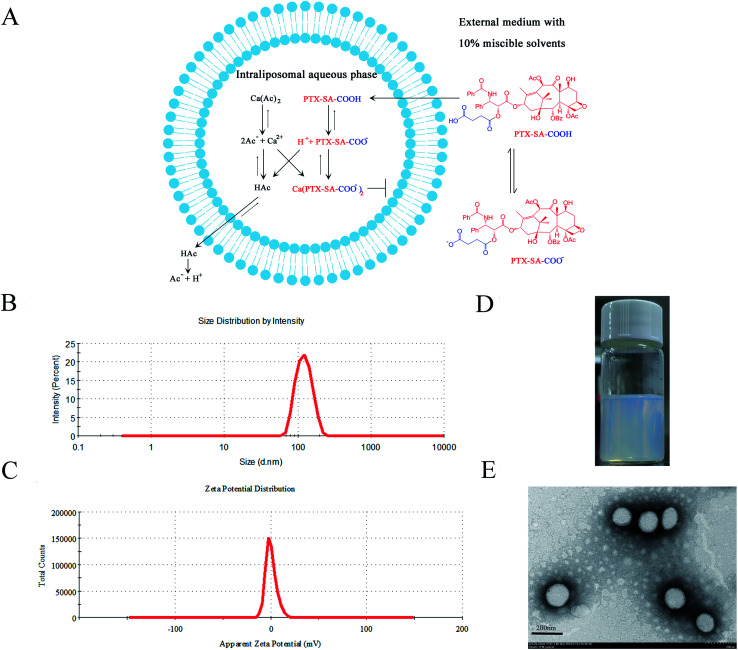
The acetate ion gradient is often used as the transmembrane driving force for weakly acidic drugs. Due to the different permeability coefficients of acetic acid and calcium ions, the calcium ions are entrapped inside the liposomes and the acetic acid acts as a proton shuttle, thus creating a pH gradient (high inside) to encapsulate the weakly acidic drug into liposomes.1 Taking the remote loading of PTX-SA as an example, PTX-SA was entrapped in the aqueous core of liposomes using a calcium acetate gradient with the assistance of the organic solvent DMSO. It was reported that a limited amount of DMSO can not only improve the solubility of poorly soluble drugs but can also enhance the permeability of liposomal membranes, thus facilitating the remote loading process (Fig. 1A).34,35
Fig. 1. Characterization of remote loading liposomes. (A) PTX-SA as an example for the mechanism of remote loading with a calcium acetate gradient. (B) The particle size and (C) zeta potential of the PTX-SA LPs. (D) Photograph of the PTX-SA LPs. (E) TEM image of the PTX-SA LPs.
2.2.2. Characterization of liposomes
Typically, the thin-film hydration method is applied to prepare blank Ca(Ac)2 liposomes. The drugs were dissolved in DMSO and were then added dropwise to the blank gradient liposomes under continuous stirring at 65 °C. When the drug-containing DMSO solution was added to the blank-gradient liposomes, the solution initially became cloudy. As the drug loading proceeded, the solution changed from cloudy to clear. This phenomenon was similar to that of carfilzomib.36 We speculated that there is a solubility equilibrium of the drug in the extra-liposomal aqueous phase. The dissolved drug could enter the intra-liposomal aqueous phase driven by the transmembrane driving force. In this process, Ca2+ can also play an important role. Once the drug enters the liposomes, it can bind with Ca2+ to prevent leakage, thus constantly facilitating the rapid dissolution of the drug outside the liposomes and the process of drug loading until all the drug is dissolved and entrapped.2
The characterization results of the drug-loaded liposomes are shown in Table 1. The drug-to-lipid ratio for drug loading was 1/10 (w/w). After drug loading, there were no obvious changes in particle size or PDI for the PTX-SA LPs and PTX-DA LPs, correspondingly. However, the PTX-GA LPs were aggregated, with a 41.8 ± 2.6% encapsulation efficacy of the drug. This can be attributed to the inappropriate acid strength and membrane permeability of PTX-GA. The EE (%) of the PTX-DA LPs was 86.9 ± 3.4%. However, the PTX-DA LPs turned cloudy after storage at 4 °C for a week. Thus, the chemical stability of PTX-DA was investigated, and the results showed that the compound PTX-DA was degraded by more than 30% within one month. We speculated that this is due to the unsaturated double bond, which accelerated the degradation of PTX-DA. The PTX-SA LPs exhibited the highest EE (%) of 97.2 ± 1.8% with good stability. Therefore, the PTX-SA LPs were selected for further evaluations. The specific characterization of the PTX-SA LPs is shown in Fig. 1B–D; the particle size, PDI and zeta potential of the PTX-SA LPs are 127.3 ± 2.9 nm, 0.065 ± 0.035 and −0.039 ± 0.226 mV, respectively. The TEM micrograph demonstrates that the PTX-SA LPs are nearly spherical and that the particle size is close to the results measured by DLS (Fig. 1E).
Characterization of the PTX-SA LPs (mean ± SD, n = 3)a.
| Formulation | Size (nm) | PDI | EE (%) |
|---|---|---|---|
| Blank LPs | 125.9 ± 2.8 | 0.084 ± 0.039 | — |
| PTX-SA LPs | 127.3 ± 2.9 | 0.065 ± 0.035 | 97.2 ± 1.8 |
| PTX-DA LPs | 130.4 ± 2.4 | 0.035 ± 0.012 | 86.9 ± 3.4 |
EE: encapsulation efficiency.
On the other hand, we also attempted to use non-gradient liposomes to load PTX-SA. However, the drug precipitated after drug loading (Fig. S4†) and the amount of drug encapsulated in the liposomes was lower than the detection limit, indicating that the process of drug loading was dependent on the calcium acetate gradient. All these results demonstrate that the high EE of PTX-SA LPs can be attributed to the calcium acetate gradient, which remotely entrapped the drug into liposomes rather than only being incorporated into the lipid bilayer by hydrophobic interactions.
2.3. Physical stability
The long-term stability and plasma stability of the PTX-SA LPs were evaluated. As shown in Fig. 2A and B, after storage at 4 °C for one month, the particle size, PDI and zeta potential of the PTX-SA LPs showed no obvious changes. Additionally, the PTX-SA LPs were incubated in PBS (pH 7.4) containing 10% FBS under 100 rpm at 37 °C for 48 h, and the particle size and PDI of the PTX-SA LPs were nearly unchanged as well (Fig. 2C). All these data proved that the PTX-SA LPs exhibit excellent stability, which can be beneficial for long circulation and tumor accumulation in vivo after injection.
Fig. 2. Physical stability of the PTX-SA LPs. (A) The particle size, PDI and (B) zeta potential variation of the PTX-SA LPs at 4 °C for 30 days, (C) the particle size and PDI of PTX-SA LPs incubated in PBS containing 10% FBS (v/v) under 100 rpm shaking at 37 °C. Data are presented as mean ± SD (n = 3).
2.4. In vitro drug release
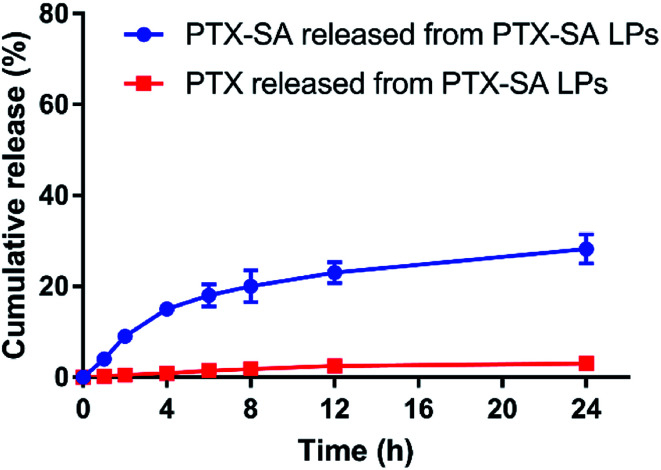
The in vitro drug release of the PTX-SA LPs was studied under the conditions of PBS (pH 7.4) containing 0.5% Tween 80 (v/v). As shown in Fig. 3, the PTX-SA LPs only released about 25% PTX-SA and 3% PTX in total within 24 h, indicating an obviously sustained release rate. Meanwhile, compared with other conventional active loading liposomes, the PTX-SA LPs exhibited a faster drug release rate. This can be attributed to the different state of the drug inside the liposomes, which merits further investigation.
Fig. 3. The in vitro release of PTX-SA and PTX from the PTX-SA LPs in the medium of PBS (pH 7.4) containing 0.5% Tween 80 (v/v) at 37 °C. Data are presented as mean ± SD (n = 3).
2.5. Cytotoxicity assay
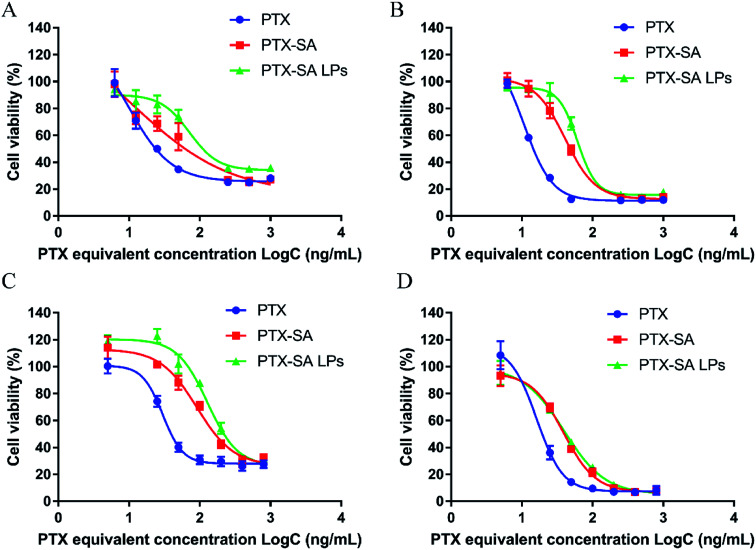
The in vitro cytotoxicities of PTX solution, PTX-SA solution and PTX-SA LPs against breast cancer cells (4T1) and prostatic cancer cells (RM-1) were evaluated via MTT viability assay. The half maximal inhibitory concentrations (IC50) were calculated and are summarized in Table 2. The IC50 values for PTX solution, PTX-SA solution and PTX-SA LPs against RM-1 cells at 48 h were 61.33, 202.9 and 272.8 ng mL−1, respectively. However, 4T1 cells appear to be more sensitive to the preparations than RM-1 cells, with a correspondingly lower IC50.
IC50 values (ng mL−1) of PTX, PTX-SA and PTX-SA LPs against 4T1 and RM-1 cells (mean ± SD, n = 3).
| Formulation | 4T1 | RM-1 | ||
|---|---|---|---|---|
| 48 h | 72 h | 48 h | 72 h | |
| PTX | 48.9 ± 1.7 | 16.3 ± 1.2 | 61.3 ± 1.8 | 20.79 ± 1.3 |
| PTX-SA | 92.7 ± 2.0 | 61.5 ± 1.8 | 202.9 ± 2.3 | 40.2 ± 1.6 |
| PTX-SA LPs | 205.8 ± 2.3 | 98.3 ± 2.0 | 272.8 ± 2.4 | 43.3 ± 1.6 |
As shown in Fig. 4A–D, the cell viability exhibited time and concentration dependence. The cytotoxicity of PTX-SA solution was lower than that of PTX solution, which can be attributed to the fact that PTX-SA requires more time to release PTX. In addition, the PTX-SA LPs demonstrated reduced cytotoxicity in contrast to PTX-SA solution at 48 h. Meanwhile, the IC50 values of PTX-SA solution and the PTX-SA LPs were very close to each other at 72 h. We speculated that this is due to the sustained release of the PTX-SA LPs. On the other hand, due to the incorporation of DSPE-PEG, the cellular uptake of the PTX-SA LPs may be hindered in some degree compared with that of the PTX-SA solution. In short, the PTX-SA LPs could efficiently suppress the proliferation of tumor cells, showing great anti-cancer potential.
Fig. 4. In vitro cytotoxicity of PTX-SA LPs. Viability of cells incubated with a series of concentrations of PTX, PTX-SA and PTX-SA LPs against 4T1 cells for 48 h (A) and 72 h (B) and against RM-1 cells for 48 h (C) and 72 h (D). Data are presented as mean ± SD (n = 3).
2.6. Pharmacokinetic study
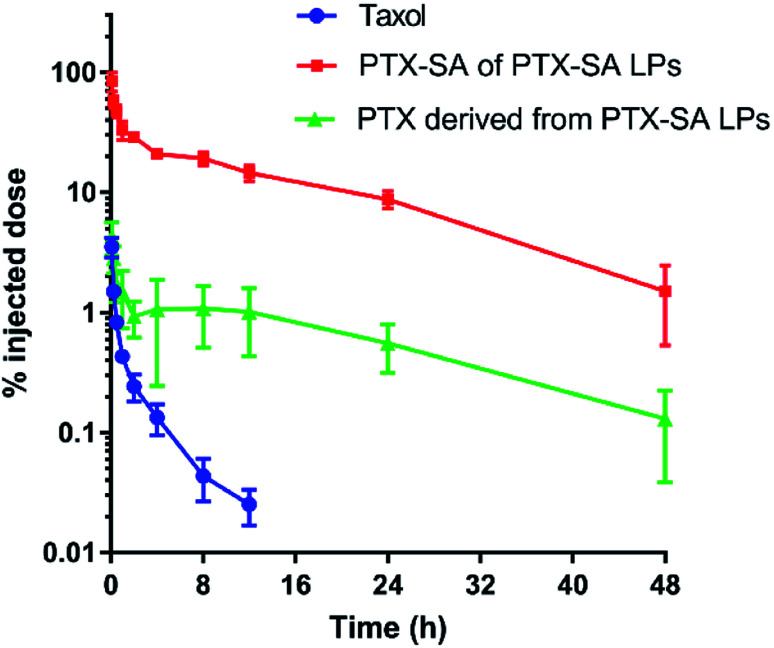
The pharmacokinetic profiles of Taxol® and PTX-SA LPs in SD rats were evaluated following intravenous administration. The pharmacokinetic parameters were calculated and are summarized in Table 3, and the pharmacokinetic curves of PTX-SA and PTX are shown in Fig. 5. Due to the rapid elimination of Taxol®, the concentration of PTX was below the limit of detection at 24 h post injection (<10 ng mL−1), indicating a short half-time. It was reported that the commercial liposomal formulation Lipusu® exhibited a 2-fold higher half-time and an over 2.5-fold greater area under the curve (AUC) than Taxol®.31 In contrast, the half-time and AUC of the PTX-SA LPs were significantly improved by 4.35-fold and 212.8-fold in comparison with those of Taxol®, respectively. This can be ascribed to the excellent stability of the PTX-SA LPs, which reduces leakage of the drug during blood circulation. All the data demonstrate that the PTX-SA LPs can noticeably prolong blood circulation time, which in turn can increase tumor accumulation.
The major pharmacokinetic parameters of Taxol® and the PTX-SA LPs (mean ± SD, n = 3).
| Parameter | Taxol® | PTX-SA LPs | |
|---|---|---|---|
| PTX | PTX | PTX-SA | |
| T 1/2 (h) | 2.44 ± 0.62 | 12.89 ± 3.45 | 10.59 ± 4.08 |
| C max (nmol mL−1) | 4.22 ± 0.97 | 5.14 ± 1.96 | 103.76 ± 22.18 |
| AUC(0–t) (nmol mL−1 h−1) | 3.05 ± 0.59 | 37.88 ± 23.47 | 649.94 ± 91.67 |
| MRT(0–t) (h) | 1.91 ± 0.38 | 14.67 ± 1.23 | 12.82 ± 1.39 |
| CLz (L h−1 kg−1) | 1.54 ± 0.28 | 0.14 ± 0.07 | 0.006 ± 0.002 |
| V z (L kg−1) | 5.37 ± 1.58 | 2.65 ± 1.63 | 0.091 ± 0.022 |
Fig. 5. Pharmacokinetic curves of Taxol® and the PTX-SA LPs after a single intravenous administration of the equivalent PTX dose of 4 mg kg−1. Data are presented as mean ± SD (n = 3).
2.7. In vivo biodistribution study
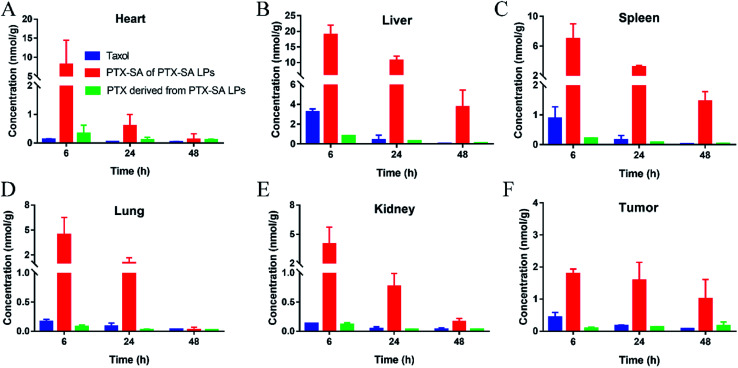
With the promising extension of blood circulation, 4T1 tumor-bearing BALB/c mice were used to evaluate the biodistribution of Taxol® and the PTX-SA LPs. The concentrations of PTX-SA and PTX at the major organs and tumors were detected by UPLC-MS-MS. As shown in Fig. 6A–E, the drugs that accumulated in normal tissues were rapidly eliminated with time. By contrast, the distribution of PTX-SA LPs at the tumor site was nearly identical from 6 h to 24 h, and there was a slight decrease at 48 h (Fig. 6D). Furthermore, it is noteworthy that the PTX derived from PTX-SA LPs increased over time up to 48 h in tumors and was higher than Taxol® at 48 h. This can be attributed to the good stability and prolonged blood circulation time of the PTX-SA LPs, which in turn facilitates the accumulation of liposomes at the tumor site by the EPR effect. Overall, the PTX-SA LPs exhibited higher tumor accumulation compared with Taxol®. Thus, we speculate that the PTX-SA LPs can display more potent anti-cancer activity than Taxol® in vivo.
Fig. 6. In vivo biodistributions of Taxol® and PTX-SA LPs in the heart (A), spleen (B), liver (C), lungs (D), kidneys (E) and tumors (F) in 4T1 tumor-bearing BALB/c mice. Data are presented as mean ± SD (n = 3).
2.8. In vivo antitumor efficacy study
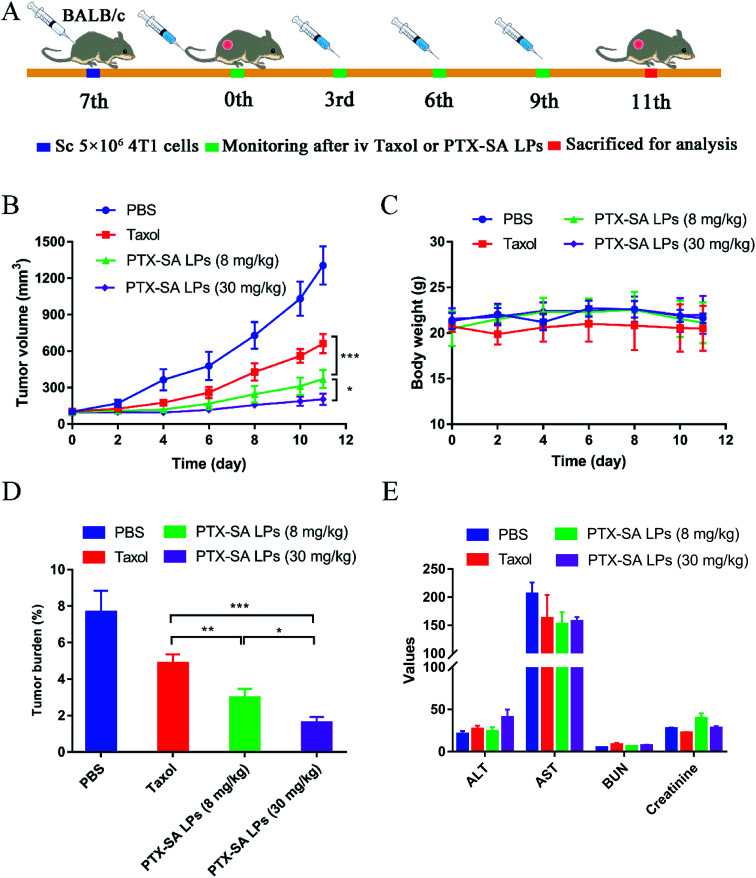
Encouraged by the outstanding results of the in vitro and in vivo studies, the in vivo anti-cancer efficacies of Taxol® and PTX-SA LPs were further evaluated in BALB/c mice bearing 4T1 xenograft models (Fig. 7A). Mice with tumor volumes around 100 mm3 were randomly divided into four groups, and PBS, Taxol® (8 mg kg−1), PTX-SA LPs (equivalent of 8 mg kg−1 or 30 mg kg−1 PTX) were administrated intravenously every three days for a total of four injections. As shown in Fig. 7B, at the end of the experiment, the tumor volume of the PBS group was around 1100–1300 mm3. In comparison, the other three groups displayed different levels of tumor inhibition after treatment. There have been reported that no significant difference was observed between the anti-cancer efficacy of Taxol® and that of commercial liposomal paclitaxel (Lipusu®).31 By contrast, PTX-SA LPs (8 mg kg−1) exhibited more significant tumor inhibition efficacy than Taxol® (P < 0.001), which can be ascribed to the good stability of the PTX-SA LPs in blood circulation and higher accumulation at the tumor site. Moreover, the high-dose PTX-SA LPs (30 mg kg−1) were more effective than the low dose formulation (8 mg kg−1) (P < 0.05), with only a slight increase of tumor volume.
Fig. 7. In vivo anti-cancer efficacy of PTX-SA LPs. (A) Therapeutic schedule for PTX-SA LPs. (B) Tumor growth curves and (C) body weight changing curves post-injection of Taxol® and PTX-SA LPs (n = 5). (D) Tumor burden rate (n = 5) and (E) hematological and blood biochemical parameters of different formulations after treatment (the units for AST, ALT, BUN and CR are U L−1, U L−1, mmol L−1 and μmol L−1, respectively, n = 3). Data are presented as mean ± SD. *P < 0.05, **P < 0.01, ***P < 0.001.
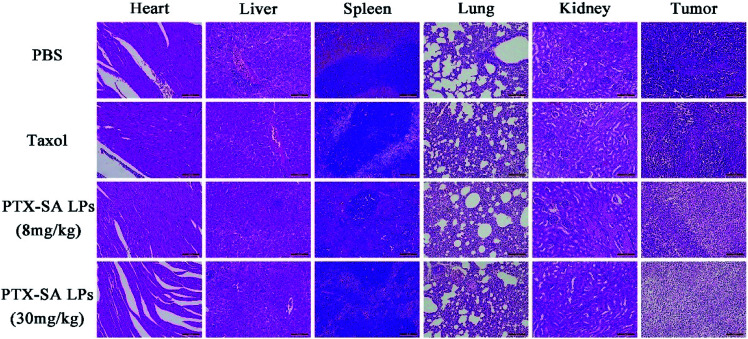
Additionally, the safety of the PTX-SA LPs was investigated by monitoring body weight, measuring four biochemical criteria of blood, and H&E staining tissue slices. During the experiment, there was no significant variation in body weight in the high-dose group, indicating that PTX-SA LPs could remarkably improve the maximum tolerated dose (MTD) (Fig. 7C). However, when Taxol® was administrated with a dosage of 30 mg kg−1, the body weight of the mice was reduced by around 27%, demonstrating extremely serious side effects (Fig. S5†). The levels of aspartate transaminase (AST), serum alanine transaminase (ALT), blood urea nitrogen (BUN), and creatinine in the blood of the mice were detected to evaluate their hepatic and renal function. As shown in Fig. 7E, there were no significant variations in the hematological parameters in any of the groups. The H&E staining results are shown in Fig. 8. No noticeable pathological variations were observed for the H&E staining of vital organs. The tumor segment results revealed that the PTX-SA LPs could induce necrosis or apoptosis of tumor cells; furthermore, the effect of the high-dose group was more pronounced. All these results suggest that the PTX-SA LPs are more effective formulations in comparison to Taxol®, with negligible toxicity to major organs and tissues.
Fig. 8. The H&E staining histological images of the major organs and tumors. The scale bar represents 100 μm.
3. Experimental section
3.1. Materials and reagents
Paclitaxel (PTX) was purchased from Jingzhu Bio-technology Co. Ltd. (Nanjing, China). Succinic anhydride (SA), glutaric anhydride (GA), trans-2-butene-1,4-dicarboxylic acid (DA), N-(3-dimethylaminopropyl)-N-ethyl-carbodiimide hydrochloride (EDCI) and 4-dimethylaminopyrideine (DMAP) were provided by Aladdin Industrial Corporation (Shanghai, China). 1,2-Distearoyl-sn-glycero-3-phosphocholine (DSPC), cholesterol (for injection) (Chol) and 2-distearoyl-sn-glycero-3-phosphoethanolamine-N-methyl (polyethylene glycol)-2000 (DSPE-PEG2000) were purchased from Shanghai Advanced Vehicle Technology Pharmaceutical Ltd. (Shanghai, China). Sepharose CL-4B gel was purchased from Solarbio Corporation. Roswell Park Memorial Institute (RPMI-1640) and trypsin were obtained from Gibico (Beijing, China). Fetal bovine serum (FBS) was obtained from Foundation (Beijing, China), and MTT was purchased from Meilun Biotech Co. Ltd. (Dalian China). 96-well plates were supplied by NEST Biotechnology (Jiangsu, China). All other materials were of analytically pure grade.
3.2. Synthesis of weak-acid PTX derivatives
3.2.1. Synthesis of PTX-SA or PTX-GA
PTX (0.85 g, 1 mmol), succinic anhydride (0.1 g, 1 mmol) or glutaric anhydride (0.12 g, 1 mmol) and DMAP (0.024 g, 0.2 mmol) were dissolved in 30 mL anhydrous dichloromethane. The reaction mixture was stirred for 12 h at room temperature under nitrogen atmosphere, and the progress of the reaction was monitored by thin-layer chromatography (TLC). After the reaction, the solution was placed in a separating funnel, washed twice with 0.5 M HCl and once with water, and was evaporated to dryness to obtain a crude product. The crude product was purified by preparative high performance liquid chromatography (pre-HPLC) with the following solvent ratio: 80% acetonitrile and 20% water, with 0.1% formic acid added (v/v). The flow rate was 5.0 mL min−1. The UV detector was maintained at 227 nm. The final product was a white solid (85% yield). The target products were confirmed by mass spectrometry (Agilent 1100 Series LC/MSD Trap) and nuclear magnetic resonance spectroscopy (400 MHz 1H NMR, Bruker AV-400). The assignments of the NMR peaks and MS were analyzed as follows:
PTX-SA
1H NMR (400 MHz, chloroform-d) δ 8.07 (2H, Ar–H), 7.68 (2H, Ar–H), 7.54 (1H, Ar–H), 7.44 (3H, Ar–H), 7.32 (7H, Ar–H), 7.01 (1H, –NH–), 6.22 (1H, 10-H), 6.17 (1H, 13-H), 5.92 (1H, 3′-H), 5.61 (1H, 2-H), 5.46 (1H, 2′-H), 4.89 (1H, 5-H), 4.36 (1H, 7-H), 4.23 (1H, 20α-H), 4.14 (1H, 20β-H), 3.72 (1H, 3-H), 2.61–2.52 (4H, –OCCH2CH2–CO–), 2.52 (1H, 6α-H), 2.37 (3H, 4-COCH3), 2.31 (2H, 14-H), 2.14 (3H, 10-COCH3), 1.84 (3H, 18-CH3), 1.84 (1H, 6β-H), 1.61 (3H, 19-CH3), 1.15 (3H, 17-CH3), 1.06 (3H, 16-CH3). MS (ESI) m/z for C51H54NO17 [M − H]−: 952.3394.
PTX-GA
1H NMR (400 MHz, chloroform-d) δ 8.14 (2H, Ar–H), 7.73 (2H, Ar–H), 7.61 (1H, Ar–H), 7.52 (3H, Ar–H), 7.38 (7H, Ar–H), 7.20 (1H, –NH–), 6.30 (s, 1H, 10-H), 6.26 (1H, 13-H), 6.01 (1H, 3′-H), 5.69 (1H, 2-H), 5.49 (1H, 2′-H), 4.97 (1H, 5-H), 4.44 (1H, 7-H), 4.29 (1H, 20α-H), 4.20 (1H, 20β-H), 3.82 (1H, 3-H), 2.56 (1H, 6α-H), 2.47 (3H, 4-COCH3), 2.42 (2H, –OCCH2CH2CH2–CO–), 2.38 (2H, –OCCH2CH2CH2–CO–), 2.31 (2H, 14-H), 2.22 (3H, 10-COCH3), 1.94 (3H, 18-CH3), 1.86 (1H, 6β-H), 1.86 (2H, –OCCH2CH2CH2–CO–), 1.66 (3H, 19-CH3), 1.21 (3H, 17-CH3), 1.13 (3H, 16-CH3). MS (ESI) m/z for C52H56NO17 [M − H]−: 967.1.
3.2.2. Synthesis of PTX-DA
PTX (0.85 g, 1 mmol), trans-2-butene-1,4-dicarboxylic acid (0.22 g, 1 mmol) and DMAP (0.06 g, 0.2 mmol) were dissolved in 30 mL anhydrous dichloromethane and stirred for 40 min at 0 °C; then, EDCI (0.38 g, 2 mmol) was added, and the mixture was continuously stirred for 1 h. Next, the reaction mixture was returned to room temperature for 2 h under nitrogen atmosphere, and the progress of the reaction was monitored by thin-layer chromatography (TLC). After the reaction, the solution was handled with the same operations described previously to obtain a crude product. Then, the crude product was purified by column chromatography to obtain a white solid (74% yield). The target product was confirmed by mass spectrometry (Agilent 1100 Series LC/MSD Trap) and nuclear magnetic resonance spectroscopy (400 MHz 1H NMR, Bruker AV-400). The assignment of the NMR peaks and MS was analyzed as follows:
PTX-DA
1H NMR (400 MHz, chloroform-d) δ 8.06 (2H, Ar–H), 7.66 (2H, Ar–H), 7.53 (1H, Ar–H), 7.44 (3H, Ar–H), 7.33 (7H, Ar–H), 6.95 (1H, –NH–), 6.22 (1H, 10-H), 6.17 (1H, 13-H), 5.91 (1H, 3′-H), 5.61 (1H, 2-H), 5.56–5.51 (2H, –CH CH–), 5.44 (1H, 2′-H), 4.89 (1H, 5-H), 4.36 (1H, 7-H), 4.23 (1H, 20α-H), 4.13 (1H, 20β-H), 3.74 (1H, 3-H), 3.10–2.94 (4H, –OCCH2CH CHCH2–CO–), 2.48 (1H, 6α-H), 2.37 (3H, 4-COCH3), 2.26 (2H, 14-H), 2.15 (3H, 10-COCH3), 1.84 (3H, 18-CH3), 1.81 (1H, 6β-H), 1.61 (3H, 19-CH3), 1.15 (3H, 17-CH3), 1.06 (3H, 16-CH3). MS (ESI) m/z for C53H56NO17 [M − H]−: 978.3571.
3.3. Preparation of liposomes and drug loading
Blank gradient liposomes were prepared by the established thin-film hydration approach. DSPC, cholesterol and DSPE-PEG2000 were dissolved in chloroform at a weight ratio of 68.1 : 22.2 : 1.2. This solution was dried by a rotary evaporator at 40 °C until a thin film was formed. Then, 120 mM calcium acetate solution was added to the film, which was hydrated at 65 °C for 30 min to obtain multilamellar vesicles (MLVs). Subsequently, the MLVs were extruded successively through a series of polycarbonate filters with pore sizes of 400 nm, 200 nm and 100 nm at 65 °C under the protection of nitrogen using a high-pressure extrusion device in order to obtain small vesicles with uniform sizes. To establish the ion gradient between the intra-liposomal and extra-liposomal phases, the samples of extruded liposomes were passed through a Sepharose CL-4B gel column pre-equilibrated with 120 mM sodium sulfate.
The blank non-gradient liposomes were prepared by a nearly identical process to that used to prepare the blank gradient liposomes except that the hydration medium was replaced by 120 mM sodium sulfate and the process of exchanging the extra-liposomal aqueous phase was unnecessary.
PTX-SA, PTX-GA, or PTX-DA was dissolved in DMSO at a concentration of 5 mg mL−1. Then, the drug solution was added to the blank gradient or non-gradient liposomes (5 mg mL−1 for lipids) dropwise with continuous stirring at 65 °C and incubated for 30 min (the final drug-to-lipid ratio was 1/10, w/w). Next, the liposomes were quenched immediately for 15 min in an ice bath. The residual DMSO and un-encapsulated drug were removed by dialysis or by passing through a Sepharose CL-4B gel column equilibrated with 120 mM sodium sulfate.
3.4. Characterization of liposomes
The particle sizes and polydispersity indices (PDIs) of PTX-SA, PTX-GA, and the PTX-DA LPs were measured by dynamic light scattering (DLS) using a Malvern laser particle size analyzer (Nano ZS, Malvern, UK).
Gel filtration was applied to determine the encapsulation efficiency (EE). Briefly, 400 μL of liposome samples were loaded on a 120 mM sodium sulfate pre-saturated Sepharose CL-4B gel column to remove the unencapsulated drug, and methanol was used as a demulsifier. The concentration of drugs was determined by HPLC on a reverse ODS XB-C18 column (4.6 mm × 150 mm, 5 μm) with a solvent ratio of 50% ACN and 50% water with 0.1% phosphoric acid added (v/v), at a flow rate of 1.0 mL min−1. The UV detector was maintained at 227 nm. The encapsulation efficiency (EE) of the drugs was calculated according to the following equation:EE (%) = C2/C1 × 100%,where C2 represents the quantity of drug encapsulated in the liposomes and C1 is the total quantity of the drug.
The morphology of the PTX-SA LPs was observed via transmission electron microscope (TEM, JEM2100, JEOL, Japan). The samples were prepared by dropping 10 μL diluted PTX-SA LPs on a carbon-coated copper grid for 30 s and drying the grid with filter paper. Afterwards, 0.2% uranyl acetate (10 μL) was dropped and retained for 30 s.
3.5. Physical stability
In order to evaluate the long-term stability of the liposomes, PTX-SA LPs (0.5 mg mL−1 for PTX-SA) were stored at 4 °C for 1 month. The particle size, PDI and zeta potential were measured at pre-determined intervals.
Additionally, l mL PTX-SA LPs (0.5 mg mL−1 for PTX-SA) were incubated with 9 mL PBS (pH 7.4) containing 10% FBS under a shaking rate of 100 rpm at 37 °C for 48 h. The size and PDI were measured at given time intervals as well.
3.6. In vitro drug release
The in vitro drug release of the PTX-SA LPs was investigated by dialysis at 37 °C. PTX-SA LPs were added to a dialysis bag and suspended in 30 mL phosphate buffer saline (PBS, pH 7.4) containing 0.5% Tween 80 (v/v). At predetermined time points, 500 μL samples were taken for analysis and equal volumes of medium were replenished. The concentrations of PTX and PTX-SA were detected by HPLC as mentioned in 3.4.
3.7. Cell culture
4T1 (breast cancer) cells were cultured in Gibico 1640 medium with 10% FBS, penicillin (30 μg mL−1) and streptomycin (100 μg mL−1). RM-1 (prostatic cancer) cells were cultured in Gibico 1640 medium with 10% FBS, penicillin (30 μg mL−1), streptomycin (100 μg mL−1), and glucose (2.5 mg mL−1). All cells were maintained in a humidified atmosphere of 5% carbon dioxide (CO2) at 37 °C.
3.8. Cytotoxicity assay
The cytotoxicities of PTX solution, PTX-SA solution and the PTX-SA LPs against 4T1 cells and RM-1 cells were determined using the MTT assay. Briefly, cells were seeded in 96-well plates at a density of 1000 cells per well and incubated for 24 h. Then, the culture medium was replaced by 200 μL of fresh medium which contained PTX solution, PTX-SA solution or PTX-SA LPs, respectively. Fresh culture medium without drugs served as a control (n = 3 for each group). The plates were incubated for 48 or 72 h.
After that, at pre-determined time points, 20 μL of the MTT solution was added to each well containing cells. After cultivation for 4 h, the solution was removed completely and 200 μL of DMSO was added to each well in order to dissolve the formazan crystals. Next, the plates were vibrated for 10 min on a mini shaker to dissolve the formazan completely. The absorbance value of each hole was measured at 570 nm in a microplate reader. The half maximal inhibitory concentration (IC50) was obtained by non-linear regression analysis.
3.9. Animals
Sprague-Dawley (SD) rats (male, 200–230 g) and BALB/c mice (female, 18–22 g) were provided by the Laboratory Animal Center of Shenyang Pharmaceutical University. All animal procedures were performed in accordance with the Guidelines for Care and Use of Laboratory Animals of Shenyang Pharmaceutical University, and the experiments were approved by the Animal Ethics Committee of Shenyang Pharmaceutical University.
3.10. In vivo pharmacokinetic study
Male SD rats were stochastically assigned to two groups (n = 3 per group). Prior to the experiments, the rats were fasted for 12 h with free access to water. Taxol® and PTX-SA LPs with an equivalent dosage of PTX (4 mg kg−1) were administrated via tail vein. At the predetermined time points, blood samples were collected and then centrifuged to obtain the plasma. The obtained plasma samples were deposited at −20 °C until determination. The concentrations of PTX-SA and PTX were measured by UPLC-MS-MS (Waters Corp, Milford, MA, USA), and the pharmacokinetic parameters were calculated using DAS 2.0 software in the meantime.
3.11. In vivo biodistribution study
4T1 tumor-bearing BALB/c mice were utilized to access the biodistribution of the PTX-SA LPs. When the tumor volume reached approximately 300 mm3, Taxol® and PTX-SA LPs at a dose equivalent to 8 mg kg−1 of PTX were administrated via tail vein (n = 9 for each group). At 6, 24 and 48 h post injection, the mice were sacrificed and the major organs (heart, liver, spleen, lung and kidney) and tumors were collected and deposited at −20 °C until analysis. The concentrations of PTX-SA and PTX were measured by UPLC-MS-MS (Waters Corp, Milford, MA, USA).
3.12. In vivo antitumor efficacy study
Mice bearing 4T1 tumors were utilized to estimate the in vivo antitumor activity. Approximately 5 × 10⁶ of the 4T1 cells in 200 μL PBS were subcutaneously injected in the right flank of female BALB/c mice. When the tumor volume reached around 100 mm3, the mice were randomly divided into 4 groups (n = 5). The animals in each group were administered every three days via tail vein for a total of four times with saline, PTX solution (8 mg kg−1), PTX-SA LPs (equivalent to 8 mg kg−1 PTX), or PTX-SA LPs (equivalent to 30 mg kg−1 PTX), respectively. The tumor volumes and the body weights of the mice were monitored every two days. On the eleventh day, all mice were sacrificed and their blood was collected for hepatic and renal function analysis. Meanwhile, the major organs and the tumors were dissected and fixed in 4% paraformaldehyde for hematoxylin and eosin (H&E) staining.
3.13. Statistical analysis
All data are presented as mean ± standard deviation. Comparison among groups was determined by Student's t test or one-way analysis of variance (ANOVA) using GraphPad Prism 6.0 (La Jolla, CA). A *P < 0.05 was considered statistically significant.
4. Conclusion
In summary, three simple weak-acid modified PTX derivatives, PTX-SA, PTX-GA, and PTX-DA, were designed and synthesized with a one-step reaction for active loading in a liposomal formulation. According to the formulation screening results, only PTX-SA LPs showed outstanding stability, with a high encapsulation efficacy (97.2 ± 1.8%) and high drug loading (8.84 ± 0.16%). The PTX-SA LPs displayed sustained drug release in vitro and prolonged systemic circulation time in vivo, which can in turn facilitate tumor accumulation. Furthermore, the PTX-SA LPs increased the MTD to more than 30 mg kg−1 and exhibited improved anti-tumor efficacy in a 4T1 xenograft model with negligible side effects. Therefore, weak-acid modification is proved to be a simple and effective method to achieve active loading and high encapsulation efficiency of poorly soluble drugs, showing great potential for clinical application.
Authorship contribution statement
Jiang Yu: investigation, writing—original draft, visualization, formal analysis, data curation. Shuang Zhou: conceptualization, methodology, investigation, writing—review and editing. Jinbo Li: investigation, validation. Yingli Wang: methodology, writing—review and editing. Dongxu Chi: visualization, software. Jiamei Wang: investigation. Xue Wang: investigation. Zhonggui He: resources. Guimei Lin: writing—review and editing. Dan Liu: conceptualization, methodology. Yongjun Wang: conceptualization, methodology, writing—review and editing, supervision, project administration, funding acquisition.
Conflicts of interest
The authors declare no competing financial interest.
Supplementary Material
Acknowledgments
This research was supported by National Science and Technology Major Projects for Major New Drugs Innovation and Development (No. 2017ZX09101-001-005, Beijing, China), the Science and Technology Plan Project of Shenyang (No. 18-400-4-08, Z17-5-064) and the Career Development Program for Young and Middle-aged Teachers in Shenyang Pharmaceutical University.
Electronic supplementary information (ESI) available. See DOI: 10.1039/d0ra03190a
References
- Gubernator J. Expert Opin. Drug Delivery. 2011;8:565–580. doi: 10.1517/17425247.2011.566552. [DOI] [PubMed] [Google Scholar]
- Avnir Y. Ulmansky R. Wasserman V. Even-Chen S. Broyer M. Barenholz Y. Naparstek Y. Arthritis Rheum. 2008;58:119–129. doi: 10.1002/art.23230. [DOI] [PubMed] [Google Scholar]
- Liu J. Chi D. Pan S. Zhao L. Wang X. Wang D. Wang Y. Int. J. Pharm. 2019;557:264–272. doi: 10.1016/j.ijpharm.2018.12.072. [DOI] [PubMed] [Google Scholar]
- Haran G. Cohen R. Bar L. K. Barenholz Y. Biochim. Biophys. Acta, Biomembr. 1993;1151:201–215. doi: 10.1016/0005-2736(93)90105-9. [DOI] [PubMed] [Google Scholar]
- Zucker D. Marcus D. Barenholz Y. Goldblum A. J. Controlled Release. 2009;139:73–80. doi: 10.1016/j.jconrel.2009.05.036. [DOI] [PubMed] [Google Scholar]
- Clerc S. Barenholz Y. Biochim. Biophys. Acta, Biomembr. 1995;1240:257–265. doi: 10.1016/0005-2736(95)00214-6. [DOI] [PubMed] [Google Scholar]
- Na K. Liu K. Yu J. Wang X. Li M. Tian C. He H. He Y. Wang Y. Drug Delivery Transl. Res. 2019:1–13. doi: 10.1007/s13346-019-00669-4. [DOI] [PubMed] [Google Scholar]
- Gabizon A. Catane R. Uziely B. Kaufman B. Safra T. Cohen R. Martin F. Huang A. Barenholz Y. Cancer Res. 1994;54:987–992. [PubMed] [Google Scholar]
- Zhang R. Zhang Y. Zhang Y. Wang X. Gao X. Liu Y. Zhang X. He Z. Wang D. Wang Y. Asian J. Pharm. Sci. 2020;15:385–396. doi: 10.1016/j.ajps.2019.04.007. [DOI] [PMC free article] [PubMed] [Google Scholar]
- Passero Jr F. C. Grapsa D. Syrigos K. N. Saif M. W. Expert Rev. Anticancer Ther. 2016;16:697–703. doi: 10.1080/14737140.2016.1192471. [DOI] [PubMed] [Google Scholar]
- Dawidczyk C. M. Kim C. Park J. H. Russell L. M. Lee K. H. Pomper M. G. Searson P. C. J. Controlled Release. 2014;187:133–144. doi: 10.1016/j.jconrel.2014.05.036. [DOI] [PMC free article] [PubMed] [Google Scholar]
- Krauss A. C. Gao X. Li L. Manning M. L. Patel P. Fu W. Janoria K. G. Gieser G. Bateman D. A. Przepiorka D. Clin. Cancer Res. 2019;25:2685–2690. doi: 10.1158/1078-0432.CCR-18-2990. [DOI] [PubMed] [Google Scholar]
- Xu Q. Tanaka Y. Czernuszka J. T. Biomaterials. 2007;28:2687–2694. doi: 10.1016/j.biomaterials.2007.02.007. [DOI] [PubMed] [Google Scholar]
- Kan P. Tsao C.-W. Wang A.-J. Su W.-C. Liang H.-F. J. Drug Delivery. 2011;2011:629234. doi: 10.1155/2011/629234. [DOI] [PMC free article] [PubMed] [Google Scholar]
- May J. P. Undzys E. Roy A. Li S.-D. Bioconjugate Chem. 2015;27:226–237. doi: 10.1021/acs.bioconjchem.5b00619. [DOI] [PubMed] [Google Scholar]
- Yang W. Yang Z. Fu J. Guo M. Sun B. Wei W. Liu D. Liu H. Biomater. Sci. 2019;7:419–428. doi: 10.1039/C8BM01175C. [DOI] [PubMed] [Google Scholar]
- Zhigaltsev I. V. Winters G. Srinivasulu M. Crawford J. Wong M. Amankwa L. Waterhouse D. Masin D. Webb M. Harasym N. J. Controlled Release. 2010;144:332–340. doi: 10.1016/j.jconrel.2010.02.029. [DOI] [PubMed] [Google Scholar]
- Kamoun W. S. Kirpotin D. B. Huang Z. R. Tipparaju S. K. Noble C. O. Hayes M. E. Luus L. Koshkaryev A. Kim J. Olivier K. Nat. Biomed. Eng. 2019;3:264. doi: 10.1038/s41551-019-0385-4. [DOI] [PubMed] [Google Scholar]
- Huang Z. R. Tipparaju S. K. Kirpotin D. B. Pien C. Kornaga T. Noble C. O. Koshkaryev A. Tran J. Kamoun W. S. Drummond D. C. J. Controlled Release. 2019;310:47–57. doi: 10.1016/j.jconrel.2019.08.006. [DOI] [PubMed] [Google Scholar]
- Bornmann C. Graeser R. Esser N. Ziroli V. Jantscheff P. Keck T. Unger C. Hopt U. Adam U. Schaechtele C. Cancer Chemother. Pharmacol. 2008;61:395–405. doi: 10.1007/s00280-007-0482-z. [DOI] [PubMed] [Google Scholar]
- Graeser R. Bornmann C. Esser N. Ziroli V. Jantscheff P. Unger C. Hopt U. T. Schaechtele C. von Dobschuetz E. Massing U. Pancreas. 2009;38:330–337. doi: 10.1097/MPA.0b013e31819436e6. [DOI] [PubMed] [Google Scholar]
- Howat S. Park B. Oh I. S. Jin Y.-W. Lee E.-K. Loake G. J. New Biotechnol. 2014;31:242–245. doi: 10.1016/j.nbt.2014.02.010. [DOI] [PubMed] [Google Scholar]
- Wani M. C. Taylor H. L. Wall M. E. Coggon P. McPhail A. T. J. Am. Chem. Soc. 1971;93:2325–2327. doi: 10.1021/ja00738a045. [DOI] [PubMed] [Google Scholar]
- Wang Y. Wang J. Yang L. Wei W. Sun B. Na K. Song Y. Zhang H. He Z. Sun J. Nanomedicine. 2019;21:102066. doi: 10.1016/j.nano.2019.102066. [DOI] [PubMed] [Google Scholar]
- Amato I. Science. 1992;256:311–312. doi: 10.1126/science.256.5055.311. [DOI] [PubMed] [Google Scholar]
- Wang L. Asian J. Pharm. Sci. 2017;12:470–477. doi: 10.1016/j.ajps.2017.05.008. [DOI] [PMC free article] [PubMed] [Google Scholar]
- Bhatt P. Lalani R. Vhora I. Patil S. Amrutiya J. Misra A. Mashru R. Int. J. Pharm. 2018;536:95–107. doi: 10.1016/j.ijpharm.2017.11.048. [DOI] [PubMed] [Google Scholar]
- Utreja P. Jain S. Tiwary A. Drug Delivery. 2012;19:11–20. doi: 10.3109/10717544.2011.621990. [DOI] [PubMed] [Google Scholar]
- Zhang J. A. Anyarambhatla G. Ma L. Ugwu S. Xuan T. Sardone T. Ahmad I. Eur. J. Pharm. Biopharm. 2005;59:177–187. doi: 10.1016/j.ejpb.2004.06.009. [DOI] [PubMed] [Google Scholar]
- Soo P. L., Dunne M., Liu J. and Allen C., in Nanotechnology in drug delivery, Springer, 2009, pp. 349–383 [Google Scholar]
- Bernabeu E. Cagel M. Lagomarsino E. Moretton M. Chiappetta D. A. Int. J. Pharm. 2017;526:474–495. doi: 10.1016/j.ijpharm.2017.05.016. [DOI] [PubMed] [Google Scholar]
- Mills E. O'Neill L. A. Trends Cell Biol. 2014;24:313–320. doi: 10.1016/j.tcb.2013.11.008. [DOI] [PubMed] [Google Scholar]
- Tannahill G. M. Curtis A. M. Adamik J. Palsson-McDermott E. M. McGettrick A. F. Goel G. Frezza C. Bernard N. J. Kelly B. Foley N. H. Zheng L. Gardet A. Tong Z. Jany S. S. Corr S. C. Haneklaus M. Caffrey B. E. Pierce K. Walmsley S. Beasley F. C. Cummins E. Nizet V. Whyte M. Taylor C. T. Lin H. Masters S. L. Gottlieb E. Kelly V. P. Clish C. Auron P. E. Xavier R. J. O'Neill L. A. Nature. 2013;496:238–242. doi: 10.1038/nature11986. [DOI] [PMC free article] [PubMed] [Google Scholar]
- Tang W.-L. Tang W.-H. Szeitz A. Kulkarni J. Cullis P. Li S.-D. Biomaterials. 2018;166:13–26. doi: 10.1016/j.biomaterials.2018.03.004. [DOI] [PubMed] [Google Scholar]
- Pauli G. Tang W.-L. Li S.-D. Pharmaceutics. 2019;11:465. doi: 10.3390/pharmaceutics11090465. [DOI] [PMC free article] [PubMed] [Google Scholar]
- Hayes M. E., Noble C. O. and Szoka Jr F. C., US Pat. No, 2014/0220110 A1, 2014
Associated Data
This section collects any data citations, data availability statements, or supplementary materials included in this article.


