Abstract
Bombyx mori (B. mori) silk fibroin (SF) microcapsules have acted as a great candidate in delivering drugs. However, it is difficult to fabricate SF nanocapsules using the present layer-by-layer (LBL) technique. In addition, the current SF microcapsules have limits in loading negatively charged drugs. Here, we invent a novel LBL method by introducing silane (APTES) as a structure indicator to produce SF nanocapsules that can load drugs with negative or positive charge. LBL assembly was completed by alternately coating SF and APTES on the template of polystyrene (PS) nanospheres by electrostatic attraction. SF nanocapsules were obtained after removal of the PS templates. Zeta potential analysis proved LBL assembly was indeed driven by the interaction between negative charge of SF and positive charge of APTES. Fluorescence images and electric microscope images indicated that SF nanocapsules had a hollow and stable structure with diameter at nearly 250 nm. The highest encapsulation rate of DOX or Ce6 were up to 80% and 90%, respectively, indicating SF nanocapsules have a high loading capability for both cationic and anionic drugs. In vitro cell experiments proved the biocompatibility of SF nanocapsules and their burst drug release in response to acidic environment. Furthermore, chemotherapy and photodynamic therapy proved SF nanocapsules loaded with DOX or Ce6 had significant inhibition on tumor cells. Our results suggested that this LBL technique is a facile method for polymers with negative charge to fabricate nanocapsules for antitumor drug carrier.
A novel LBL method was proposed here by introducing silane to produce stable SF nanocapsules for better drug delivery.
1. Introduction
Micro- and nanometer-sized spheres and capsules have potential applications in diverse areas ranging from chemistry to biology, food and medicine.1–4 In particular, in the current biomedical field, microspheres and microcapsules play an important role in accurately controlling delivery and release in drug delivery systems.5–7 Recently, microcapsules have increasingly attracted scientists' interest because their hollow structure exhibits not only high encapsulation efficiency but also great mechanical elasticity.8–10 Accordingly, they are needed to meet the basic requirements of drug carriers such as stability, biocompatibility and biodegradability etc. It is well known that the choice of materials and the corresponding processing approach are the key factors for successful fabrication of microcapsules. The techniques including emulsion polymerization,11 dendrimers design12 and layer-by-layer (LBL) assembly13 are the routine approaches for fabrication of microcapsules. Both of polymers and inorganics are usually used as materials to process microcapsules.14–16 However, there still are challenges on how to overcome the cytotoxicity resulted from ionic polymers and how to respond to the acidic microenvironment of diseased tissues for controlled release. Therefore, it seems urgent to find out a green material and invent a facile technique to fabricate the microcapsules.
Silk fibroin (SF) spun from Bombyx mori (B. mori) silkworm is a natural fibrous protein having unique characters including biocompatibility, degradability and mechanical properties.17 It has been known as a suitable candidate for drug delivery system18–20 because it can be fabricated into microspheres and microcapsules having capacity in high drug loading and controlled release.21,22 For instance, SF microcapsules can be obtained by virtue of LBL assembly by depositing layers of SF coating on sacrificial template and finally dissolving template to yield hollow microcapsules.23 However, there still exits challenge on the fabrication of nanocapsules.24–26 This is because SF is prone to aggregate and the nanometer-sized templates is too small to support the deposition of SF layer on the surface of templates by LBL assembly. Therefore, overcoming these hurdles is the key for successful fabrication of SF nanocapsules. Our previous study indicated that silicane is a suitable structure indicator mediating the assembly of SF into nanocomposites because it hydrolyzed into silicon nuclei and anchor with SF to form a stable assembly by electrical attraction and nucleophilic reaction.27 These nanocomposites exhibited a positive charged surface. Inspired by this result, we hypothesized that introduction of silicane would result in the positive charge distribution on the nanometer-sized templates and consequently attract SF binding due to electrostatic attraction for completion of SF layer deposition. Furthermore, we supposed that introduction of silicane could change the charge of SF nanocapsules from negative to positive, overcoming the shortcoming of SF drug carriers that are limited to load positive charged drugs due to its negative charge.
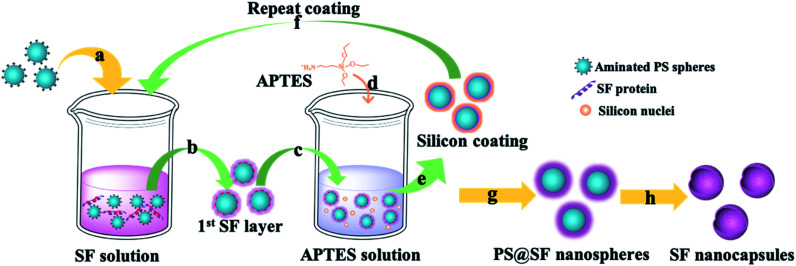
Herein, we proposed a facile approach to fabricate biocompatible and stable SF nanocapsules by using silicane through LBL assembly (Fig. 1). To test our hypothesis, we applied positive charged polystyrene (PS) nanospheres as a sacrifice template (Fig. 1a). The first SF layer would be formed with deposition on the PS nanospheres with interaction between positive charge from polystyrene (PS) nanospheres and negative charge of SF (Fig. 1b). After that, silicane (aminopropyl triethoxysilane, APTES) were introduced and hydrolyzed to be silicon nuclei with positive charge (Fig. 1d). These silicon nuclei would interact with SF by electrostatic attraction to generate a silicon layer, meanwhile providing binding sites for the next layer of SF coating (Fig. 1e). Repeating above step, layer-by-layer of SF would complete (Fig. 1g). Finally, the hollow structure of SF nanocapsules would be obtained after removal of the PS nanospheres templates (Fig. 1h). The surface charge of SF nanocapsules would be selected depending on soaking APTES or not on the last step of LBL experiment. The drug loading and release of the resultant SF nanocapsules were tested by using DOX and Ce6 as model anticancer drug with positive and negative charge, respectively. The inhibition to human breast cancer cells (MCF-7) of drug-loaded SF nanocapsules was also analyzed.
Fig. 1. Schematic illustration of SF nanocapsules fabrication using PS spheres as a template. (a) Throw positive charged PS spheres into SF solution. (b) Remove the affluent SF by centrifugation. (c) Treat coated-PS spheres with APTES aqueous solution. (d) Generate silicon nucleus by hydrolytic condensation of APTES. (e) Silicon coating was formed through electrostatic adsorption between SF and silicon nucleus. (f) Repeat coating treatments for several cycles. (g) Centrifuge and wash for several times after the last coating was completed. (h) SF nanocapsules were obtained after removing the cores.
2. Materials and methods
B. mori silkworm cocoons were provided by the Institute of Huzhou Fiber Inspection, China. Aminopropyl triethoxysilane (APTES) and aminated polystyrene (PS) spheres in a diameter of 200 ± 50 nm were purchased from Aladdin Reagents Co., Ltd. (China). Antitumor drug (doxorubicin, DOX) and photosensitizer (chlorin e6, Ce6) were purchased from J&K chemical CO. Human breast cancer cells, MCF-7, were purchased from the cell bank of Chinese Academy of Sciences.
2.1. Preparation of aqueous SF solution
We prepared SF solution from B. mori silkworm cocoons according to our previous procedures.28,29 Briefly, cocoons were degummed in a boiling aqueous solution with 0.5 wt% Na2CO3 for removal of sericin coated on the fibroin fibers. SF solution were regenerated by dissolving degummed fibroin fibers into 9.3 M LiBr solution followed by dialyzing against deionized water for 3 days. The concentration of SF solution was adjusted to 1 mg mL−1 for the following experiments.
2.2. Fabrication of SF nanocapsules
PS spheres were resuspended in deionized water and centrifuged at 12 000 rpm for 15 min for ensuring their dimensional homogeneity. 2.5 mg of these aminated PS spheres were added into 5 mL of SF solution with the concentration of 1 mg mL−1. The mixture was shaken by ultrasonic dispersed in a power of 20 kHz for 10 min at room temperature. Then, it was kept for 30 min to drive SF to bond PS nanospheres. After centrifuged and washed with deionized water for twice, the precipitates were the PS core coated SF layer. Here, the first SF layer was completed.
For continuing the layer-by-layer of SF, the obtained precipitates were resuspended in a 5 mL of silicane aqueous solution. 5 μL of APTES was dropwise added to activate its hydrolysis. After that, the mixture was gently mixed on a vortex, the reaction system was kept at 4 °C for 15 min. During the reaction, silicon nuclei would coat on the first layer of SF through electrostatic adsorption. The unreacted silicane were removed by centrifuged and washed with deionized water for twice. Multilayer capsules were acquired by repeating the alternating coating of SF and APTES (Fig. 1). The surface potential of nanocapsules can be controlled by selecting the last coating layer with SF or APTES. Finally, the hollow SF nanocapsules with determined layers were acquired after removing the PS cores by immersing the particles into N,N-dimethylformamide (DMF) for 24 h. The nanocapsules containing 3, 6, 9 and 12 layers of SF were termed as SFC3, SFC6, SFC9 and SFC12, respectively, for quantitative analysis and the following experiments.
2.3. Characterization of SF nanocapsules
The morphology of SF nanocapsules was analyzed using scanning electron microscope (SEM) and transmission electron microscope (TEM). For SEM observation, the samples were air-dried on pre-cleaned silicon wafer and coated with gold before imaging. The samples were resuspended and diluted with deionized water before TEM analysis. And then, 10 μL of sample solution was dropped on a copper grid for observation. The surface ζ change of nanocapsules during the process of every treatment layer was measured on Zetasizer NANO-ZS90. The size and dispersibility of SF nanocapsules were monitored and analyzed using a Nano Particle Analyzer (Zetasizer, Malvern, UK), and the SF nanocapsules were dispersed in PBS buffer solution for detection. The secondary structure of samples before and after encapsulating by SF was measured with a Fourier transform infrared spectrometer. High resolution laser scanning confocal microscope (OLYMPUS IX83-FV3000-OSR) was used here to clarify the coating process. SF was labeled by fluorescein isothiocyanate (FITC) or rodamine B isothiocynate (RITC), respectively, according to the reported procedures.27,30 FITC-tagged and RITC-tagged SF with the concentration of 1 mg mL−1 were alternately used to assembly layer. After that, nanocapsules suspension were dropped on slides for observation.
2.4. Loading and release of antitumor drug by SF nanocapsules in vitro
To test the loading ability and loading selectivity of drug by SF nanocapsules, we incubated SFC3, SFC6 and SFC9 with DOX or Ce6, respectively. The surface potential of nanocapsules was designed as positive or negative, respectively. Briefly, 1 mg of lyophilized SF nanocapsules were added into 2 mL aqueous solution of DOX or ethanol solution of Ce6 with concentration of 0.5 mg mL−1. After incubated in dark condition for 24 h, the products were gathered by centrifuged for 3 times. All the supernatants were collected for measuring the absorbance. According to the absorbance value at 490 nm or 405 nm, the loading amount of DOX or Ce6 can be calculated, respectively, according to the following equation where Wd represents the total weight of DOX or Ce6 used in the loading experiment; Wr is the weight of DOX or Ce6 in the supernatant.
To text drug release, 0.5 mg of DOX or Ce6 loaded SF nanocapsules were added into 2 mL phosphate-buffered saline (PBS) solution with different pH (7.4 and 6.5). At predetermined time points, 0.5 mL of supernatant solution were collected to measure the absorbance, and same amounts of fresh PBS solution were added again. Finally, the release curves were acquired according to each measurement.
2.5. In vitro antitumor effect of drug-loaded SF nanocapsules
Mouse fibroblasts (L929) and human breast cancer cells (MCF-7) from cell bank of the Chinese Academy of Sciences were used to test the biocompatibility of SF nanocapsules. L929 or MCF-7 cells were respectively seeded in a 96-well plate with density of 1 × 10⁴ cells per well and cultured for 24 h. Then SF nanocapsules (SFC9) were added into each well with a concentration varying from 20 to 500 μg mL−1. After co-culturing for another 24 h, the viability of L929 cells and MCF-7 cells were determinate by using Cell Titer 96 Aqueous One Solution cell proliferation (MTS) assay according to the manufacturer's protocol (Promega). To assess the antitumor influence of drug-loaded SF nanocapsules, both of DOX-loaded SF nanocapsules and Ce6-loaded SF nanocapsules having a drug concentration of 1 μg mL−1 were added into each well seeded with MCF-7 cells, respectively. Free DOX and free Ce6 were used as control. For Ce6 treatment groups, cells were firstly co-incubated with drug for 6 h before replacing with fresh medium. Then cells were irradiated with the 660 nm laser in a power density of 1 W cm−2 for 6 min. After cultured for 1, 3 and 5 d, the cell viability of each well was determined with MTS assay, respectively.
3. Results and discussion
3.1. Monitoring of LBL assembly process
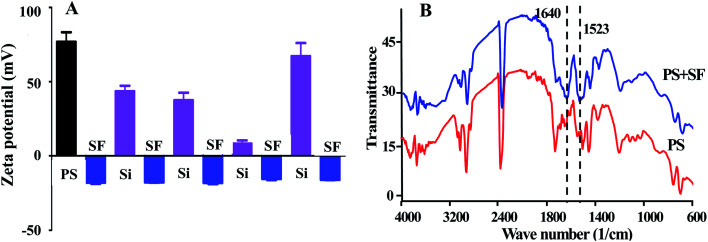
For proving our speculation that the interaction between negative charge of SF and positive charge of APTES would drive the LBL assembly of SF, we tested the surface potential of nanocapsules (Fig. 2A). As shown in Fig. 2, the potential of PS template was changed from positive to negative by coating SF layer. The potential was returned to be positive followed by the addition of APTES. Repeating alternative coating of SF and APTES can alternate the potential in negative and positive states, ensuring the force from interaction between negative charge and positive charge would drive to the completion of LBL assembly. FT-IR spectra further proved that SF was deposited on the PS templates with appearance of peaks at 1523 and 1640 cm−1 as they are the characteristic of the amide I and amide II of SF (Fig. 2B).31
Fig. 2. (A) Zeta-potential analysis of PS spheres treated by SF and APTES alternately. (B) FTIR spectra of PS spheres and after the SF coating.
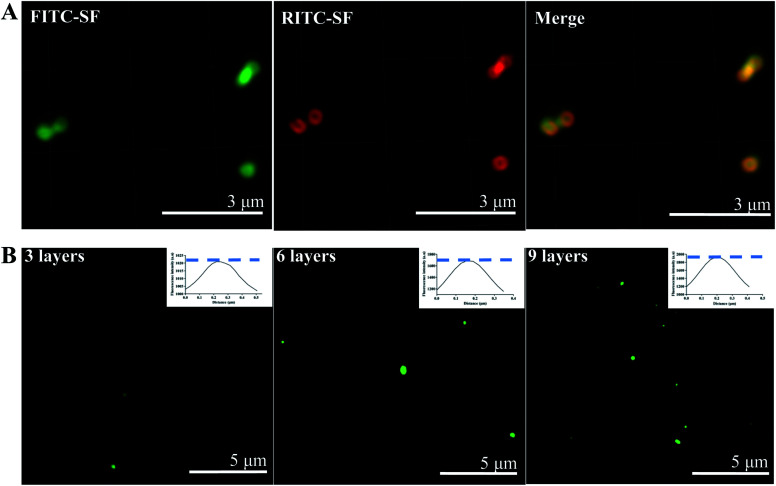
Furthermore, the process including layer-by-layer of SF was monitored by using high resolution confocal to observe FITC-labeled SF and RITC-labeled SF. As shown in Fig. 3A, after the PS cores were coated by each fluorescence-labeled SF alternatively for 3 times, respectively, green and red fluorescence can be observed and perfectly overlapped in the merge image. The hollow structure was also observed in the fluorescence image. The semi-quantitative analysis (Fig. 3B) results indicated the overall fluorescence intensity of particles enhanced with increasing layer number. This means that SF can orderly deposited on the PS templates by LBL.
Fig. 3. High resolution laser scanning confocal microscope images of SF nanocapsules. (A) SF layers was tagged by green and red fluorescence, respectively. (B) PS spheres coated with 3, 6 and 9 layers of FITC-SF. Inserted image was relative fluorescence intensity analysis by Image J software.
3.2. Preparation of SF nanocapsules by LBL
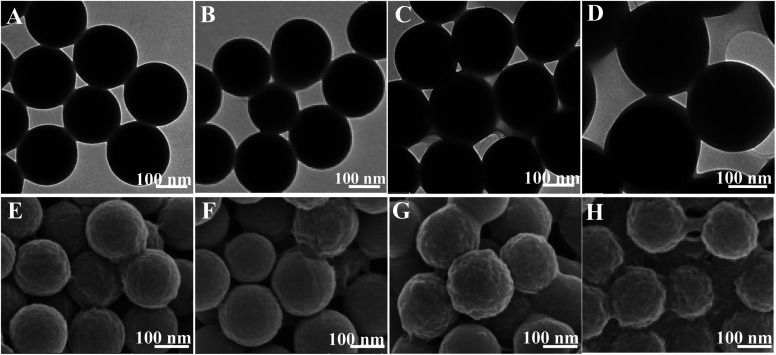
Fig. 4 indicated the morphology of SF nanocapsules by LBL assembly of SF coating on the surface of PS. As shown in TEM images (Fig. 4A–D), the diameter of nanocapsules increased by increasing the repetition of SF from 3 through 6, 9 to 12, meaning that SF layers were accumulated on the surface of PS. The deposition of SF layers was up to 9, resulting in the obvious core–shell structure (Fig. 4C–D). The SEM images further showed that the roughness of SF nanocapsules surface increased when the repetition increased from 3 through 6, 9 to 12 (Fig. 4E–H). Ridge-like coating was formed on the nanocapsules of SFC3 and SFC6 (Fig. 4E–F). Bulges were appeared on the rough surface of the nanocapsules of SFC9 (Fig. 4G). However, the layers of 12 repetition led to a serious adhesion between spheres (Fig. 4H). It might be a part of PS spheres templates lost during the centrifugal washing, resulting in a corresponding increase of SF. This means that repetition of LBL for fabrication of SF nanocapsules should be low to 12.
Fig. 4. TEM (A–D) and SEM (E–H) images showing core–shell structure of PS spheres coated by varying number of SF layers. (A and E) SFC3, (B and F) SFC6, (C and G) SFC9 and (D and H) SFC12.
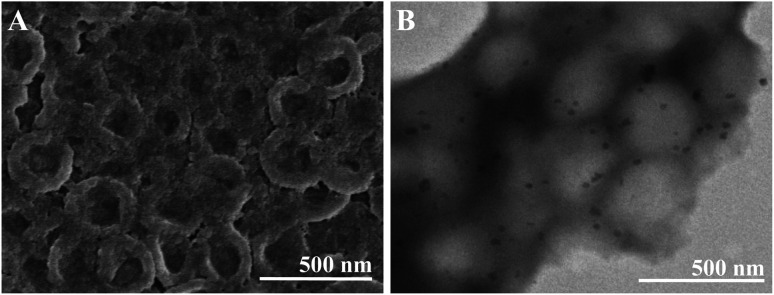
Hollow structure of SF nanocapsules were obtained after removal of the PS templates (Fig. 5). The layers of 12 resulted in a serious adhesion (Fig. S1†), proving that repetition of LBL more than 12 was not suitable for fabrication of SF nanocapsules. TEM images showed that the diameter of nanocapsules was larger than the PS cores (Fig. 5B). This is because the nanocapsules collapsed during the sample preparation by a vacuum treatment. The observation of TEM and SEM proved that the successful fabrication of SF nanocapsules by LBL. The results from above observation indicated that SF coating at 9 layers can produce the most suitable hollow capsules having uniform morphology. Therefore, we selected the nanocapsules with 9 layers (SFC9) for the following experiment.
Fig. 5. SEM (A) and TEM (B) images showed the hollow structure of SFC9.
3.3. Drug loading and release of SF nanocapsules
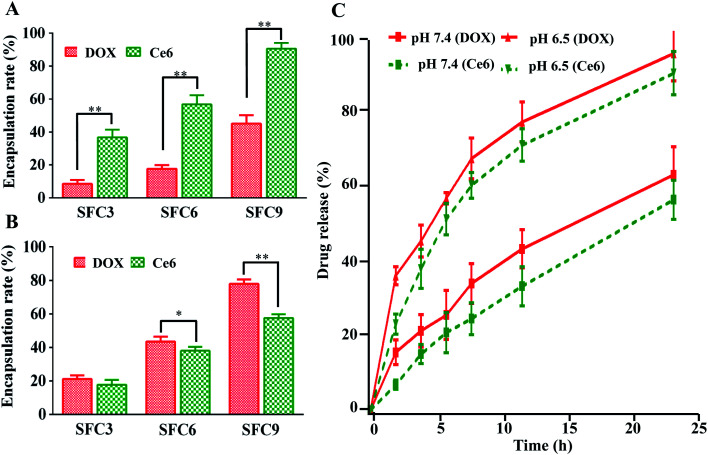
The stability of SF nanocapsules was evaluated before the drug loading. Dynamic light scattering (DLS) measurements exhibited that SF nanocapsules were dispersed in the buffer solution by having a narrow size distribution centered at about 230 nm. After the solution was stored at room temperature for 1 and 2 weeks, respectively, although the average size of SF nanocapsules was slightly increased resulted from the swelling and degradation of silk fibroin, the dispersion index (PDI) still keep at a low value (Fig. S2†). This proved that the SF nanocapsules are stable. We used cationic antitumor drug (DOX) and anionic antitumor photosensitizer (Ce6) as model drugs to test drug loading and release of SF nanocapsules having negative or positive charge. The drug loading amount gradually increased with SF layers increased (Fig. 6A and B). The SFC9 had highest drug encapsulation rate for the drugs of DOX and Ce6 that reached to 80% and 90%, respectively. SF nanocapsules featured by positive charge showed significantly higher drug encapsulation rates for Ce6 than for DOX (Fig. 6A). In contrast, negative charged SF nanocapsules can load more DOX than Ce6 (Fig. 6B). The results proved that the SF nanocapsules can selectively load cationic or anionic drug by changing the surface potential. In addition, the drug release was tested in a buffered solution of pH values at 7.4 and at 6.5, respectively. Fig. 6C showed a burst release of DOX and Ce6 from SF nanocapsules at pH 6.5. After 24 h, most of loaded DOX and Ce6 release from the nanocapsules. In contrast, only 60% of loaded drug can release from nanocapsules when pH was 7.4. We assumed that an acidic condition may weaken the combination between APTES and SF layers, which further lead to the more release of drug. This means the SF nanocapsules can effectively release drug at tumor location because the tumor microenvironment is acidic (pH, 6.0–7.0).32,33
Fig. 6. Drug loading and release of SF nanocapsules. (A) Encapsulation rate of DOX and Ce6 loaded by positive charged nanocapsules with various layers. (B) Encapsulation rate of DOX and Ce6 loaded by negative charged nanocapsules with various layers. (C) Release evaluation of DOX and Ce6 from SF nanocapsules in pH 7.4 and 6.5.
3.4. In vitro cytotoxicity assay
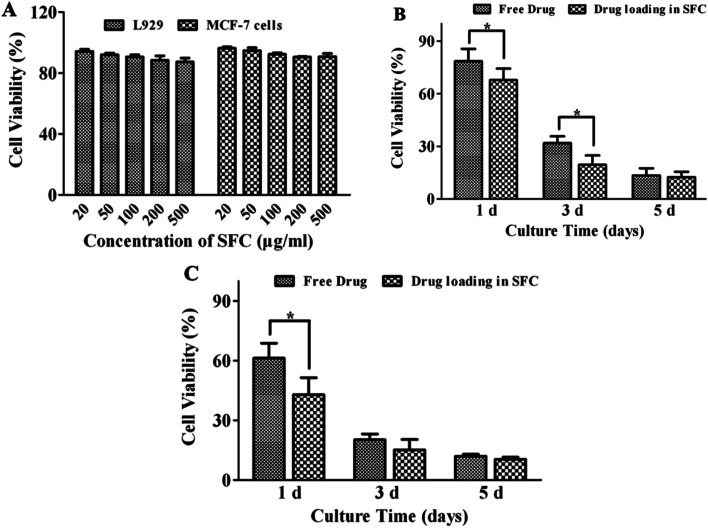
As shown in Fig. 7A, after cocultured with SF nanocapsules for 24 h, L929 cells and MCF-7 cells both exhibited viability higher than 90% compared with control even at a concentration of 500 μg mL−1. This indicated the SF nanocapsules were biocompatible and thus suitable to serve as a drug carrier. After that, DOX and Ce6 were loaded respectively to evaluate whether DOX and Ce6 released from SF nanocapsules could inhibit the growth of MCF-7 cells. As shown in Fig. 7B, the viability of MCF-7 cells exhibited a significant difference between free DOX group and DOX-loaded SF nanocapsules group. After culture of MCF-7 cells for 1 and 3 days respectively, DOX released from SF nanocapsules killed more cells than free DOX at the same concentration at 1 μg mL−1. After culture of 1 day, in comparison to free Ce6, Ce6 released from SF nanocapsules significantly inhibited MCF-7 cells treated by irradiation at 660 nm for 6 min (Fig. 7C). Increasing the culture time to 3 and 5 days, the cell viability from both of the control and the experimental group was about 15%, indicating that the acute toxicity of singlet oxygen produced from Ce6 resulting in a serious death for most of MCF-7 cells in early days. These above results indicated drug-loaded SF nanocapsules can more efficiently kill MCF-7 cells by chemotherapy or photodynamic therapy. This may be because drug-loaded SF nanocapsules can easily reach tumor cells due to the soft properties of capsules.
Fig. 7. Cell viability of L929 cells and MCF-7 cells after treatment with SF nanocapsules in different concentration. (A) Biocompatibility of SF nanocapsules on L929 cells and MCF-7 cells. (B) Cell cytotoxicity of DOX-loaded SF nanocapsules on MCF-7 cells for 1, 3 and 5 days. (C) Cell cytotoxicity of Ce6-loaded SF nanocapsules on MCF-7 cells for 1, 3 and 5 days after irradiation.
4. Conclusions
We herein invented a new LBL assembly procedure to yield hollow and stable SF nanocapsules. It is the first time to introduce APTES to take part in the LBL assembly for improving the stability of nanocapsules. The SF nanocapsules were successfully fabricated by layer-by-layer of SF and APTES on PS nanospheres. The size and topography of SF nanocapsules could be controlled by changing the number of layers. Fluorescence images and zeta potential analysis proved the SF nanocapsules were constructed by LBL method relying on electrostatic attraction. The SF nanocapsules showed a high drug loading capability for positive charged DOX and negative charged Ce6 by changing the surface potential. The SF nanocapsules presented a burst release of drugs at pH 6.5 but kept slow release at pH 7.4 in vitro. After loading DOX or Ce6, the nanocapsules can more efficiently kill tumor cells by chemical or photodynamic therapy. This work suggested that the SF nanocapsules generated by the novel LBL method are a promising drug carrier in cancer therapy.
Conflicts of interest
There are no conflicts to declare.
Supplementary Material
Acknowledgments
We acknowledge the support of Health and Family Planning Commission scientific research project of Zhejiang Province, China (2017ZD002), Educational Commission scientific research project of Zhejiang province, China (Y201737977), National Natural Science Foundation of China (51673168, 81871499, and 31800807), Zhejiang Provincial Natural Science Foundation of China (LZ17C170002 and LZ16E030001), National Postdoctoral Science Foundation of China (2018M632483), Fundamental Research Funds for the Central Universities (2018XZZX001-11), State of Sericulture Industry Technology System (CARS-18-ZJ0501), Zhejiang Provincial Science and Technology Plans (2016C02054-19), and Zhejiang Provincial Key Laboratory Construction Plans (2020E10025).
Electronic supplementary information (ESI) available. See DOI: 10.1039/d0ra04024j
References
- Esser-Kahn A. P. Odom S. A. Sottos N. R. White S. R. Moore J. S. Macromolecules. 2011;44:5539–5553. doi: 10.1021/ma201014n. [DOI] [Google Scholar]
- Bedard M. F. De Geest B. G. Skirtach A. G. Mohwald H. Sukhorukov G. B. Adv. Colloid Interface Sci. 2010;158:2–14. doi: 10.1016/j.cis.2009.07.007. [DOI] [PubMed] [Google Scholar]
- Wang X. Q. Wenk E. Matsumoto A. Meinel L. Li C. M. Kaplan D. L. J. Controlled Release. 2007;117:360–370. doi: 10.1016/j.jconrel.2006.11.021. [DOI] [PubMed] [Google Scholar]
- Wu X. M. Hu J. Zhu B. H. Lu L. Huang X. D. Pang D. W. J. Chromatogr. A. 2011;1218:7341–7346. doi: 10.1016/j.chroma.2011.08.045. [DOI] [PubMed] [Google Scholar]
- Luo D. Gould D. J. Sukhorukov G. B. Biomacromolecules. 2016;17:1466–1476. doi: 10.1021/acs.biomac.6b00070. [DOI] [PubMed] [Google Scholar]
- Du C. L. Zhao J. Fei J. B. Cui Y. Li J. B. Adv. Healthcare Mater. 2013;2:1246–1251. doi: 10.1002/adhm.201200414. [DOI] [PubMed] [Google Scholar]
- Dhamecha D. Movsas R. Sano U. Menon J. U. Int. J. Pharm. 2019;569:118627. doi: 10.1016/j.ijpharm.2019.118627. [DOI] [PMC free article] [PubMed] [Google Scholar]
- Tong W. J. Gao C. Y. Moehwald H. Colloid Polym. Sci. 2008;286:1103–1109. doi: 10.1007/s00396-008-1885-z. [DOI] [Google Scholar]
- Gordon V. D. Xi C. Hutchinson J. W. Bausch A. R. Marquez M. Weitz D. A. J. Am. Chem. Soc. 2004;126:14117–14122. doi: 10.1021/ja0474749. [DOI] [PubMed] [Google Scholar]
- Ye C. H. Shchepelina O. Calabrese R. Drachuk I. Kaplan D. L. Tsukruk V. V. Biomacromolecules. 2011;12:4319–4325. doi: 10.1021/bm201246f. [DOI] [PMC free article] [PubMed] [Google Scholar]
- Okubo M. Yamashita T. Minami H. Konishi Y. Colloid Polym. Sci. 1998;276:887–892. doi: 10.1007/s003960050325. [DOI] [Google Scholar]
- Sunder A. Kramer M. Hanselmann R. Mulhaupt R. Frey H. Angew. Chem., Int. Ed. 1999;38:3552–3555. doi: 10.1002/(SICI)1521-3773(19991203)38:23<3552::AID-ANIE3552>3.0.CO;2-G. [DOI] [PubMed] [Google Scholar]
- Monge C. Almodovar J. Boudou T. Picart C. Adv. Healthcare Mater. 2015;4:811–830. doi: 10.1002/adhm.201400715. [DOI] [PMC free article] [PubMed] [Google Scholar]
- Ochs C. J. Such G. K. Yan Y. van Koeverden M. P. Caruso F. ACS Nano. 2010;4:1653–1663. doi: 10.1021/nn9014278. [DOI] [PubMed] [Google Scholar]
- Long Y. Vincent B. York D. Zhang Z. B. Preece J. A. Chem. Commun. 2010;46:1718–1720. doi: 10.1039/B911266A. [DOI] [PubMed] [Google Scholar]
- Richardson J. J. Teng D. Bjornmalm M. Gunawan S. T. Guo J. Cui J. W. Franks G. V. Caruso F. Langmuir. 2014;30:10028–10034. doi: 10.1021/la502176g. [DOI] [PubMed] [Google Scholar]
- Vepari C. Kaplan D. L. Prog. Polym. Sci. 2007;32:991–1007. doi: 10.1016/j.progpolymsci.2007.05.013. [DOI] [PMC free article] [PubMed] [Google Scholar]
- Yang M. Y. He W. Shuai Y. J. Min S. J. Zhu L. J. J. Polym. Sci., Part B: Polym. Phys. 2013;51:742–748. doi: 10.1002/polb.23249. [DOI] [Google Scholar]
- Coburn J. M. Na E. Kaplan D. L. J. Controlled Release. 2015;220:229–238. doi: 10.1016/j.jconrel.2015.10.035. [DOI] [PMC free article] [PubMed] [Google Scholar]
- Shuai Y. J. Yang S. X. Li C. L. Zhu L. J. Mao C. B. Yang M. Y. J. Mater. Chem. B. 2017;5:3945–3954. doi: 10.1039/C7TB00208D. [DOI] [PMC free article] [PubMed] [Google Scholar]
- Mottaghitalab F. Farokhi M. Shokrgozar M. A. Atyabi F. Hosseinkhani H. J. Controlled Release. 2015;206:161–176. doi: 10.1016/j.jconrel.2015.03.020. [DOI] [PubMed] [Google Scholar]
- Ye C. H. Combs Z. A. Calabrese R. Dai H. Q. Kaplan D. L. Tsukruk V. V. Small. 2014;10:5087–5097. doi: 10.1002/smll.201401119. [DOI] [PubMed] [Google Scholar]
- Li L. H. Puhl S. Meinel L. Germershaus O. Biomaterials. 2014;35:7929–7939. doi: 10.1016/j.biomaterials.2014.05.062. [DOI] [PubMed] [Google Scholar]
- Shchepelina O. Drachuk I. Gupta M. K. Lin J. Tsukruk V. V. Adv. Mater. 2011;23:4655–4660. doi: 10.1002/adma.201102234. [DOI] [PubMed] [Google Scholar]
- Wang X. Wenk E. Hu X. Castro G. R. Meinel L. Wang X. Li C. Merkle H. Kaplan D. L. Biomaterials. 2007;28:4161–4169. doi: 10.1016/j.biomaterials.2007.05.036. [DOI] [PMC free article] [PubMed] [Google Scholar]
- Ye C. H. Drachuk I. Calabrese R. Dai H. Q. Kaplan D. L. Tsukruk V. V. Langmuir. 2012;28:12235–12244. doi: 10.1021/la302455y. [DOI] [PubMed] [Google Scholar]
- Wang J. Yang S. X. Li C. L. Miao Y. G. Zhu L. J. Mao C. B. Yang M. Y. ACS Appl. Mater. Interfaces. 2017;9:22259–22267. doi: 10.1021/acsami.7b05664. [DOI] [PMC free article] [PubMed] [Google Scholar]
- Li C. L. Yang M. Y. Zhu L. J. Zhu Y. Q. Microsc. Res. Tech. 2017;80:1297–1303. doi: 10.1002/jemt.22928. [DOI] [PMC free article] [PubMed] [Google Scholar]
- Wang J. Zhang Y. Jin N. Mao C. B. Yang M. Y. ACS Appl. Mater. Interfaces. 2019;11:11136–11143. doi: 10.1021/acsami.8b21488. [DOI] [PubMed] [Google Scholar]
- Wang S. H. Xu T. Yang Y. H. Shao Z. Z. ACS Appl. Mater. Interfaces. 2015;7:21254–21262. doi: 10.1021/acsami.5b05335. [DOI] [PubMed] [Google Scholar]
- Karakutuk I. Ak F. Okay O. Biomacromolecules. 2012;13:1122–1128. doi: 10.1021/bm300006r. [DOI] [PubMed] [Google Scholar]
- Estrella V. Chen T. A. Lloyd M. Wojtkowiak J. Cornnell H. H. Ibrahim-Hashim A. Bailey K. Balagurunathan Y. Rothberg J. M. Sloane B. F. Johnson J. Gatenby R. A. Gillies R. J. Cancer Res. 2013;73:1524–1535. doi: 10.1158/0008-5472.CAN-12-2796. [DOI] [PMC free article] [PubMed] [Google Scholar]
- Dai Y. L. Xu C. Sun X. L. Chen X. Y. Chem. Soc. Rev. 2017;46:3830–3852. doi: 10.1039/C6CS00592F. [DOI] [PMC free article] [PubMed] [Google Scholar]
Associated Data
This section collects any data citations, data availability statements, or supplementary materials included in this article.


