Abstract
Biocompatibility restrictions have limited the use of magnetic nanoparticles for magnetic hyperthermia therapy to iron oxides, namely magnetite (Fe3O4) and maghemite (γ-Fe2O3). However, there is yet another magnetic iron oxide phase that has not been considered so far, in spite of its unique magnetic properties: ε-Fe2O3. Indeed, whereas Fe3O4 and γ-Fe2O3 have a relatively low magnetic coercivity, ε-Fe2O3 exhibits a giant coercivity. In this report, the heating power of ε-Fe2O3 nanoparticles in comparison with γ-Fe2O3 nanoparticles of similar size (∼20 nm) was measured in a wide range of field frequencies and amplitudes, in uncoated and polymer-coated samples. It was found that ε-Fe2O3 nanoparticles primarily heat in the low-frequency regime (20–100 kHz) in media whose viscosity is similar to that of cell cytoplasm. In contrast, γ-Fe2O3 nanoparticles heat more effectively in the high frequency range (400–900 kHz). Cell culture experiments exhibited no toxicity in a wide range of nanoparticle concentrations and a high internalization rate. In conclusion, the performance of ε-Fe2O3 nanoparticles is slightly inferior to that of γ-Fe2O3 nanoparticles in human magnetic hyperthermia applications. However, these ε-Fe2O3 nanoparticles open the way for switchable magnetic heating owing to their distinct response to frequency.
ε-Fe2O3 is a magnetic iron(iii) oxide with a giant coercivity. Its potential in hyperthermia applications has been evaluated in comparison with γ-Fe2O3 over a wide range of field frequencies and amplitudes.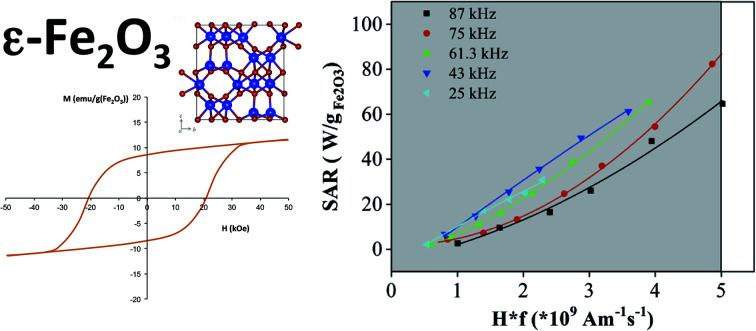
Introduction
Magnetic heating with magnetic nanoparticles (MNPs) is an elegant method for non-contact heating that has been implemented in industrial1 and clinical applications.2 The generation of heat by MNPs in internal parts of the body (mainly tumors) by application of an alternating current (AC) magnetic field in the radio-frequency-range was proposed as a hyperthermia therapy decades ago,3 and it is now in clinical practice4,5 in a limited number of European hospitals. Unfortunately, the low heating power achievable is still a strongly limiting factor in these6–10 and other similar applications.11
Few nanoparticle (NP) magnetic materials are trusted by health authorities for in-body use, where only iron oxides, and particularly maghemite (γ-Fe2O3), are generally accepted for hyperthermia cancer therapy. Although many other materials present advantages in terms of heating power, their safety is not yet guaranteed. Thus, the only viable opportunity to enhance clinical hyperthermia performance has been the optimization of γ-Fe2O3 NP structural features, such as crystallinity, size, shape and state of aggregation.14–16 Another magnetic iron(iii) oxide, ε-Fe2O3, that could open new perspectives in the field was first prepared in the lab in 1934 by Forestier and Guiot-Guillain.17 But its exceptional magnetic properties remained unexplored until 2004 when it was prepared as a pure phase by Jin et al.,18 who showed that the magnetic behaviour of this phase differs drastically from the rest of iron oxides, in that it has a gigantic coercivity. Based on the development of reliable synthesis methods for the fabrication of pure ε-Fe2O3 NPs by some of the authors of this report,18–23 we have investigated for the first time the utility of these NPs in hyperthermia therapy.
The thermal power density of MNPs under an applied AC magnetic field is the energy dissipated in a hysteresis cycle multiplied by the frequency. Depending on the intensity of the applied magnetic field, H, and the coercivity, Hc, of the NPs, the magnetization will revert by rotation of magnetic moment (i.e., Néel relaxation24) or by rotation of the entire NP (i.e., Brownian relaxation25). Each type of magnetization reversal has a different response to the frequency. Moreover, the choice of frequencies, f, and field intensities, H for human use are limited owing to safety considerations, and therefore hyperthermia studies should cover a wide range of frequencies. The acceptable field limits vary with the magnet coil diameter and configurations. Estimates resulting from human subjective impressions using a one-turn coil around the chest with a diameter of 30 cm fixed the limit for that configuration at Hf = 5 × 10⁸ Am−1 s−1.12 Later, a limit of Hf = 5 × 10⁹ Am−1 s−1 was established for smaller loops,13 and a limit of Hf = 18 × 108 Am−1 s−1 was proposed for gap magnets.4 The question then arises regarding the best strategy to improve the performance of clinical magnetic hyperthermia: using high frequencies and low fields, or using low frequencies and high fields.
In this report we measured and compared the heating power of ε-Fe2O3 and γ-Fe2O3 NPs with a similar particle size (∼20 nm). A wide range of frequencies (20–900 kHz) and field amplitudes (4–95 kA m−1) were used to determine the optimal field conditions for the application. The measurements were carried out at various NP mobility conditions: in pure water, under cell cytoplasm viscosity and at complete mobility restriction. We also studied the influence of a particle polymer coating on the heating power. Finally, some conclusions about the utility of ε-Fe2O3 NPs, and the optimal frequency range for clinical hyperthermia therapy were drawn.
Experimental
Synthesis
Block copolymer P4VP-b-P(MPEGA-co-RhodPEGMA-co-carboxylicPEGMA) (poly(4-vinylpyridine)-block-poly(methoxypolyethylenglycolacrylate-co-Rhodamine polyethylenglycolmethacrylate-co-carboxylic polyethylenglycolmethacrylate)), used for the coating of iron oxide nanoparticles, was prepared by atom transfer radical polymerization (ATRP) according to methods described elsewhere.26 Details on materials and synthesis procedures are given in ESI.† A scheme of the synthesis route is shown in ESI Fig S1.†
ε-Fe2O3 nanoparticles were synthesized by partially arranging the ferrihydrite seed sol–gel method.20 Basically, a precursor of iron oxide hydroxide nanoparticles embedded in silica matrix was prepared by the sol–gel technique; tetraethyl orthosilicate (TEOS) was added to aqueous dispersion of iron oxide hydroxide nanoparticles, to form silica by the hydrolysis process. Then, the precursor was sintered in air to form ε-Fe2O3 nanoparticles embedded in silica matrix. Finally the silica matrix was etched by NaOH treatment and washed with water several times, and the obtained NPs were dispersed in tetramethylammonium aqueous solution using supersonic waves to obtain a stable basic NP suspension.
γ-Fe2O3 nanoparticles were synthesized following a protocol modified from Bonvin et al. described previously.27 Briefly, γ-Fe2O3 nanoparticles were synthesized by co-precipitation in combination with a hydrothermal treatment performed at 120 °C for 15 h.
The NPs were coated with the P4VP-b-P(MPEGA-co-RhodPEGMA-co-carboxylicPEGMA) copolymer as described previosly.26 Briefly, the uncoated iron oxide nanoparticles are dispersed in slightly acidic medium (pH = 2) and mixed with a polymer solution at the same pH. At this pH, the P4VP block is hydrophilic, and, as the pH is increased to 7.4, it becomes hydrophobic encapsulating the nanoparticles. Finally, the suspension is filtered through a 0.22 μm membrane filter to obtain the final ferrofluid. The final iron oxide concentrations in the ε-Fe2O3 and γ-Fe2O3 NP suspension samples were 4.0 g(Fe2O3 per l) and 3.86 g(Fe2O3 per l), respectively.
Media for hyperthermia experiments emulating cell cytoplasm viscosity consisted on polyethylene glycol (PEG 8000) aqueous solution. Most of reports on cell cytoplasm viscosity indicate values from 1.2 to 1.5 times that of water.28–32 However, some authors report values as high as 10 fold.33 Considering that the viscosity of water is 0.89 mPa s, at 25 °C, media with a viscosity 1.9 and 10 times that of water have been obtained from 3 wt% and 10 wt% PEG solutions in water34,35 with a viscosities of 1.68 mPa s and 8.9 mPa s, respectively. NPs dispersions in these media were prepared by dissolving under sonication 30 mg of PEG8000 in 970 μl of ε-Fe2O3 NP suspension (7.0 mg(Fe2O3) per ml), and by dissolving 100 mg of PEG8000 in 900 μl ε-Fe2O3 (c = 7.0 mg ml−1).
SAR calculations
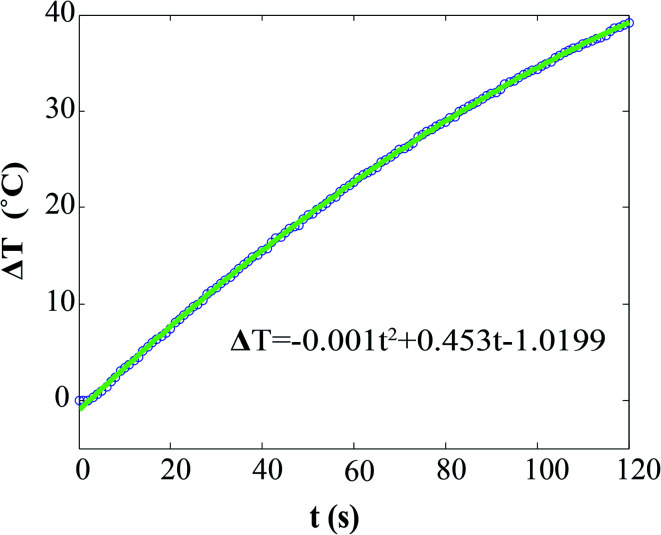
Specific absorption rate (SAR) values of NPs' suspensions were measured on self-designed and self-made equipment. 2 ml of sample and 2 ml of water were placed in the magnet gap, and their corresponding temperatures were measured by two GaAs fiber optic temperature sensors (OptoCon), which were inserted into the liquids and connected to a fiber optic temperature monitoring system. When the temperatures of the sample and the water were stable, they started to be recorded: (i) 300 s with the field off, (ii) 30 s with the field on, and (iii) 300 s with the field off. The SAR values were extracted from the T(t) curves (Fig. 1), by using the equation:
 |
1 |
where Cp(H2O) is the heat capacity of water, c(Fe2O3) is the concentration of iron oxide NPs, ΔT represents the temperature difference between suspension of iron oxide NPs and water reference, and 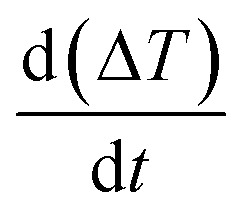 stands for the initial slop of heating curves obtained by fitting the experimental measurements to a second order polynomial (see Fig. 1).
Fig. 1. Heating curves of ε-Fe2O3 in aqueous suspension exposed to an AC field (101 kHz, 51 kA m−1). The line corresponds to a fitting to a second order polynomial. The y-axis corresponds to the temperature difference between the NPs suspension sample and the control pure water sample placed in the ferrite magnet gap.
Transmission electron microscope (TEM) observations were carried in a JEOL 2000-FXII microscope on carbon coated copper grids after dip coating of the grids in the ferrofluid samples. Dynamic light scattering (DLS) measurements were performed in Zetasizer Nano ZS from Malvern Laser. Chemical analysis of iron content in the samples was carried out in by coupled plasma atomic emission spectrometry (ICP-AES).
The 2θ–θ scan X-ray powder diffraction (XRD) measurements were performed using Rigaku Ultima IV with Cu Kα radiation (λ = 1.5418 Å). Rietveld analyses were performed using the PDXL program of RIGAKU.
Magnetic measurements of samples were carried out on a superconducting quantum interference device (SQUID)-based magnetometer MPMS-XL5 from Quantum Design. AC magnetic susceptibility measurements versus temperature were carried out in a 10 K to 300 K temperature range, and magnetization vs. field measurements at 5 K and 300 K were carried out in a −500 Oe to 50 000 Oe field range. AC magnetic susceptibility vs. frequency measurements at 300 K were carried out in a 1 Hz to 500 kHz frequency range, using the DynoMag AC susceptometer (RISE Research Institutes of Sweden).
SAR measurements at several amplitudes and frequencies of the magnetic field were carried out in a homemade magnetic heating source26 consisting of a signal generator, a high power amplifier and a matching transformer connected a RCL circuit. The magnetic field was produced in between the gap of a ferrite nucleus with Litz wires windings. The field intensity and frequency during the measurements were varied in the ranges 8–92 kA m−1 and 25 to 100 kHz respectively. The measurements were performed in aqueous suspensions of uncoated and coated ε-Fe2O3 NPs, uncoated and coated γ-Fe2O3 NPs and agar–agar gels of these suspensions.
Cell experiments
For these experiments, MDA-MB468 breast cancer cell line was purchased from Leibniz Institute and grown in DMEM medium (GIBCO) supplemented with 10% FBS (GIBCO) and with penicillin/streptomycin (GIBCO).
About 10 000 cells were seeded in 96-well plates 24 hours prior to the treatments with ferrofluids. Then, the cells were incubated with TNPs for 24 hours, with different concentrations of ε-Fe2O3 and γ-Fe2O3 (0.1, 0.2, 0.5 and 1.0 mg Fe2O3 per ml). As a control, MDA-MB-468 cells were cultured in the absence of NPs and prepared under the same conditions. Cells were collected by trypsinization and NPs incorporation and cytotoxicity were analyzed by flow cytometry in a FACSCalibur flow cytometer (BD Biosciences).
NPs cytotoxicity was evaluated by Annexin-V binding assay. Briefly, NPs treated cells were stained for 20 min at room temperature in the darkness with Anexin-Dy634, which binds to the phosphatidylserine exposed in the cell surface, in annexin-binding buffer (140 mM NaCl, 2.5 mM CaCl2, 10 mM HEPES/NaOH, pH 7.4). Cell suspension was diluted to 200 μl with the corresponding buffer and analyzed by flow cytometry.
In order to evaluate the internalization capacity of the NPS, rhodamine fluorescence was measured by cytometry in the same samples.
The effect of NPs on the viability and cell growth of cells was evaluated using the MTT reduction assay according to Mosmann et al.36 Briefly, cells were seeded and treated with ferrofluids in the same way as explained above. After 24 hours of culture with NPs, the medium is removed and the cells are washed to eliminate NPs in suspension. Then each well was mixed with 10 μl of a MTT dye solution (3-(4,5-dimethylthiazol-2-yl)-2,5 diphenyltetrazolium bromide, 5 mg ml−1 in PBS). Intact cells contain mitochondrial dehydrogenases that can reduce the yellowish water-soluble MTT to insoluble purple formazan crystals, while dead cells do not produce this reduction. After 2–3 h of incubation, all formed crystals were centrifuged and solubilized in isopropanol. Finally, the absorbance of each well was measured in a microplate reader at 550 nm and compared to that of untreated cells. A reduction in absorbance reveals a reduced number of living cells.
Results and discussion
Structural characterization of the nanoparticles
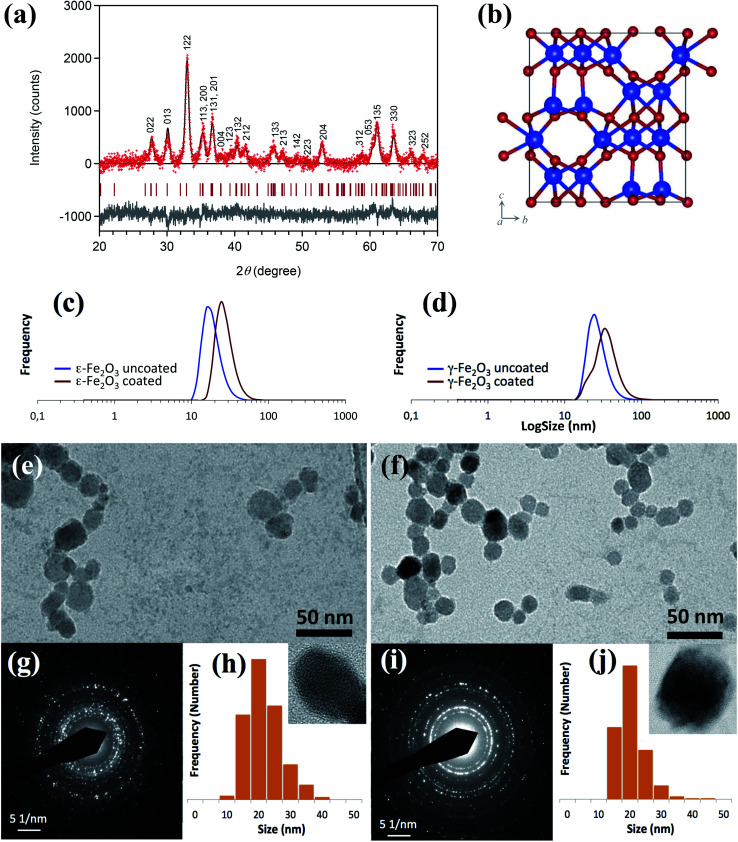
The ε-Fe2O3 and γ-Fe2O3 NPs were characterized by DLS, TEM and XRD (Fig. 2). Rietveld analysis of the XRD pattern indicates a pure ε-Fe2O3 phase (orthorhombic, space group Pna21) (Fig. 2(a) and (b)). A comparison of the sample pattern with those of α-Fe2O3 and γ-Fe2O3 confirms the absence of these phases in the sample (ESI Fig. S2†). The crystallite sizes calculated by the Scherrer formula were 20.5 and 17.4 nm, for the ε-Fe2O3 NPs and γ-Fe2O3 NPs, respectively. The DLS results (Fig. 2(c) and (d)) indicated that the hydrodynamic diameters, DH, of the uncoated NPs were 18 and 27 nm for ε-Fe2O3 and γ-Fe2O3 NPs, respectively, which increased after coating to 29 and 36 nm, respectively. The TEM images of the ε-Fe2O3 and γ-Fe2O3 iron oxide-copolymer NPs (Fig. 2(e) and (f), respectively) exhibited a mix of rectangular and hexagonal NPs with a mean size Dp (standard deviation: SD) of 19.1 (5.3) nm for ε-Fe2O3 NPs and Dp (SD) = 18.3 (7.3) nm γ-Fe2O3 NPs, respectively. Histograms of the particle size distributions derived from the TEM images of the ε-Fe2O3 and γ-Fe2O3 iron oxide-copolymer NPs are shown in Fig. 2(h) and (j), respectively. The crystalline structure of the ε-Fe2O3 and γ-Fe2O3 NP samples was also established from electron diffraction (ED) patterns (Fig. 2(g) and (i), respectively). Finally, a detailed structural characterization of these two NP types can be found in Ohkoshi et al.18–23 in the case of ε-Fe2O3 NPs, and in Bonvin et al.14,27 in the case of γ-Fe2O3 NPs.
Fig. 2. (a) XRD pattern with Rietveld analysis of ε-Fe2O3 NPs. Red dots, black lines, and grey lines are the observed patterns, calculated patterns, and their differences, respectively. Red bars represent the calculated positions of the Bragg reflections of the ε-Fe2O3 phase (orthorhombic, Pna21). (b) Crystal structure of ε-Fe2O3. Blue and red balls indicate Fe and O atoms, respectively. (c) Distribution of hydrodynamic diameters, DH, from dynamic light scattering (DLS) measurements of coated and uncoated ε-Fe2O3 NPs and (d) γ-Fe2O3 NPs. (e) TEM images of ε-Fe2O3 NPs and (f) γ-Fe2O3NPs. (g) ED patterns of ε-Fe2O3 NPs. (h) Particle size histograms from TEM images of ε-Fe2O3 NPs, in the inset HRTEM image of a single NP. (i) ED patterns of γ-Fe2O3 NPs. (j) Particle size histograms from TEM images of γ-Fe2O3 NPs. In the inset, HRTEM images of a single NP.
Magnetic properties of the nanoparticles
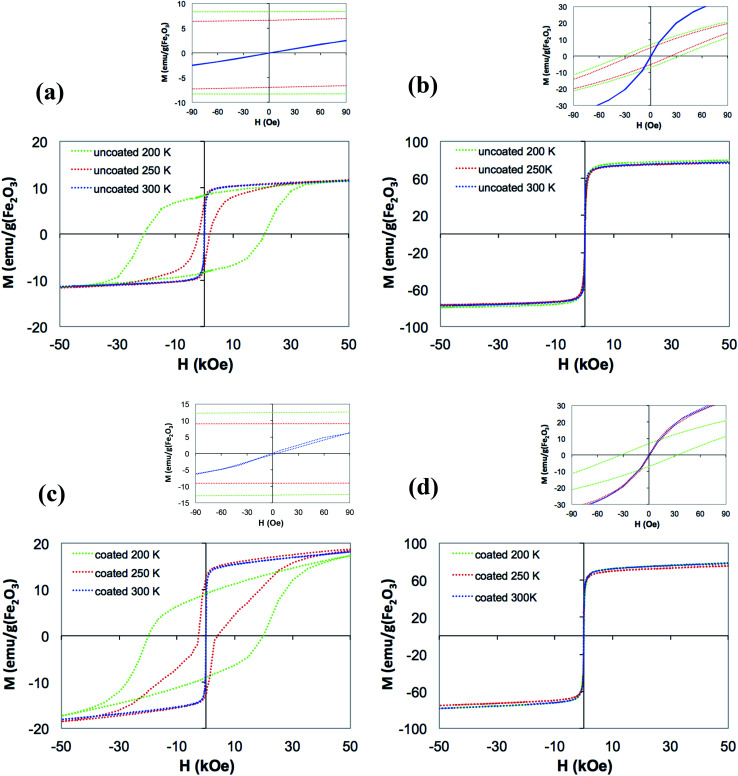
The different magnetic characters of the ε-Fe2O3 and γ-Fe2O3 NPs were clearly reflected in the M(H) measurements at different temperatures. The hysteresis cycles of ε-Fe2O3 NPs suspensions at a temperature well below the freezing point (i.e., 200 K) exhibited a huge coercivity (Fig. 3(a), Table 1). The coercivity was considerable reduced when the temperature approached the water melting point, although still well above the higher field amplitude used in SAR measurements. On the contrary, the coercivity in γ-Fe2O3 NPs hysteresis cycles (Fig. 3(b), Table 1) was consistently below the SAR field amplitudes (inset in Fig. 3(b)). At 300 K, when the NPs are free to rotate, the coercivity of the suspensions decreased to 0 in both types of NPs.
Fig. 3. Magnetization vs. field of water suspension of (a) uncoated and (c) coated ε-Fe2O3 NP, and (b) uncoated and (d) coated γ-Fe2O3 NPs at different temperatures. In the insets, details of the samples magnetization within the range of field amplitudes used in SAR experiments.
Coercivity Fields, Hc, and saturation magnetization, Ms, of ε-Fe2O3 and γ-Fe2O3 NPs suspensions, before and after polymer coating, at different temperatures.
| Phase | Coating | H c (Oe) | Ms (emu per g Fe2O3) | ||||
|---|---|---|---|---|---|---|---|
| 200 K | 250 K | 300 K | 200 K | 250 K | 300 K | ||
| ε-Fe2O3 | No | 20 500 | 1900 | 0 | 9 | 10 | 10 |
| Yes | 20 000 | 3300 | 0 | 10 | 15 | 15 | |
| γ-Fe2O3 | No | 33 | 23 | 0 | 76 | 74 | 74 |
| Yes | 36 | 19 | 0 | 72 | 69 | 72 | |
The AC magnetic susceptibility vs. temperature measurements (ESI Fig. S4†) of uncoated ε-Fe2O3 NPs suspension exhibit a peak in both χ′(T) and χ′′(T) between 80 and 120 K. Both of the χ′(T) and χ′′(T) peaks do not exhibit the typical frequency dependence of the Néel relaxation process. An anomaly in this temperature range was also observed previously in Mössbauer measurements, and was attributed to a structural transformation and possible spin reorientation effects.12 Apart from this peak, χ′′(T) remains zero in the entire 10–260 K temperature range, implying that no Néel relaxation processes are present in this range. At around 260 K the liquid begins to thaw, allowing free rotation of the NPs. Simultaneously, the χ′′ peak increases abruptly in a frequency-dependent manner, which can be attributed to Brownian relaxation.
SAR measurements
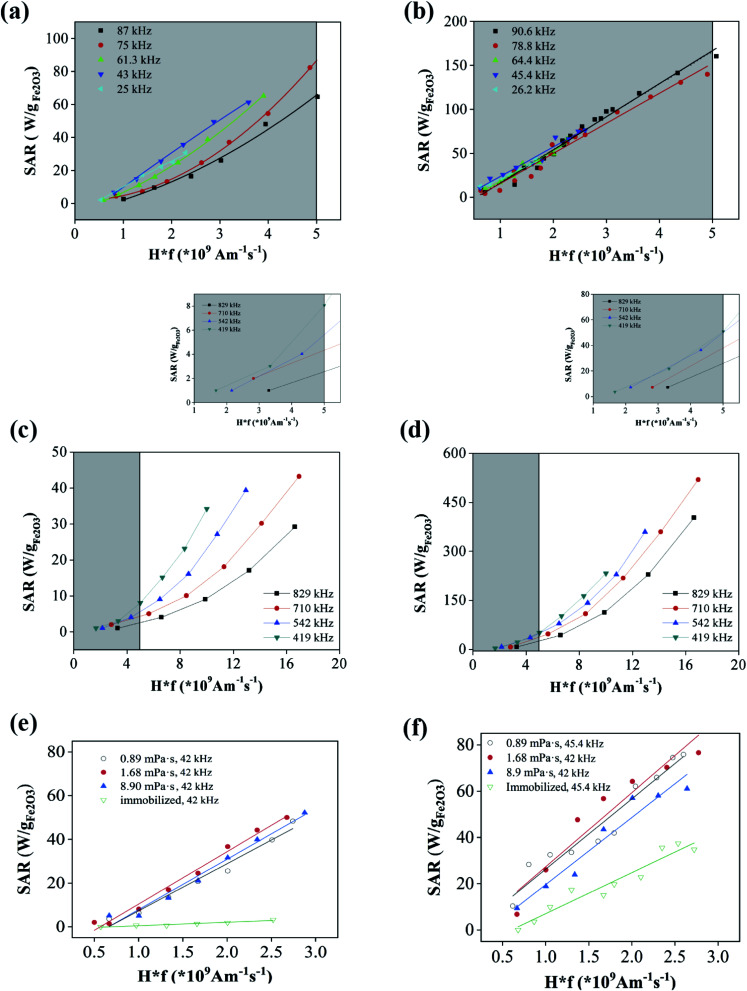
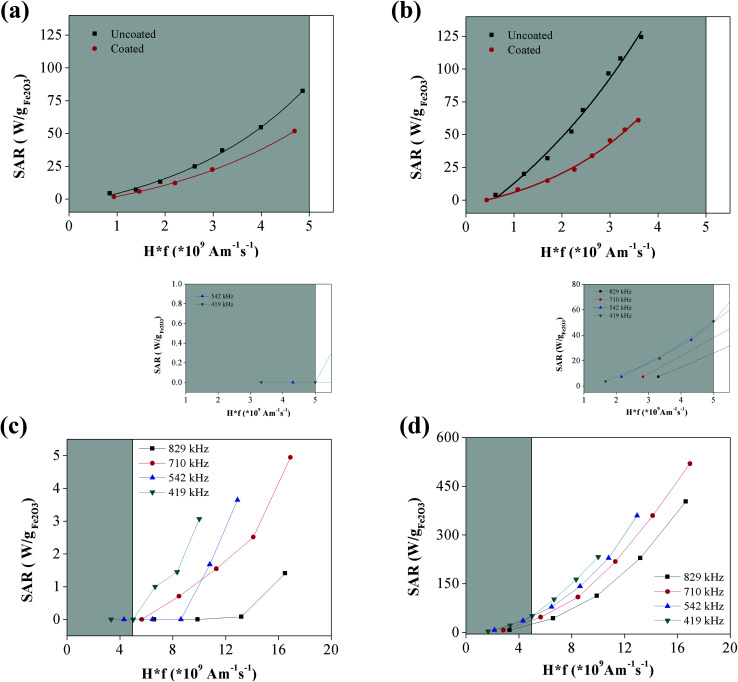
The SAR values of the ε-Fe2O3 and γ-Fe2O3 NPs were measured in a wide range of field frequencies using two different sets of equipment. Fig. 4(a) and (b) show the variation of SAR value with the safety parameter (Hf) for the ε-Fe2O3 and γ-Fe2O3 NPs, respectively. Whereas for γ-Fe2O3 NPs all of the SAR values fit to a single straight line; those of ε-Fe2O3 NPs were higher at frequencies from 25–61 kHz, being optimal at 45 kHz. It is evident that the heating power is very low at the safety limits proposed for wide coils (i.e., Hf = 5 × 10⁸ Am−1 s−1)12 for both types of NPs herein. Extrapolating to the limit proposed for small coils (i.e., Hf = 5 × 10⁹ Am−1 s−1)13 the SAR of ε-Fe2O3 NPs was 80 W g−1 Fe2O3 (at 75 kHz), and therefore inferior to the value obtained for γ-Fe2O3 NPs (160 W g−1 Fe2O3). In the high-frequency regime the different magnetic characters of the two types of NPs were evident (Fig. 4(c) and (d)). Within the safety limit, the performance of both types of NPs diminished with respect to that observed in the low-frequency regime. However, the diminished performance was especially acute for ε-Fe2O3 NPs, whose SAR values dropped one order of magnitude. This performance disparity caused the difference in SAR value between the two phases to be about 15-fold. Conversely, although the highest absolute value of SAR in both cases was obtained at f = 710 kHz, the best performance in terms of the safety parameter was obtained at the lowest frequency (419 kHz). It should be noted that most of the experimental points in the high-frequency region lay outside the health safety limit adopted in this report (i.e., Hf = 5 × 10⁹ Am−1 s−1). An interesting fact derived from these experiments is that, in the case of a suspension containing a mixture of ε-Fe2O3 and γ-Fe2O3 NPs, a change from low to high frequency could switch off the heating via the ε-Fe2O3 NPs while increasing that of the γ-Fe2O3 NPs. Such a switchable system could be useful, for instance, in catalytic cascade reactions.
Fig. 4. SAR values in the low frequency range of aqueous suspension of (a) ε-Fe2O3 NPs and (b) γ-Fe2O3 NPs in as a function of health parameter Hf. SAR values in the high frequency range of aqueous suspensions of (c) ε-Fe2O3 NPs and (d) γ-Fe2O3 NPs. In the insets, details of the SAR in the health safety range of Hf. Shaded areas mark the health safety region in a–d. SAR vs. Hf at different NP mobility conditions of (e) ε-Fe2O3 NPs and (f) γ-Fe2O3 NPs.
Fig. 4(e) and (f) show the variation of SAR with the field amplitude, H, at a fixed f, at different mobility conditions for the ε-Fe2O3 and γ-Fe2O3 NPs, respectively. During complete immobilization of the NPs, the SAR value of ε-Fe2O3 NPs falls to 0 in the entire range of field amplitudes (Fig. 4(e)), indicating no heating whatsoever by Brownian relaxation. This should be expected from the high coercivity of these NPs (Fig. 3 and Table 1) that results in a very high degree of thermally-blocked MNPs. In fact, the characteristic Néel relaxation time for 20 nm-diameter ε-Fe2O3 NPs with an anisotropy constant K = 105–106 J m−3 would be around 1000 years (using τ0 = 10−10 s).18,20 Nevertheless, in media with a viscosity in the range of the reported cell cytoplasm values, the SAR values of the ε-Fe2O3 NPs were similar to that in water, indicating that ε-Fe2O3 NPs are fully useful for hyperthermia therapy. NP mobility in the interior of cells can also be restrained by membrane binding or cell-mediated aggregation. However, a dramatic fall of SAR has only been observed in NPs with a DH of several hundreds of nm whereas in our case they are around 30 nm.37,38 On the other hand, it has been reported that pure magnetomechanical forces induced cell apoptosis and tumor reduction,39 and in this case ε-Fe2O3 NPs could kill cancer cells both by heating and mechanical stress. Experiments on life cells are currently in their way in our lab to sort out this matter.
In the case of γ-Fe2O3 NPs, the heating was still appreciable after gelification (Fig. 4(f)), although the SAR values dropped to half those obtained in the liquid state. This indicates, therefore, a contribution from both Néel and Brownian relaxation to the heating via γ-Fe2O3 NPs. In fact, considering K = 104 J m−3 for γ-Fe2O3 (one order of magnitude lower than the K of ε-Fe2O3), NPs with a size of 16 nm would have a Néel relaxation time of 10−7 s, while NPs with a size of 35 nm would have a Néel relaxation time of 1000 s. This is indeed in the range of NP sizes of this sample as measured by TEM. The smaller-sized NPs are therefore expected to have no contribution to heating. At intermediate sizes, heating will arise from the Néel relaxation; while larger NPs may only dissipate heat by Brownian relaxation.
NP polymer coating
To be useful in biological applications, MNPs must be endowed with certain biological functionalities; i.e., stability in biological media, hemocompatibility, long blood circulation times or imaging tags. This is realized herein by covering the NPs with adequate biopolymer coatings, which in turn can affect the hyperthermia performance of the NPs. Consequently, we studied the effect of polymer coating on the magnetic heating properties of both types of NPs. The coating polymer used herein was the P4VP-b-P(MPEGA-co-RhodPEGMA-co-carboxylicPEGMA) copolymer functionalized with a fluorescent tag (Rhodamine), in anticipation of cellular hyperthermia experiments. Moreover, this polymer possesses carboxylate residues at the ends of some of the polyethylene glycol (PEG) side chains that are suitable for conjugation to antibodies with specific binding properties to targeted body tissues (e.g., cancer tumors). Details on the polymer preparation and coating procedures are given in the ESI.† After being coated with the copolymer, both the ε-Fe2O3 and γ-Fe2O3 NPs were very stable in water suspensions at the physiological pH (7.4). It is worth noting that this type of copolymer coating has been developed in our lab for the last two decades, and it provides excellent biodistribution capacity40 and cell compatibility.41–45
As respectively shown in Fig. 5(a) and (b), the polymer coatings reduced the SAR values of the ε-Fe2O3 and γ-Fe2O3 NPs at low frequencies, and especially in the case of γ-Fe2O3 NPs. At high frequencies, however, the SAR values of the ε-Fe2O3 NPs dropped drastically after coating (Fig. 5(c)). Specifically, the SAR was practically 0 within the Hf safety range. Conversely, the SAR values of the coated γ-Fe2O3 NPs showed only a moderate decrease in SAR value (Fig. 5(d)).
Fig. 5. SAR values in the low frequency range of aqueous suspension of (a) ε-Fe2O3 polymer coated NPs and (b) γ-Fe2O3 polymer coated NPs in as a function of health parameter Hf. SAR values in the high frequency range of aqueous suspensions of (c) ε-Fe2O3 polymer coated NPs and (d) γ-Fe2O3 polymer coated NPs. In the insets, details of the SAR in the health safety range of Hf. Shaded areas mark the health safety region in (a–d).
Frequency dependent AC magnetic susceptibility
The power density dissipation assuming linear response theory (i.e., low field amplitudes) is directly related to the out-of-phase susceptibility (i.e., imaginary part), χ′′, by the relation
| SAR(f) = πμ0H20fχ′′(f) | 2 |
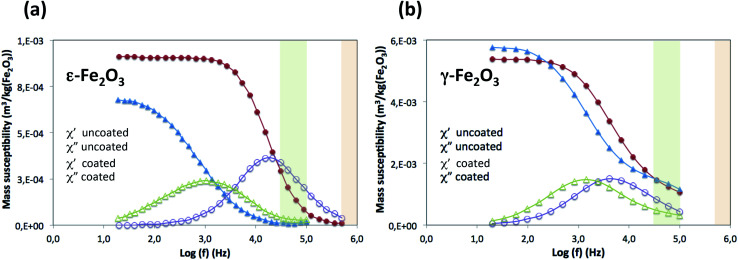
where μ0 is the permeability of free space and H0 is the field amplitude. Thus, we measured the AC susceptibility (ACS; low field amplitude) of ε-Fe2O3 NPs and γ-Fe2O3 (uncoated and coated) MNPs as a function of the frequency in a range from 10 Hz to 500 kHz (Fig. 6). The χ′′ vs. log(f) curves for the uncoated ε-Fe2O3 NPs exhibited a maximum in χ′′ at 15.8 kHz (i.e., Brownian relaxation frequency). In the case of uncoated γ-Fe2O3 NPs, the χ′′ maximum appeared at about 8 kHz. Obviously, the power density will diminish when shifting the frequency up from this maximum, but an increase in the number of field loop cycles (frequency) may compensate for that loss. Thus, the optimal frequency for heating may deviate from this maximum and the heating power will be favored by the frequency. The absolute values of ACS (both the in-phase and out-of-phase components) were larger for the γ-Fe2O3 MNPs than the ε-Fe2O3 MNPs. Because the particle sizes were almost identical for both samples, the difference in ACS value is likely owing to differences in the intrinsic saturation magnetization between the two samples. The different values of the out-of-phase component will affect the heating properties. All samples exhibited Brownian relaxation as determined by low-field ACS analysis.
Fig. 6. Variation of the in-phase (χ′) and out-of-phase (χ′′) magnetic AC susceptibilities with the frequency of the alternating magnetic field of aqueous suspensions of a coated and uncoated ε-Fe2O3 NPs, and b coated and uncoated γ-Fe2O3 NPs. Low and high frequency ranges used in SAR experiments are shaded green and orange, respectively. The ac susceptibility is normalized to total mass of iron(iii) oxide (to give the mass susceptibility).
The shift of the χ′′ peak in the polymer-coated sample with respect to the uncoated one was remarkable in ε-Fe2O3 NPs (from 15.8 to 1.0 kHz). The consequence is a decrease of the SAR value in the coated sample compared with the uncoated one, as observed in Fig. 5, which is particularly noticeable at high frequencies. However, at the lowest experimental frequencies the ACS of the coated sample is maximal while that of the uncoated sample is very low, and then the situation may be reversed. Thus, we could expect an enhancement of hyperthermia performance for coated ε-Fe2O3 samples at frequencies well below the range used in SAR experiments. This large shift in frequency after coating was not observed in the γ-Fe2O3 NPs.
From eqn (2) it is possible to estimate SAR from the imaginary part of the AC susceptibility at a given frequency, if the imaginary part of the dynamic magnetization is linear to the applied AC field (i.e. low field amplitudes). The low field range also implies that SAR will almost vary with a quadratic Hf behaviour at a constant frequency when assuming small field dependence in the imaginary part of the AC susceptibility. From the SAR results shown in Fig. 4(c) and (d) we have low field amplitudes and the almost quadratic behaviour can be seen, and therefore we can apply eqn (2). If we take the uncoated ε-Fe2O3 and γ-Fe2O3 particles as an example we get for the cases Hf = 4 × 10⁹ Am−1 s−1 and 12 × 109 Am−1 s−1 at f = 542 kHz (that give fields of 7380 A m−1 and 22 000 A m−1), we obtain SAR = 4 W g−1 and 35 W g−1 for ε-Fe2O3, and 35 W g−1 and 315 W g−1 for γ-Fe2O3 as estimated from the ACS response. The corresponding measured SAR values given in Fig. 4(c) and (d) (for Hf = 4 × 10⁹ Am−1 s−1 and 12 × 109 Am−1 s−1 at f = 542 kHz) is 4 W g−1 and 33 W g−1 for ε-Fe2O3 and 30 W g−1 and 300 W g−1 for γ-Fe2O3, which is quite in accordance with the SAR estimations from the ACS results.
Cell experiments
Annexin-V cytotoxicity assays on ε-Fe2O3 and γ-Fe2O3 NPs coated with the rhodamine functionalized copolymer revealed that none of the NPs had an appreciable effect on the viability of MDA-MB468 cells in the entire range of concentrations used in the incubation stage (0.1 to 1 mg ml−1) (Fig. 7(a)). The measurements were single-point, and therefore the differences between the control and NP seeded samples have no statistical significance. As shown in Fig. 7(b) and (c), MDA-MB-468 cells present high rhodamine fluorescence intensity, indicating a high internalization rate for the ε-Fe2O3 and γ-Fe2O3 NPs, respectively. As observed in Fig. 7(c), cells treated with the γ-Fe2O3 complex exhibited higher fluorescence intensity than those treated with the ε-Fe2O3 complex. Specifically, the Rhodamine median fluorescence intensity of γ-Fe2O3 was 1.43-, 1.29-, 1.55- and 1.65-fold higher than that of ε-Fe2O3 for 0.1, 0.2, 0.5 and 1 mg ml−1 concentrations, respectively), indicating greater incorporation of the γ-Fe2O3 complex.
Fig. 7. (a) Annexin-V cell viability plot of MDA-MB468 cells by flow cytometry. Cells were treated with either γ-Fe2O3 or ε-Fe2O3 NPs. (b) Fluorescence intensity of ε-Fe2O3 and (c) γ-Fe2O3 NPs coated with a rhodamine copolymer at the indicated concentrations, determined by flow cytometry. (d) Growth inhibition of MDA-MB468 cells measured by MTT reduction assays after 24 hours of culture in the presence of the indicated concentrations of both types of NPs. Data are expressed as mean ± S.D of the mean (n ≥ 3).
Although ferrofluids do not seem to induce apoptosis in cells, MTT reduction assay analysis of cell growth inhibition via NPs indicated a similar reduction in the growth rate of cells treated with both complexes (Fig. 7(d)). Further, the cell growth rate reduction was concentration-dependent and reached values of around 40% at 0.5 and 1.0 mg ml−1 concentration.
Brownian versus Néel heating
It is clear herein that MNPs with a high coercivity such as ε-Fe2O3 NPs can only heat by the Brownian mechanism. It is also clear that the Brownian and Néel mechanisms operate in different frequency ranges. While the Brownian mechanism operates below 100 kHz, the Néel mechanism is mostly effective above 400 kHz. Consequently, ε-Fe2O3 NPs can be efficient in magnetic hyperthermia only at low frequencies. However, Brownian NPs can be advantageous when the pursued effect is a mechanical one instead of heating. Indeed, it has been suggested in the literature that cell death might also be caused by mechanical effects.46–50 Moreover, there is increasing interest in using magnetic forces to activate transport through cell membranes.51,52 Moreover the strong dependence of magnetic heating on particle mobility can be used as an advantage to heat selectively tumors with a soft texture in a hard healthy tissue environment.
It was observed that the working frequency range is shifted downwards after coating the NPs owing to their increased size. However, the large frequencies shift of the χ′′ peak of ε-Fe2O3 NPs after coating cannot be fully ascribed to the size increase because the size change is relatively small. Another determinant, at least in part, is the strong interactions of the PEG chains with water molecules and the flexibility of these chains. Owing to the frequent use of a PEG coating of NPs for in vivo applications, this subject deserves a deeper insight.
The distinct behavior of Brownian and Néel NPs can be usefully applied toward switchable NP heating systems. For instance, consider a mixture of ε-Fe2O3 and γ-Fe2O3 NPs hosting different substances (i.e., two different catalysts) activated at a distance by the heat generated in the NPs. One could switch-off the activity of the substance hosted by the ε-Fe2O3 NPs while simultaneously increasing the activity of the substance hosted by the γ-Fe2O3 NPs by turning the field from the low-frequency range to the high-frequency range. This is probably the most important outcome of this report, as it opens a new tool in magnetic nano-heating that broadens the scope of applications for these systems.
Conclusions
The utility of ε-Fe2O3 NPs in magnetic hyperthermia has been evaluated in comparison with γ-Fe2O3 NPs of the same particle size. In accordance with their different magnetic natures, these two NP types exhibited very different responses to field parameters in magnetic hyperthermia applications. While γ-Fe2O3 NPs possessing a small coercivity achieved a higher heating power at high frequencies (i.e., 400–800 kHz), ε-Fe2O3 NPs possessing a very large coercivity exhibited a poor heating performance in this frequency range and only operated at low frequencies (i.e., 20–100 kHz). While in γ-Fe2O3 NPs possessing a small coercivity the magnetic moment follows the external ac field by rotating internally across magnetocrystalline energy barriers, in ε-Fe2O3 NPs possessing a very large coercivity the magnetic moment follows the external ac field by the mechanical rotation of the NPs. As a consequence, γ-Fe2O3 NPs achieved a higher heating power at high frequencies (i.e., 400–800 kHz), whereas ε-Fe2O3 NPs exhibited a poor heating performance in this frequency range and only operated at low frequencies (i.e., 20–100 kHz), at which they relax with the Brownian characteristic time. This difference in behavior opens the possibility of switching the heating from one NP type to the other when both are used simultaneously as heating sources by a simple change of the field frequency.
Author contributions
A. Mi., S. O. and Y. C. conceived and planned the experiments, M. Y., A. N., D. B. and R. P. prepared the samples, M. Y., A. N., S. O., A. Mi., Y. G. and R. P. performed the structural characterization, C. J., F. A., N. J. O. S and Y. G. performed the magnetic measurements, Y. G., A. Ma. and P. T. carried out the SAR measurements, J. M, R. M. and P. F. carried out the cell experiments, A. Mi. and Y. G. wrote the manuscript with input from all authors, A. Mi., Y. G., C. J., N. J. O. S. and D. B. contributed to the interpretation of the results. All authors provided critical feedback and helped shape the final manuscript.
Conflicts of interest
There are no conflicts to declare.
Supplementary Material
Acknowledgments
This work was supported by European Union's Horizon 2020 FET Open program [Grants no: 801305 and 829162] Spanish Ministry of Science Innovation and Universities [Grant no: PGC2018_095795_B_I00] and Diputación General de Aragón [E11/17R]. Authors would like to acknowledge the use of Servicio General de Apoyo a la Investigación-SAI, Universidad de Zaragoza. This work was developed within the scope of the projects CoolPoint P2020-PTDC-CTMNAN-4511-2014 and CICECO-Aveiro Institute of Materials, UIDB/50011/2020 & UIDP/50011/2020, financed by national funds through the FCT/MEC and co-financed by FEDER under the PT2020 Partnership Agreement.We acknowledge support of the publication fee by the CSIC Open Access Publication Support Initiative through its Unit of Information Resources for Research (URICI). We thank Sara Maccagnano-Zacher, PhD, from Edanz Group (www.edanzediting.com/ac) for editing a draft of this manuscript.
Electronic supplementary information (ESI) available. See DOI: 10.1039/d0ra04361c
References
- Millán A., Palacio F., Snoeck E., Serin V. and Lecante P., Magnetic Polymer Nanocomposites, in Polymer Nanocomposites, ed. Y.-W. Mai and Z.-Z. Yu, Woodhead Publishing Ltd, Cambridge, 2006, (CRC, Boca Ratón, 2006) [Google Scholar]
- Pankhurst Q. A. Connolly J. Jones S. K. Dobson J. Applications of magnetic nanoparticles in biomedicine. J. Phys. D: Appl. Phys. 2003;36:167–181. doi: 10.1088/0022-3727/36/13/201. [DOI] [Google Scholar]
- Gilchrist R. K. et al., Selective inductive heating of lymph nodes. Ann. Surg. 1957;146:596–606. doi: 10.1097/00000658-195710000-00007. [DOI] [PMC free article] [PubMed] [Google Scholar]
- Thiesen B. Jordan A. Clinical applications of magnetic nanoparticles for Hyperthermia. Int. J. Hyperthermia. 2008;24:467–474. doi: 10.1080/02656730802104757. [DOI] [PubMed] [Google Scholar]
- Chiu-Lam A. Rinaldi C. Nanoscale Thermal Phenomena in the Vicinity of Magnetic Nanoparticles in Alternating Magnetic Fields. Adv. Funct. Mater. 2016;26:3933–3941. doi: 10.1002/adfm.201505256. [DOI] [PMC free article] [PubMed] [Google Scholar]
- Chang D. et al., Biologically Targeted Magnetic Hyperthermia: Potential and Limitations. Front. Pharmacol. 2018;9:831. doi: 10.3389/fphar.2018.00831. [DOI] [PMC free article] [PubMed] [Google Scholar]
- Cortie M. B. Cortie D. L. Timchenko V. Heat transfer from nanoparticles for targeted destruction of infectious organisms. Int. J. Hyperthermia. 2018;34:157–167. doi: 10.1080/02656736.2017.1410236. [DOI] [PubMed] [Google Scholar]
- Dutz S. Hergt R. Magnetic nanoparticle heating and heat transfer on a microscale: Basic principles, realities and physical limitations of hyperthermia for tumour therapy. Int. J. Hyperthermia. 2013;29:790–800. doi: 10.3109/02656736.2013.822993. [DOI] [PubMed] [Google Scholar]
- Kita E. et al., Ferromagnetic nanoparticles for magnetic hyperthermia and thermoablation therapy. J. Phys. D: Appl. Phys. 2010;43:474011. doi: 10.1088/0022-3727/43/47/474011. [DOI] [Google Scholar]
- Gavrilov-Isaac V. et al., Synthesis of Trimagnetic Multishell MnFe2O4@CoFe2O4@NiFe2O4 Nanoparticles. Small. 2015;11:2614–2618. doi: 10.1002/smll.201402845. [DOI] [PubMed] [Google Scholar]
- Cortie M. B. Cortie D. L. Timchenko V. Heat transfer from nanoparticles for targeted destruction of infectious organisms. Int. J. Hyperthermia. 2018;34:157–167. doi: 10.1080/02656736.2017.1410236. [DOI] [PubMed] [Google Scholar]
- Atkinson W. J. Brezovich I. A. Chakraborty D. P. Usable Frequencies in Hyperthermia with Thermal Seeds. IEEE Trans. Biomed. Eng. 1984;31:70–75. doi: 10.1109/TBME.1984.325372. [DOI] [PubMed] [Google Scholar]
- Hergt R. Dutz S. Magnetic particle hyperthermia-biophysical limitations of a visionary tumour therapy. J. Magn. Magn. Mater. 2007;311:187–192. doi: 10.1016/j.jmmm.2006.10.1156. [DOI] [Google Scholar]
- Bonvin D. et al., Controlling structural and magnetic properties of IONPs by aqueous synthesis for improved Hyperthermia. RSC Adv. 2017;7:13159–13170. doi: 10.1039/C7RA00687J. [DOI] [Google Scholar]
- Tong S. Quinto C. A. Zhang L. Mohindra P. Bao G. Size-Dependent Heating of Magnetic Iron Oxide Nanoparticles. ACS Nano. 2017;11:6808–6816. doi: 10.1021/acsnano.7b01762. [DOI] [PubMed] [Google Scholar]
- Dutz S. et al., Ferrofluids of magnetic multicore nanoparticles for biomedical applications. J. Magn. Magn. Mater. 2009;321:1501–1504. doi: 10.1016/j.jmmm.2009.02.073. [DOI] [Google Scholar]
- Forestier H. Guiot-Guillain G. C. Une nouvelle variété ferromagnétique de sesquioxyde de fer. C. R. Acad. Sci. 1934;199:720. [Google Scholar]
- Jin J. Ohkoshi S. Hashimoto K. Giant coercive field of nanometer-sized iron oxide. Adv. Mater. 2004;16:48–51. doi: 10.1002/adma.200305297. [DOI] [Google Scholar]
- Ohkoshi S. Tokoro H. Hard Magnetic Ferrite: ε-Fe2O3. Bull. Chem. Soc. Jpn. 2013;86:897–907. doi: 10.1246/bcsj.20130120. [DOI] [Google Scholar]
- Ohkoshi S. et al., Nanometer-size hard magnetic ferrite exhibiting high optical-transparency and nonlinear optical-magnetoelectric effect. Sci. Rep. 2015;5:14414. doi: 10.1038/srep14414. [DOI] [PMC free article] [PubMed] [Google Scholar]
- Ohkoshi S. et al., Large coercive field of 45 kOe on oriented magnetic film composed of metal-substituted ε-iron oxide. J. Am. Chem. Soc. 2017;139:13268. doi: 10.1021/jacs.7b07087. [DOI] [PubMed] [Google Scholar]
- Ohkoshi S. et al., Visible-light and THz-light induced Faraday effect on ε-iron oxide film. J. Am. Chem. Soc. 2019;141:1775. doi: 10.1021/jacs.8b12910. [DOI] [PubMed] [Google Scholar]
- Tucek J. Zboril R. Namai A. Ohkoshi S. ε-Fe2O3: An Advanced Nanomaterial Exhibiting Giant Coercive Field, Millimeter-Wave Ferromagnetic Resonance, and Magnetoelectric Coupling. Chem. Mater. 2010;22:6483–6505. doi: 10.1021/cm101967h. [DOI] [Google Scholar]
- Néel L. Théorie du traînage magnétique des substances massives dans le domaine de Rayleigh. J. Phys. Radium. 1950;11:49–61. doi: 10.1051/jphysrad:0195000110204900. [DOI] [Google Scholar]
- Brown W. F. Thermal fluctuations of a single-domain particle. Phys. Rev. 1963;130:1677–1686. doi: 10.1103/PhysRev.130.1677. [DOI] [Google Scholar]
- Piñol R. et al., Joining Time-Resolved Thermometry and Magnetic-Induced Heating in a Single Nanoparticle Unveils Intriguing Thermal Properties. ACS Nano. 2015;9:3134–3142. doi: 10.1021/acsnano.5b00059. [DOI] [PubMed] [Google Scholar]
- Bonvin D. Hofmann H. Ebersold M. M. Optimisation of aqueous synthesis of iron oxide nanoparticles for biomedical applications. J. Nanopart. Res. 2016;18:376. doi: 10.1007/s11051-016-3695-4. [DOI] [Google Scholar]
- Fushimi K. Verkman A. S. Low Viscosity in the Aqueous Domain of Cell Cytoplasm Measured by Picosecond Polarization Microfluofimetry. J. Cell Biol. 1991;112:719–725. doi: 10.1083/jcb.112.4.719. [DOI] [PMC free article] [PubMed] [Google Scholar]
- Kao H. P. Abney J. R. Verkman A. S. Determinants of the Translational Mobility of a Small Solute in Cell Cytoplasm. J. Cell Biol. 1993;120:175–184. doi: 10.1083/jcb.120.1.175. [DOI] [PMC free article] [PubMed] [Google Scholar]
- Chang H. C. Lin Y. C. Kuo C. T. A two-dimensional diffusion model quantifying intracellular transport with independent factors accounting for cytosol viscosity, binding, and steric hindrance. Biochem. Eng. J. 2008;41:217–227. doi: 10.1016/j.bej.2008.04.021. [DOI] [Google Scholar]
- Bicknese S. Periasamy N. Shohet S. B. Verkman A. S. Cytoplasmic viscosity near the cell plasma membrane: measurement by evanescent field frequency-domain microfluorimetry. Biophys. J. 1993;165:1272–1282. doi: 10.1016/S0006-3495(93)81179-2. [DOI] [PMC free article] [PubMed] [Google Scholar]
- Luby-Phelps K. Mujundar S. Mujundar R. Ernst L. Galbraith W. Waggoner A. A novel fluorescence ratiometric method confirms the low solvent viscosity of the cytoplasm. Biophys. J. 1993;65:236–242. doi: 10.1016/S0006-3495(93)81075-0. [DOI] [PMC free article] [PubMed] [Google Scholar]
- Swaminathan R. Bicknese S. Periasamy N. Verkman A. S. Cytoplasmic Viscosity Near the Cell Plasma Membrane: Translational Diffusion of a Small Fluorescent Solute Measured by Total Internal Reflection-Fluorescence Photobleaching Recovery. Biophys. J. 1996;71:1140–1151. doi: 10.1016/S0006-3495(96)79316-5. [DOI] [PMC free article] [PubMed] [Google Scholar]
- Gonzalez-Tello P. Camacho F. Blazquez G. Density and viscosity of concentrated aqueous solutions of polyethylene glycol. J. Chem. Eng. Data. 1994;39:611–614. doi: 10.1021/je00015a050. [DOI] [Google Scholar]
- Syal V. K. Chauhan A. Chauhan S. Ultrasonic velocity, viscosity and density studies of poly (ethylene glycols)(PEG-8.000, PEG-20.000) in acetonitrile (AN) and water (H2O) mixtures at 25 °C. Indian J. Pure Appl. Phys. 2005;27:61–69. [Google Scholar]
- Mosmann T. Rapid colorimetric assay for cellular growth and survival: application to proliferation and cytotoxicity assays. J. Immunol. Methods. 1983;65:55–63. doi: 10.1016/0022-1759(83)90303-4. [DOI] [PubMed] [Google Scholar]
- Etheridge M. L. Hurley K. R. Zhang J. Jeon S. Ring H. L. Hogan C. Haynes C. L. Garwood M. Bischof J. C. Accounting for biological aggregation in heating and imaging of magnetic nanoparticles. Technology. 2014;2:214–228. doi: 10.1142/S2339547814500198. [DOI] [PMC free article] [PubMed] [Google Scholar]
- Dutz S. Kettering M. Hilger I. Müller R. Zeisberger M. Magnetic multicore nanoparticles for hyperthermia-influence of particle immobilization in tumour tissue on magnetic properties. Nanotechnology. 2011;22:265102. doi: 10.1088/0957-4484/22/26/265102. [DOI] [PubMed] [Google Scholar]
- Chen M. et al., Remote Control of Mechanical Forces via Mitochondrial-Targeted Magnetic Nanospinners for Efficient Cancer Treatment. Small. 2020;16:1905424. doi: 10.1002/smll.201905424. [DOI] [PubMed] [Google Scholar]
- Gómez-Vallejo V. et al., PEG-Copolymer-coated Iron Oxide Nanoparticles that Avoid the Reticuloendothelial System and Act as Kidney MRI Contrast Agents. Nanoscale. 2018;10:14153–14164. doi: 10.1039/C8NR03084G. [DOI] [PubMed] [Google Scholar]
- Ali L. M. A. et al., F. Hemostasis disorders caused by polymer coated iron oxide nanoparticles. J. Biomed. Nanotechnol. 2013;9:1272. doi: 10.1166/jbn.2013.1637. [DOI] [PubMed] [Google Scholar]
- Ali L. M. A. et al., Cell compatibility of a maghemite/polymer biomedical nanoplatform. Toxicol. In Vitro. 2015;29:962. doi: 10.1016/j.tiv.2015.04.003. [DOI] [PubMed] [Google Scholar]
- Amiri H. et al., Multifunctional Polymer-based Nanostructured Bio-ferrofluids as MRI Contrast Agents. Magn. Reson. Med. 2011;66:1715. doi: 10.1002/mrm.22959. [DOI] [PubMed] [Google Scholar]
- Bustamante R. et al., Influence of structural and magnetic properties in the heating performance of multicore bioferrofluids. Phys. Rev. B. 2013;88:184406. doi: 10.1103/PhysRevB.88.184406. [DOI] [Google Scholar]
- Díez P. et al., Functional Insights into the Cellular Response Triggered by Bile-Acid Platinum Compound Conjugated to Biocompatible Ferric Nanoparticles Using Quantitative Proteomic Approaches. Nanoscale. 2017;9:9960–9972. doi: 10.1039/C7NR02196H. [DOI] [PubMed] [Google Scholar]
- Mansell R. et al., Magnetic particles with perpendicular anisotropy for mechanical cancer cell destruction. Sci. Rep. 2017;7:4257. doi: 10.1038/s41598-017-04154-1. [DOI] [PMC free article] [PubMed] [Google Scholar]
- Zhang E. M. Dynamic Magnetic Fields Remote-Control Apoptosis via Nanoparticle Rotation. ACS Nano. 2014;8:3192–3201. doi: 10.1021/nn406302j. [DOI] [PMC free article] [PubMed] [Google Scholar]
- Cho M. H. et al., A magnetic switch for the control of cell death signalling in in vitro and in vivo systems. Nat. Mater. 2012;11:1038–1043. doi: 10.1038/nmat3430. [DOI] [PubMed] [Google Scholar]
- Leulmi S. et al., Triggering the apoptosis of targeted human renal cancer cells by the vibration of anisotropic magnetic particles attached to the cell membrane. Nanoscale. 2015;7:15904. doi: 10.1039/C5NR03518J. [DOI] [PubMed] [Google Scholar]
- Kim D. H. et al., Biofunctionalized magnetic-vortex microdiscs for targeted cancer-cell destruction. Nat. Mater. 2010;9:165–171. doi: 10.1038/nmat2591. [DOI] [PMC free article] [PubMed] [Google Scholar]
- Cheng D. Li X. Zhang G. Shi H. Morphological effect of oscillating magnetic nanoparticles in killing tumor cells. Nanoscale Res. Lett. 2014;9:195. doi: 10.1186/1556-276X-9-195. [DOI] [PMC free article] [PubMed] [Google Scholar]
- Domenech M. Marrero-Berrios I. Torres-Lugo M. Rinaldi C. Lysosomal Membrane Permeabilization by Targeted Magnetic Nanoparticles in Alternating Magnetic Fields. ACS Nano. 2013;7:5091–5101. doi: 10.1021/nn4007048. [DOI] [PubMed] [Google Scholar]
Associated Data
This section collects any data citations, data availability statements, or supplementary materials included in this article.


