Abstract
Pyrrole and cobalt nitrate were used as nitrogen and metal sources respectively to synthesize a dinitratobis(polypyrrole)cobalt(ii) (Co(polypyrrole)2(NO3)2) adduct as the precursor of a Co–pyrrole/MPC catalyst. Pyrrole has the capability of polymerization and coordination with Co(ii). Taking this advantage, the Co(polypyrrole)2(NO3)2 coordination can form a long-chain structure with abundant and robust Co–N bonds, contributing to significantly increased catalytic sites in the product catalyst. As a result, the obtained Co–pyrrole/MPC (MPC = macroporous carbon) catalyst exhibited high ORR catalytic activity in alkaline media and excellent performance in direct borohydride fuel cell (DBFC). A peak power density up to 325 mW cm−2 was achieved at ambient condition, outperforming the commercialized Pt/XC-72 benchmark containing 28.6 wt% Pt. The construction of long-chain coordination precursor was verified playing a key role in the electrochemical improvement of Co–pyrrole/MPC catalyst in DBFC.
Co–pyrrole/MPC was synthesized by using pyrrole and cobalt nitrate as nitrogen and metal source, which enabled a higher peak power density than the commercialized 28.6 wt% Pt/XC72 in DBFC.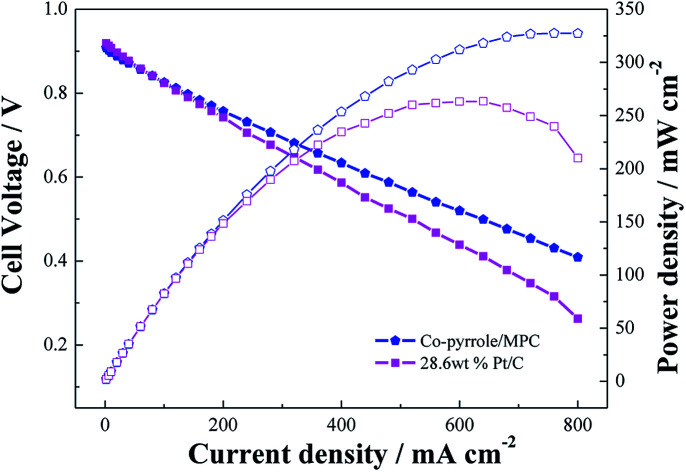
1. Introduction
With intriguing merits such as environmental friendliness and high energy conversion efficiency, fuel cells have attracted wide attention in the development of clean and efficient energy technologies. The performance of a fuel cells highly depends on the cathode catalyst where the oxygen reduction reaction (ORR) occurs. Expensive platinum (Pt) and Pt containing alloys are the best electrocatalysts for ORR,1 however, the scarcity of Pt in nature is seriously impeding the commercialization of Pt-based fuel cells, so discovering ORR catalysts with low cost and high activity is the key solution to cell development. Nowadays, non-Pt catalysts have attracted much attention owing to their great affordability and decent catalytic performance.2 Numerous non-Pt ORR catalysts have been developed, including polyoxometalates,3 metal oxides,4 metal-macrocyclic compound,5–7 metal doped polymers,8,9etc. High performance ORR catalyst requires high catalytic activity, including the intrinsic activity as well as the number of the active sites.10,11 Given this, porous non-Pt catalysts are considered as highly promising alternatives to Pt due to their cost effectiveness and high surface area, which is capable of loading more catalytic sites to compensate the inferiority in intrinsic catalytic activity.12–14
Among the various candidates, M–N/MPC (M = transition metal, N = nitrogenous compound, MPC = microporous carbon) catalysts show a particular potential as high-performance ORR catalysts to replace Pt.15–17 MPC has higher specific surface area and can support more active centers than the common carbon materials. Generally, the M–Nx sites are widely considered as the catalytic centers for ORR.18–21 Pyrrolic N with unpaired electrons provides excellent coordination capability with transition metals to form macrocyclic compounds such as metallo-phthalocyanines and -porphyrins, in which the M–Nx moiety is the active site for ORR.22–24 Metal complexes of N4-macrocycles such as porphyrins have been studied as alternatives to Pt catalyst.25 In view of this, we attempted to synthesize a unique dinitratobis(polypyrrole)cobalt(ii) (Co(polypyrrole)2(NO3)2) coordination by using pyrrole and cobalt nitrate as nitrogen and metal sources, respectively. The coordination was further employed as precursor in rich of M–Nx moieties for the preparation of highly active ORR catalyst. Cobalt nitrate can be easily coordinated with two heterocyclic ligands to form bidentate nitrato-complexes (CoL2(NO3)2).26–28 Co element can improve the chemical and physical properties of the electrocatalyst, including good conductivity, abundant valid active sites and large specific surface.29–31 The good catalytic activity towards ORR benefits from the Co–N bond. Moreover, pyrrole delivers sufficient pyrrolic N for such coordination, while the good polymerizability of pyrrole renders a promising precursor structure towards M–Nx catalyst with sufficient active sites.32–35
Upon the coordination, the limitation of pyrrole solubility in aqueous media was overcome through the use of glucose as a hydrotropic agent benefiting from its hydrolysis that generated hydroxymethylfurfural to enhance the hydrotropic effect on pyrrole dissolution.36 Meanwhile, glucose also acted as the carbon source for the fabrication of porous carbon matrix. Subsequent to the construction of the Co(polypyrrole)2(NO3)2 coordination, ORR catalyst (Co–pyrrole/MPC) was prepared by spray-drying the precursor suspension containing glucose, Co(polypyrrole)2(NO3)2, and nano-CaCO3 as the template, and calcinating under a high-temperature.37–40
The structure of Co(polypyrrole)2(NO3)2 precursor was investigated through a series of material characterizations, while the catalytic performance of the product catalyst (Co–pyrrole/MPC) was evaluated by electrochemical analyses in three-electrode configuration and DBFC.
2. Method and procedures
2.1. Catalyst preparation
Co(polypyrrole)2(NO3)2 precursor was synthesized with a small molar ratio of pyrrole to Co(NO3)2 for utilization of the utmost attachment points in pyrrole. 17.4 g glucose monohydrate and 1.0 mmol of Co(NO3)2·6H2O were dissolved in 50 mL deionized water. The obtained solution was mixed with the emulsion containing 17.4 g nano-CaCO3 in 20 mL deionized water to form a homogeneous suspension. 2.0 mmol of pyrrole was then added to the suspension dropwise in dark. After stirring for 30 minutes, the suspension was subjected to hydrothermal treatment or spray-drying at 160 °C for preparing catalyst precursor (Co(polypyrrole)2(NO3)2). The last step was to carbonize the precursor which was performed via heating at 900 °C in nitrogen atmosphere for 2 hours. After the template was removed by HCl etching, the porous catalyst (Co–pyrrole/MPC) was then obtained by overnight drying in vacuum at 60 °C. The overall strategy for obtaining the catalyst was showed in Fig. 1.
Fig. 1. The scheme of overall strategy for obtaining the catalyst.
2.2. Physical characterization
The structure and morphology of the synthesized samples were characterized by X-ray diffraction (XRD) under the use of Rigaku-D/MAX-2550PC diffractometer with Cu-Kα radiation (λ = 1.5406 Å), scanning electron microscopy (SEM, Zeiss Corp.) operated at 5 kV, and transmission electron microscope (TEM, Hitachi H-9500) operated at 300 kV. The polymerization of Co-coordinated pyrrole was studied by Fourier Transform Infrared Spectroscopy (FTIR) and Co K-edge X-ray absorption near-edge structure (XANES). The infrared spectra of the synthesized samples in KBr pellets were recorded by Nicolet-IR560 FTIR spectrometer at the spectral resolution of 4 cm−1. XANES measurements were performed on BL15U1 at Shanghai Synchrotron Radiation Facility (SSRF) in China. The XANES data was analysed using a computer program IFEFFIT. Taking tetramethylsilane (TMS) as the internal reference, chemical shifts were displayed in d values (ppm). Based on the results of XANES, electron paramagnetic resonance (EPR), and X-ray photoemission spectroscopy (XPS), the effect of catalytic sites on ORR was discussed in details. The N species and their relative contents of the synthesized catalysts were identified by means of PHI-5000C ESCA system (PerkinElmer) with Mg Kα radiation (hν = 1253.6 eV). All XPS spectra refered to the C 1s level of 284.6 eV to correct the peak shift due to the charge accumulation on the sample. XPS Peak 4.1 software was used to fit and deconvolute the raw data.
2.3. Electrochemical measurements
CHI 1140A electrochemical workstation (CH Instruments) was used to evaluate the electrocatalytic activity of the catalyst in a three-electrode system. The homogenous catalyst ink was formed by mixing 8.0 mg catalyst sample, 0.2 mL Nafion solution (5 wt%) and 3 mL ethanol by ultrasound. The working electrode consisted of 20 μL catalyst ink loaded onto the glassy carbon electrode (3 mm in diameter) and then dried at room temperature. Calomel electrode (SCE) and Pt-wire electrode in saturated KCl solution were used as reference electrode and counter electrode respectively. The cell and reference electrode were connected with a salt bridge. The cyclic voltammograms (CVs) were recorded in O2-saturated solutions at 25 °C and the scanning rate was 10 mV s−1 in alkaline (0.1 M KOH) and acidic (0.5 M H2SO4). According to the pH value of the electrolyte, the potentials were converted to a values vs. reversible hydrogen electrode (RHE).
| E(V vs. RHE) = E(V vs. SCE) + 0.241 + 0.0591 × pH, at 25 °C | 1 |
Linear sweep voltammetry (LSV) analysis was performed by rotating disk electrode (RDE) (RDE-2, BASi Inc.). According to the geometric area of the disk electrode, the electron transfer number of ORR (n) is estimated. The approximate K–L equation is as follows:
| j−1 = jk−1 + {0.62nFAeC0D02/3v−1/6ω1/2}−1 | 2 |
In which j is the disk current, jk is the kinetic current, F is the Faraday constant, ω is the rotation angular frequency and n is the number of electrons transferred per O2 molecule via ORR. Published data of O2 saturated concentration (C0), diffusion coefficients (D0) of O2 in 0.1 M KOH and 0.5 M H2SO4 solution, and kinematic viscosity (v) of 0.1 M KOH and 0.5 M H2SO4 solution were used, F = 96 485 C L−1; D0 = 1.96 × 10⁻⁵ cm2 S−1; C0 = 1.15 × 10⁻³ mol L−1; v = 0.008977 cm2 S−1 (0.1 M KOH), v = 0.01 cm2 S−1 (0.5 M H2SO4).22,24 RDE CVs were also tested at 25 °C and a scan rate of 10 mV s−1. The working electrode of RDE was loaded with 5 μL catalyst ink onto the polished glassy carbon electrode and then dried at room temperature.
The performance of the synthesized catalyst was verified in the alkaline fuel cell compared with that of the commercial Pt/XC-72 catalysts (28.6 wt% Pt/C). A test cell with an active area of 6 cm2 was assembled in a direct borohydride fuel cell (DBFC) to evaluate the performance of the synthesized catalyst. The cathode and anode catalyst inks were prepared by mixing the catalyst powder, Nafion solution (5 wt%), deionized water, and ethanol with a mass ratio of 1 : 7 : 3 : 3. The cathode was made from 3.0 mg cm−2 synthesized catalyst which was coated onto a piece of hydrophobic carbon cloth and then heated at 130 °C for 2 hours, while the anodes were made from 3.0 mg cm−2 commercial Pt/XC-72 catalyst (28.6 wt% Pt) coated onto a piece of Ni foam. Nafion 112 membrane was used as the electrolyte after sequentially boiling in 3 wt% H2O2 solution, deionized water for 30 minutes. The alkaline borohydride solution (5 wt% NaBH4 in 10 wt% NaOH) was used as the fuel to run the cell. The performance of the cell was measured at 25 °C with a fuel flow rate of 15 mL min−1 and a dry O2 flow rate of 150 mL min−1. The cell performance evaluation system and cell figuration were described in a previous publication.33
3. Results and discussion
3.1. Characterizations of Co(polypyrrole)2(NO3)2 precursor
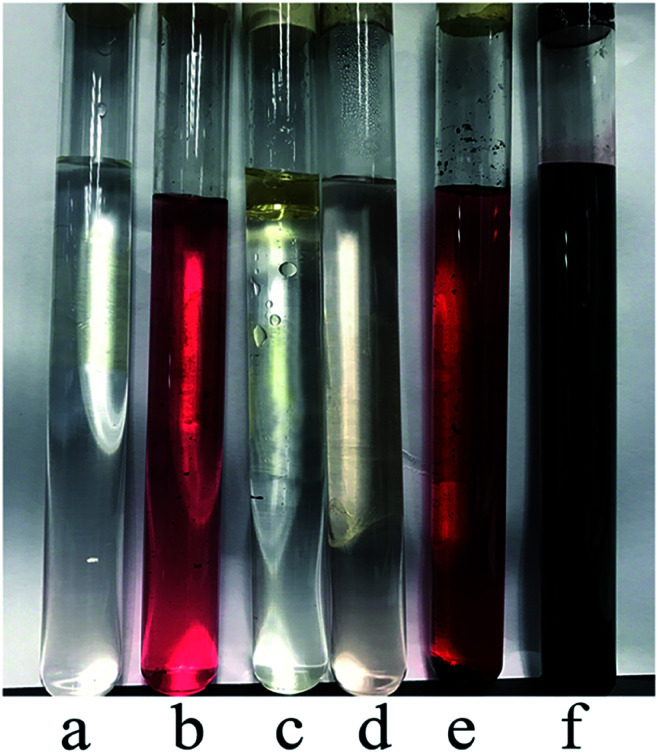
As shown in Fig. 2, it can be observed that glucose and Co(NO3)2 could thoroughly dissolve in water. However, when pyrrole was added into the Co(NO3)2 solution, only few deposits appeared ascribing to the poor solubility of pyrrole. Interestingly, pyrrole could be more easily dissolved in glucose solution, which significantly contributed to the more deposits when pyrrole was added to the Co(NO3)2–glucose solution, confirming the hydrotropic effect that intensified the Co–pyrrole coordination. It revealed that glucose can act as a hydrotropic agent to improve the solubility of pyrrole in aqueous media, so as to enhance the Co coordination with pyrrole.
Fig. 2. (a) Glucose dissolved in water, (b) Co(NO3)2 dissolved in water, (c) pyrrole dissolved in water, (d) pyrrole dissolved in glucose solution, (e) pyrrole added to Co(NO3)2 solution, (f) pyrrole added to Co(NO3)2–glucose solution.
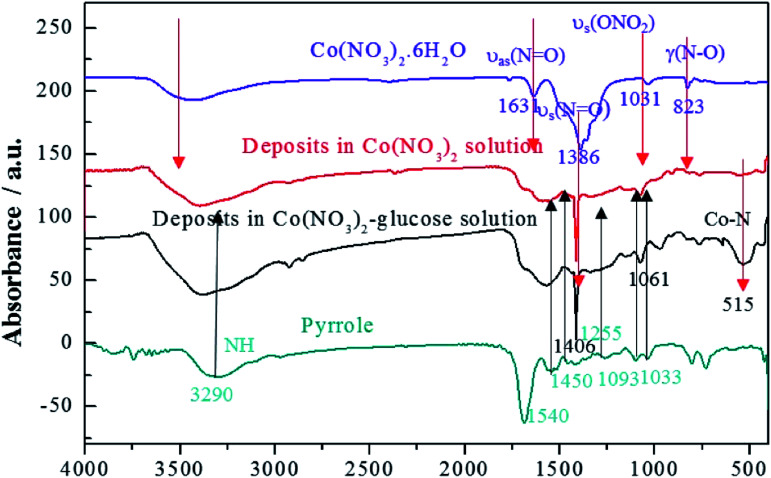
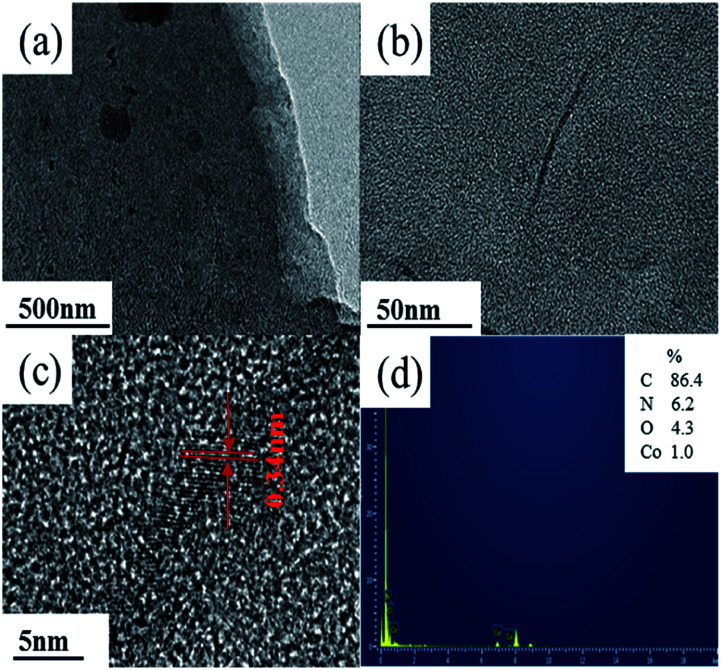
In addition, the FTIR spectra were carried out to indicate the structure of the deposits as shown in Fig. 3. It depicted that cobalt nitrate hexahydrate presented the antisymmetric and symmetric stretching vibrations (υas(N O) and υs(N O)) at 1631 and 1386 cm−1, totally symmetric stretching vibration (υs(ONO2)) at 1031 cm−1, and bending vibration out of plane (γ(N–O)) at 823 cm−1, respectively.41,42 Polypyrrole presented the pyrrole ring fundamental vibration (υs(C–C) and υs(C–N)) at 1540 and 1450 cm−1,43 the C–H in-plane vibration at 1255, 1093, and 1033 cm−1, and the N–H stretching vibration at 3290 cm−1.42 The FTIR results confirmed that the deposits produced in Co(NO3)2 and Co(NO3)2–glucose solution presented very similar IR absorption with well-maintained nitrato ligand peak. Moreover a strong absorption peak appeared at 515 cm−1, which could be assigned to the Co–N bonding, suggesting the formation of Co(polypyrrole)2(NO3)2 in both solutions.43 Furtherly, the TEM images (Fig. 4a) showed that Co(polypyrrole)2(NO3)2 had a microcrystalline structure with obvious lattice fringes under high-resolution TEM observation, which belonged to neither polypyrrole nor cobalt nitrate. Furthermore, the EDS measurement demonstrated the Co(polypyrrole)2(NO3)2 with a Co : N : O atom ratio of 1 : 4 : 6, which differed from that of Co(NO3)2 (1 : 2 : 6) but well matched ratio in form of Co(polypyrrole)2(NO3)2 with a very different morphology from the polypyrrole. So all these results confirmed that the reaction of polypyrrole with cobalt nitrate produced new substance which was supposed to be Co(polypyrrole)2(NO3)2.
Fig. 3. FTIR spectra of Co(NO3)2, pyrrole, Co–pyrrole and Co–pyrrole–glucose in KBr pellets. The Co–pyrrole and Co–pyrrole–glucose represent the deposits in Co(NO3)2 and Co(NO3)2–glucose solution, respectively.
Fig. 4. (a–c) TEM images, (d) EDS spectrum of Co(polypyrrole)2(NO3)2.
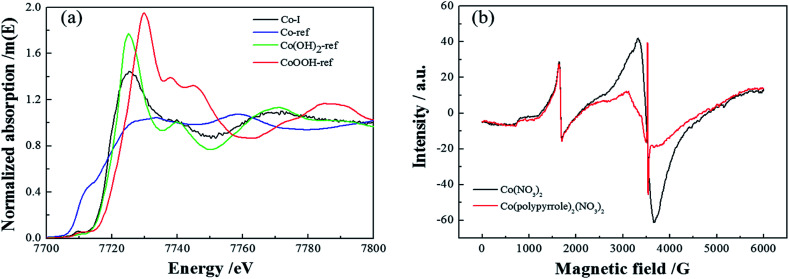
Next, more characterizations were applied to verify the compound. Firstly, Fig. 5a compared the XANES spectra of Co(polypyrrole)2(NO3)2 precursor and three reference samples, Co, Co(OH)2 and CoOOH. The coordination environment of Co in the precursor could be determined by comparing the spectrum of the tested sample with those of the references. It could be perceived that the spectrum of Co(polypyrrole)2(NO3)2 was similar to that of standard sample Co(OH)2, indicating that most of Co in the precursor existed in the form of cobalt divalent. Fig. 5b presented the EPR spectra of cobalt nitrate and the Co(polypyrrole)2(NO3)2 precursor. Strong resonance peaks could be clearly observed for both Co(NO3)2 and Co(polypyrrole)2(NO3)2 with a g value of 2.0108 and 2.0007, respectively, indicating the existence of unpaired electrons and the similar valence state of Co in these compounds.
Fig. 5. (a) XANES spectra of Co(polypyrrole)2(NO3)2 and three reference samples, (b) EPR spectra of Co(NO3)2 and Co(polypyrrole)2(NO3)2.
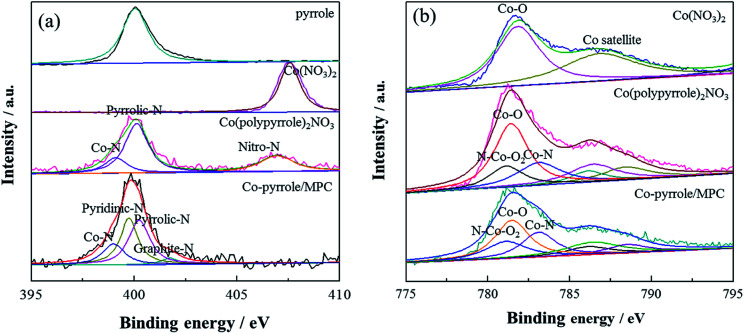
Then, XPS experiment was carried out to further identify the composition of the compound. The N 1s spectrum of Co(polypyrrole)2(NO3)2 confirmed the existence of Co–N (at 398.9 eV) and pyrrolic N (at 400.3 eV) existence44 in addition to –NO2, as shown in Fig. 5a. The pyridinic nitrogen and Co–Nx structure had been extensively considered as catalytic centers, which was expected to boost the according ORR performance. XPS results showed that graphite-N had the weakest electron yield (sp2 hybridization) with a characteristic peak at 401.6 eV. The lone pair electrons of pyrrolic-N participated in the conjugation on the ring, the hydrogen bond increased the electron concentration on the nitrogen, pyrrolic-N had a peak of 400.3 eV. However, the lone pair of pyridinic-N did not participate in the conjugation on the ring, so it had a higher electron concentration than pyrrolic-N, its peak position was lower than pyrrolic-N. The peak position of Co–N was 398.9 eV, which had higher electron concentration than pyridinic-N. As was shown in Fig. 6a that the coordination compound (Co(pyrrole)2(NO3)2) contained two chemical states of nitrogen, i.e., –NO2 with high N 1s binding energy and Co–N with low binding energy. After heat treatment, Co–pyrrole/MPC catalyst was obtained. According to the spectra of Co–pyrrole/MPC, the peak of –NO2 disappeared, and most of the Co–N bonds and residual pyrrolic-N were retained. Quantitative analysis showed that compared with Co(pyrrole)2(NO3)2, the obtained catalyst from heat treatment had more Co–N and pyridinic-N active sites (Table 1), so the Co–pyrrole/MPC catalyst gave great potential to show better catalytic performance for oxygen reduction. In addition, the Co 2p spectrum showed that Co in Co(pyrrole)2(NO3)2 also displayed obvious satellite peaks of cobalt bivalent, indicating that the valence state of cobalt was not changed by coordination and the peaks at 781.3 eV and 783.3 eV corresponding to Co–O bond and Co–N bond respectively. The electron concentration of Co(ii) in N–Co–O2 increased due to the coordination of lone pairs of electrons on pyrrolic-N with – Co–O2, so Co 2p formed the overlapping peaks of N–Co–O2, Co–O and Co–N. The peak area of Co–O was twice as that of Co–N or N–Co–O2, as is shown in Fig. 6b. After heat treatment, the spectra of Co–pyrrole/MPC catalyst showed that the area of Co–O and N–Co–O2 decreased relatively, but the area of Co–N peak increased, which indicated that more Co–N bonds were formed after heat treatment. Therefore, a new compound was produced based on the above results. And according to the XPS, XANES and EPR tests of the precursor, the valence state of cobalt in the precursor was still bivalent. Therefore, we suspected that the structure of the Co(polypyrrole)2(NO3)2 precursor was that cobalt nitrate was connected with nitrogen on two pyrrole rings to form a Co–N2 structure. In an ideal state, pyrrole polymerized while coordinated with cobalt, and finally formed a precursor with double-chain structure.
Fig. 6. (a) N 1s and (b) Co 2p XPS spectra of pyrrole, Co(NO3)2, Co(polypyrrole)2(NO3)2 precursor and Co–pyrrole/MPC catalyst.
Chemical state and percentage content of atomic nitrogen on the surface of Co(polypyrrole)2(NO3)2 precursor, Co–pyrrole/MPC catalyst.
| Samples | Co–N 398.9 eV | Pyridinic-N 399.8 eV | Pyrrolic-N 400.3 eV | Graphite-N 401.6 eV | Nitro-N 406.8 eV | Total nitrogen content |
|---|---|---|---|---|---|---|
| Co(polypyrrole)2(NO3)2 | 16.6 | 0 | 56.6 | 0 | 26.8 | 16.6 |
| Co–pyrrole/MPC | 19.9 | 37.2 | 39.8 | 3.1 | 0 | 1.75 |
3.2. Electrochemical properties of Co–pyrrole/MPC catalyst
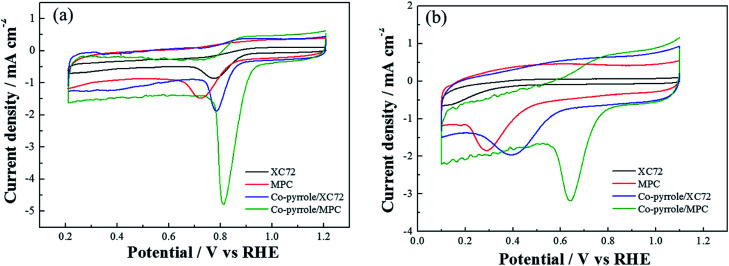
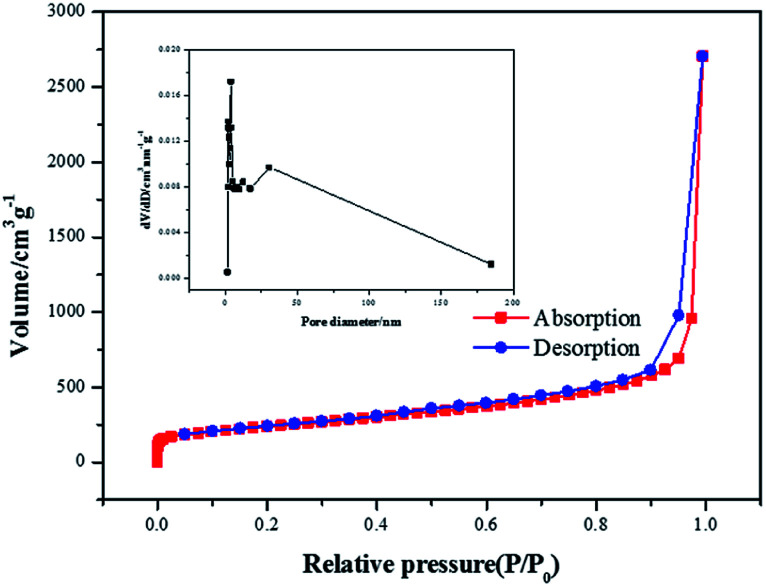
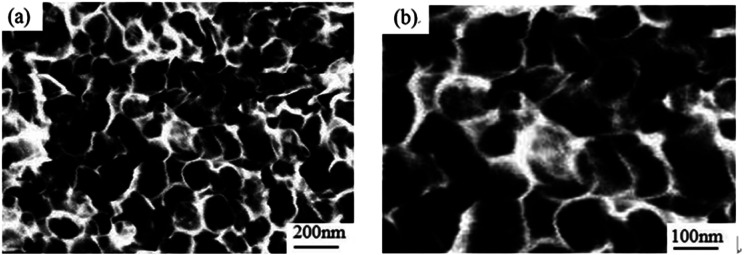
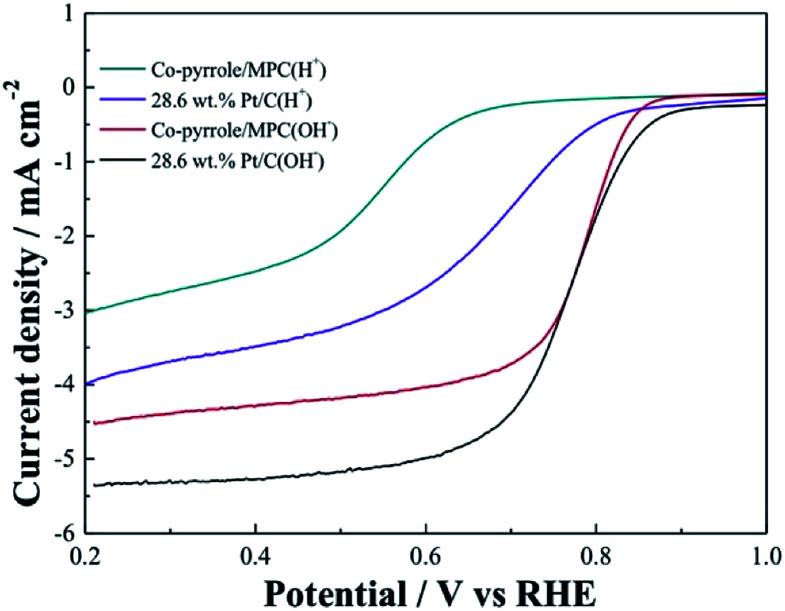
In order to prove the excellent catalytic performance of catalysts for ORR, different electrochemical properties were tested. Fig. 7 showed the CVs of XC72, MPC, Co–pyrrole/XC72 and the synthesized Co–pyrrole/MPC catalyst in both alkaline and acidic O2-saturated solutions. It can be seen from the CV curves that both the initial reduction potential and peak current density of Co–pyrrole/MPC were the highest among the four catalysts. As carbon support, XC72 and MPC both showed low catalytic activity, however, the surface area of MPC could reach to nearly 1000 m2 g−1, meanwhile, that of XC72 was only around 200 m2 g−1,45 so that the MPC catalyst can carry more catalytic sites than XC72, which makes MPC catalysts show higher catalytic activity. The N2 adsorption–desorption isotherm and pore size distribution curve of Co–pyrrole/MPC was showed in Fig. 8, the specific data was listed in Table 2. As the SEM images showed in Fig. 9, Co–pyrrole/MPC contained a large number of pores, which had a larger specific surface area to support more catalytic active centers. In alkaline electrolyte, the initial reduction potential and peak current density of Co–pyrrole/MPC catalyst were 0.9 V and 5 mA cm−2 respectively, while in acidic electrolyte, those were 0.8 V and 3.5 mA cm−2. Compared with other articles, the results showed that Co–pyrrole/MPC had relatively high catalytic activity (Table 3).46 According to the RDE curves (Fig. 10), the initial reduction potential and peak current density of 28.6 wt% Pt/C were both slightly higher than those of Co–pyrrole/MPC in acidic electrolyte. However, in alkaline electrolyte, 28.6 wt% Pt/C and Co–pyrrole/MPC had similar initial reduction potential.
Fig. 7. CVs of MPC, Co–pyrrole/XC72 and Co–pyrrole/MPC in the (a) alkaline (0.1 M KOH), (b) acidic (0.5 M H2SO4) O2-saturated solutions at 25 °C. Scan rate: 10 mV s−1.
Fig. 8. N2 adsorption–desorption isotherm and pore size distribution curve of Co–pyrrole/MPC.
The BET data of Co–pyrrole/MPC.
| Sample | Surface area (m2 g−1) | Pore volume (cm3 g−1) | Pore diameter (nm) |
|---|---|---|---|
| Co–pyrrole/MPC | 833.892 | 6.335 | 30.178 |
Fig. 9. The SEM images of Co–pyrrole/MPC.
The catalytical activity of other catalysts in CV tests46.
| Catalysts | Initial reduction potential (V) | Peak current density (mA cm−2) |
|---|---|---|
| Co/P25/NC | 0.79 | 4.31 |
| 1 wt% Pt/C | 0.75 | 2.71 |
| 20 wt% Pt/C | 0.92 | 2.94 |
Fig. 10. RDE LSVs of Co–pyrrole/MPC and 28.6 wt% Pt/C in the alkaline (0.1 M KOH) and acidic (0.5 M H2SO4) O2-saturated solutions at 25 °C at a rotation rate of 1600 rpm. Scan rate: 10 mV s−1.
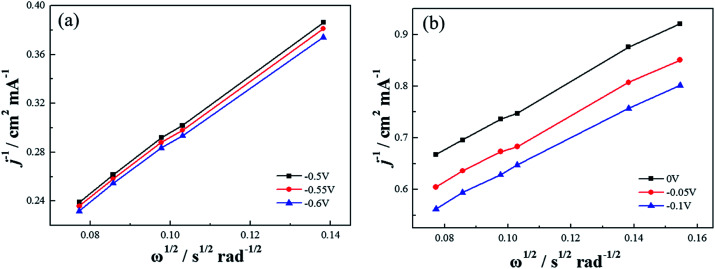
Based on the K–L equation (eqn (2)) and the RDE LSV results at rotation rates of 500, 900, 1000, 1300, 1600 rpm in alkaline electrolytes and 400, 500, 900, 1000, 1300, 1600 rpm in acidic electrolytes (Fig. 11), the calculated n values for Co–pyrrole/MPC were 3.89 and 2.86 respectively, the result in alkaline electrolyte was close to that for Pt/XC-72 (n = 4), revealing that Co–pyrrole/MPC was a high-performance non-Pt catalyst which had a great possibility to replace Pt/C as a cathode catalyst in alkaline electrolyte.
Fig. 11. The K–L plots of Co–pyrrole/MPC in the (a) alkaline (0.1 M KOH), (b) acidic (0.5 M H2SO4) O2-saturated solutions at 25 °C. Scan rate: 10 mV s−1.
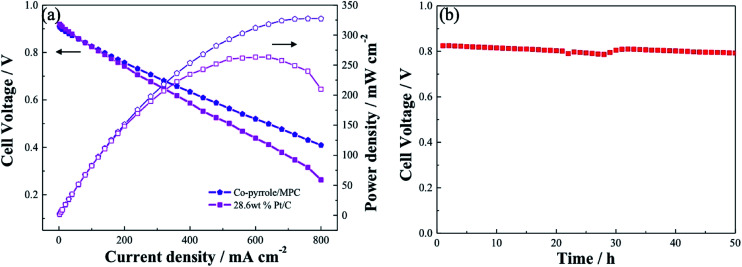
Similar to Pt/C, Co–pyrrole/MPC had higher catalytic activity in alkaline electrolyte than that in acidic electrolyte. The performance of Co–pyrrole/MPC was further verified in an alkaline fuel cell (e.g. DBFC). The electrochemical performance of the DBFC using Co–pyrrole/MPC as the cathode catalyst was shown in Fig. 12a. A peak power density of 325 mW cm−2 was achieved at ambient conditions, which was higher than that with commercial 28.6 wt% Pt/C catalyst (260 mW cm−2). Moreover, Co–pyrrole/MPC demonstrated a good long-term polarization stability in alkaline electrolytes as shown in Fig. 12b.
Fig. 12. (a) Performance comparison of DBFCs using Co–pyrrole/MPC and 28.6 wt% Pt/C as the cathode catalyst at ambient conditions, (b) polarization stability of the Co–pyrrole/MPC in the DBFC. Catalyst loading in cathode and anode: 3 mg cm−2, anode catalyst: 28.6 wt% Pt/C, electrolyte: Nafion 112. Fuel: 5 wt% NaBH4 and 10 wt% NaOH solution at a flow rate of 15 mL min−1. Dry O2 at 150 mL min−1.
As is shown in Table 4, compared with similar materials in the previous articles, Co–pyrrole/MPC catalyst had much higher power intensity.47–50
| O2 + 2H2O + 4e− → 4OH− | 3 |
| O2 + 4H+ + 4e− → 2H2O | 4 |
The electrochemical performance of similar catalysts in the previous articles47–53.
| Cathode | Anode | Temperature (°C) | Power intensity (mW cm−2) |
|---|---|---|---|
| FeS–PPy–BP | 20 wt% Pt/C | 60 | 140.5 |
| Co–IAA/MPC | 20 wt% Pt/C | 25 | 178 |
| Au(Co)/TiO2-NTs | 20 wt% Pt/C | 25 | 217 |
| FeIM/ZIF-8 | 20 wt% Pt/C | 80 | 287 |
| Pt/C | Ni–Pt/C | 55 | 140 |
| CoO nanorods/C | Co(OH)2–PPy/Bp | 30 | 248 |
| CoOOH–PPy/C | Co(OH)2–PPy/Bp | 25 | 101 |
| FeS–PPy/Bp | Pt/C | 60 | 140.5 |
The results showed that the ORR currents and potentials of Co–pyrrole/MPC catalyst in alkaline electrolyte were higher than those in acidic electrolyte. The total reaction formulas of ORR in alkaline and acidic electrolyte are shown in eqn (3) and (4). It was considered that the electrophilic Co(ii) could draw nucleophilic dioxygen but repel the electrophilic proton, such as the protons in eqn (4). Most protons were absorbed at nucleophilic centers such as O in Co–O, and the separation and adsorption of dioxygen and protons produced space stereoscopic effect, which hindered the reaction of dioxygen with protons, contributing to the large polarization of ORR in acidic electrolyte, which led to the low electrochemical performance.51 Co–pyrrole/MPC showed high catalytic activity in alkaline electrolyte. Pyrolysis can effectively increase the number of Co–N2 and pyridinic-N which were considered as the catalytic sites, as enhanced the ORR activity. Double-chain structure of the catalyst contributed to a better electrochemical stability. According to the results of electrochemical tests, Co–pyrrole/MPC is definitely a promising ORR catalyst to replace Pt.
4. Conclusions
Taking advantages of coordination and polymerization capability of pyrrole, we used pyrrole as the ligand to coordinate Co(ii) to prepare Co(pyrrole)2(NO3)2 as catalyst precursor. By utilizing the higher specific surface area of MPC, the catalyst with MPC could support more active centers.
The MPC-supported N-containing cobalt catalyst (Co–pyrrole/MPC) which was synthesized via pyrolysis of precursor containing glucose, pyrrole and cobalt nitrate had high catalytic performance. During the preparation process, in addition to the carbon sources, glucose could also provide increased solubility of pyrrole in water, which enabled a high-efficiency coordination between pyrrole and Co(ii) upon the polymerization. Co–pyrrole/MPC catalyst exhibited high ORR activity in alkaline electrolytes, the initial reduction potential reached 0.9 V and the peak current density reached 5 mA cm−2 at room temperature. The excellent catalytic performance was further examined in the direct borohydride fuel cell, the peak power density reached 325 mW cm−2 at room temperature.
Conflicts of interest
There are no conflicts to declare.
Supplementary Material
Acknowledgments
This work was financially supported by the National Natural Science Foundation of China (Grant No. 21776245).
References
- Tian X. L. Zhao X. Su Y. Q. Wang L. J. Wang H. M. Dang D. Chi B. Liu H. F. Hensen E. J. M. Lou X. W. Xia B. Y. Science. 2019;366:850–856. doi: 10.1126/science.aaw7493. [DOI] [PubMed] [Google Scholar]
- Elbaz L. Garzon F. H. J. Electroanal. Chem. 2013;700:65–69. doi: 10.1016/j.jelechem.2013.04.013. [DOI] [Google Scholar]
- Gu C. Shannon C. J. Mol. Catal. A: Chem. 2007;262:185–189. doi: 10.1016/j.molcata.2006.08.029. [DOI] [Google Scholar]
- Gorlin Y. Jaramillo T. F. J. Mol. Catal. A: Chem. 2010;132:13612–13614. doi: 10.1021/ja104587v. [DOI] [PubMed] [Google Scholar]
- Jasinski R. Nature. 1964;201:1212–1213. doi: 10.1038/2011212a0. [DOI] [Google Scholar]
- Goellner V. Baldizzone C. Schuppert A. Sougrati M. T. Mayrhofer K. Jaouen F. Phys. Chem. Chem. Phys. 2014;16:18454–18462. doi: 10.1039/C4CP02882A. [DOI] [PubMed] [Google Scholar]
- Kato M. Kimijima K. Shibata M. Notsu H. Ogino K. Inokuma K. Ohta N. Uemura H. Oyaizu N. Ohba T. Takakusagi S. Asakura K. Yagi I. Phys. Chem. Chem. Phys. 2015;17:8638–8641. doi: 10.1039/C4CP05595K. [DOI] [PubMed] [Google Scholar]
- Li Z. P. Liu Z. X. Zhu K. N. Li Z. Liu B. H. J. Power Sources. 2012;219:163–171. doi: 10.1016/j.jpowsour.2012.07.041. [DOI] [Google Scholar]
- Liu Z. X. Liu B. H. Li Z. P. Int. J. Hydrogen Energy. 2014;39:5689–5695. doi: 10.1016/j.ijhydene.2014.01.120. [DOI] [Google Scholar]
- Bashyam R. Zelenay P. Nature. 2006;447:63–66. doi: 10.1038/nature05118. [DOI] [PubMed] [Google Scholar]
- Nallathambi V. Lee J. W. Kumaraguru S. P. Wu G. Popov B. N. J. Power Sources. 2008;183:34–42. doi: 10.1016/j.jpowsour.2008.05.020. [DOI] [Google Scholar]
- Gang L. Li X. Ganesan P. Popov B. N. Appl. Catal., B. 2009;93:156–165. doi: 10.1016/j.apcatb.2009.09.025. [DOI] [Google Scholar]
- Liu Y. R. Lin B. P. Li D. Zhang X. Q. Sun Y. Yang H. J. Porous Mater. 2014;21:933–938. doi: 10.1007/s10934-014-9841-4. [DOI] [Google Scholar]
- Toberer E. S. Schladt T. D. Seshadr R. J. Am. Chem. Soc. 2006;128:1462–1463. doi: 10.1021/ja0579412. [DOI] [PubMed] [Google Scholar]
- Kim J. Jang J. Peck D. Lee B. Yoon S. Jung D. J. Electroanal. Chem. 2016;768:34–40. doi: 10.1016/j.jelechem.2016.02.032. [DOI] [Google Scholar]
- Khalafallah D. Alothman O. Y. Fouad H. Khalil K. A. J. Electroanal. Chem. 2018;809:96–104. doi: 10.1016/j.jelechem.2017.12.064. [DOI] [Google Scholar]
- Sarapuu A. Samolberg L. Kreek K. Koel M. Matisen L. Tammeveski K. J. Electroanal. Chem. 2016;746:9–17. doi: 10.1016/j.jelechem.2015.03.021. [DOI] [Google Scholar]
- Yang C. Q. Jie S. S. Zhu R. L. Zhang N. D. Wang J. Q. Liu Z. G. Chemistryselect. 2017;2:4255–4260. doi: 10.1002/slct.201700662. [DOI] [Google Scholar]
- Gao L. Q. Xiao M. L. Jin Z. Liu C. P. Zhu J. B. Ge J. J. Xing W. J. Energy Chem. 2018;27:1668–1673. doi: 10.1016/j.jechem.2018.06.008. [DOI] [Google Scholar]
- Zhang C. Liu J. Ye Y. Aalam Z. Brydson R. Liang C. ACS Appl. Mater. Interfaces. 2018;10:2423–2429. doi: 10.1021/acsami.7b14443. [DOI] [PubMed] [Google Scholar]
- Chen Z. Higgins D. C. Tao H. S. Hsu R. S. Chen Z. W. J. Phys. Chem. C. 2009;113:21008–21013. doi: 10.1021/jp908067v. [DOI] [Google Scholar]
- Robson M. H. Serov A. Artyushkova K. Atanassov P. Electrochim. Acta. 2012;90:656–665. doi: 10.1016/j.electacta.2012.11.025. [DOI] [Google Scholar]
- Bezerra C. W. B. Lei Z. Lee K. C. Liu H. S. Marques A. L. B. Marques E. P. Wang H. J. Zhang J. J. Electrochim. Acta. 2008;53:4937–4951. doi: 10.1016/j.electacta.2008.02.012. [DOI] [Google Scholar]
- Zhang D. Chi D. Okajima T. Ohsaka T. Electrochim. Acta. 2007;52:5400–5406. doi: 10.1016/j.electacta.2007.02.060. [DOI] [Google Scholar]
- Yamazaki S. Coord. Chem. Rev. 2018;373:148–166. doi: 10.1016/j.ccr.2017.09.016. [DOI] [Google Scholar]
- Mcpherson G. L. Losavio P. J. J. Inorg. Chem. 1975;14:2116–2120. doi: 10.1021/ic50151a019. [DOI] [Google Scholar]
- James D. W. Leong W. H. Chem. Commun. 1968:1415–1417. doi: 10.1039/C19680001415. [DOI] [Google Scholar]
- Corey E. J. Katzenellenbogen J. A. J. Am. Chem. Soc. 1969;91:1851–1852. doi: 10.1021/ja01035a045. [DOI] [Google Scholar]
- Wang H. Q. Wei L. L. Liu J. T. Shen J. Q. Int. J. Hydrogen Energy. 2020;45:4481–4489. doi: 10.1016/j.ijhydene.2019.12.043. [DOI] [Google Scholar]
- Lv X. H. Xiao Z. X. Wang H. Y. Wang X. L. Shan L. L. Wang F. L. Wei C. Y. Tang X. J. Chen Y. L. J. Energy Chem. 2020;20:30453–30458. [Google Scholar]
- Zhao H. W. Xing T. Y. Li L. X. Geng X. Guo K. Sun C. G. Zhou W. M. Yang H. M. Song R. F. An B. G. Int. J. Hydrogen Energy. 2019;44:25180–25187. doi: 10.1016/j.ijhydene.2019.03.271. [DOI] [Google Scholar]
- Qin H. Y. Liu Z. X. Lao S. J. Zhu J. K. Li Z. P. J. Power Sources. 2010;195:3124–3129. doi: 10.1016/j.jpowsour.2009.12.001. [DOI] [Google Scholar]
- Qin H. Y. Liu Z. X. Ye L. Q. Zhu J. K. Li Z. P. J. Power Sources. 2009;192:385–390. doi: 10.1016/j.jpowsour.2009.03.006. [DOI] [Google Scholar]
- Makoto Y. Aritomo Y. Hisayuki I. Ken T. Masakuni Y. Kenichi O. Chem. Mater. 2005;17:4278–4281. doi: 10.1021/cm050958z. [DOI] [Google Scholar]
- Lee K. Lei Z. Lui H. Hui R. Shi Z. Zhang J. Electrochim. Acta. 2009;54:4704–4711. doi: 10.1016/j.electacta.2009.03.081. [DOI] [Google Scholar]
- Viswanathan T. Richardson T. Ind. Eng. Chem. Res. 1989;23:644–647. doi: 10.1021/i300016a027. [DOI] [Google Scholar]
- Vinu A. Kazi Z. Srinivasu P. Miyahara M. Anandan S. Gokulakrishnan N. Mori T. Ariga K. Balasubramanian V. V. J. Mater. Chem. 2007;17:1819–1825. doi: 10.1039/B613899C. [DOI] [Google Scholar]
- Gierszal K. P. Jaroniec M. Liang C. D. Dai S. Carbon. 2007;45:2171–2177. doi: 10.1016/j.carbon.2007.06.053. [DOI] [Google Scholar]
- Janssen A. H. Schmidt I. Jacobsen C. J. H. Koster A. J. de Jong K. P. Microporous Mesoporous Mater. 2003;65:59–75. doi: 10.1016/j.micromeso.2003.07.003. [DOI] [Google Scholar]
- Zhao C. R. Wang W. K. Yu Z. H. Zhang H. Wang A. B. Yang Y. S. J. Mater. Chem. 2010;20:976–980. doi: 10.1039/B911913B. [DOI] [Google Scholar]
- Chierici L. Gardini G. P. Tetrahedron. 1966;22:53–56. doi: 10.1016/0040-4020(66)80100-X. [DOI] [Google Scholar]
- Jing L. Wan M. J. Mater. Chem. 2001;11:404–407. doi: 10.1039/B008026H. [DOI] [Google Scholar]
- Glaspell G. P. Jagodzinski P. W. Manivannan A. J. Phys. Chem. B. 2004;108:9604–9607. doi: 10.1021/jp0370831. [DOI] [Google Scholar]
- Geng W. Kumabe Y. Nakajima T. Takanashi H. Ohki A. Fuel. 2009;88:644–649. doi: 10.1016/j.fuel.2008.09.025. [DOI] [Google Scholar]
- Li G. R. Li Z. P. Lin Z. Energy Storage Sci. Technol. 2016;5:135–148. [Google Scholar]
- Miyake K. J. Takemura T. Gabe A. Zhu Y. X. Ota M. Shu Y. Hirota Y. Uchida Y. Tanka S. Katayama M. Inada Y. Nishiyama N. Electrochim. Acta. 2019;296:867–873. doi: 10.1016/j.electacta.2018.11.080. [DOI] [Google Scholar]
- Liu B. H. Dou L. T. He F. Yang J. Li Z. P. RSC Adv. 2016;6:19025–19033. doi: 10.1039/C5RA27558J. [DOI] [Google Scholar]
- Abdolmaleki M. Hosseini M. G. Fuel Cells. 2017;17:321–327. doi: 10.1002/fuce.201600134. [DOI] [Google Scholar]
- Balčiūnaitė A. Tamašauskaitė-Tamašiūnaitė L. Santos D. M. F. Zabielaitė A. Jagminienė A. Stankevičienė I. Norkus E. Fuel Cells. 2017;17:690–697. doi: 10.1002/fuce.201600168. [DOI] [Google Scholar]
- Zhao D. Shui J. L. Chen C. Chen X. Q. Reprogle B. M. Wang D. P. Liu D. J. Chem. Sci. 2012;3:3200–3205. doi: 10.1039/C2SC20657A. [DOI] [Google Scholar]
- Jia J. J. Li X. X. Qin H. Y. He Y. Ni H. L. Chi H. Z. J. Alloys Compd. 2019;820:153065–153071. doi: 10.1016/j.jallcom.2019.153065. [DOI] [Google Scholar]
- He Y. Zhu C. Chen K. J. Wang J. Qin H. Y. Liu J. B. Yan S. Yang K. Li A. G. J. Power Sources. 2017;339:13–19. doi: 10.1016/j.jpowsour.2016.11.021. [DOI] [Google Scholar]
- Lin L. X. Qin H. Y. Jia J. K. Ji Z. G. Chi H. Z. Ni H. L. Wang J. He Y. Liu J. B. J. Alloys Compd. 2018;769:136–140. doi: 10.1016/j.jallcom.2018.07.269. [DOI] [Google Scholar]


