Abstract
Environmental conditions have a profound effect on the photophysical behavior of highly conjugated compounds, which can be exploited in a large variety of applications. In this context, we use a combination of experimental and computational methods to investigate thermal and solvatochromic effects on the fluorescence properties of a dansyl derivative bearing a thienyl substituent, namely 2-(3-thienyl)ethyl dansylglycinate (TEDG). In particular, we analyze how the solvent polarity and temperature affect the ground and excited state energies of TEDG by using time-resolved and steady-state fluorescence techniques. We determine the changes in dipole moment of the TEDG molecule upon photoexcitation, as well as the solvent polarity effects on the excited state lifetime. Besides, we provide theoretical modeling of the HOMO–LUMO orbitals and the vertical absorption and emission energies using time-dependent density functional theory (TDDFT) as well as the polarizable continuum model (PCM) to include the solvent contribution to the absorption and emission energies. Our results show that the emission mechanism of TEDG involves locally excited states derived from hybrid molecular orbitals, accompanied by a moderate variation of the molecular dipole moment upon light excitation. Our findings demonstrate that TEDG exhibits desirable fluorescence properties that make it a promising candidate for use as a photoactive material in electrochromic, optical thermometry, and thermography applications.
We use a combination of experimental and computational methods to investigate thermal and solvatochromic effects on the fluorescence properties of a dansyl derivative bearing a thienyl substituent, 2-(3-thienyl)ethyl dansylglycinate (TEDG).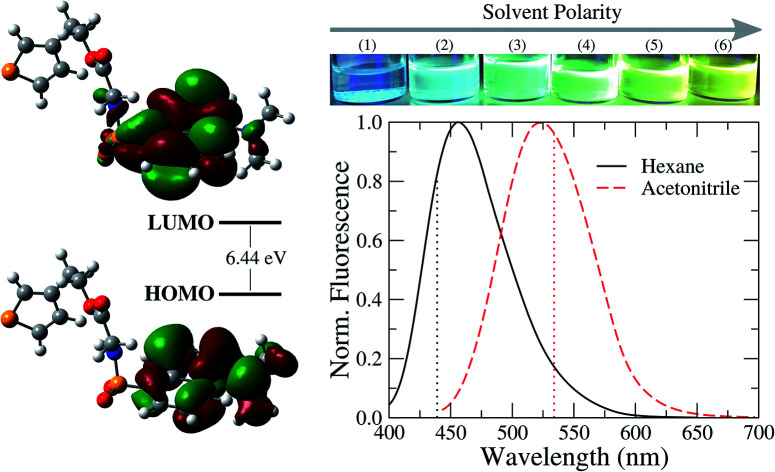
1. Introduction
The study of the fluorescence properties of organic molecules presenting donor and acceptor functional groups is a long standing issue and has been widely exploited in the development of chemical probes for biological1,2 and inorganic targets.3,4 In particular, π-conjugated compounds with electron-donating and/or electron-withdrawing substituents tend to exhibit an emission spectrum which is highly sensitive to the surrounding conditions, such as temperature,5,6 polarity,7,8 and viscosity9,10 of the carrier medium. In fact, the attachment of donor and acceptor groups can be used to tune the HOMO–LUMO energy gap of organic compounds as an efficient synthesis method for fluorescent probes for microenvironments.2,11–13 A prominent example is the use of naphthalene derivatives to trace the activity of non-fluorescent biological molecules such as proteins,14 peptides,15 and DNA segments.16 Further, π-conjugated compounds with good chemical stability have been extensively used in a large variety of optoelectronic applications, such as electrochromic devices (ECD),17,18 polymer light-emitting diodes (PLEDs),19 solar cells,20 and organic field-effect transistors (OFET).21–23 From a fundamental point of view, understanding the electronic transitions in highly conjugated organic compounds is still a timely topic due to the rich phenomenology associated with intramolecular charge transfer (ICT),24–26 thermal,27 and solvatochromic effects.7,28,29
Over the past decades, several studies have been devoted to the characterization of the emission and electronic properties of compounds based on 1-(dimethylamino)-naphthalene-5-sulfonyl,30–41 known as dansyl derivatives. The main reason is that dansyl derivatives tend to exhibit broad emission spectra upon low-intensity UV excitation,30,31,33 with high quantum yields even under different external conditions.30 As a consequence, dansyl-based compounds have been extensively used to label and probe biological targets,2,13,16,42 as well as in the design of chemical sensors for heavy and transition metal ions.16,43–45 Further, the solvatochromic and thermal effects on the fluorescence properties of such compounds have attracted remarkable interest.30,33–35,46–50 In particular, their emission mechanism has been described in terms of 1La and 1Lb locally excited states,30,31,34,40,48 and may involve an intramolecular charge transfer and a mixing of π → π* and n → π* electronic transitions in the naphthalene core and the amino group, respectively. In addition, experimental studies have verified that dansyl derivatives exhibit a significant Stokes shift as the solvent polarity is increased,33–35,49 with a considerable change in molecular dipole moment. Concerning the thermal effects, a pronounced thermochromic effect has been observed in the fluorescence spectra of dansyl moieties covalently tagged in polymeric chains,51 as well as an enhancement in the fluorescence intensity when the solvent temperature is increased.27,35
The present study is devoted to the characterization of thermal and solvatochromic effects on the fluorescence properties of a dansyl derivative bearing a thienyl substituent, namely 2-(3-thienyl)ethyl dansylglycinate (TEDG). In particular, the time-resolved and steady-state fluorescence of TEDG are investigated in solvents with distinct polarities. Our results show that the fluorescence spectrum of TEDG is strongly affected by the temperature and polarity of the solvent. The Stokes shift is used to estimate the variation of dipole moment of TEDG upon photoexcitation. Further, we perform a detailed computational analysis of TEDG using time-dependent density functional theory (TDDFT), thus supplying information about the HOMO–LUMO orbitals and the solvent effects on the vertical absorption and emission energies. These quantum mechanical calculations are in agreement with the experimental findings.
2. Materials and methods
2.1. Materials
All chemical reagents were purchased from Sigma-Aldrich, Vetec, or Acros and used as received. The solvents of analytical grade were dried by conventional procedures and distilled prior to use. The compounds were characterized by 1H NMR spectroscopy, FTIR and elemental analysis.
2.2. Synthesis
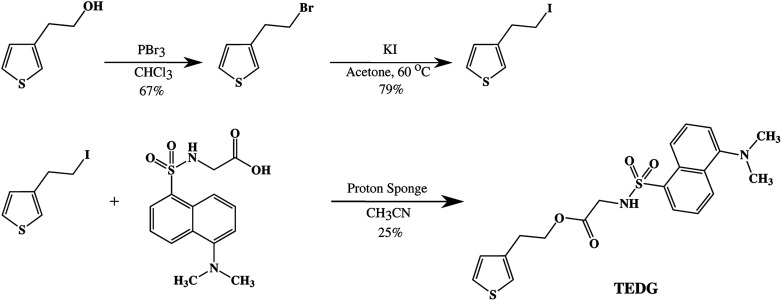
The synthetic route to obtain TEDG was divided into two steps, as shown in Fig. 1. The first step involved the preparation of thiophene derivatives, while the second one was their esterification with dansylglycine (DSG). In particular, 3-(2-bromoethyl)thiophene was synthesized according to the procedure described in the literature52,53 and was obtained in 67% yield (lit. 70%). 3-(2-Iodoethyl)thiophene was prepared by using a literature procedure, with slight modifications.54 Briefly, 40 mL KI solution (6.46 g, 37.41 mmol) in acetone was added to the crude 3-(2-bromoethyl)thiophene (6.57 g, 34.42 mmol). The reaction mixture was stirred and refluxed for 4 h. Next, the mixture was filtered, and the resulting solution was distilled under reduced pressure, which furnished 6.47 g 3-(2-iodoethyl)thiophene (79% yield). 1H NMR, FTIR and elemental analysis results for both thiophene derivatives matched the data shown in previous studies.52–54
Fig. 1. Synthetic route for the preparation of 2-(3′-thienyl)ethyl-dansylglycinate (TEDG).52.
2-(3′-Thienyl)ethyl-dansylglycinate (TEDG) was synthesized according to the procedure described in the literature:52 3-(2-iodoethyl) thiophene (0.77 g, 3.24 mmol) and 1,8-bis(dimethylamino) naphthalene (proton-sponge®, 0.69 g, 3.23 mmol) were added to a solution of dansylglycine (0.99 g, 3.23 mmol) in 15 mL dry CH3CN. The reaction mixture was stirred at 50 °C for 1.5 h, and the white precipitate was removed by filtration. CH3CN (15 mL) was added to the crude product, which was followed by stirring, and the precipitate was again removed by filtration. The filtration step was repeated until no more precipitate was formed. An orange ochre solid was obtained (0.34 g, 25% yield). mp 132–134 °C; 1H NMR (400 MHz, methanol-d4, δ): 8.56 (d, J = 8.6 Hz, 1H, ArH), 8.37 (d, J = 8.6 Hz, 1H, ArH), 8.19 (dd, J = 7.3 and 1.2 Hz, 1H, ArH), 7.51 (m, 2H, ArH), 7.30–7.26 (m, 2H, ArH and ThH), 6.98 (dd, 1H, ThH), 6.86 (dd, 1H, ThH), 3.89 (t, J = 7.1 and 7.8 Hz, 2H, CH2Th), 3.75 (t, 2H, SO2NHCH2), 2.86 (s, 6H, N(CH3)2), 2.56 (t, J = 7.0 and 7.9 Hz, 2H, COOCH2). 13C NMR (400 MHz, methanol-d4, δ): 167.55, 150.21, 135.98, 134.20, 128.32, 128.16, 127.13, 126.22, 126.13, 123.55, 121.33, 119.62, 117.86, 113.48, 62.10, 42.82, 42.14, 26.98; FTIR (KBr): ν = 3276 (m, ν (N–H)), 3108 (w, ν (C–Hα thiophene)), 3053 (w, ν (C–Hβ thiophene)), 2940 (w, νas (C–H)), 2864 (w, νas (C–H)), 1741 (s, ν (C O)), 1575 (w, δ (N–H)), 1452 (w, νas (C C)), 1380 (w, νs (C C)), 1348 (m, δ (C–H, CH2)), 1238 (m, δ (C–H, naphthalene)), 1203 (m, ν (C–N)), 1160 (m, δ (C–O)), 881 (w, δout-of-plane (C–H, naphthalene)), 831 (w, δout-of-plane (C–H)), 790 (s, δout-of-plane (C–H)) cm1; 686 (w, δout-of-plane (C–Hα thiophene)) cm1. Anal. calcd for C20H22N2O4S2: C 57.39, H 5.30, N 6.69, O 15.29, S 15.32; found: C 57.25, H 5.48, N 6.09, O 15.99, S 15.19.
2.3. Instrumentation
The 1H and 13C NMR spectra were recorded on a Bruker spectrometer operating at a frequency of 400 MHz. The FTIR spectra were acquired with a Bruker IFS66 spectrophotometer using KBr pellets. The elemental analysis determinations were performed using Carlo Erba equipment.
2.4. Steady-state fluorescence and absorption
A Hitachi F-7000 spectrofluorometer was used to measure the emission and excitation spectra of TEDG samples in different solvents. The sample temperature was controlled using an external water bath. Absorption spectra were obtained using an Ultrospec 2100 pro UV-Vis spectrophotometer (Amersham Pharmacia).
2.5. Time-resolved fluorescence
We used a Tsunami (Spectra-Physics) laser system in mode-locked configuration to provide picosecond pulses of light, which is tunable to wavelengths between 840 and 990 nm. The output laser beam was pulse-picked and frequency doubled or tripled to generate wavelengths between 420–495 nm and 280–330 nm, respectively. The pulses were directed to an L-format Edinburgh F900 spectrometer with a monochromator in the emission channel. Single photons were detected by a cooled Hamamatsu R3890U microchannel plate photomultiplier. Data are analyzed by using commercial software (Edinburgh Instruments) based on non-linear least-squares method. The quality of fit is judged from statistical parameters like reduced chi-square values and the residuals distribution.
2.6. Theoretical calculation details
A better understanding of the electronic properties of TEDG can be obtained using a theoretical analysis of the HOMO–LUMO orbitals and the vertical absorption and emission energies. For this, the Frontier molecular orbitals at the ground state for TEDG were obtained using the density functional theory (DFT) CAM-B3LYP/6-311+G(d,p) methodology, while the absorption and emission energies were obtained using the time-dependent density functional theory (TDDFT) at CAM-B3LYP/6-311+G(d,p) level.55 The solvent effects were included using the polarizable continuum model with the integral equation formalism (IEF-PCM).56,57 The continuum approach is the most simple model to estimate the solvent effects on the absorption and emission energies of organic molecules, where the solvent is represented by its macroscopic dielectric constant. Since no polar protic solvent will be considered in this study, it is expected that the PCM will provide very good results for the solvent effects on the absorption and emission energies of TEDG. Considering the good accuracy related to the calculations of excited states obtained by the CAM-B3LYP functional,58–60 all theoretical ground and excited state molecular geometries were calculated using the TDDFT CAM-B3LYP/6-311+G(d,p). The vertical transition energies were calculated using the state specific approach for absorption and emission and the respective Stokes shift.61,62 All quantum mechanical calculations were performed by using the Gaussian 09 program.63
3. Results and discussion
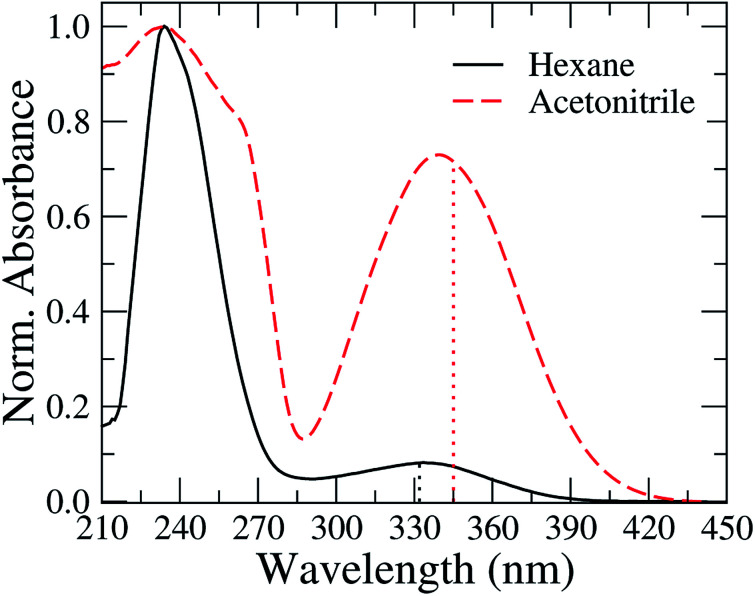
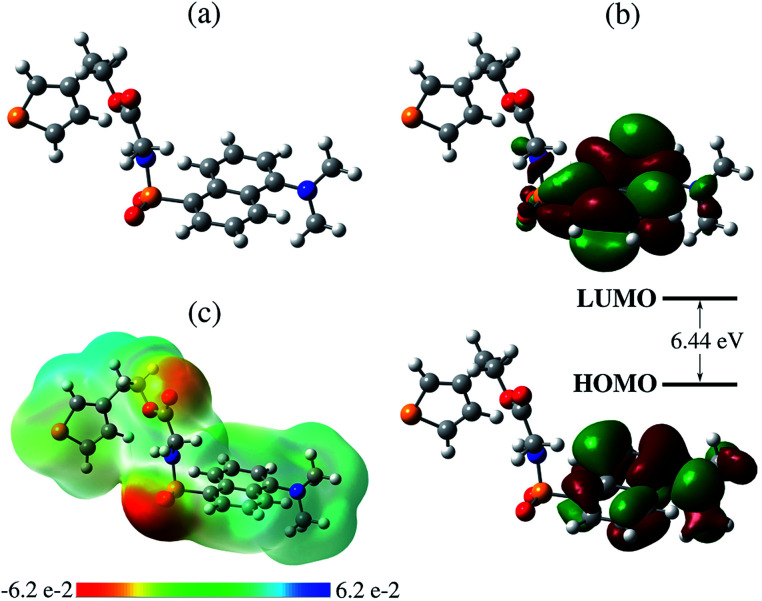
In Fig. 2, we present the absorption spectra of TEDG in hexane and acetonitrile at room temperature (T = 297 K). In the apolar solvent, TEDG presents a high absorption band centered at λh = 235 nm, corresponding to the high energy π → π* transitions of the amino-naphthalene moiety.32 Besides, TEDG exhibits a moderate absorption band at λg = 334 nm, which is associated with low energy π → π* transitions from the ground state, S0, to the locally excited states, 1La and 1Lb. These locally excited states correspond to the short and long axis polarized states of the amino-naphthalene group,30,32 respectively, presenting a small energy gap around 0.1 eV. In particular, 1La is expected to be a mix of π → π* transitions of naphthalene, with a strong contribution from the n → π* transition of the amino group. As a consequence, 1La behaves as a polar state with a small charge transfer character, while 1Lb remains a π → π* transition with apolar behavior. In this case, the absorption band at λ = 334 nm of TEDG in hexane is governed by the 1Lb state. In the polar solvent, two important modifications can be observed in the absorption spectrum of TEDG, with a blue shift taking place in the h-band (λh = 225 nm). More specifically, the h-band is suppressed in polar solvent, indicating the apolar nature of the excited state involved in this π → π* transition. On the other hand, a red shift is observed in the g-band (λg = 341 nm), which is favored in the polar solvent. In fact, the absorption band at λ = 341 nm of TEDG in acetonitrile is governed by the 1La state, due to the polar nature of this state. In order to confirm such a statement, the HOMO and LUMO levels of TEDG in acetonitrile were computed by density functional theory at the CAM-B3LYP/6-311+G(d,p) level, with the calculation results presented in Fig. 3. From the Frontier orbitals (HOMO and LUMO) of TEDG in acetonitrile, one can verify the contribution of the lone-pair electrons of the dimethylamino group in the absorption transition. The HOMO and LUMO Frontier orbitals of TEDG are quite similar to those previously reported for dansyl-based compounds.48,64 Further, the electrostatic surface potential shows that the electron-withdrawing behavior of sulfonyl and carbonyl groups gives rise to significant molecular polarization, with a low electron density in the dimethylamino-naphthalene and thiophene moieties. The experimental and theoretical results for the absorption parameters of TEDG in different solvents are summarized in Table 1.
Fig. 2. Normalized absorption spectra of TEDG in solvents with different polarities: hexane (black solid line) and acetonitrile (red dashed line). Vertical dotted lines correspond to the theoretical predictions for the absorption wavelengths using the TD-DFT method. One can note that the absorption spectrum of TEDG is affected by the solvent polarity, with a noticeable red shift in the lower energy band.
Fig. 3. (a) Ball-and-stick model of the molecular structure of TEDG, with carbon, oxygen, sulfur and nitrogen atoms colored gray, red, yellow and blue, respectively. (b) Frontier molecular orbitals (MOs) of TEDG in acetonitrile, corresponding to HOMO and LUMO levels. (c) Electrostatic surface potential (ESP) obtained by CAM-B3LYP/6-311+G(d,p) including acetonitrile as the solvent.
Solvent parameters and solvatochromic data of TEDG: ε is the solvent dielectric constant and ENT is the Reichardt solvent parameter.66λg (νg) and λf (νf) are the absorption and fluorescence peak wavelengths (wavenumbers), respectively. (νg − νf) is the Stokes shift. λThg and λThf are the absorption and fluorescence peak wavelengths obtained from TD-DFT calculations, while (νg − νf)Th is the theoretical Stokes shift.
| Solvent | ε | E N | λ g (nm) | λ Th (nm) | λ f (nm) | λ Th (nm) | (νg − νf) (cm−1) | (νg − νf)Th (cm−1) |
|---|---|---|---|---|---|---|---|---|
| Hexane | 1.88 | 0.009 | 334 | 332 | 456 | 439 | 7894 | 7403 |
| Toluene | 2.36 | 0.099 | 340 | 338 | 488 | 451 | 8920 | 7390 |
| Chloroform | 4.81 | 0.259 | 344 | 343 | 499 | 486 | 9030 | 8614 |
| Dichloromethane | 8.93 | 0.309 | 344 | 345 | 505 | 509 | 9251 | 9333 |
| Acetone | 21.01 | 0.355 | 339 | 345 | 512 | 527 | 10 020 | 10 032 |
| Acetonitrile | 36.64 | 0.460 | 340 | 345 | 524 | 534 | 10 371 | 10 248 |
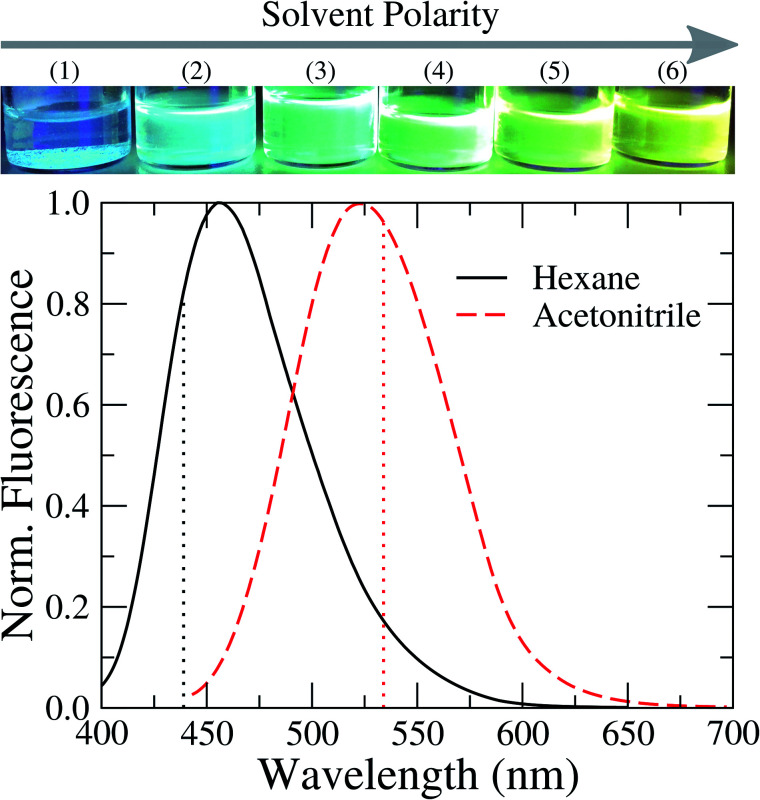
Fig. 4 shows the steady-state fluorescence spectra of TEDG in hexane and acetonitrile. The emission spectra were recorded at room temperature. In the apolar solvent, we observe that TEDG presents a broad emission spectrum upon photoexcitation at λexc = 380 nm, with a maximum intensity at λf = 456 nm. A pronounced red shift takes place in the emission spectrum of TEDG in the polar solvent, with the maximum intensity occurring at λf = 524 nm for photoexcitation at λexc = 424 nm. As shown in Table 2, the emission spectra of TEDG are quite similar to those of dansylglycine (DSG), which present maximum emission intensities at λ = 455 nm and λ = 524 in hexane and acetonitrile, respectively. These results indicate that the thienyl group has a negligible contribution to the fluorescence mechanism of TEDG, contrasting with previous reports of dansyl derivatives containing cyclic groups attached to the sulfonyl moiety, such as acryloyl,48 phthalimide,36 or oxo poly-amine macrocycle.65 In fact, the direct attachment of cyclic groups to the sulfonyl moiety tends to reduce the energy gap between the fundamental and excited states of dansyl compounds, thus leading to a strong red shift and/or fluorescence quenching of the emission spectrum in comparison with dansyl derivatives functionalized with non-cyclic groups. As the thienyl is appended to the dansyl group through an ethyl-glycinate linker, the emission transition of TEDG is very close to that observed in dansylglycine. These experimental findings are in agreement with previous studies where cyclic groups were attached to the dansyl compounds by alkyl-glycinate and alkyl-diamine linkages.35,49 The experimental and theoretical results for the emission parameters of TEDG in different solvents are presented in Table 1. Furthermore, we determine the emission quantum yield of TEDG in acetonitrile, with ΦTEDG = 0.41. This value is slightly greater than the emission quantum yield of DSG in acetonitrile, with ΦDSG = 0.36. This result indicates that the attachment of the thienyl group leads to a reduction in the non-radiative relaxation of the dimethylamino-naphthalene moiety. A comparison between the spectroscopic properties of TEDG and DSG is summarized in Table 2.
Fig. 4. Normalized fluorescence spectra of TEDG in solvents with different polarities: hexane (black solid line) and acetonitrile (red dashed line). Vertical dotted lines represent the theoretical predictions for the emission wavelengths using the TD-DFT method. A pronounced red shift takes place in the fluorescence spectrum of TEDG in polar solvent, in comparison with TEDG in apolar liquid. Top: images of TEDG fluorescence in different solvents: (1) hexane, (2) toluene, (3) chloroform, (4) dichloromethane, (5) acetone, and (6) acetonitrile.
Spectral properties of dansylglycine (DSG) and 2-(3-thienyl)ethyl dansylglycinate (TEDG) in different solvents. λg and λf are the absorption and fluorescence peak wavelengths, respectively, while Φ is the quantum yield.
| Compound | Solvent | λ g (nm) | λ f (nm) | Φ |
|---|---|---|---|---|
| DSG | Hexane | 335 | 456 | — |
| Acetonitrile | 339 | 524 | 0.36 | |
| TEDG | Hexane | 334 | 456 | — |
| Acetonitrile | 340 | 524 | 0.41 |
The dependence of the emission and absorption spectra on the solvent polarity can be used to determine the variation of the dipole moment of TEDG upon light excitation.1 More specifically, we analyze the dependence of the Stokes shift on the empirical polarity parameter ENT introduced by Reichardt.66,67 The use of ENT minimizes the eventual effects related to errors in the estimation of Onsager cavity radius of the fluorophore molecule. As the ENT parameter includes the effect associated with the formation of hydrogen bonds and the mechanism of intramolecular charge transfer, such a parameter allows us to reasonably describe the microenvironment of molecular dipoles in solution, rather than the other bulk polarity functions based on the refractive indices and dielectric permittivities of solvents. In the Reichardt approach, the Stokes shift is related to changes of the molecular dipole moment as follows:
 |
1 |
where νg and νf correspond to the absorption and fluorescence maximum wavenumbers in cm−1, respectively. aB = 6.2 Å is the Onsager cavity radius of the betaine dye, while δμB = 9 D is the dipole moment change of the betaine molecule upon excitation.66δμ and a are the variation of the dipole moment and the Onsager cavity radius of the fluorophore molecule, respectively.
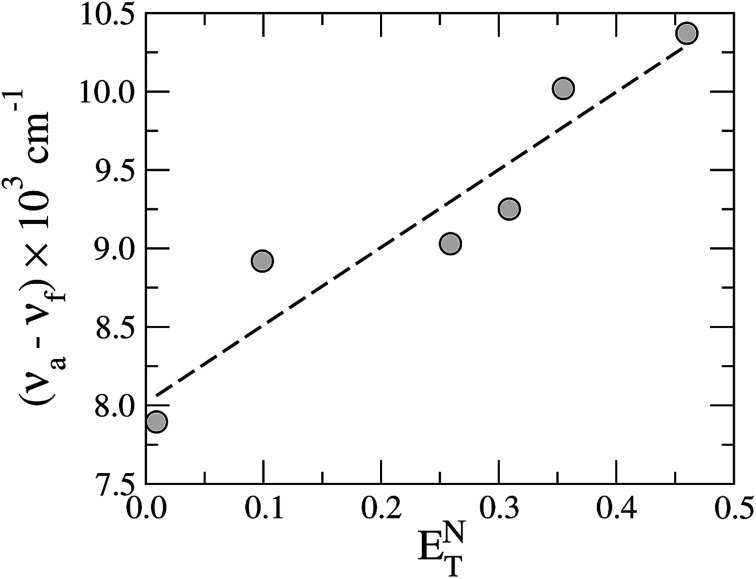
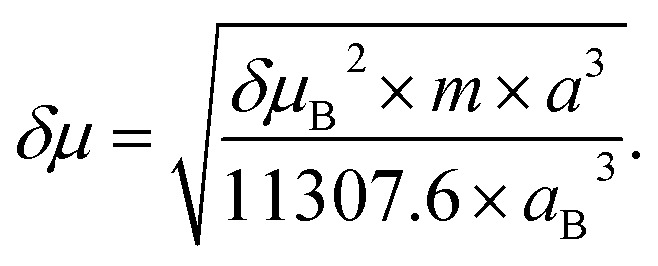
The Stokes shift of TEDG as function of the polarity parameter ENT is shown in Fig. 5. Performing a linear regression of the data (dashed line), we evaluate the change in the molecular dipole moment from the regression slope m, using the relation
 |
2 |
Fig. 5. Stokes shift of TEDG as a function of the solvent polarity parameter ENT. The dashed line represents the linear regression of the data, with a regression slope m = 4.95 and correlation coefficient R = 0.94.
The Onsager cavity radius of the TEDG can be determined from the molar mass and the density of the compound: Mm = 415.50 g mol−1 and ρP = 1.21 g cm−3. We estimate a = 5.00 Å and δμ = 4.31 D for the TEDG molecule, which is in good agreement with previous results reported for similar dansyl derivatives.30,33–35
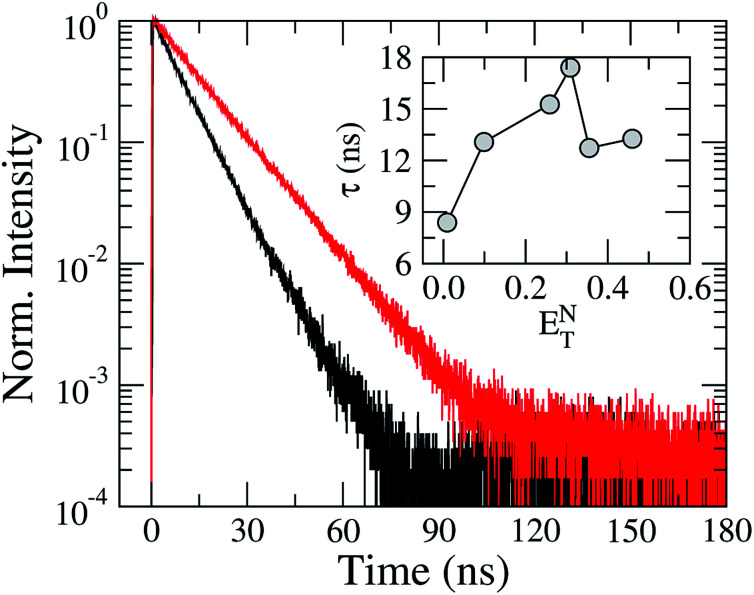
In order to investigate the solvation effects on the fluorescence kinetics of TEDG, we exhibit in Fig. 6 the transient intensity of TEDG emission. We used pulsed excitations at λexc = 330 nm and λexc = 424 nm for TEDG in acetonitrile and hexane solvents, respectively. In particular, the fluorescence kinetics of TEDG were monitored at the wavelength where the maximum emission intensity takes place for each solvent, as summarized in Table 1. As can be noted, the transient intensity exhibits a single exponential relaxation in both solvents, with the fluorescence lifetime presenting a strong dependence on the solvent polarity. More specifically, a faster relaxation is observed for TEDG in the apolar solvent than in the polar solvent, reinforcing the polar nature of the 1La excited state involved in the emission process. The inset of Fig. 6 shows the fluorescence lifetime, τ, as a function of the solvent polarity parameter ENT. We note that τ increases as the solvent polarity is enhanced, indicating that the excited state is stabilized in solvents with moderate polarity. These results are in accordance with the solvatochromic data, as only a modest variation is expected to occur in the dipole moment of TEDG molecules under photoexcitation. However, an abrupt decrease of fluorescence lifetime is verified for high polarity solvents, suggesting a non-trivial contribution of solvent polarity to the stability of the TEDG excited state. Similar nonmonotonic behavior was reported for the fluorescence lifetime of 1-(dimethylamino)-5-naphthalenesulfonic acid in a mixture of acetonitrile and dioxane,30 where the mixture’s polarity was controlled by the dioxane concentration. In fact, the fluorescence kinetics of dansyl-based compounds exhibit a rich phenomenology associated with intramolecular charge transfer30 and the reorientation of solvent molecules.31
Fig. 6. Normalized transient intensity of TEDG fluorescence for solvents with distinct polarities: hexane (black line) and acetonitrile (red line). The inset shows the dependence of the excited state lifetime, τ, on the solvent polarity parameter ENT.
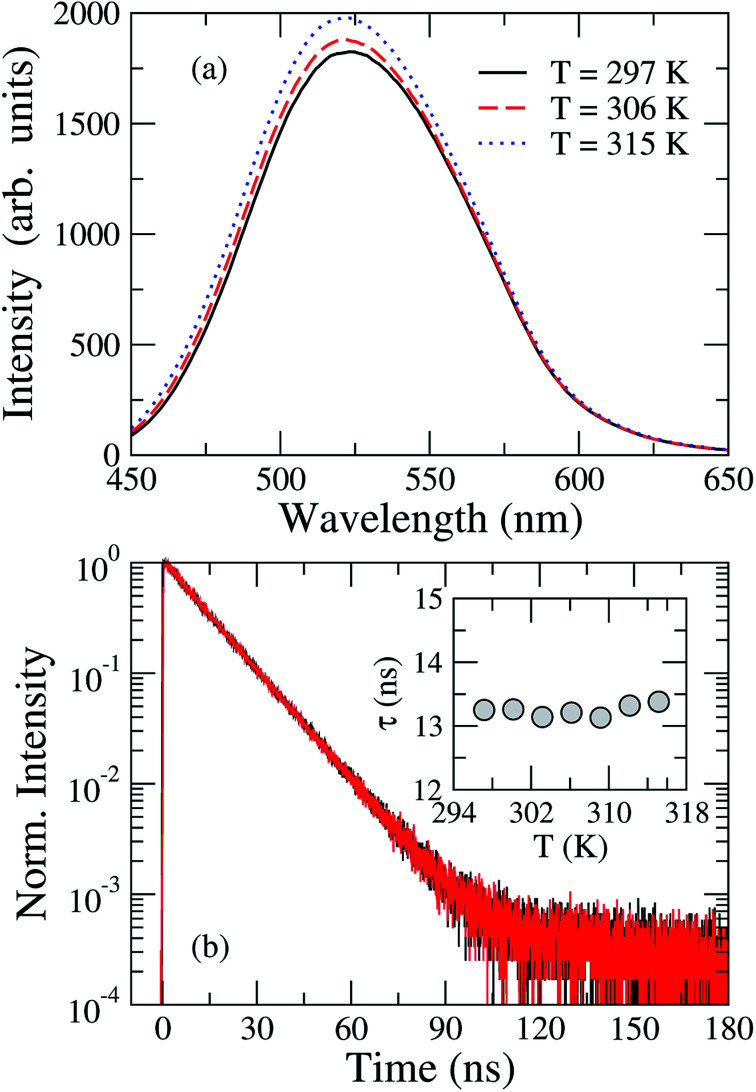
Let us now analyze the thermal effects on the fluorescence properties of TEDG. In Fig. 7(a), we present the steady-state fluorescence spectra of TEDG dissolved in acetonitrile at different temperatures. One can notice a small increase in the fluorescence intensity as the sample temperature is raised, accompanied by a small blue shift of the wavelength maximum (∼2 nm). Similar results were reported in other dansyl-based compounds,27,35 with the intensity increase attributed to a thermally-activated mechanism. As the fluorescence phenomenon in dansyl-based compounds involves locally excited states derived from hybrid molecular orbitals, changes in the environmental conditions may lead to a quenching or an enhancement of the emission intensity. In order to clarify how the temperature variation affects the stability of the excited state, the transient intensity and fluorescence lifetime of TEDG in acetonitrile are shown in Fig. 7(b). Here, we clearly observe that these parameters are independent of the solvent temperature. These results suggest that the fluorescence increase cannot be attributed to changes in the solvent–fluorophore interaction upon heating. Although a blue shift is observed, it corresponds to an energy change around 0.02 eV, thus implying that substantial modification of the molecular structure seems unlikely. The enhancement of fluorescence intensity may also arise from a thermal inhibition of intramolecular charge transfer between the donor and acceptor groups of TEDG, in a similar process to that recently reported for a naphthalimide-based compound.68 Another feasible mechanism may be associated with fluctuations in the torsional angle of the dimethylamino group in relation to the naphthalene plane, leading to enhanced overlap between the molecular orbitals of the amino and naphthalene groups and a subsequent increase of the oscillator strength. Nevertheless, a theoretical description of thermal effects on the torsional conformation of the diamethylamino-naphthalene moiety may represent a challenging task. Despite the wide variety of physics mechanisms that may give rise to this thermally-enhanced fluorescence, TEDG exhibits desirable spectroscopy properties, which makes it a promising candidate for different applications, such as electrochromic polymeric films,52 highly-selective probes for anion and cation detection,16,27 and thermometry.68
Fig. 7. (a) Steady-state fluorescence of TEDG in acetonitrile at different temperatures: T = 297 K (black solid line), T = 306 K (red dashed line), and T = 315 K (blue dotted line). A small increase in the fluorescence intensity is observed as the sample temperature is raised. (b) Normalized transient intensity of TEDG emission at different temperatures: T = 297 K (black line) and T = 315 K (red line). Note that the fluorescence lifetime is not affected by the sample temperature (see inset).
4. Summary and conclusion
In summary, we have investigated the fluorescence properties of a dansyl derivative (TEDG) containing a thienyl substituent. The thermal and solvatochromic effects on the fluorescence spectra of TEDG were investigated. We showed that the emission intensity of TEDG presents a strong Stokes shift as the solvent polarity is increased, with the emission mechanism involving locally excited states derived from hybrid molecular orbitals. Using time-dependent density functional theory (TD-DFT), we provided an analysis of the HOMO–LUMO orbitals, electrostatic surface potential, and the vertical absorption and emission energies. Variations in the dipole moment and fluorescence lifetime of TEDG molecules upon photoexcitation were estimated. Our results showed that the fluorescence lifetime of TEDG presents a nonmonotonic dependence on the solvent polarity, revealing a non-trivial contribution of medium polarity to the stability of the TEDG excited state. Concerning the thermal effects, we observed an enhancement in the emission intensity as the sample temperature is increased, which is accompanied by a small blue shift. However, we verified that fluorescence kinetics are not affected by the sample temperature, indicating that the solvent–fluorophore interaction is not modified upon heating. Our results show that TEDG exhibits desirable fluorescence properties, which makes it a promising candidate for use in electrochromic and optical devices,52 as well as in the production of polymeric films for optical thermometry and thermography applications.
Conflicts of interest
There are no conflicts to declare.
Supplementary Material
Acknowledgments
This work was partially supported by CAPES, INCT-FCx CNPq/MCT, and FINEP (Brazilian Research Agencies) as well as FAPEAL (Alagoas State Research Agency) and FAPESP (São Paulo State Research Agency). A. S. I. thanks CNPq for a grant (research project 305771/2016–7). I. N. de Oliveira thanks CNPq for the financial support, grant number 438198/2018-2.
References
- Lakowicz J. R., Principles of Fluorescence Spectroscopy, Springer, 3rd edn, 2006 [Google Scholar]
- Li D.-P. Wang Z.-Y. Cao X.-J. Cui J. Wang X. Cui H.-Z. Miao J.-Y. Zhao B.-X. Chem. Commun. 2016;52:2760. doi: 10.1039/C5CC09092J. [DOI] [PubMed] [Google Scholar]
- Rurack K. Spectrochim. Acta, Part A. 2001;57:2161. doi: 10.1016/S1386-1425(01)00492-9. [DOI] [PubMed] [Google Scholar]
- Jeong Y. Yoon J. Inorg. Chim. Acta. 2012;381:2. doi: 10.1016/j.ica.2011.09.011. [DOI] [Google Scholar]
- Cehelnik E. D. Cundall R. B. Lockwood J. R. Palmer T. F. J. Phys. Chem. 1975;79:1369. doi: 10.1021/j100581a008. [DOI] [Google Scholar]
- Dash N. Krishnamoorthy G. Spectrochim. Acta, Part A. 2012;95:540. doi: 10.1016/j.saa.2012.04.046. [DOI] [PubMed] [Google Scholar]
- Liu H. Xu X. Peng H. Chang X. Fu X. Li Q. Yin S. Blanchard G. J. Fang Y. Phys. Chem. Chem. Phys. 2016;18:25210. doi: 10.1039/C6CP04293G. [DOI] [PubMed] [Google Scholar]
- Manzoni V. Coutinho K. Canuto S. Chem. Phys. Lett. 2016;655–656:30. doi: 10.1016/j.cplett.2016.05.028. [DOI] [Google Scholar]
- Saha S. K. Purkayastha P. Das A. B. Dhara S. J. Photochem. Photobiol., A. 2008;199:179. doi: 10.1016/j.jphotochem.2008.05.020. [DOI] [Google Scholar]
- Haidekker M. A. Theodorakis E. A. Org. Biomol. Chem. 2007;5:1669. doi: 10.1039/B618415D. [DOI] [PubMed] [Google Scholar]
- Moyano F. Biasutti M. A. Silber J. J. Correa N. M. J. Phys. Chem. B. 2006;110:11838. doi: 10.1021/jp057208x. [DOI] [PubMed] [Google Scholar]
- Wang S.-L. Ho T.-I. J. Photochem. Photobiol., A. 2000;135:119. doi: 10.1016/S1010-6030(00)00289-6. [DOI] [Google Scholar]
- O’Connor N. A. Sakata S. T. Zhu H. Shea K. J. Org. Lett. 2006;8:1581. doi: 10.1021/ol060130y. [DOI] [PubMed] [Google Scholar]
- Ghosh K. Rathi S. Arora D. J. Lumin. 2016;175:135. doi: 10.1016/j.jlumin.2016.01.029. [DOI] [Google Scholar]
- Li C. Yang L. Han Y. Wang X. Biosens. Bioelectron. 2019;142:111518. doi: 10.1016/j.bios.2019.111518. [DOI] [PubMed] [Google Scholar]
- Ghosh S. Kundu P. Paul B. K. Chattopadhyay N. RSC Adv. 2014;4:63549. doi: 10.1039/C4RA14298E. [DOI] [Google Scholar]
- Wang B. Zhao J. Cui C. Liu R. Liu J. Wang H. Liu H. Electrochim. Acta. 2011;56:4819. doi: 10.1016/j.electacta.2011.03.020. [DOI] [Google Scholar]
- Almeida A. K. A. Dias J. M. Silva A. J. C. Santos D. P. Navarro M. Tonholo J. Goulart M. O. Ribeiro A. S. Electrochim. Acta. 2014;122:50. doi: 10.1016/j.electacta.2013.10.008. [DOI] [Google Scholar]
- Cimrová V. Výprachtický D. Hörhold H.-H. J. Polym. Sci., Part A: Polym. Chem. 2011;49:2233. doi: 10.1002/pola.24654. [DOI] [Google Scholar]
- Shi S. Yuan J. Ding G. Ford M. Lu K. Shi G. Sun J. Ling X. Li Y. Ma W. Adv. Funct. Mater. 2016;26:5669. doi: 10.1002/adfm.201601037. [DOI] [Google Scholar]
- Laquindanum J. G. Katz H. E. Dodabalapur A. Lovinger A. J. J. Am. Chem. Soc. 1996;118:11331. doi: 10.1021/ja962461j. [DOI] [Google Scholar]
- Shinamura S. Osaka I. Miyazaki E. Nakao A. Yamagishi M. Takeya J. Takimiya K. J. Am. Chem. Soc. 2011;133:5024. doi: 10.1021/ja110973m. [DOI] [PubMed] [Google Scholar]
- Filo J. Mišicák R. Cigáň M. Weis M. Jakabovič J. Gmucová K. Pavúk M. Dobročka E. Putala M. Synth. Met. 2015;202:73. doi: 10.1016/j.synthmet.2015.01.020. [DOI] [Google Scholar]
- Grabowski Z. R. Rotkiewicz K. Rettig W. Chem. Rev. 2003;103:3899. doi: 10.1021/cr940745l. [DOI] [PubMed] [Google Scholar]
- Brédas J.-L. Beljonne D. Coropceanu V. Cornil J. Chem. Rev. 2004;104:4971. doi: 10.1021/cr040084k. [DOI] [PubMed] [Google Scholar]
- Wu J. Liu W. Ge J. Zhang H. Wang P. Chem. Soc. Rev. 2011;40:3483. doi: 10.1039/C0CS00224K. [DOI] [PubMed] [Google Scholar]
- Du J. Yao S. Seitz W. R. Bencivenga N. E. Massing J. O. Planalp R. P. Jackson R. K. Kennedy D. P. Burdette S. C. Analyst. 2011;136:5006. doi: 10.1039/C1AN15479F. [DOI] [PubMed] [Google Scholar]
- Kautny P. Glöcklhofer F. Kader T. Mewes J.-M. Stöger B. Fröhlich J. Lumpi D. Plasser F. Phys. Chem. Chem. Phys. 2016;18:25210. doi: 10.1039/C6CP04293G. [DOI] [PubMed] [Google Scholar]
- Manzoni V. Modesto-Costa L. Nero J. D. Andrade-Filho T. Gester R. Opt. Mater. 2019;94:152. doi: 10.1016/j.optmat.2019.05.018. [DOI] [Google Scholar]
- Li Y.-H. Chan L.-M. Tyer L. Moody R. T. Himel C. M. Hercules D. M. J. Am. Chem. Soc. 1975;97:3118. doi: 10.1021/ja00844a033. [DOI] [Google Scholar]
- Ghiggino K. P. Lee A. G. Meech S. R. O’Connor D. V. Phillips D. Biochemistry. 1981;20:5381. doi: 10.1021/bi00522a005. [DOI] [PubMed] [Google Scholar]
- Nowak W. Rettig W. J. Mol. Struct.: THEOCHEM. 1993;283:1. doi: 10.1016/0166-1280(93)87109-Q. [DOI] [Google Scholar]
- Ren B. Gao F. Tong Z. Yan Y. Chem. Phys. Lett. 1999;307:55. doi: 10.1016/S0009-2614(99)00495-9. [DOI] [Google Scholar]
- Tewari N. Joshi N. Rautela R. Gahlaut R. Joshi H. C. Pant S. J. Mol. Liq. 2011;160:150. doi: 10.1016/j.molliq.2011.03.008. [DOI] [Google Scholar]
- Almeida A. K. A. Monteiro M. P. Dias J. M. M. Omena L. da Silva A. Tonholo J. Mortimer R. J. Navarro M. Jacinto C. Ribeiro A. S. de Oliveira I. N. Spectrochim. Acta, Part A. 2014;128:812. doi: 10.1016/j.saa.2014.03.012. [DOI] [PubMed] [Google Scholar]
- Zhao X.-X. Zhang J.-F. Liu W. Zhou S. Zhou Z.-Q. Xiao Y.-H. Xi G. Miao J. Zhao B.-X. J. Mater. Chem. B. 2014;2:7344. doi: 10.1039/C4TB01192A. [DOI] [PubMed] [Google Scholar]
- Tripathi A. K. Mohapatra M. Mishra A. K. Phys. Chem. Chem. Phys. 2015;17:29985. doi: 10.1039/C5CP04263A. [DOI] [PubMed] [Google Scholar]
- Aumanen J. Korppi-Tommola J. Chem. Phys. Lett. 2011;518:87. doi: 10.1016/j.cplett.2011.10.061. [DOI] [Google Scholar]
- Cao X. Mu L. Chen M. She G. Appl. Surf. Sci. 2018;441:388. doi: 10.1016/j.apsusc.2018.01.313. [DOI] [Google Scholar]
- Dakkouri M. Girichev G. Giricheva N. Petrov V. Petrova V. Struct. Chem. 2018;29:823. doi: 10.1007/s11224-018-1108-2. [DOI] [Google Scholar]
- Ayranci R. Vargün E. Ak M. ECS J. Solid State Sci. Technol. 2017;6:P211. doi: 10.1149/2.0061705jss. [DOI] [Google Scholar]
- Sun W. Bandmann H. Schrader T. Chem.– Eur. J. 2007;13:7701. doi: 10.1002/chem.200700677. [DOI] [PubMed] [Google Scholar]
- Chen Q.-Y. Chen C.-F. Tetrahedron Lett. 2005;46:165. doi: 10.1016/j.tetlet.2004.10.169. [DOI] [Google Scholar]
- Praveen L. Reddy M. L. P. Varma R. L. Tetrahedron Lett. 2010;51:6626. doi: 10.1016/j.tetlet.2010.10.043. [DOI] [Google Scholar]
- Neupane L. N. Kim J. M. Lohani C. R. Lee K.-H. J. Mater. Chem. 2012;22:4003. doi: 10.1039/C2JM15664D. [DOI] [Google Scholar]
- Kang J. Ding L. Lü F. Zhang S. Fang Y. J. Phys. D: Appl. Phys. 2006;39:5097. doi: 10.1088/0022-3727/39/23/030. [DOI] [Google Scholar]
- Gorur M. Doganci E. Yilmaz F. Isci U. J. Appl. Polym. Sci. 2015;132:42380. doi: 10.1002/app.42380. [DOI] [Google Scholar]
- Xiao Y. Guo Y. Dang R. Yanc X. Xu P. Jiang P. RSC Adv. 2017;7:21050. doi: 10.1039/C7RA00212B. [DOI] [Google Scholar]
- Mocanu S. Ionita G. Ionescu S. Tecuceanu V. Enache M. Leonties A. R. Stavarache C. Matei I. Chem. Phys. Lett. 2018;713:226. doi: 10.1016/j.cplett.2018.10.044. [DOI] [Google Scholar]
- Ronda L. Faggiano S. Paredi G. Michielon A. Sartor F. Raschini A. S. Cavatorta V. Sgarbi E. Bettati S. Mozzarelli A. J. Mol. Liq. 2020;298:111983. doi: 10.1016/j.molliq.2019.111983. [DOI] [Google Scholar]
- González-Benito J. Aznar A. Baselga J. J. Fluoresc. 2001;11:307. doi: 10.1023/A:1013974907580. [DOI] [Google Scholar]
- de Almeida A. K. A. Dias J. M. M. Silva A. J. C. Navarro M. Junior S. A. Tonholo J. Ribeiro A. S. Synth. Met. 2013;171:45. doi: 10.1016/j.synthmet.2013.03.015. [DOI] [Google Scholar]
- Della-Casa C. Costa-Bizzarri P. Lanzi M. Paganin L. Bertinelli F. Pizzoferrato R. Sarcinelli F. Casalboni M. Synth. Met. 2003;138:409. doi: 10.1016/S0379-6779(02)00500-3. [DOI] [Google Scholar]
- Ikenoue Y. Outani N. Patil A. O. Wudl F. Heeger A. J. Synth. Met. 1989;30:305. doi: 10.1016/0379-6779(89)90653-X. [DOI] [Google Scholar]
- Yanai T. Tew D. P. Handy N. C. Chem. Phys. Lett. 2004;393:51. doi: 10.1016/j.cplett.2004.06.011. [DOI] [Google Scholar]
- Cancés E. Mennucci B. Tomasi J. J. Chem. Phys. 1997;107:3032. doi: 10.1063/1.474659. [DOI] [Google Scholar]
- Cossi M. Barone V. Mennucci B. Tomasi J. Chem. Phys. Lett. 1998;286:253. doi: 10.1016/S0009-2614(98)00106-7. [DOI] [Google Scholar]
- Peach M. J. G. Benfield P. Helgaker T. Tozer D. J. J. Chem. Phys. 2008;128:044118. doi: 10.1063/1.2831900. [DOI] [PubMed] [Google Scholar]
- Roy A. Datar A. Kand D. Saha T. Talukdar P. Org. Biomol. Chem. 2014;12:2143. doi: 10.1039/C3OB41886C. [DOI] [PubMed] [Google Scholar]
- Pedone A. J. Chem. Theory Comput. 2013;9:4087. doi: 10.1021/ct4004349. [DOI] [PubMed] [Google Scholar]
- Improta R. Barone V. Scalmani G. Frisch M. J. J. Chem. Phys. 2006;125:054103. doi: 10.1063/1.2222364. [DOI] [PubMed] [Google Scholar]
- Improta R. Scalmani G. Frisch M. J. Barone V. J. Chem. Phys. 2007;127:074504. doi: 10.1063/1.2757168. [DOI] [PubMed] [Google Scholar]
- Gaussian 09, Revision C.01.
- de Souza A. R. Boza I. A. F. Ximenes V. F. Yoguin M. I. Dávila-Rodriguez M.-J. Morgon N. H. Caracelli I. Quim. Nova. 2019;42:135. [Google Scholar]
- Wang X. Xia P. Huang X. Spectrochim. Acta, Part A. 2019;210:98. doi: 10.1016/j.saa.2018.11.017. [DOI] [PubMed] [Google Scholar]
- Reichardt C. and Welton T., 2011
- Ravi M. Samanta A. Radhakrishnan T. P. J. Phys. Chem. 1994;98:9133. doi: 10.1021/j100088a007. [DOI] [Google Scholar]
- Wang S. Cao J. Lu C. New J. Chem. 2020;44:4547. doi: 10.1039/C9NJ06101K. [DOI] [Google Scholar]


