Abstract
The most important tobacco-specific nitrosamine found in cigarette smoke and formed in ageing smoke after cigarettes are extinguished is 4-(methylnitrosamino)-1-(3-pyridyl)-1-butanone (NNK). It is formed from nitrosation of nicotine, under particular conditions both in indoor and outdoor environments. NNK has been classified as a potent lung carcinogen which is expected to be found primarily in the particle-phase and to be stable in particulate matter. In this study tests have been carried out to show that a bisulfate-treated filter is more efficient than an untreated filter to collect both nicotine and NNK, and that the latter is stable in outdoor particulate matter. To characterize NNK in the outdoor environment, airborne samples were collected from 11 cities in USA, UK, Hong Kong and Malta with characteristics varying from low to high population densities and from urban to suburban to rural, and with desert characteristics and distinct climates. It has been shown that airborne particle+gas phase nicotine and particle-phase NNK behave in a linearly correlated manner. A seasonal analysis was carried out on a subset of data available from five sites in California, where the load of NNK in PM10 is driven by long range transport of the air masses passing over densely populated cities. In the winter season, the load of NNK in PM is higher than in summer in a statistically significant manner. The contamination of PM with NNK shows variability, but is observed at all sites. This paper highlights the potential risk of chronic exposure to NNK in particulate matter by the inhalation pathway.
Keywords: Tobacco Smoke, Tobacco-Specific Nitrosamines, NNK, Particulate Matter
1. Introduction
Nitrosamines are an important sub-group of organic nitrogen compounds that are found in several matrices (Farren et al., 2015) and are classified as extremely potent carcinogens by the International Agency for Research on Cancer (IARC)(Cogliano et al., 2011). They are challenging to characterise as they are found in minute quantities compared to inorganic components, hydrocarbons and oxygenated constituents of airborne particulate matter (PM) (Akyüz and Ata, 2013; Aragón et al., 2013; Chao et al., 2008; Farren et al., 2015; Häger and Niessner, 1996; Marano et al., 1982; Ramírez et al., 2012; Rounbehler et al., 1980). They are emitted directly to the atmosphere from several sources (Brown et al., 2003) but are also formed through nitrosation or oxidation/nitrosation reactions of their precursor amines (Ge et al., 2011).
Tobacco use increases significantly the nitrosamine exposure through a group termed tobacco-specific nitrosamines (TSNAs), formed by the reaction of nicotine and other alkaloids with nitrous acid and other atmospheric oxidants (Hoffmann et al., 1984; Sleiman et al., 2010). The most important TSNA is 4-(methylnitrosamino)-1-(3-pyridyl)-1-butanone (NNK) as it is classified as a group 1 carcinogen by the IARC (Hoffmann et al., 1984; IARC, 2007), is on the list of the harmful and potentially harmful constituents in tobacco products and tobacco smoke, and it has been prioritized for regulatory purposes (Gunduz et al., 2016). In recent studies NNK has been emphasised as an environmental contaminant of increasing health concern (Farren et al., 2015; Whitehead et al., 2015). Given its carcinogenic potency especially to induce lung cancer by metabolic activation (Hoffmann et al., 1994), the presence of NNK in PM can pose a potential population health risk (Apelberg et al., 2013; Farren et al., 2015; Hoffmann et al., 1991; Jacob et al., 2013; Kavvadias et al., 2009).
A higher population density and a higher tobacco smoking prevalence should result in higher airborne nicotine concentrations. Given that nicotine is subject to atmospheric reactivity, primarily with nitrous acid and ozone, it does not necessarily mean that the airborne NNK concentration will be higher. Whilst nicotine is found almost exclusively in the gas-phase (Alonso et al., 2010; Daisey, 1999), NNK is primarily found in the particle-phase (Jacob et al., 2013). In a recent study, it has been shown that PM contains a ubiquitous contribution of tobacco smoke (Aquilina et al., 2021). Although NNK tends to be very stable in the particle-phase, in chamber studies it was shown that NNK forms mainly indoors especially if nitrous acid is in high concentrations, but is reactive towards ozone and NOx (Petrick et al., 2010; Petrick et al., 2011; Sleiman et al., 2010) that would lead to its destruction. We are aware of only one study that has analysed NNK in airborne PM in London, and discussed the variability of NNK across winter and summer (Farren et al., 2015), but no studies have characterised the NNK in outdoor PM collected from various geographic locations under different atmospheric conditions. It is important to quantify the load of NNK in PM in view of the potential risk associated with the exposure to this potent carcinogen when exposed to outdoor PM, and in non-smoking indoor environments due to infiltration of PM from outdoors. For this purpose, specific tests have been carried out to check the stability of NNK in airborne PM. This is also the first study presenting an analysis of seasonal variability of NNK in terms of its load in PM, based on airborne samples collected in 11 sites, representing a range of geographic locations, from urban to rural to remote desert, in three continents.
2. Materials and Methods
2.1. Reagents and standards
Water, methanol, dichloromethane (DCM), pentane, isopropyl alcohol (IPA), ethyl acetate (EtOAc), toluene and butanol (HPLC grade) and sulfuric acid, hydrochloric acid, potassium carbonate, tetrasodium EDTA, acetone and ammonium formate (reagent grade) were purchased from Fisher Scientific, USA. Nicotine-d4 used as an internal standard was synthesized and converted to the tartrate salt as described by (Jacob et al., 1988). Nicotine-d0 base was purchased from Sigma Aldrich, USA, and converted to the tartrate salt based as previously described in (Jacob et al., 1988). Deuterated NNK (NNK-d4) and NNK-d0 were purchased from Toronto Research Chemicals, Canada. The Standard Reference Material (SRM) 1649b (Urban Dust) was purchased from the National Institute of Standards and Technology, USA.
2.2. Potential in situ formation and stability of NNK and collection efficiency of filters
Three tests were performed to characterise the nature of NNK in airborne PM samples.
Test 1: A test was run to check if any NNK collected on a quartz fibre filter is a sampling artefact due to in situ formation. A 100 mL bisulfate solution was prepared as described by (Leaderer and Hammond, 1991) and was spiked with 1 mL of 2 mg mL−1 nicotine-d4 base in 0.02N hydrochloric acid. The solution was placed in a DCM cleaned trough and two filters were allowed to soak in the solution for 30 minutes, then allowed to dry in a fume hood and stored in foil in a freezer. One control filter was left in the freezer and the other filter sampled air for 6 hours at an average flowrate of 1.22 m3 min−1 at the San Francisco site where HONO concentrations are expected to be low, consistent with the typical North American urban background. Diurnally-averaged concentrations measured in Bakersfield, CA were below 0.5ppb (VandenBoer et al., 2014). The two filters were extracted and analysed together for any deuterated NNK formed during sampling.
Test 2: If NNK does not degrade when exposed to normal atmospheric conditions, then the sum of the NNK collected on two consecutive 24-hour samples should add up to a co-located 48-hour sample. Several samples were run to check the stability of NNK.
Test 3: Although the use of a bisulfate-treated filter is used primarily used to capture the gas+particle phases of nicotine, the efficiency of the use of such filters in the collection of NNK needed to be evaluated. For this purpose, two identical calibrated Leckel low-volume samplers with PM2.5 heads were used to collect several concurrent 24-hour samples at an average flowrate of 0.038 m3 min−1, one loaded with a bisulfate-treated filter and the second with an untreated one.
2.3. Outdoor atmospheric sampling
Airborne PM samples were collected at different times from eleven sites in four countries with different, characteristic microclimates. The sites were Bakersfield (BCA), Canebrake (CB), Sacramento (STS), Yosemite Village (YTD), Shasta Lake (SLM) in 2010 and San Francisco (SF) in 2016 in California, USA, Tseung Kwan O Industrial Estate (MA), Tseung Kwan O (TKO) and Tin Shui Wai (TSW) in Hong Kong, China in 2014–2015, Birmingham (BHAM), UK in 2016, and Msida (MSD), Malta in 2016 and 2018. The sites represent a variety of industrial, urban, suburban and rural settings. The sampling site information, sampling periods, instrumentation and filters used, PM fractions collected, calibration protocols and other details are discussed in (Aquilina et al., 2021). Whenever bisulfate treated filters were used, the samples were analysed for both nicotine and NNK.
2.4. Sample Preparation
2.4.1. Working standards
The concentrations of the standards, which span the expected range were typically 0.025–100 ng mL−1 for NNK and 4–1200 ng mL−1 for nicotine. For quality assurance purposes, 1, 2, 5 and 10 ng mL−1 NNK-d0 spiked filters and 5, 10, 125, 370 and 1111 ng mL−1 nicotine-d0 were included with every 10 samples. Field and analytical blank filters were run every five samples.
2.4.2. Extraction and Analyses of Nicotine and NNK
Details of the filter extraction, extract purification and concentration, and parameters for the analyses of NNK by LC-MS/MS and Nicotine by GC-MS/MS are described in our previous paper (Aquilina et al., 2021) and (Whitehead et al., 2015) and shown as a schematic summary in Figure 1. The same procedure was applied on 10 mg of SRM 1649b-Urban dust.
Figure 1:
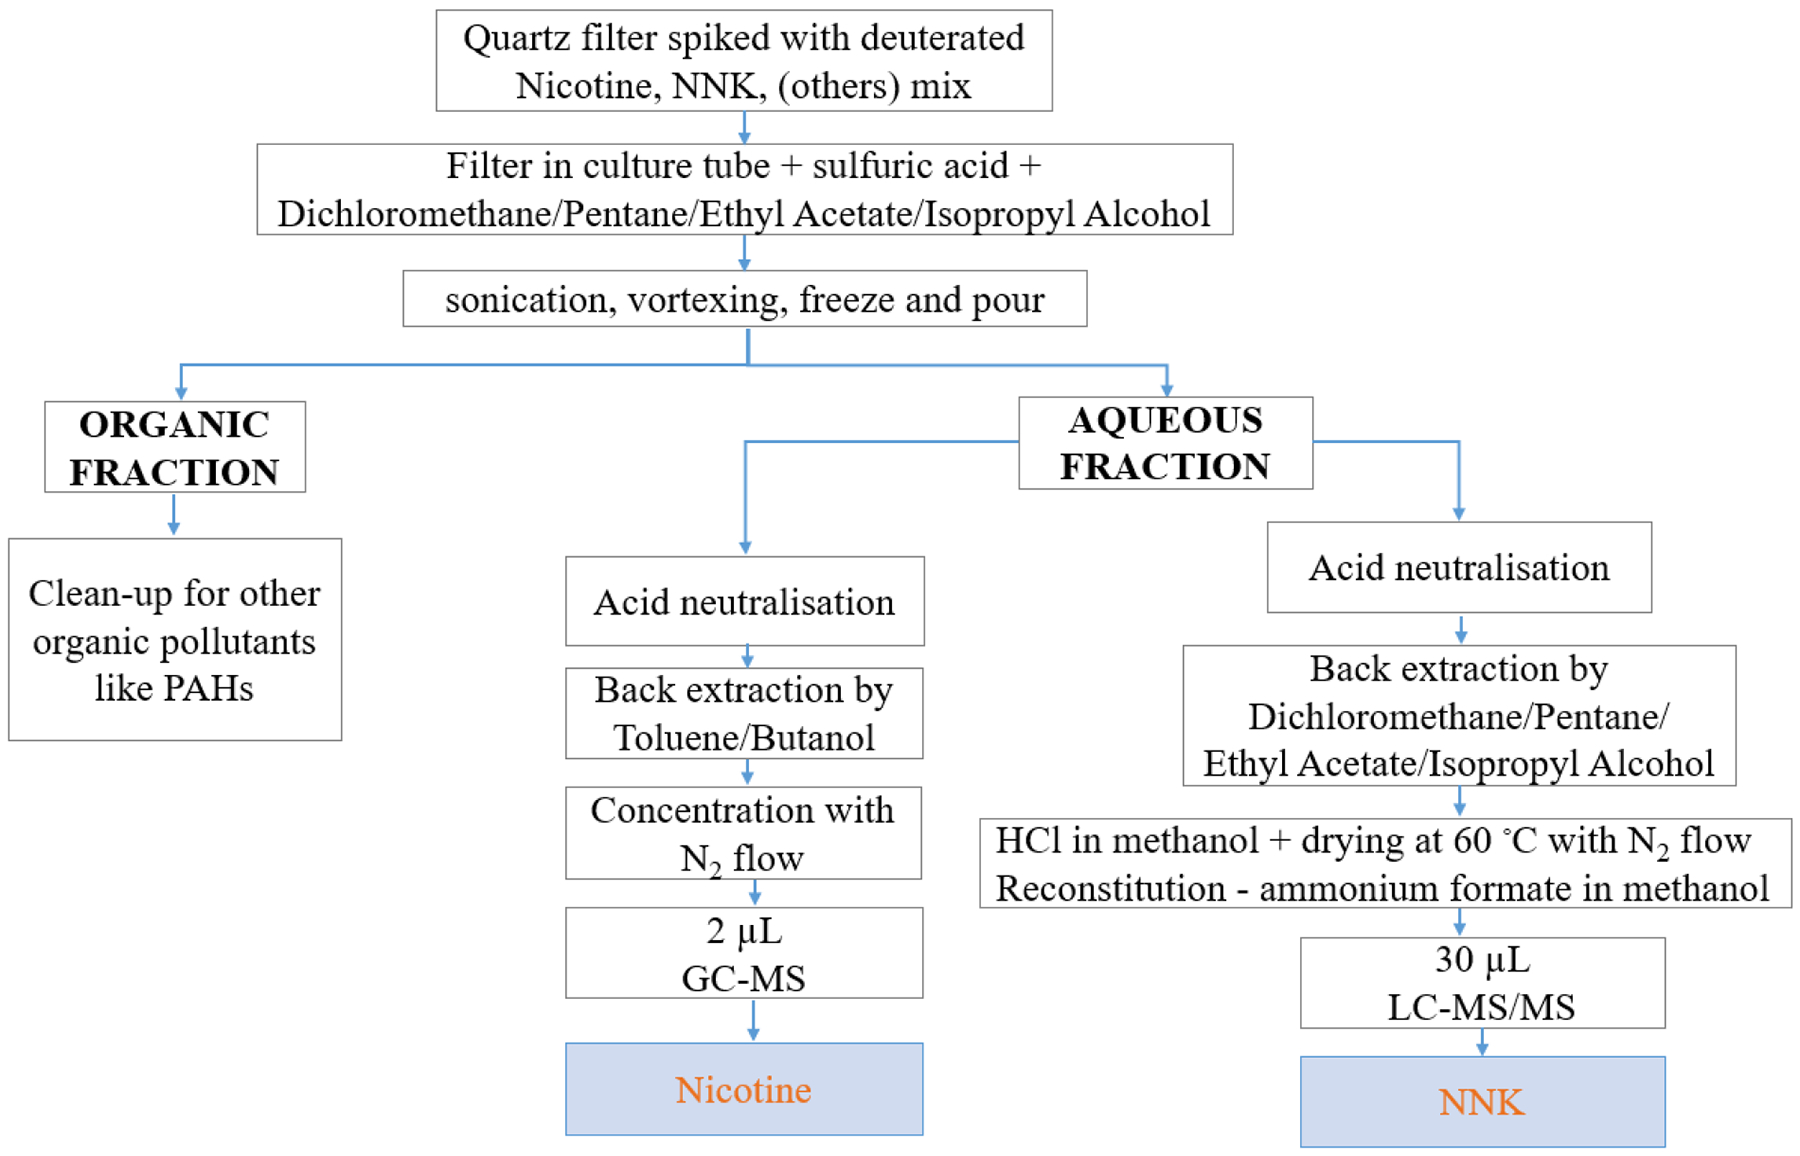
Schematic diagram for sample preparation, extraction, cleaning and analysis of Nicotine and NNK.
3. Results and Discussion
3.1. Extraction of filters and analytical method validation
Performance of the analytical method including precision and accuracy, Limits of Quantitation (LOQs) and analysis of blanks that verify lack of interfering substances is summarized in Table 1. Precision and accuracy of the method were determined from the results of analysis of the spiked filters described above. LOQs were determined as the minimum quantity on the calibration curve that does not exceed an RSD of 15% for blank filters or blank filters spiked with analytes. For NNK the LOQ was 0.025 ngmL−1. The details of the performance for the analytical method for nicotine are described in our previous paper (Aquilina et al., 2021) . As part of the analytical quality control protocol to document the precision of the analytical method, the amount of nicotine and NNK found in the SRM 1649b analysed during this study are reported. These compounds are not listed in the NIST certificate of this SRM and therefore the results for precision only are reported. During the method development for the analysis of alkaloids in house dust, from a very limited number of samples (N = 2), the mean NNK level in the same SRM used in this study was 11.6 ng/g and for nicotine it was 66,000 ng/g (Whitehead et al., 2015). In this study, similar results for more samples (N = 9) and with higher confidence can be reported. The mean NNK was 6.8 ng/g (RSD 13.1%) and mean nicotine was 52,800 ng/g (RSD 8.4%). The validation data for the proposed method is considered suitable and is comparable to the previously reported method (Jacob et al., 2013).
Table 1:
Precision and accuracy for determination of NNK in analyte spiked filters used as QC samples.
| Analyte | Added Amount (ngmL−1) | Measured Mean (ngmL−1) | Accuracy (% of Expected) | Precision (%RSD) |
|---|---|---|---|---|
| NNK | 0a | BLOQ | NA | NA |
| LOQ = 0.025, N = 44, 16 Analytical Runs | 0b | BLOQ | NA | NA |
| 0c | BLOQ | NA | NA | |
| 1 | 1.11 | 111 | 10.8 | |
| 2 | 1.77 | 88 | 10.5 | |
| 5 | 5.51 | 110 | 2.7 | |
| 10 | 11.2 | 112 | 5.3 |
Analytical blanks;
Travel blanks;
Field blanks;
N: Number of replicate samples; LOQ: Limit of Quantitation; BLOQ: Below Limit of Quantitation; RSD: Relative Standard Deviation; NA: Not Applicable
3.2. Characterising the nature of NNK in airborne PM samples
Acidic conditions tend to favour nitrosation. In the NNK molecule, protonation of the pyridine nitrogen would protect it from oxidation at that site but perhaps not against reactions at the side chain, with the carbonyl group. This means that here we have to give a caveat. NNK can show an intrinsic and significant reactivity under normal atmospheric conditions.
Figure 2(a) represents the relationship of the load of NNK in total particulate matter (TPM) as compared to the nicotelline (the tobacco–smoke derived particulate marker) load in TPM from a chamber study involving reference cigarettes smoked by a machine as described in (Schick et al., 2014; Whitlatch and Schick, 2019). Tobacco smoke was aged for 30 minutes, where upon emission, the smoke undergoes many changes, loss of SVOCs from PM and further chemical reactions due to reactive species. The large intercept may be attributed to the above and to the fact that NNK is present in tobacco and formed by pyrosynthesis during the combustion.
Figure 2:
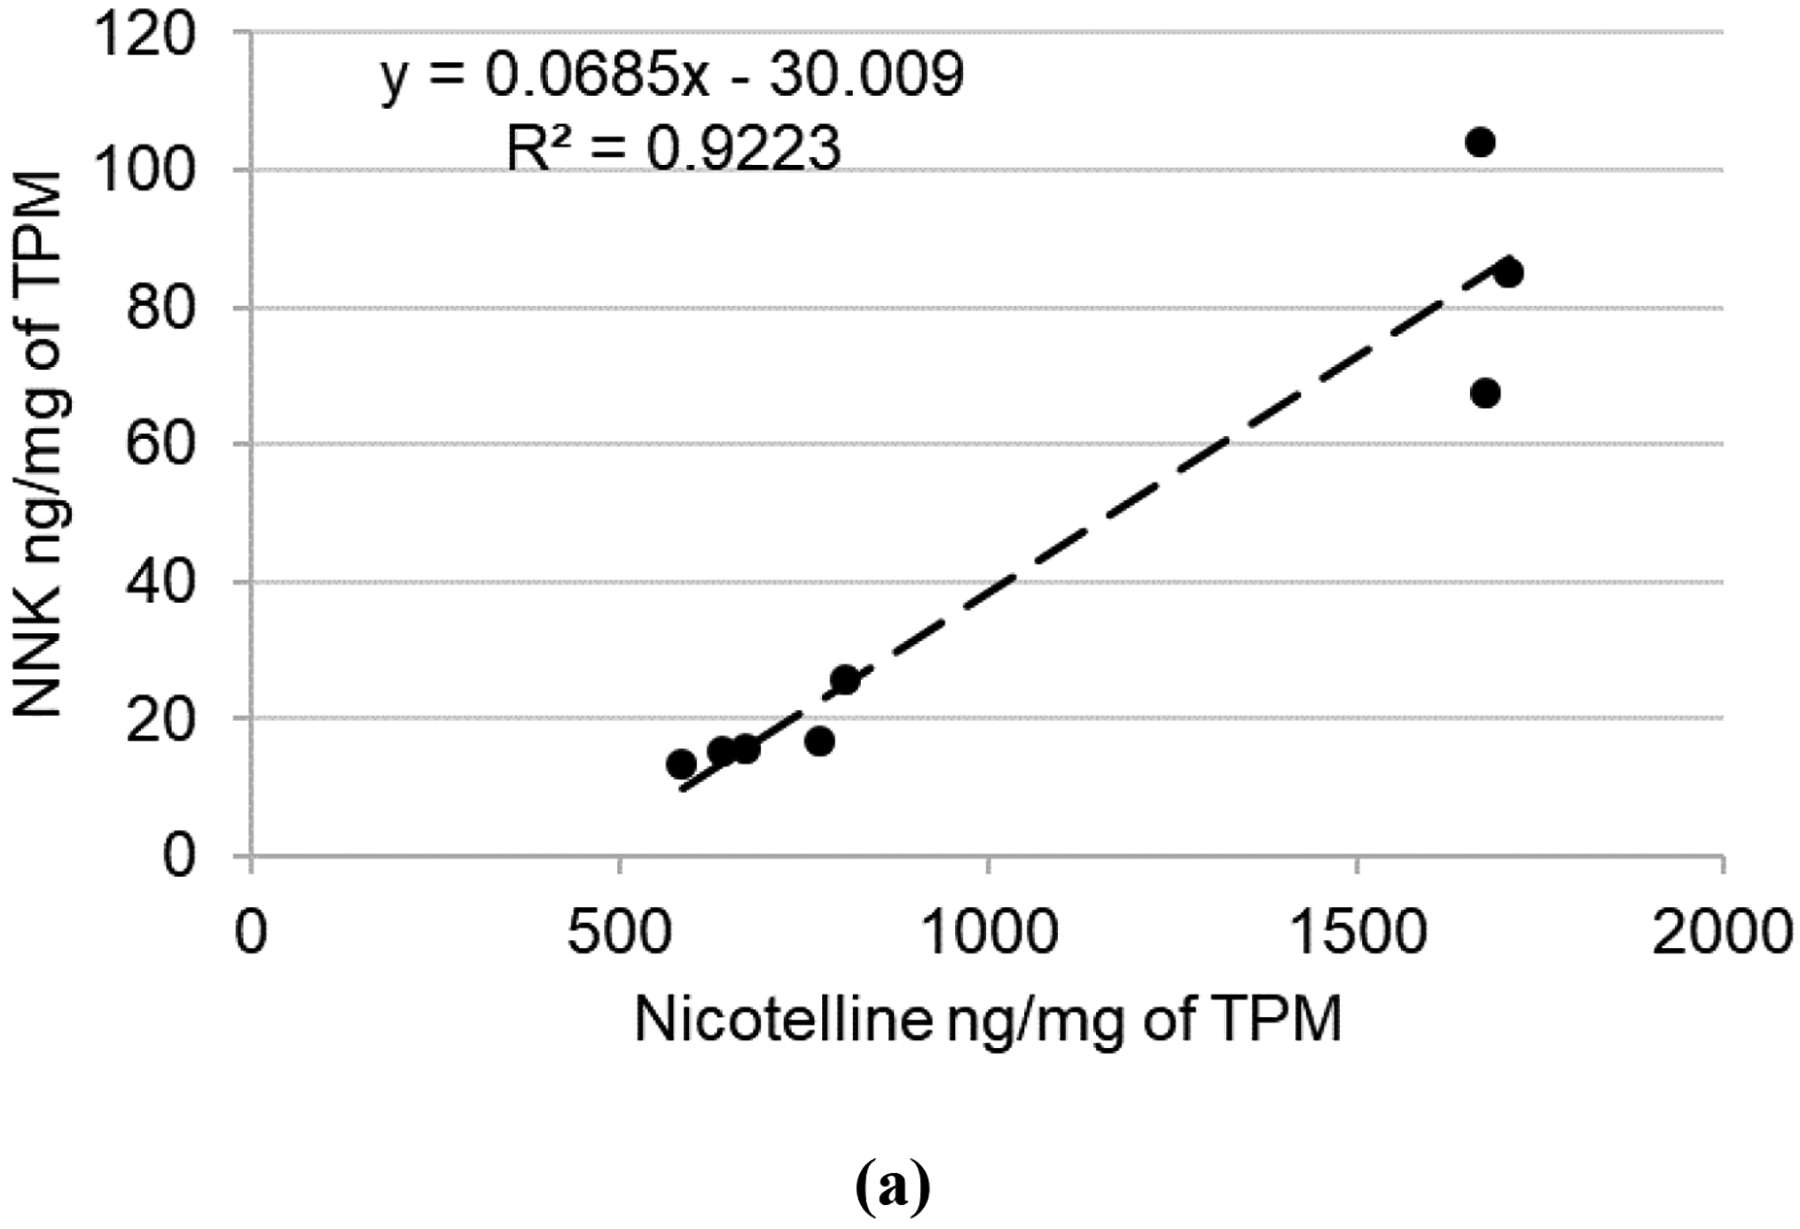
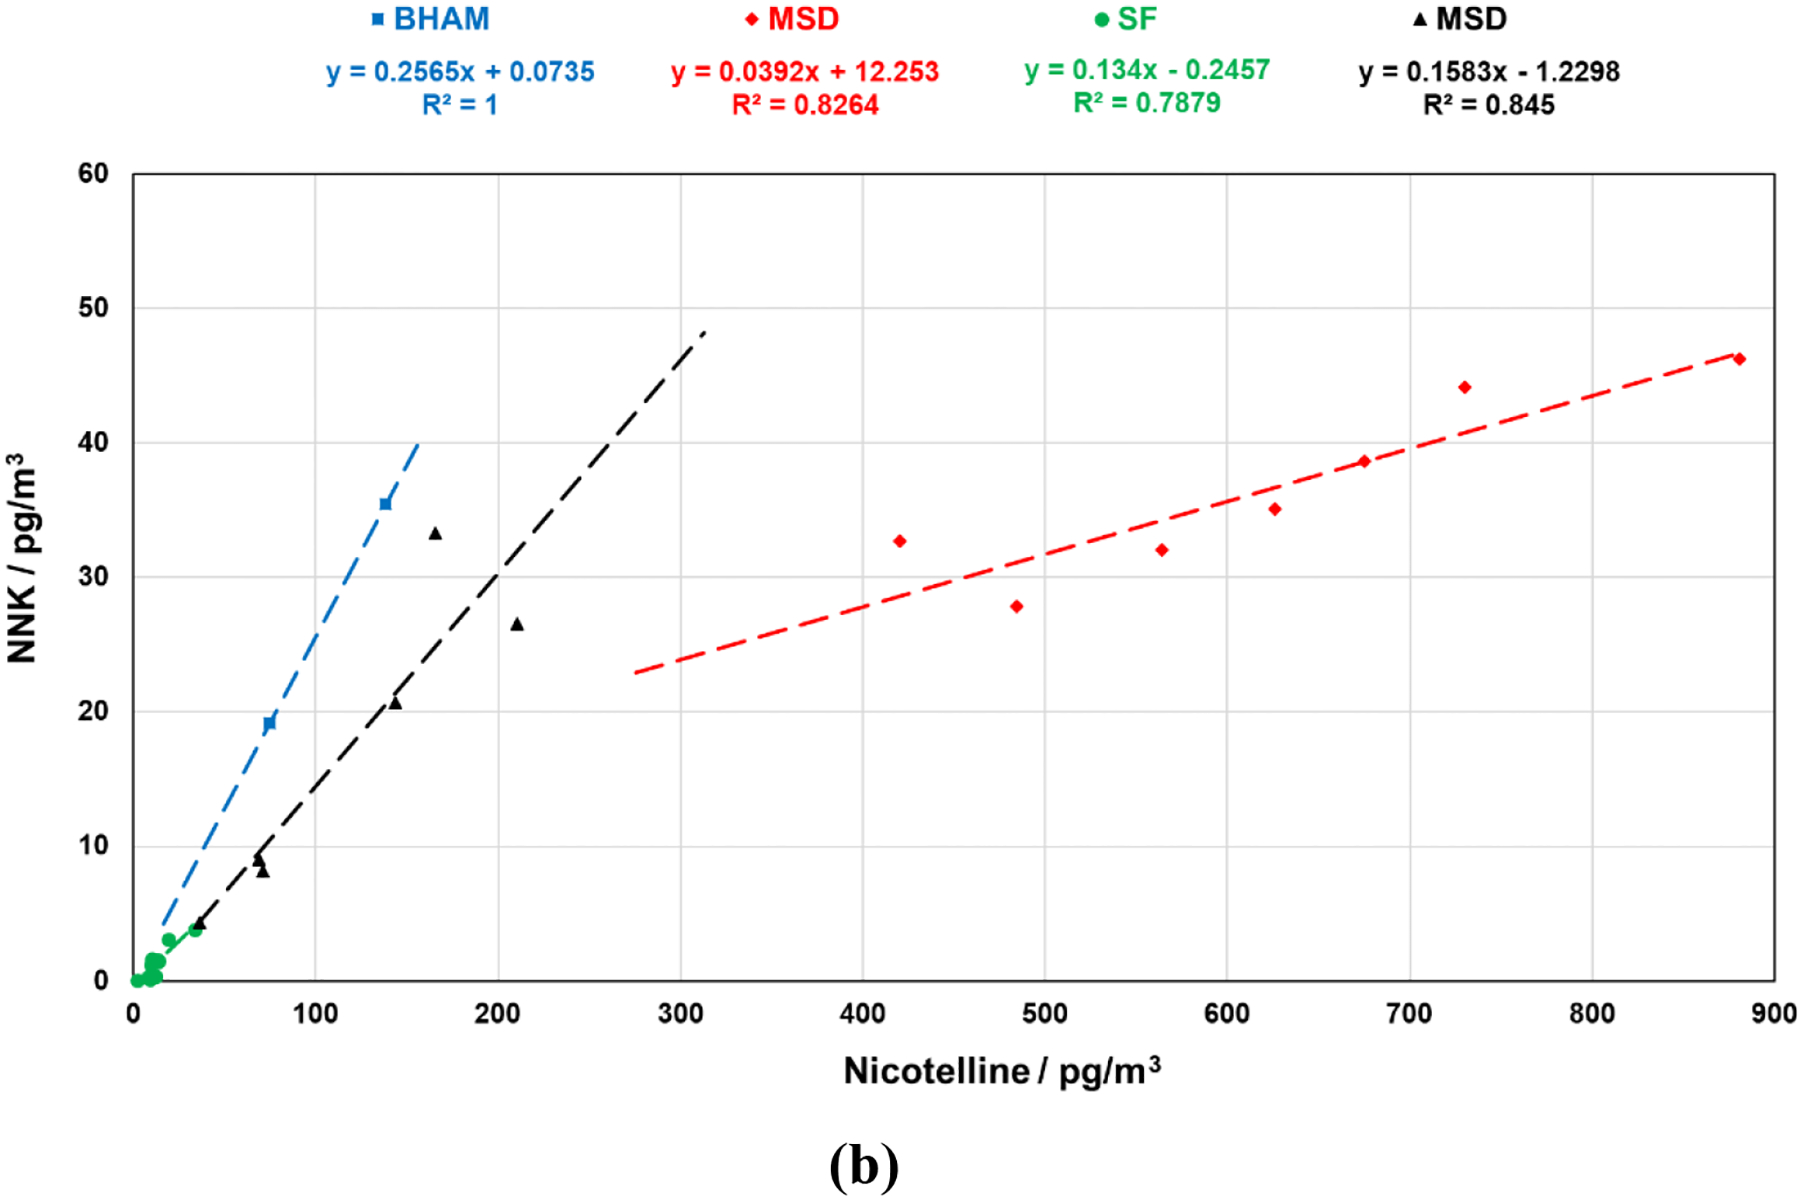
(a) NNK vs Nicotelline in Total Particulate Matter (TPM) in chamber study and (b) airborne NNK vs Nicotelline in Birmingham (BHAM-PM10-■), San Francisco (SF-TSP-●) and Msida (MSD-PM10-◆) in 2016 and Msida (MSD-PM2.5-▲) in 2018 on treated filters.
Figure 2(b) shows the relationship of airborne NNK and nicotelline under normal atmospheric conditions. These samples were collected in this study on treated filters and in different PM fractions. Taking into account the caveat explained above, the relationship between NNK and nicotelline in both chamber and atmospheric data is consistent. The slope of Figure 2(b) is higher than that in Figure 2(a) most probably indicating that NNK may have formed from nicotine under normal atmospheric conditions.
Test 1: Potential formation of NNK and stability: From the analysis of the pre-treated control and the sampled filters that were both spiked with nicotine-d4 as described in Section 2.2, no deuterated NNK was detected, confirming that in situ formation of this compound on the filter during outdoor sampling did not occur at a significant rate. From the indoor scenario study by Sleiman et al., NNK forms rapidly (≈3 hours) and then undergoes partial degradation by nitrous acid, to reach steady-state concentrations (Sleiman et al., 2010). A sampling volume of 440 m3 was collected. This represents a substantial volume to collect sufficient PM to check if detected NNK is a sampling artefact.
Test 2: From the co-located sampling experiment (N = 7) described in Section 2.2 to compare the collection efficiency of a bisulfate-treated filter (T) to an untreated filter (U), the average NNK mass obtained on a T filter was 0.88 ± 0.55 (in ng ± SD) and 95% confidence interval (0.37–1.39 ng) as compared to the average NNK mass on a U filter which was 0.42 ± 0.29 and 95% confidence interval (0.14–0.69 ng). The ratio of NNK mass collected on T filters to that collected on U filters (T/U) is 2.35 ± 1.29 (mean ± SD). The regression of the T to U filters data indicates a slope of 1.06 (p < 0.186) (see Figure 3). For nicotine, the average nicotine mass obtained on a T filter was 1719 ± 1108 (in ng ± SD) as compared to that on a U filter which was 291 ± 426 ng. The T/U ratio is 15.4 ± 18.8, as expected due to, primarily, the volatility of the nicotine base. Given the small datasets, a Mann-Whitney U non-parametric test was run for NNK and nicotine mass on T and U filters. The T filters have the highest NNK and nicotine mass from the highest mean ranks and the test statistics indicate that for nicotine, there is a statistically significant difference between the treatments (p = 0.006) whilst for NNK there is no statistical difference between the U and the T filters (p = 0.062), yet T filters appear to be more efficient in collecting NNK as summarised in Table S1 in the Supporting Information (SI).
Figure 3:
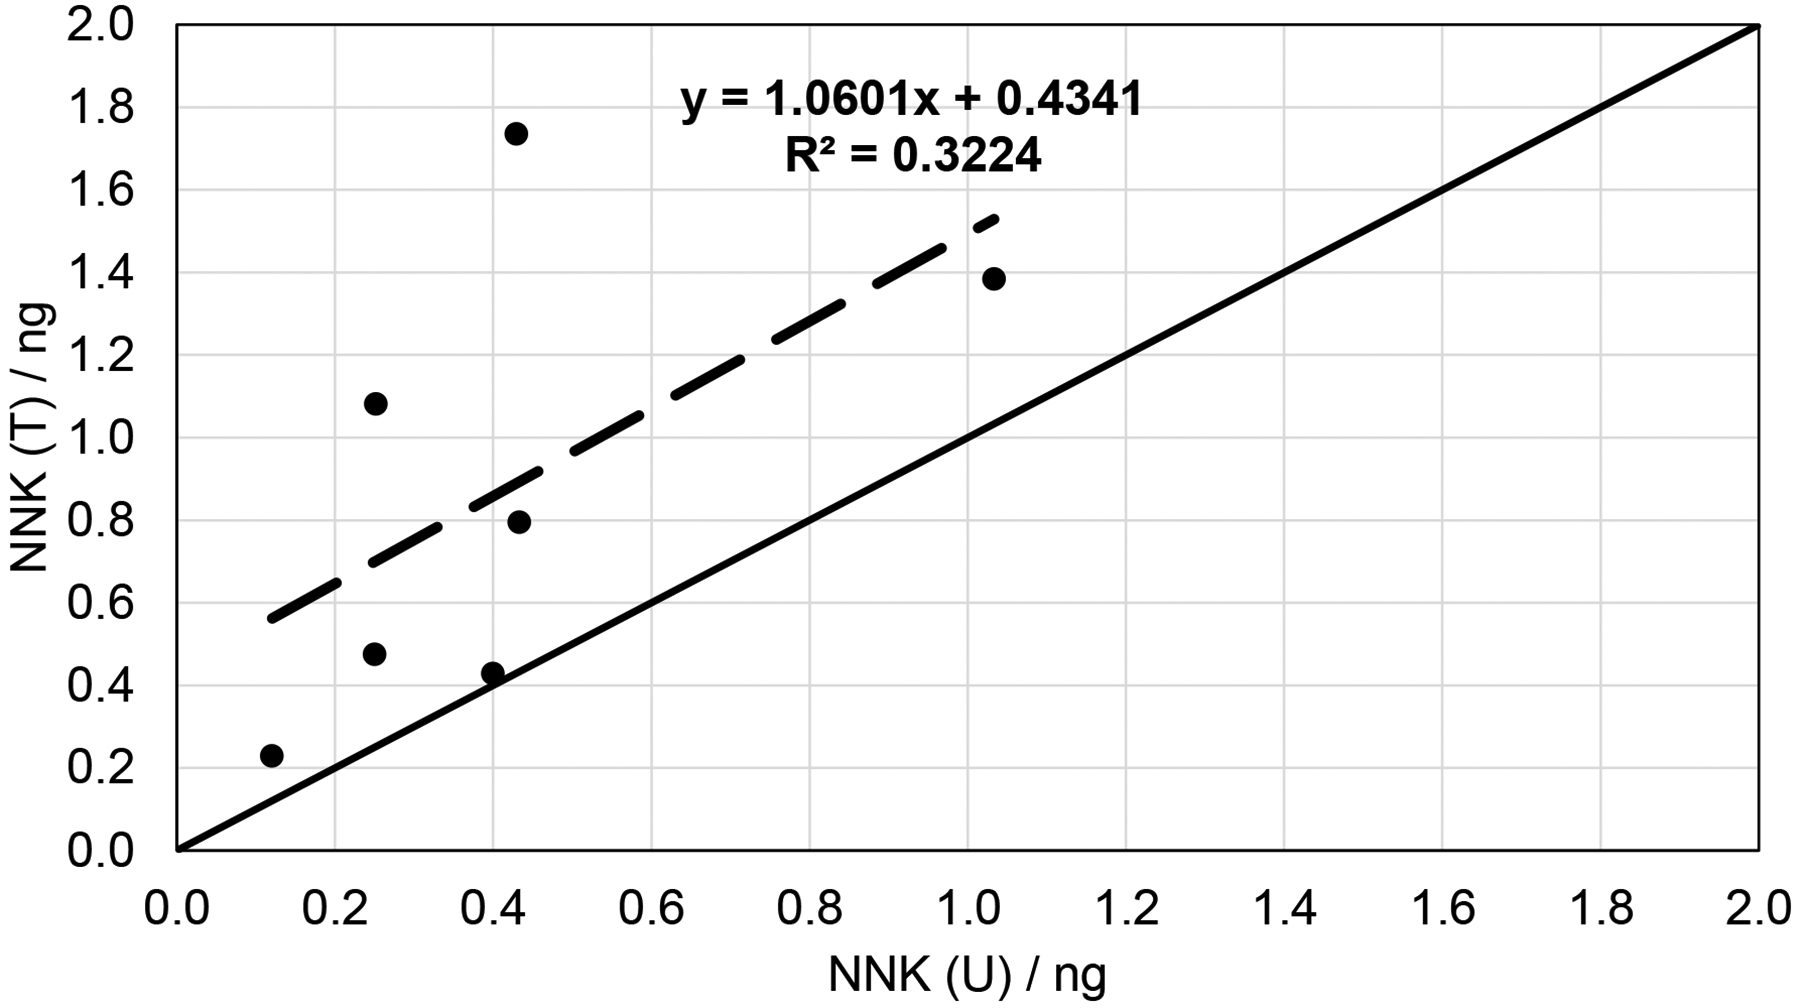
NNK (in ng) on bisulfate-treated (T) and untreated (U) filters. (Solid line represents Y = X).
Test 3: When untreated filters were exposed to the same atmospheric conditions, the ratio of the average NNK mass on the filter after 48 hours to the sum of two 24-hour consecutively sampled filters was 1.17 ± 0.25 ng. From the individual instances it could be noted that in some cases the 48-hour samples had more material than the individual 24-hour samples and in some cases the opposite happened. In principle, the degradation of NNK on the filter is minimal however under specific atmospheric conditions it could not be excluded that the 48-hour filter gave rise to further nitrosation of the collected nicotine or degradation of NNK in comparison to the 24-hour filters that were immediately removed from the sampler and stored away at −20°C.
3.3. Airborne Nicotine versus NNK
Aquilina et al. have shown that PM has a ubiquitous percentage of secondhand smoke-derived particulates (0.03–0.08%) that is influenced by population density and also by tobacco smoke prevalence (Aquilina et al., 2021). In order to verify if the airborne NNK is sensitive to these characteristics, namely by comparing to airborne nicotine, samples using bisulfate-treated filters were collected from cities that have different urban fabric and climates as shown in Figure 4. The figure also shows that NNK in PM is proportional to nicotine even if different PM size fractions were sampled. Msida (MSD) was sampled twice in 2016 and 2018 across the colder months (Oct-Dec). The sampler in San Francisco (SF) (Aug–Sep) collected Total Suspended Particulates (TSP) where one would expect higher concentrations of NNK. This was the only site where sampling was done at a much higher elevation from the ground compared to the other locations. The samples in Birmingham (BHAM) were collected in the cold months (Oct-Nov) where NNK was quantified only in two out of fourteen samples. Samples below the LOQ were replaced by 0.5×LOQ. The concentration of nicotine was also very low (median - 2280 pgm−3 and Interquartile Range - 3141 pgm−3) compared to the other cities and thus most probably, loss of nicotine, resulted in NNK values to be below the LOQ. This tentative conclusion is supported by the study by Aquilina et al., where the airborne concentration of nicotelline, was also low in Birmingham, compared to the other cities (Figure 2(b)). Furthermore, although NNK is degraded by photochemically-produced hydroxyl radicals (Pitts et al., 1978), it does not contain chromophores that absorb at wavelengths >290 nm and therefore would not be expected to be susceptible to direct photolysis by sunlight (National Center for Biotechnology Information, 2021).
Figure 4:
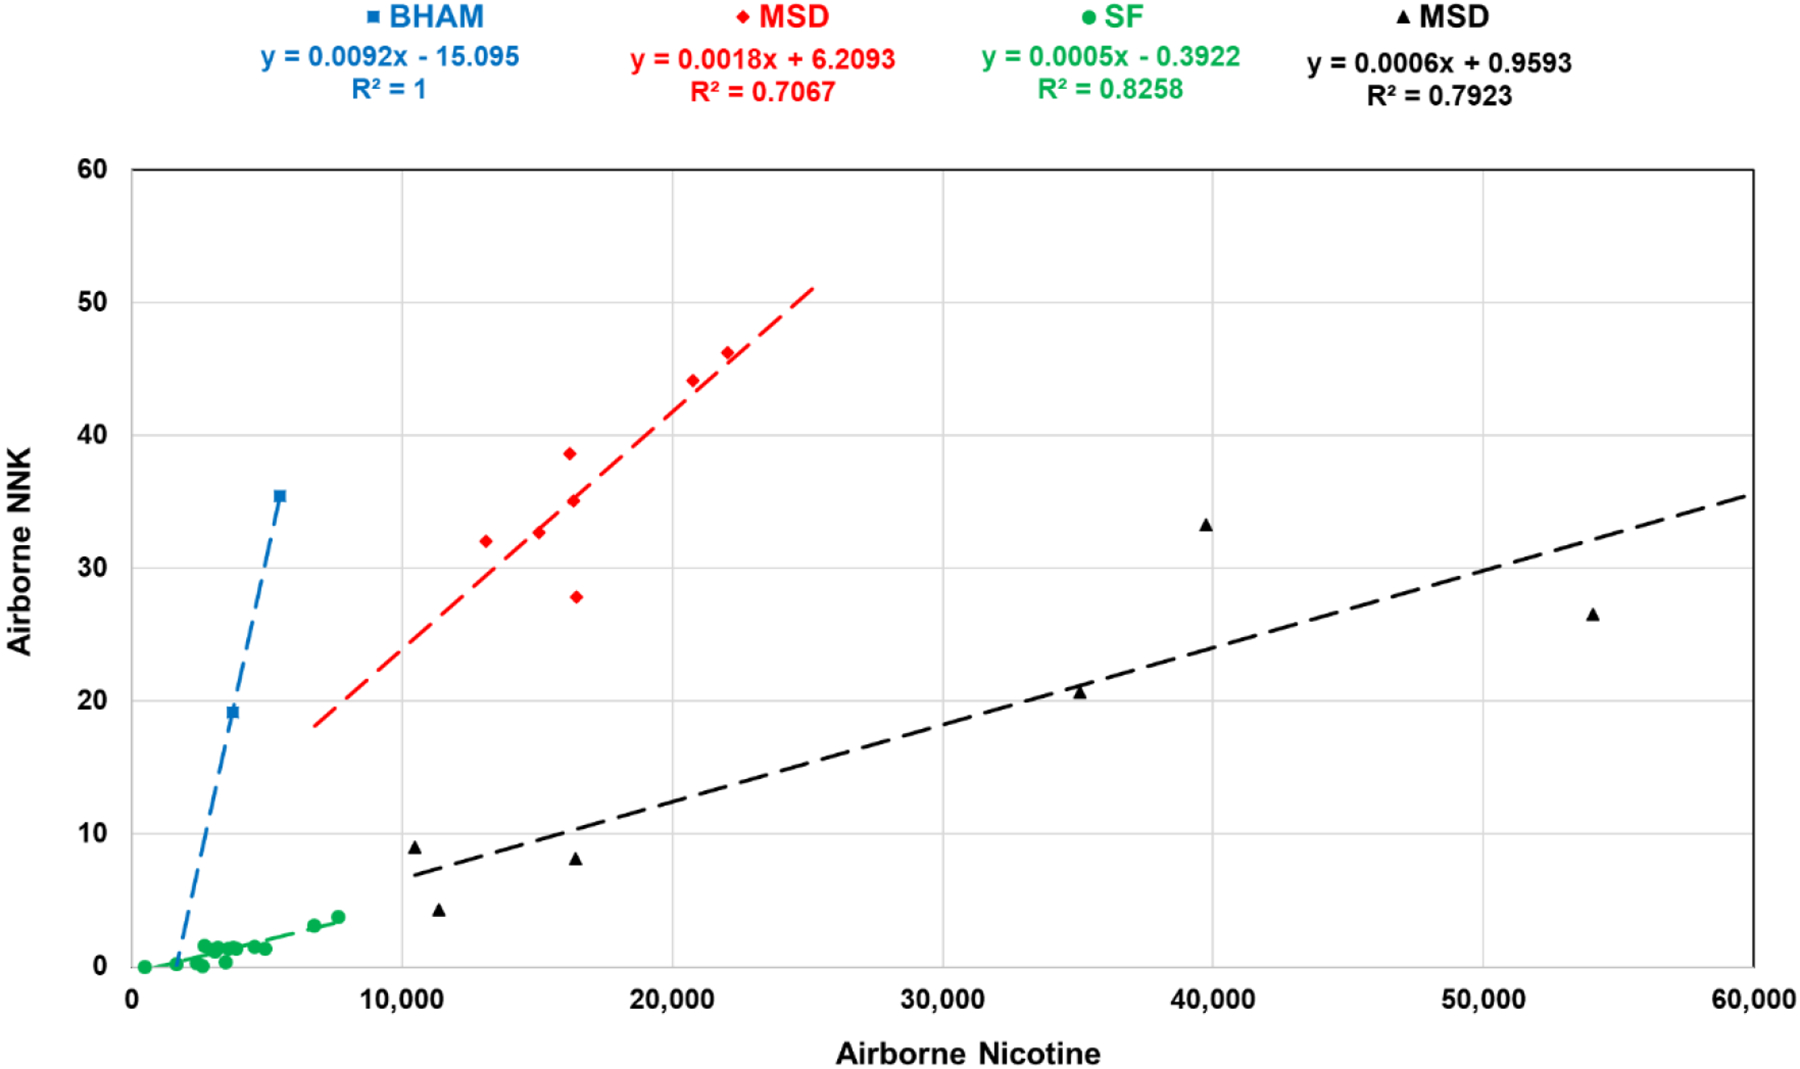
Airborne NNK vs nicotine (both in pgm−3) in Birmingham (BHAM-PM10-■), San Francisco (SF-TSP-●) and Msida (MSD-PM10-◆) in 2016 and Msida (MSD-PM2.5-▲) in 2018.
Further statistics associated with airborne nicotine and NNK are described in Table S2 in the SI.
3.4. Spatial and seasonal variability of NNK
Samples collected every week in 2010, in five cities in California (Figure 6(a)), were accompanied by the 24-hour average PM10 gravimetric concentrations. BCA and STS are areas with densely built environment with a population of less than 0.5 million inhabitants. SLM and YTD are defined as suburban, whose population increases considerably in the summer periods. CB is a very small, low populated, rural desert village. The sites were exposed to annual mean winds < 2 ms−1 apart from YTD and CB that were characterised by mean winds typically > 4 ms−1 throughout the year (Aquilina et al., 2021).
Figure 6:
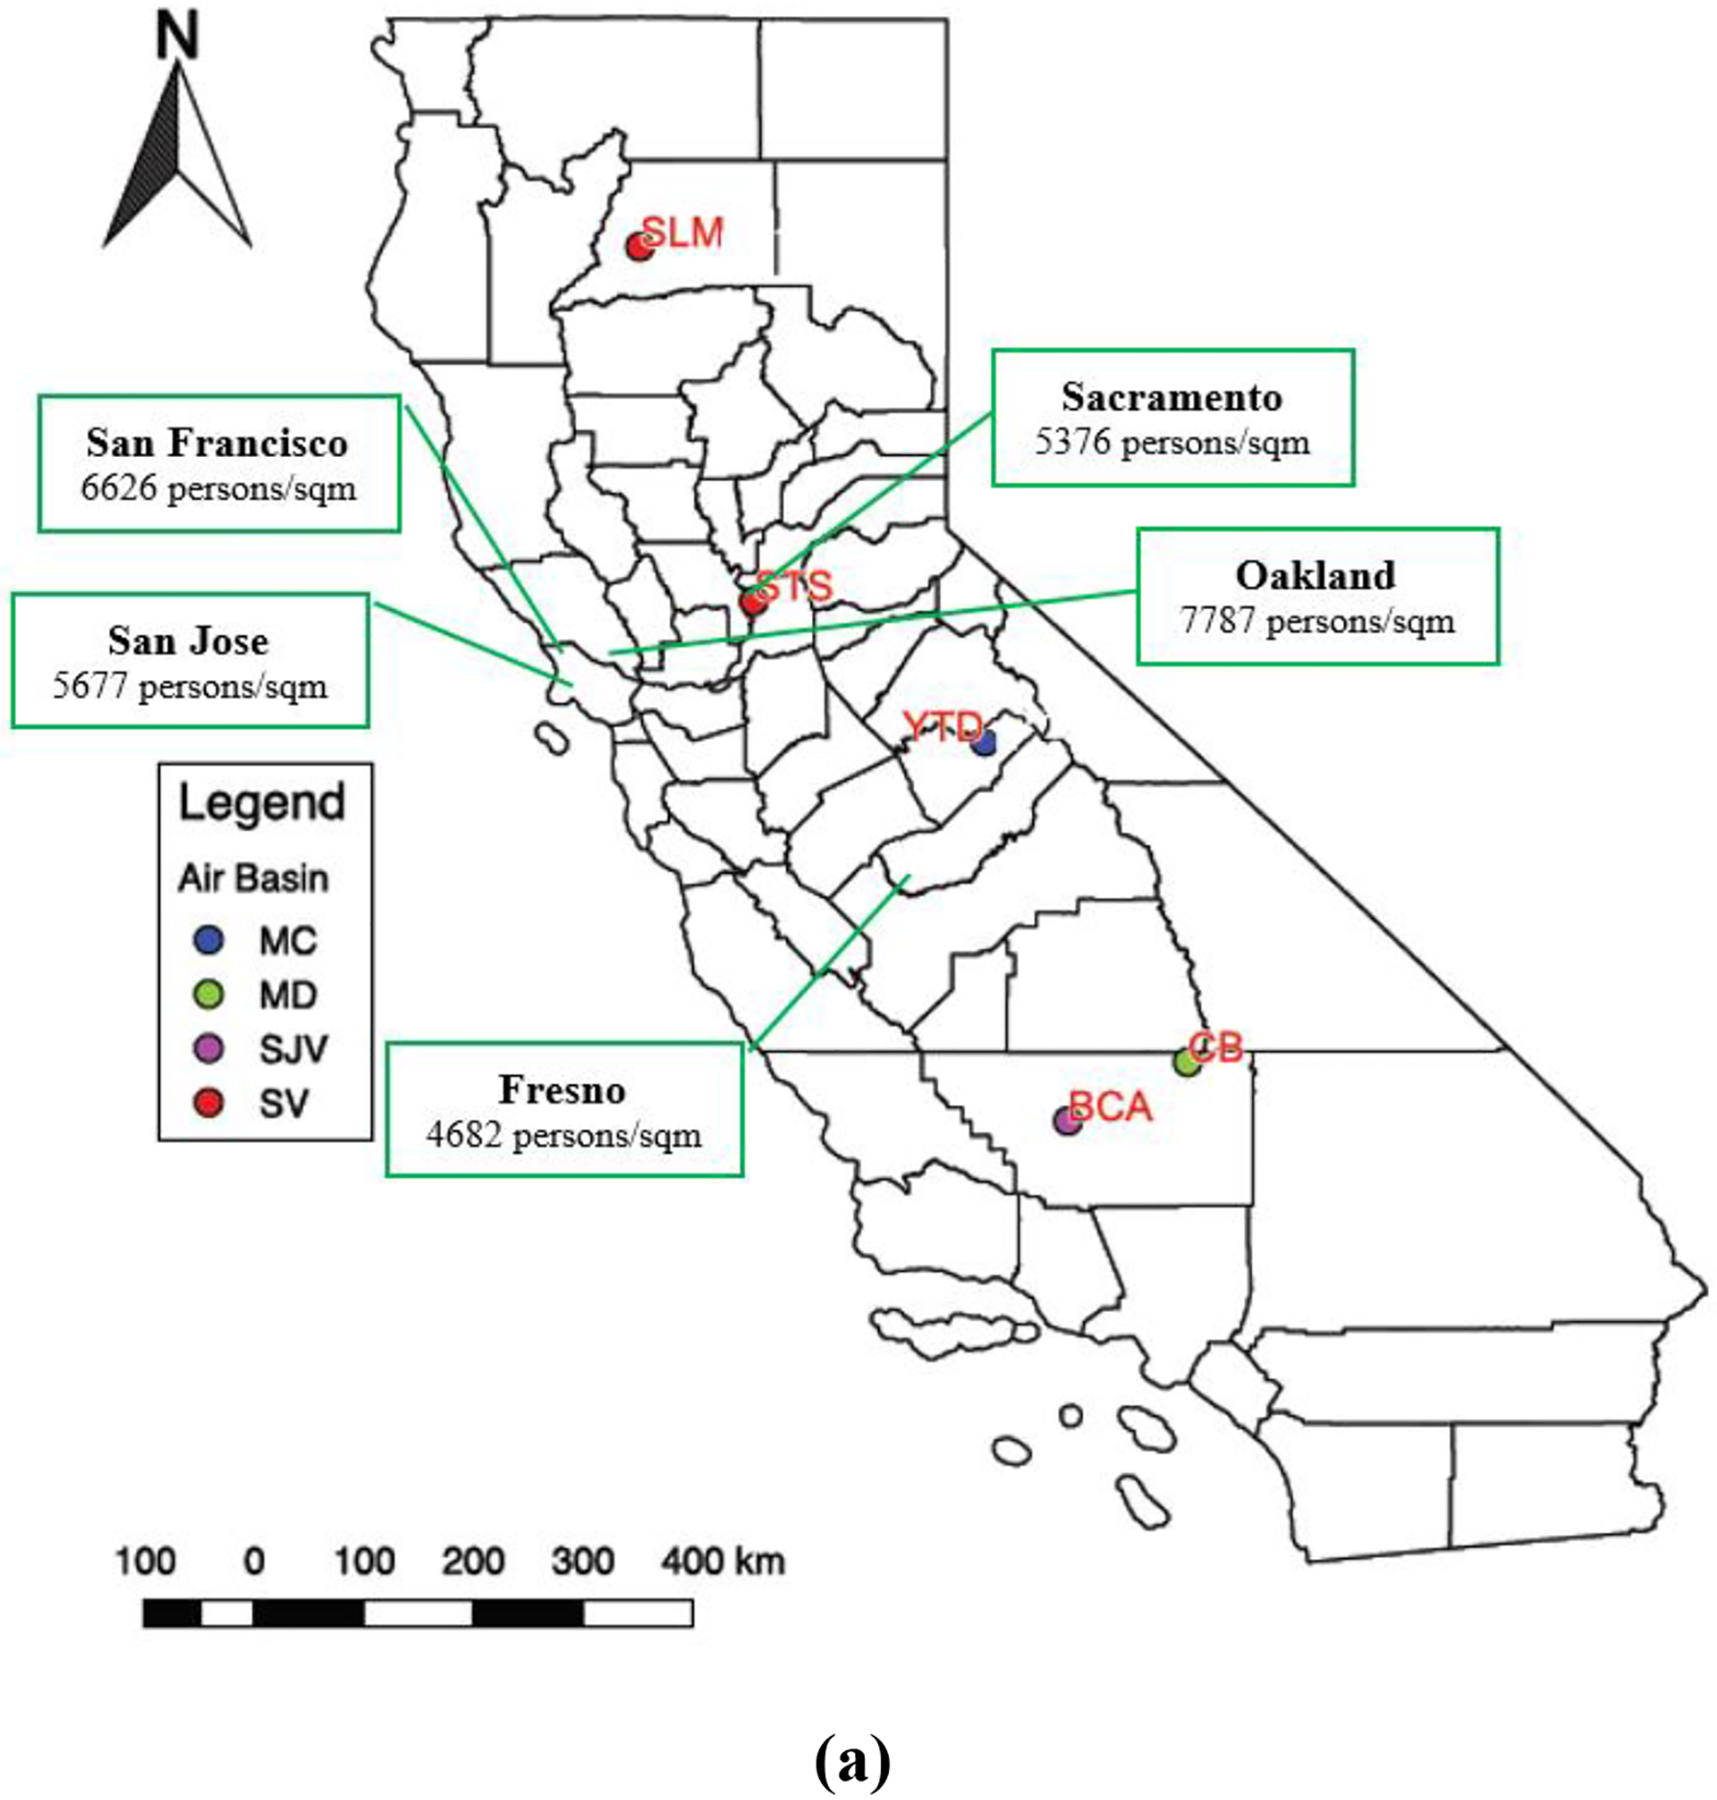
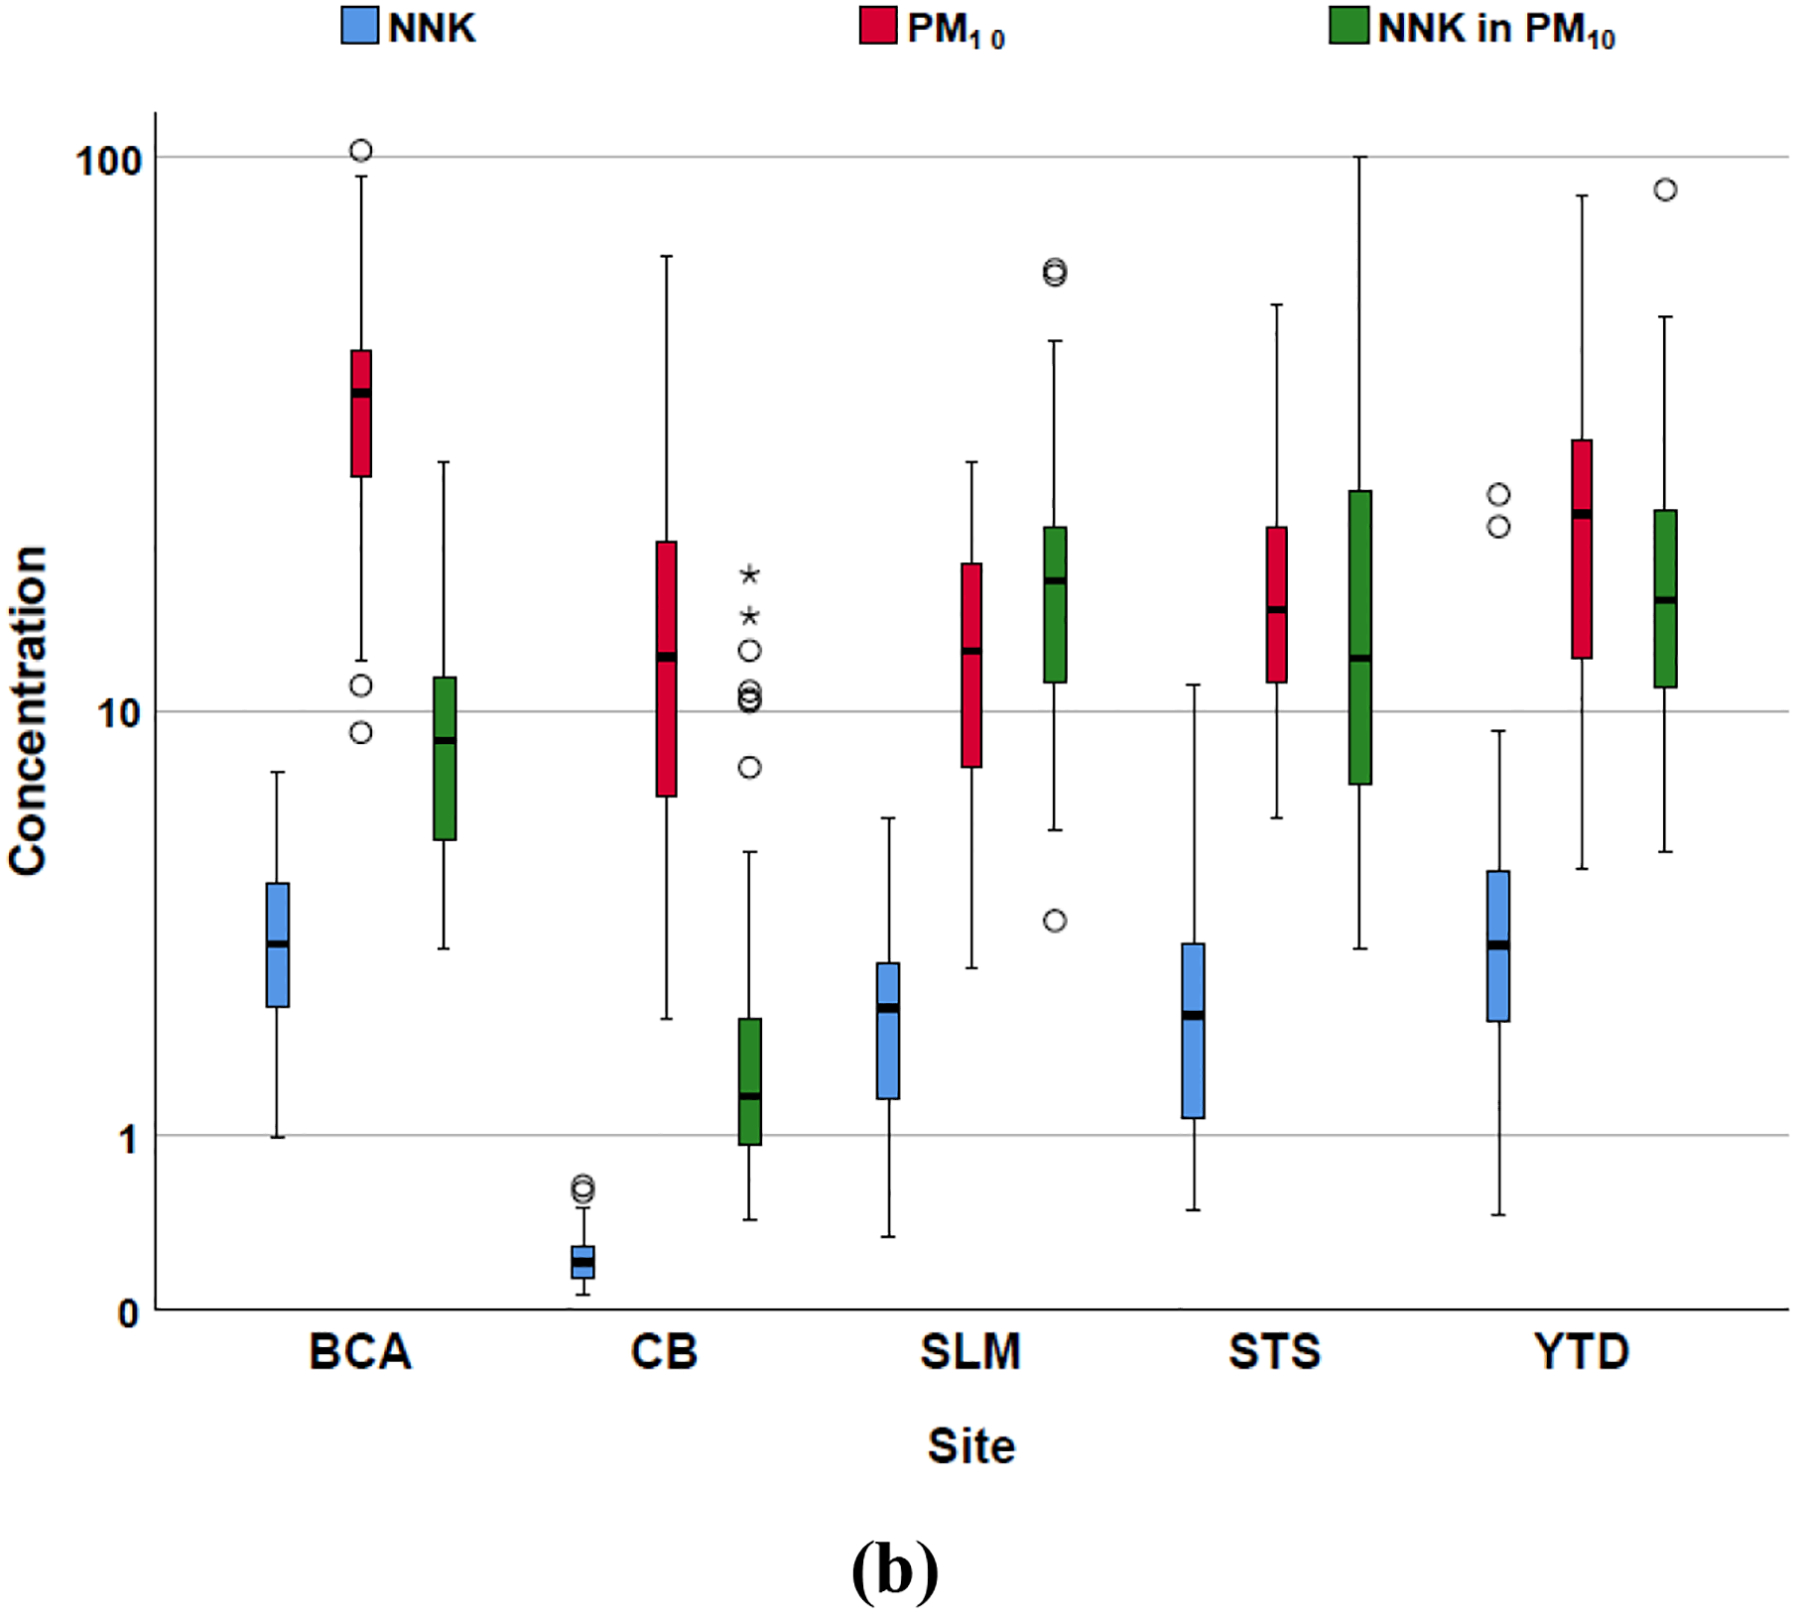
(a) Locations of sites in California within different air basins and (b) NNK (in pgm−3) and PM10 concentrations (in μgm−3) and NNK in PM10 (×10 ng/g) for different sites in California in 2010.
In our previous paper (Aquilina et al., 2021), the untreated filters were also analysed for nicotelline. NNK was compared to nicotelline for each site, as shown in Figure 5. With reference to Figure 2, even for untreated filters, the relationship between NNK and the marker nicotelline is appreciably linear and compared to the chamber data certainly some loss of NNK occurs under normal atmospheric conditions. For the cities here studied, the claim that nicotine and NNK concentrations vary linearly (as also noticed in Figure 4), is a characteristic depending both on population densities and smoking prevalence, is supported by air masses passing over the major and densely populated cities such as Sacramento, San Francisco, San Jose, Fresno and Oakland (Figure 6(a)) that appear to contribute to higher NNK concentrations in the sites closer to these cities, unlike CB. Further details are provided in Figures S1–S5 in the SI.
Figure 5:
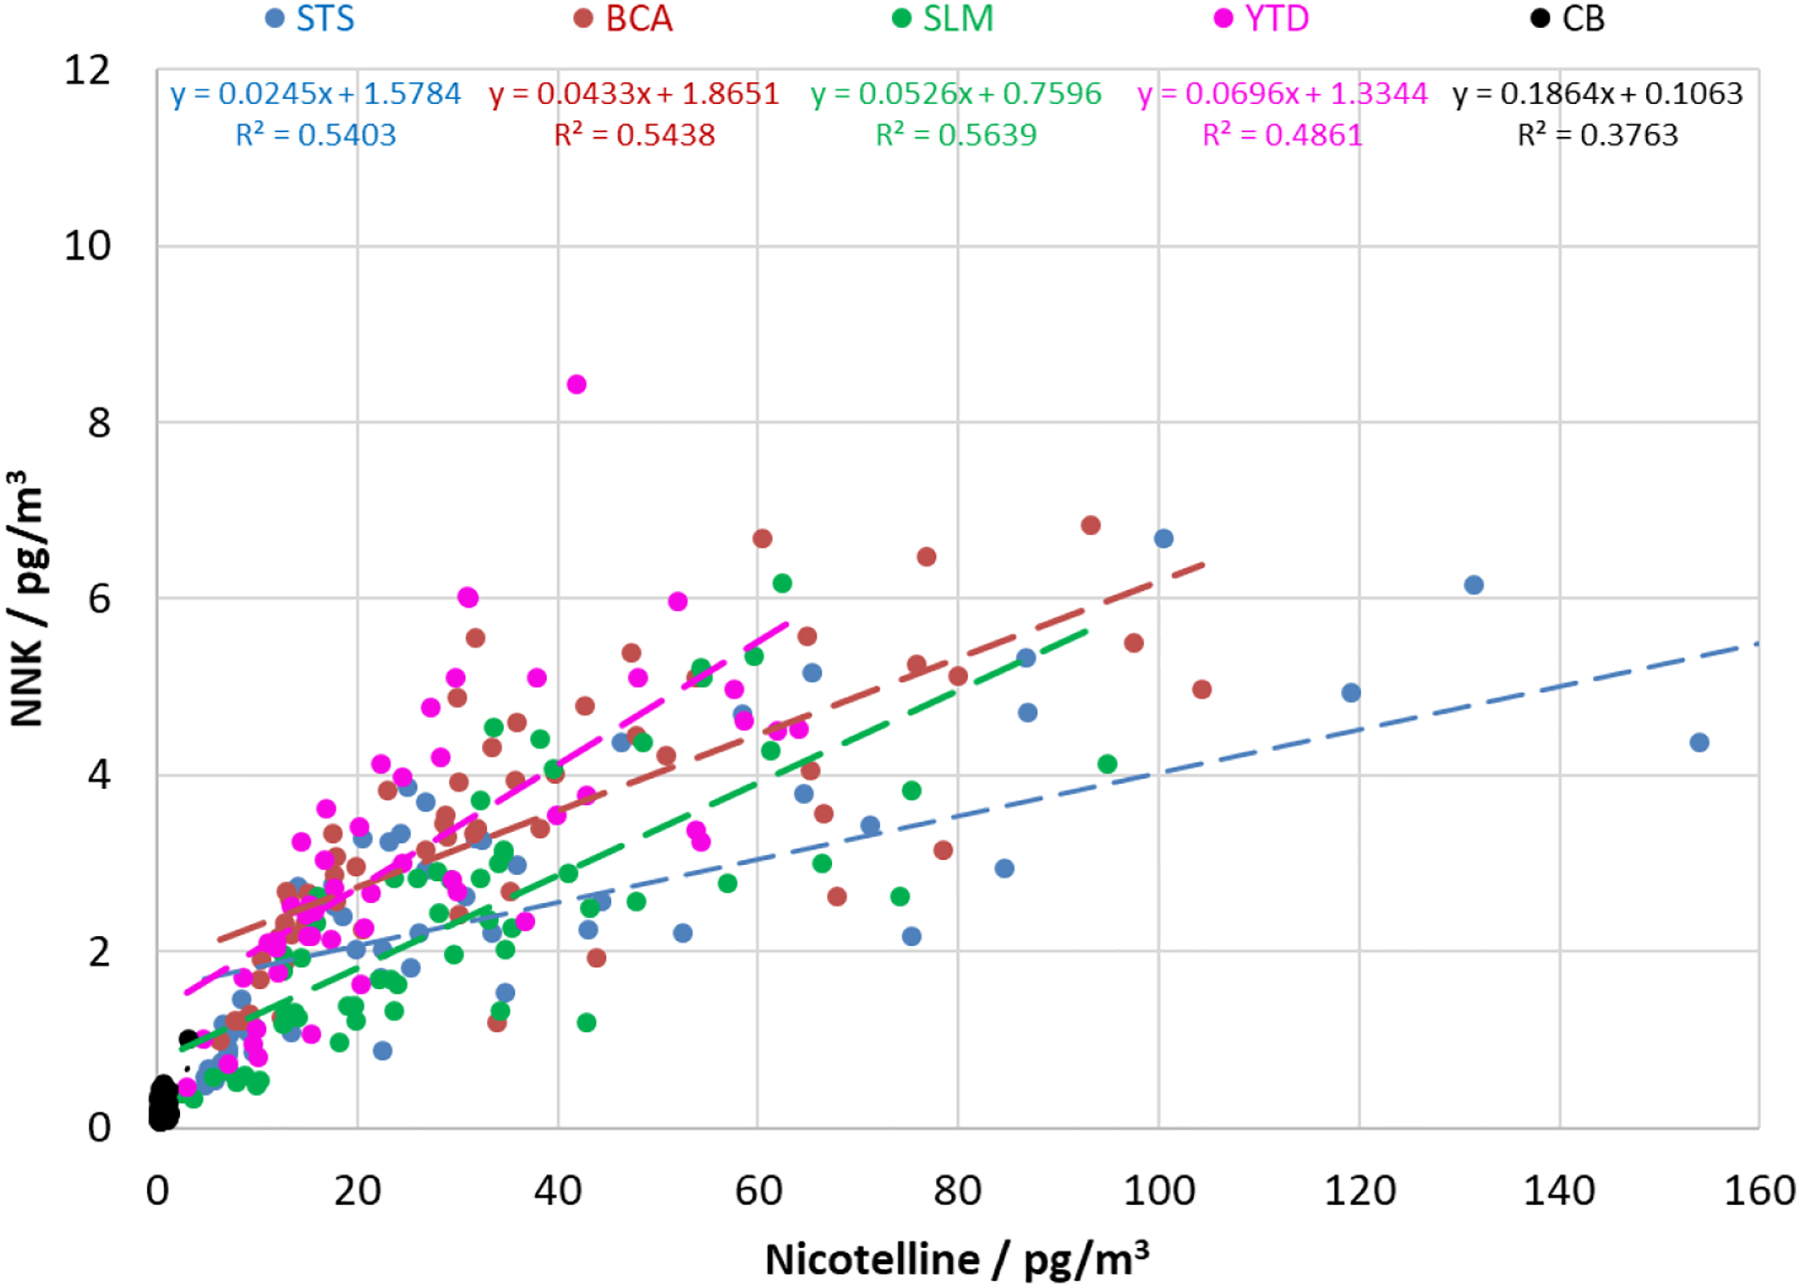
Airborne NNK vs Nicotelline (from untreated filters) in five California sites in 2010.
The same filters were analysed for NNK in PM10. Figure 6(b) compares the variability of PM10 and NNK airborne concentrations and the load of NNK in PM10 by location over the entire 2010.
All sites show substantial variability in the gravimetric PM10 concentration, not unexpected in the different air basins within the state of California, but only YTD and even more BCA are represented by a higher median. The median NNK airborne concentrations tend to be similar in all cities (2.24–3.33 pgm−3) except for CB, where an order of magnitude less was recorded. This observation is not surprising given the very small population located south of the Sequoia National Forest and aside the Mojave Desert (see Table S2, for statistical details).
For the sites SLM, STS and YTD, the load of NNK in PM10 is similar whilst for CB it is the lowest given the PM10 concentration was similar to the other cities as confirmed in Figure 6(b), Table S4 in the SI. For BCA, the load of NNK is lower than the three other cities because the median of the PM10 concentration was higher and appears that the highest concentrations are more of local origin (Figure S3 in SI). This is also reflected in the airborne concentration of NNK. YTD shows similar characteristics to BCA, but regional transport appears to be responsible from the NE and SE sectors for all analytes. For SLM, regional transport is also responsible for all analyte concentrations. At STS, high concentrations are more of local origin, but for NNK, the inference is less clear.. These observations are confirmed in the conditional probability functions (CPF) and polar plots presented in Figures S1–S5 in the SI.
A Kruskal–Wallis H test was run to evaluate whether absolute measured values of NNK and PM10 concentrations and NNK in PM10 differed across sites and seasons. The tests revealed, that in different seasons, insignificant differences (p=0.075) in the airborne NNK concentrations were observed while significant differences (p<0.05) were noticed for airborne PM10 concentrations (JJA, SON > DJF, MAM) and NNK in PM10 (, DJF, MAM > JJA, SON) (Table S3 in SI). However similar to the observations of Farren et al., NNK concentrations ranked higher in SON, DJF compared to MAM, JJA (Farren et al., 2015). The same test revealed significant differences (p<0.05) for the three dependent variables across the five sites.
Figure 7 shows the seasonal variability of PM10 concentration and load of NNK in PM10 across the same five sites (further statistics are given in Table S3). In all the seasons, the median PM10 concentration is highest in BCA and although it is a populated, busy city, long range transport might explain why the load of NNK in PM10 is lower compared to the other sites. Similar to what was noted in Figure 6(b), it can be confirmed that in CB, with the only exception of season DJF, although the median PM10 concentration was similar to the other sites, the load of NNK was the lowest here, also confirmed in Figure 7.
Figure 7:
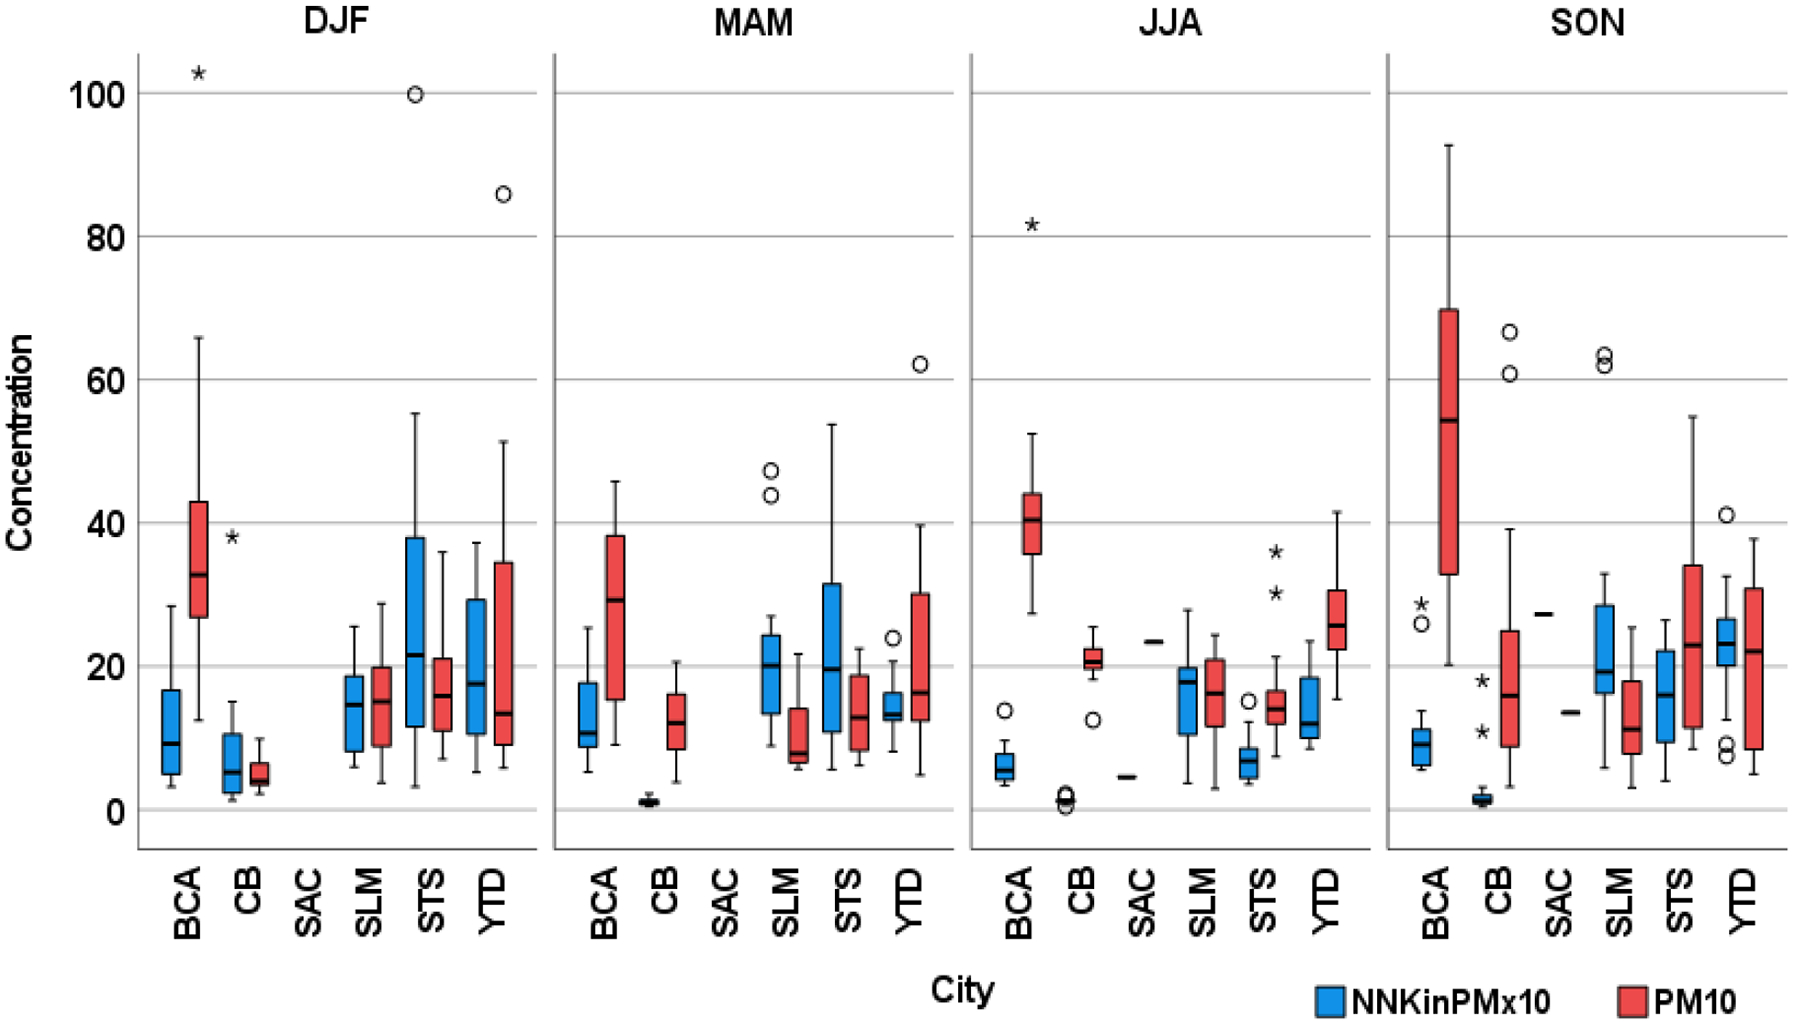
Seasonal variability of NNK in PM10 (×10 ng/g) and PM10 concentrations (in μgm−3) for different sites in California in 2010.
3.5. NNK in different campaigns
Figure 8 represents the comparison in airborne PM and load of NNK in PM samples obtained from several countries. Using untreated filters, the PM gravimetric samples were collected from UK, Malta and Hong Kong. The sampling site details have been described in our previous paper (Aquilina et al., 2021). As these were relatively short air sampling campaigns, the variability in the concentrations cannot be discussed in direct comparison with the samples obtained in the California sites (USA) that were discussed in Section 3.4. Nevertheless, as the UK, Hong Kong and Malta samples were collected in the period 2014–2018, they are still valuable samples to understand better the distribution of NNK in PM across different urban conglomerations and the fate of nicotine in outdoor conditions and hence the formation of NNK or otherwise.
Figure 8:
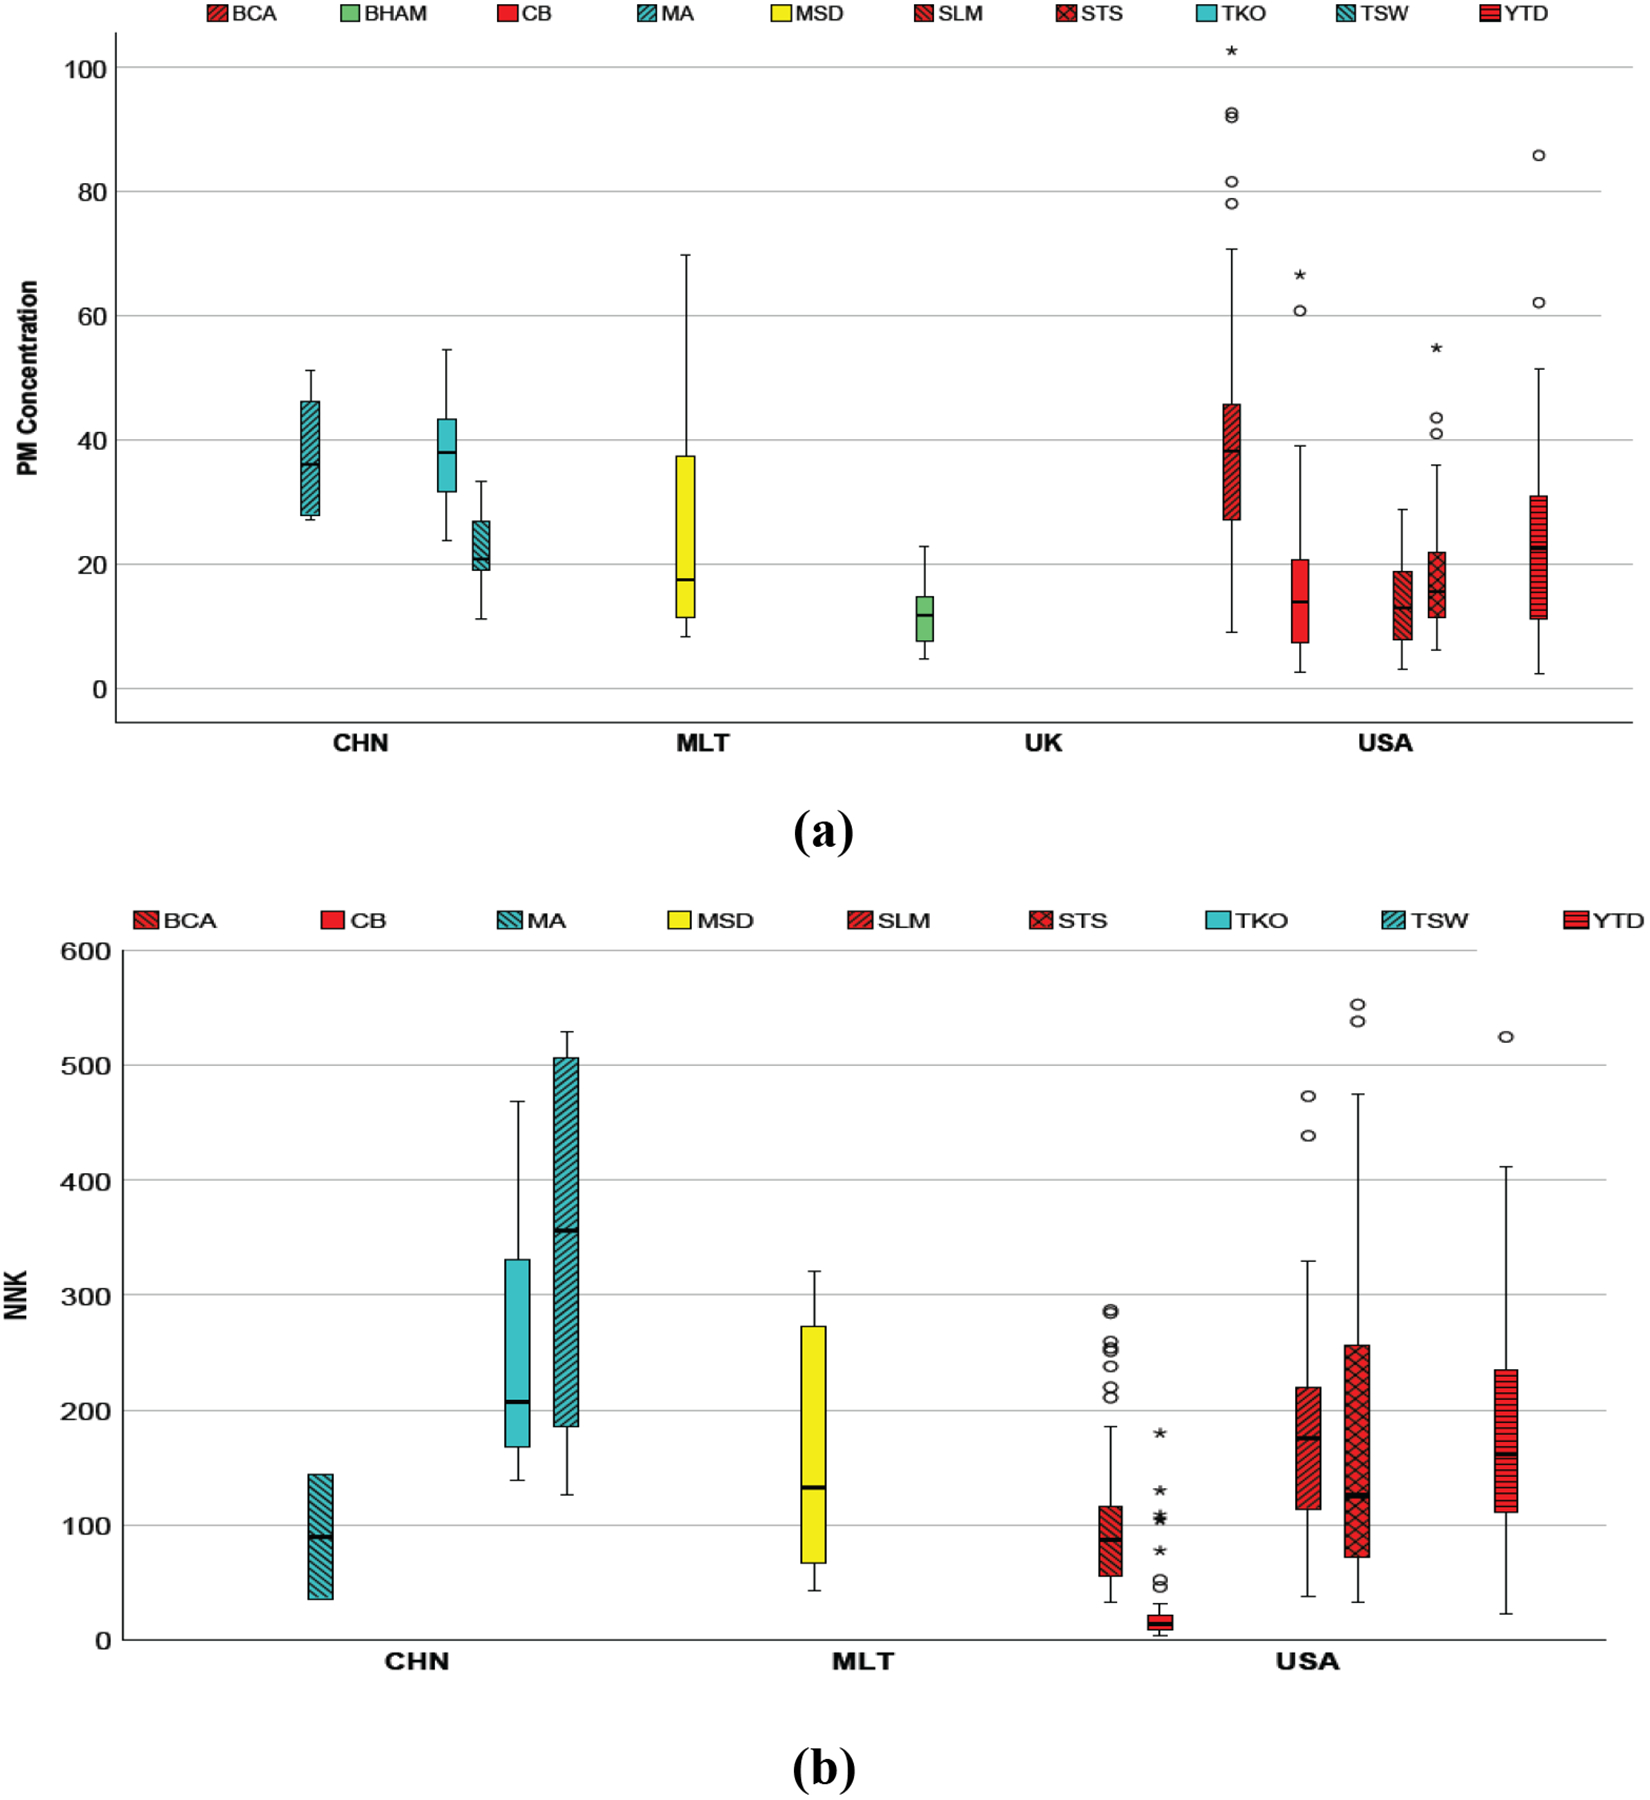
(a) Airborne PM2.5 (CHN, MLT) and PM10 (UK, USA) concentration (in μgm−3) and (b) NNK in PM (ng/g) for different sites and countries
The samples from Hong Kong show a higher median PM concentration than those from Malta and UK, whilst these two were more comparable to the USA levels (Figure 8(a)). However Figure 8(b) indicates that the NNK load represents a different perspective. In Hong Kong, it is understandable that the site in MA has a high median of PM, yet low load of NNK as it is a landfill taking construction waste, whilst TKO and TSW were urban sites located in residential/commercial areas. Apart from a substantial contribution to PM from traffic, it is reasonable to argue that densely populated cities contribute to a higher load of NNK in PM. Similar arguments can be advanced for the site MSD. Although the population in MSD is relatively small, it lies within the concentrated urban area of the whole island, thus the low median and high variability of the load of NNK. As for BHAM, the sampling site was in a suburban area of Birmingham and since very low PM concentrations and low nicotine concentration compared to the other sites were recorded, it is understandable that NNK was not detected, given that untreated filters appear to be less efficient to capture NNK, as discussed in Section 3.3.
4. Conclusion
Following a previous publication indicating that PM is contaminated with tobacco-smoke derived particulates (Aquilina et al., 2021), this paper presents the first comprehensive study to demonstrate the ubiquitous presence of a tobacco-specific, potent lung carcinogen NNK in airborne PM. The concentrations measured in this study fall well below those reported by (Farren et al., 2015) from the campaign in London, the only study looking for NNK in PM to date. This may be a consequence of different analytical methods and/or highly variable atmospheric concentrations influenced by local sources, possible atmospheric NNK formation and reactivity. Tests have shown that what was quantified is not a sampling artefact but a new addition to the knowledge of the chemical composition of PM. This information has been verified by using a pre-treated bisulfate filter, proved to be easy to prepare, yet innovative in the quest of sampling both gas- and particle-phase nicotine alongside NNK, that is a minor component of tobacco-derived PM. The use of a bisulfate-treated filter is more efficient in collecting NNK amidst the challenges posed by the reactivity of NNK as explained earlier. Using nicotelline as a suitable marker for the tobacco-smoke derived PM, it has been shown that NNK correlates very well with it when using treated filters. Although untreated filters are less efficient, Figure 5 shows that from five datasets, NNK still correlates appreciably well with the marker and hence the discussion on the NNK levels on untreated filters can be done with confidence. This is important for the use of untreated archived filters.
Analyses of samples gathered from four countries, all having distinct micro-climates, strengthens the claim that tobacco related pollutants increase with tobacco smoke prevalence and population density. Msida is in the middle of the most urbanized area in Malta where adult tobacco smoke prevalence is still relatively high (20%) (World Health Organization, 2019), hence the relatively higher nicotine and NNK levels. In a city like San Francisco, where tobacco smoke prevalence is much lower (12.3% in 2012) (SFTFPM.org, 2018) NNK was detected even on a high building. Birmingham in the UK, although the population is not small and adult smoking prevalence is 18.4% (in 2014) ((Local Government Association, 2018)), lower concentrations of nicotine and corresponding low levels of NNK were quantified only when using treated filters. In Kong Kong, the smoking prevalence is also low (11.4% in 2015) (Hong Kong Council on Smoking and Health, 2018) and although sampling was carried out in distinctly different areas, NNK levels were similar to other cities. From samples knowing the gravimetric PM concentration, the load of NNK could be calculated. This information has shown that while seasonality in PM is associated with several sources, topography and meteorology, the load of NNK is primarily associated with the passage of air masses over densely populated cities where most probably smoking is higher and in the colder months the load of NNK in PM is higher than in warmer months.
The main limitation of this study arises from relatively small datasets. Ideally more samples would be obtained from areas that have smaller populations and also from areas where smoking is known to be still predominant like Asia and Southern Europe in order to better quantify the level of contamination of airborne PM. Further research is necessary to evaluate the health implications of a chronic exposure, by inhalation, to the load of NNK in PM.
Supplementary Material
Highlights.
Airborne particulate matter (PM) is contaminated with the tobacco specific nitrosamine NNK;
The atmospheric stability of NNK in comparison to airborne nicotine is reported;
NNK is detected in PM in various geographic locations;
NNK shows a seasonal variation;
The load of NNK in PM10 is quantified.
ACKNOWLEDGEMENTS
The authors would like to thank the following persons in helping out to provide several filters for this study.
Lane Sharon and Brenda Saldana from the California Air Resources Board (CARB).
Polly Cheung from UCSF for helping out in the analytical work.
Maria Thompson from the University of Birmingham, UK.
Sara Fenech and Renato Camilleri from the Faculty of Science, University of Malta, Malta. Measurements in Malta were carried out using the Mobile Air Quality Laboratory within the University of Malta, procured through the European Regional Development Fund, Project ERDF-310 “Expanding the Physics and applied interdisciplinary research capabilities at the Faculty of Science.”
FUNDING SOURCES
This work was supported by the California Tobacco-Related Disease Research Program Grant 23PT-0013 - Impacts of Thirdhand Smoke on Public Health (Phase-2), National Institute on Drug Abuse, P30 DA012393, the National Center for Research Resources, S10 RR026437, UCSF Bland Lane Center of Excellence on Secondhand Smoke.
Footnotes
Supporting Information
Separate File
CRediT authorship contribution statement
Noel J. Aquilina: Conceptualization, Data curation, Formal analysis, Methodology, Writing - original draft.
Christopher M. Havel: Formal analysis, Methodology.
Roy M. Harrison: Data curation, Methodology, Writing - review & editing.
Kin- Fai Ho: Data curation, Writing - review & editing.
Neal L. Benowitz: Supervision, Writing - review & editing.
Peyton Jacob III: Conceptualization, Writing - review & editing.
Declaration of Competing Interest
The authors declare that they have no known competing financial interests or personal relationships that could have appeared to influence the work reported in this paper.
REFERENCES
- Akyüz M, Ata Ş, 2013. Seasonal variations of particle-associated nitrosamines by gas chromatography-mass spectrometry in the atmospheric environment of Zonguldak, Turkey. Environ. Sci. Pollut. Res 20, 7398–7412. 10.1007/s11356-013-1758-y [DOI] [PubMed] [Google Scholar]
- Apelberg BJ, Hepp LM, Avila-Tang E, Gundel L, Hammond SK, Hovell MF, Hyland A, Klepeis NE, Madsen CC, Navas-Acien A, Repace J, Samet JM, Breysse PN, 2013. Environmental monitoring of secondhand smoke exposure. Tob. Control 22, 147–55. 10.1136/tobaccocontrol-2011-050301 [DOI] [PMC free article] [PubMed] [Google Scholar]
- Aquilina NJ, Havel CM, Cheung P, Harrison RM, Ho K-F, Benowitz NL, Jacob P III, 2021. Ubiquitous atmospheric contamination by tobacco smoke: Nicotine and a new marker for tobacco smoke-derived particulate matter, nicotelline. Environ. Int 150. 10.1016/j.envint.2021.106417 [DOI] [PMC free article] [PubMed] [Google Scholar]
- Aragón M, Marcé RM, Borrull F, 2013. Determination of N-nitrosamines and nicotine in air particulate matter samples by pressurised liquid extraction and gas chromatography-ion trap tandem mass spectrometry. Talanta 115, 896–901. 10.1016/j.talanta.2013.07.010 [DOI] [PubMed] [Google Scholar]
- Brown BG, Borschke AJ, Doolittle DJ, 2003. An Analysis of the Role of Tobacco-Specific Nitrosamines in the Carcinogenicity of Tobacco Smoke. Nonlinearity Biol. Toxicol. Med [DOI] [PMC free article] [PubMed] [Google Scholar]
- Chao M-R, Wang C-J, Wu M-T, Pan C-H, Kuo C-Y, Yang H-J, Chang LW, Hu C-W, 2008. Repeated Measurements of Urinary Methylated/Oxidative DNA Lesions, Acute Toxicity, and Mutagenicity in Coke Oven Workers. Cancer Epidemiol. Biomarkers & Prev 17, 3381 LP – 3389. 10.1158/1055-9965.EPI-08-0721 [DOI] [PubMed] [Google Scholar]
- Cogliano VJ, Baan R, Straif K, Grosse Y, Lauby-Secretan B, El Ghissassi F, Bouvard V, Benbrahim-Tallaa L, Guha N, Freeman C, Galichet L, Wild CP, 2011. Preventable Exposures Associated With Human Cancers. JNCI J. Natl. Cancer Inst 103, 1827–1839. 10.1093/jnci/djr483 [DOI] [PMC free article] [PubMed] [Google Scholar]
- Daisey JM, 1999. Tracers for assessing exposure to environmental tobacco smoke: What are they tracing? Environ. Health Perspect 107, 319–327. 10.2307/3434424 [DOI] [PMC free article] [PubMed] [Google Scholar]
- Farren NJ, Ramírez N, Lee JD, Finessi E, Lewis AC, Hamilton JF, 2015. Estimated Exposure Risks from Carcinogenic Nitrosamines in Urban Airborne Particulate Matter. Environ. Sci. Technol 49. [DOI] [PubMed] [Google Scholar]
- Ge X, Wexler AS, Clegg SL, 2011. Atmospheric amines - Part I. A review. Atmos. Environ 45, 524. [Google Scholar]
- Gunduz I, Kondylis A, Jaccard G, Renaud JM, Hofer R, Ruffieux L, Gadani F, 2016. Tobacco-specific N-nitrosamines NNN and NNK levels in cigarette brands between 2000 and 2014. Regul. Toxicol. Pharmacol 76, 113–120. 10.1016/j.yrtph.2016.01.012 [DOI] [PubMed] [Google Scholar]
- Häger B, Niessner R, 1996. Determination of N-nitrosomethylaniline and methylaniline in the gas phase. Microchim. Acta 122, 35–44. 10.1007/BF01252403 [DOI] [Google Scholar]
- Hoffmann D, Brunnemann KD, Prokopczyk B, Djordjevic MV, 1994. Tobacco-specific N-nitrosamines and areca-derived N-nitrosamines: chemistry, biochemistry, carcinogenicity, and relevance to humans. J. Toxicol. Environ. Heal 41, 52. [DOI] [PubMed] [Google Scholar]
- Hoffmann D, Rivenson A, Amin S, Hecht SS, 1984. Dose-response study of the carcinogenicity of tobacco-specific N-nitrosamines in F344 rats. J. Cancer Res. Clin. Oncol 10.1007/BF00390978 [DOI] [PubMed] [Google Scholar]
- Hoffmann D, Rivenson A, Chung F-L, Hecht SS, 1991. Nicotine-Derived N-Nitrosamines (TSNA) and their Relevance in Tobacco Carcinogenesis. Crit. Rev. Toxicol 21, 305–311. 10.3109/10408449109017917 [DOI] [PubMed] [Google Scholar]
- Hong Kong Council on Smoking and Health, 2018. Smoke Free Hong Kong - Annual Report 2017–2018.
- IARC, 2007. Smokeless tobacco and some tobacco-specific N-nitrosamines. IARC Monogr. Eval. Carcinog. risks to humans 89, 1–592. [PMC free article] [PubMed] [Google Scholar]
- Jacob P, Benowitz NL, Shulgin AT, 1988. Synthesis of optically pure deuterium‐labelled nicotine, nornicotine and cotinine. J. Label. Compd. Radiopharm 25, 1117–1128. 10.1002/jlcr.2580251009 [DOI] [Google Scholar]
- Jacob P, Goniewicz ML, Havel CM, Schick SF, Benowitz NL, 2013. Nicotelline: A proposed biomarker and environmental tracer for particulate matter derived from tobacco smoke. Chem. Res. Toxicol 26, 1615–1631. 10.1021/tx400094y [DOI] [PMC free article] [PubMed] [Google Scholar]
- Kavvadias D, Scherer G, Urban M, Cheung F, Errington G, Shepperd J, McEwan M, 2009. Simultaneous determination of four tobacco-specific N-nitrosamines (TSNA) in human urine. J. Chromatogr. B 877, 1185–1192. 10.1016/j.jchromb.2009.03.009 [DOI] [PubMed] [Google Scholar]
- Leaderer BP, Hammond SK, 1991. Evaluation of Vapor-Phase Nicotine and Respirable Suspended Particle Mass as Markers for Environmental Tobacco Smoke. Environ. Sci. Technol 25, 770–777. 10.1021/es00016a023 [DOI] [Google Scholar]
- Local Government Association, 2018. Smoking Prevalence in adults - current smokers (IHS) in Birmingham [WWW Document]. URL http://lginform.local.gov.uk/reports/lgastandard?mod-metric=3527&mod-area=E08000025&mod-group=AllRegions_England&mod-type=namedComparisonGroup (accessed 2.8.18).
- Marano RS, Updegrove WS, Machen RC, 1982. Determination of trace levels of nitrosamines in air by gas chromatography/low-resolution mass spectrometry. Anal. Chem 54, 1947–1951. 10.1021/ac00249a008 [DOI] [PubMed] [Google Scholar]
- National Center for Biotechnology Information, 2021. PubChem Annotation Record for 4-(N-Nitrosomethylamino)-1-(3-pyridyl)-1-butanone, Source: Hazardous Substances Data Bank (HSDB) [WWW Document]. URL https://pubchem.ncbi.nlm.nih.gov/source/hsdb/7771.
- Petrick L, Destaillats H, Zouev I, Sabach S, Dubowski Y, 2010. Sorption, desorption, and surface oxidative fate of nicotine. Phys. Chem. Chem. Phys 12, 10356–10364. 10.1039/c002643c [DOI] [PubMed] [Google Scholar]
- Petrick Lauren M., Sleiman M, Dubowski Y, Gundel LA, Destaillats H, 2011. Tobacco smoke aging in the presence of ozone: A room-sized chamber study. Atmos. Environ 45, 4959–4965. 10.1016/j.atmosenv.2011.05.076 [DOI] [Google Scholar]
- Petrick LM, Svidovsky A, Dubowski Y, 2011. Thirdhand smoke: Heterogeneous oxidation of nicotine and secondary aerosol formation in the indoor environment. Environ. Sci. Technol 45, 328. [DOI] [PubMed] [Google Scholar]
- Pitts JN, Grosjean D, Cauwenberghe K Van, Schmid JP, Fitz DR, 1978. Photooxidation of Aliphatic Amines Under Simulated Atmospheric Conditions: Formation of Nitrosamines, Nitramines, Amides, and Photochemical Oxidant. Environ. Sci. Technol 12, 946–953. 10.1021/es60144a009 [DOI] [Google Scholar]
- Ramírez N, Ozel MZ, Lewis AC, Marcé RM, Borrull F, Hamilton JF, 2012. Determination of nicotine and N-nitrosamines in house dust by pressurized liquid extraction and comprehensive gas chromatography--nitrogen chemiluminiscence detection. J. Chromatogr. A 1219, 180–7. 10.1016/j.chroma.2011.11.017 [DOI] [PubMed] [Google Scholar]
- Rounbehler DP, Reisch JW, Coombs JR, Fine DH, 1980. Nitrosamine air sampling sorbents compared for quantitative collection and artifact formation. Anal. Chem 52, 273–276. 10.1021/ac50052a014 [DOI] [Google Scholar]
- Schick SF, Farraro KF, Perrino C, Sleiman M, van de Vossenberg G, Trinh MP, Hammond SK, Jenkins BM, Balmes J, 2014. Thirdhand cigarette smoke in an experimental chamber: evidence of surface deposition of nicotine, nitrosamines and polycyclic aromatic hydrocarbons and de novo formation of NNK. Tob. Control 23. [DOI] [PubMed] [Google Scholar]
- SFTFPM.org, 2018. San Francisco Tobacco-Free Project Mission. Tobacco related data. Age-standardized total cigarette smoking prevalence, all counties, 1996–2012, USA. [WWW Document]. URL http://sanfranciscotobaccofreeproject.org/resources-data/ (accessed 2.8.18). [Google Scholar]
- Sleiman ML, Gundel LA, Pankow JF, Jacob P, Singer BC, Destaillats H, 2010. Formation of carcinogens indoors by surface-mediated reactions of nicotine with nitrous acid, leading to potential thirdhand smokehazards. Proc. Natl. Acad. Sci. U. S. A 107, 6576–6581. 10.1073/pnas.0912820107 [DOI] [PMC free article] [PubMed] [Google Scholar]
- VandenBoer TC, Markovic MZ, Sanders JE, Ren X, Pusede SE, Browne EC, Cohen RC, Zhang L, Thomas J, Brune WH, Murphy JG, 2014. Evidence for a nitrous acid (HONO) reservoir at the ground surface in Bakersfield, CA, during CalNex 2010. J. Geophys. Res. Atmos 119, 9093–9106. 10.1002/2013JD020971 [DOI] [Google Scholar]
- Whitehead TP, Havel C, Metayer C, Benowitz NL, Jacob P, 2015. Tobacco Alkaloids and Tobacco-Specific Nitrosamines in Dust from Homes of Smokeless Tobacco Users, Active Smokers, and Nontobacco Users. Chem. Res. Toxicol 28, 1007–1014. 10.1021/acs.chemrestox.5b00040 [DOI] [PMC free article] [PubMed] [Google Scholar]
- Whitlatch A, Schick S, 2019. Thirdhand Smoke at Philip Morris. Nicotine Tob. Res 21, 1680–1688. 10.1093/ntr/nty153 [DOI] [PubMed] [Google Scholar]
- World Health Organization, 2019. WHO report on the global tobacco epidemic, 2019., Geneva: World Health Organization. [Google Scholar]
Associated Data
This section collects any data citations, data availability statements, or supplementary materials included in this article.


