Abstract
With the careful modulation of the relative ratio of Y3+/Eu3+and Y3+/Tb3+, two series of bimetallic RE-CPs (EuxY1−x and TbxY1−x) were successfully obtained through the isomorphous substitution method. Interestingly, the introduction of Y3+ ions does not change the fluorescence characteristic peak of 1-Eu and 1-Tb, but enhances its fluorescence lifetime and quantum yield. Experimental and theoretical simulation results show the co-doping process changes the intramolecular energy transfer process and reduces the non-radiative transition resulting from concentration quenching. Eu0.1Y0.9 and Tb0.1Y0.9 with the largest luminescence lifetime were selected as the representative research objects, their potential application for the detection of toxic metal ions and organic molecules was further investigated. Interestingly, Eu0.1Y0.9 and Tb0.1Y0.9 demonstrate high sensitivity and good selectivity towards Fe3+, Cr3+ and acetone. Besides, fine fluorescence visibility provides the necessary conditions for the preparation of simple and fast response fluorescent test papers in order to achieve real-time and convenient detection of these toxic materials.
Two series of doped coordination polymers (EuxY1−x and TbxY1−x) through isomorphous substitution method utilizing Y3+ in place of partial Eu3+/Tb3+ were obtained. The doped materials could detect Fe3+, Cr3+, and acetone selectively and sensitively.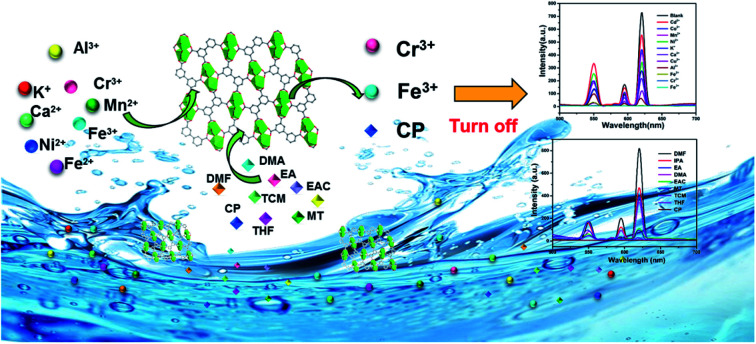
1. Introduction
The continuous accretion of human population coupled with increasing urbanization and industrialization puts a lot of pressure on global environments.1 As a result, there is an ever-increasing need to identify and monitor the chemical contaminants of the environment. The conventional instrumental detection methods such as surface enhanced Raman spectroscopy, ion mobility spectrometry (ICP), gas chromatography coupled with mass spectrometry (GC-MS), are always expensive, time-consuming and not easily accessible.2 Therefore, it is of great significance to develop fast-response and simple sensors. A variety of chemical materials including nanomaterials, conjugated polymers, supramolecular polymers and metal complexes have been used for detection processes. However, their widespread use is restricted due to the multistep processing, stability and lack of molecular organization.
As one of the most promising classes of porous materials, coordination polymers (CPs) or metal–organic frameworks (MOFs), constructed from organic ligands and metal ions or clusters via self-assembly, have been considered as the most promising means for chemical and biological sensors for metal ions,3–7 organic solutions,8–10 nitro aromatics11–14 and so on, because it is simple, sensitive, selective and responsive.15–19 Luminescent CPs or MOFs could be divided into two main types. Firstly, TM-MOFs (TM = transition cations), especially Zn or Cd based, have been used for the sensing process based on ligand-centred luminescence.4,20–23 The major insufficiency of ligand-centred luminescence detectors is the small Stokes shift, which prevents the detection by naked eye as there is not much difference in colour between emission and excitation light.24 Secondly, rare earth coordination polymers (RE-CPs) also show a great application prospects in chemical sensing due to their incomparable optical properties including large Stokes shifts, high quantum yields, and long luminescence lifetime.25 Numerous of luminescent RE-CPs are based on Eu(iii) and Tb(iii) which provide obvious red or green 4f–4f emissions, respectively.26–28 Liu et al. constructed a multifunctional Tb-MOF that could sensing Ce3+ and Fe3+ cations, the obtained Ksv values were 1.65 × 10⁴ M−1 and 279.4 M−1, respectively.29 Huang et al. synthesized a fluorescent Eu-MOF for highly selective and sensitive sensing of picric acid with the Ksv value of 9.8074 × 10⁴ M−1.30 Two-dimensional (2D) metal–organic frameworks (MOFs) or coordination polymers (CPs) are attracting increasing attention due to their unique properties originating from their ultrathin thickness, large surface area and high surface-to-volume atom ratios. Very recently, Wang et al. construct a two-dimensional Eu-MOF exhibits high sensitivity towards sulfamethazine (SMZ) among various antibiotics. The observed Ksv value was 4.598 × 10⁴ M−1.31 However, the major deficiency is the non-radiative transition result from the serious concentration quenching of pure RE-CPs.32 Co-doping is an efficient method to reduce luminescence centres and improve potential quenching by concentration. There are two main methods to construct co-luminescent MOFs: (1) loading Eu(iii) or Tb(iii) ions into the pores of matrix MOF by straightforward post synthetic modification strategy;33–35 (2) introducing of luminescent inert ion as a matrix to dilute Eu3+/Tb3+ through isomorphous substitution method. Isomorphous substitution method is more effective in that the bridge ligand in the bimetallic system could centrally sensitizer Eu3+/Tb3+ compared with pure RE-CPs as well as reduce the concentration quenching.36,37 Many research on co-doped RE-CPs using Y3+ as matrix have been obtained and investigated.2,38 Nevertheless, few studies focusing on Y-doped rare earth MOF as a multifunctional sensor to detect harmful ions and organic molecules.
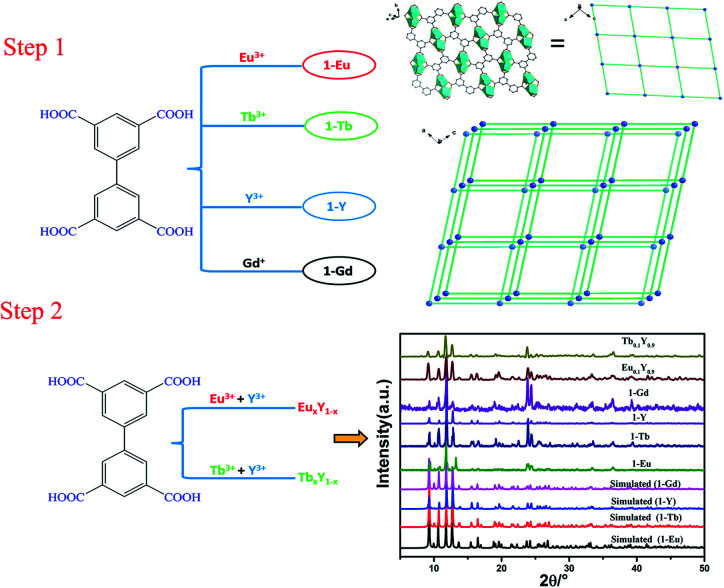
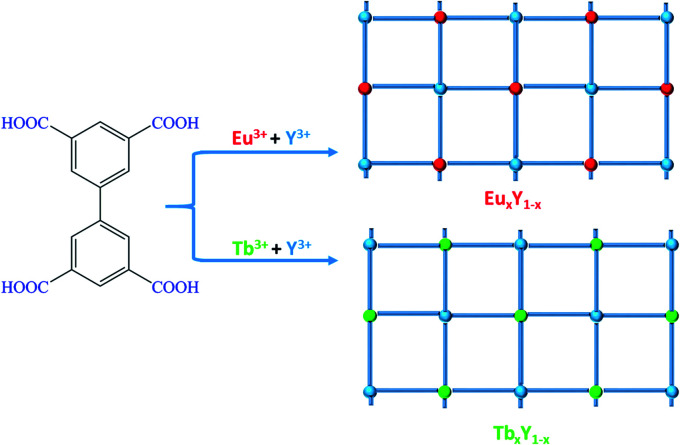
Carboxylate-based ligands are usually used for constructing optical RE-CPs owing to their unique coordination ability of the carboxyl groups and outstanding sensitization to lanthanide ions. In our previous research, a series of two-dimensional RE-CPs (RE = Eu, Tb, Gd) were successfully synthesised based on 3,3′,5,5′-biphenyltetracarboxylic acid (H4BPTC). Subsequently, an isostructural RE-CP (1-Y) was obtained through identical procedure (Scheme 1).39,40 With careful adjustment of the relative ratio of Y3+/Eu3+ and Y3+/Tb3+, two series of isomorphous RE-CPs, namely EuxY1−x and TbxY1−x, were successfully obtained through isomorphous substitution technique (Scheme 2). The powder X-ray diffraction (PXRD) proved the isostructural structures of the doped complexes and the pure RE-MOF (Fig. S2 and S3†). Inductively coupled plasma (ICP) spectroscopy was executed to determine the relative molar ratios within the doped CPs (Table S2†).
Scheme 1. Schematic diagram of the synthetic strategy for RE-MOFs (the phosphorescence spectrum of 1-Gd was used to calculate the energy of triplet state (T1) for H4BPTC).
Scheme 2. Schematic diagram of the synthetic strategy for EuxY1−x and TbxY1−x.
Interestingly, the introduction of Y3+ does not change the luminescence characteristic peak of 1-Eu and 1-Tb (Fig. S11†) but enhances its luminescence lifetime and quantum yield. The largest luminescence lifetime of Eu0.1Y0.9 and Tb0.1Y0.9 are 1.157 ms and 1.247 ms, respectively (Fig. S8 and S9†). The result indicates the introduction of low-cost Y3+ influence the intra molecular energy transfer process and reduce the non-radiative transition result from concentration quenching. The characteristic luminescent properties and large luminescence lifetime of mixed RE-CPs promote us further investigate the energy transfer progress and their potential application for the detection of metal ions and organic molecules systematically. Luminescence measurements revealed Eu0.1Y0.9 and Tb0.1Y0.9 could detect Fe(iii), Cr(iii) in aqueous solutions and acetone with high sensitive and good selectivity. Density functional theory (DFT) calculations were carried out to calculate the adsorption energies towards ions. Cr3+ and Fe3+ possessed negative adsorption energies of −2.26 and −2.27 Ha, respectively, much lower than those of monovalent and divalent ions. Furthermore, the adsorption locate were performed for acetone using the Sorption module of Materials Studio 7.0 (MS) to illustrate the interaction of acetone and RE-CPs. Inspiringly, the calculated result quite consistent with the above experimental sensing process.
The time-dependent luminescence to reveal the sensitivity of mixed RE-CPs. By applying the first-order kinetic model, the related linear correlations of ln(I0/It) versus time (It and I0 stand for luminescent intensity at the initial and at the intervals stage of the Eu0.1Y0.9 and Tb0.1Y0.9, respectively) were obtained to evaluate the reaction rates of the reduction of luminescent intensity. The rate constant of Eu0.1Y0.9 and Tb0.1Y0.9 are much higher than 1-Eu and 1-Tb. This result demonstrates the mixed RE-CPs process higher sensitivity.
Additionally, to achieve real-time and convenient detection, luminescence test papers were designed and prepared. The test papers of Eu0.1Y0.9 and Tb0.1Y0.9 were soaked in different organic solution for seconds. The test paper could be selectively quenched by acetone. These results further highlight a new and promising strategy by using low-cost Y3+ in place of partial Eu3+/Tb3+ to construct bimetallic RE-CPs as luminescent sensors.
2. Experimental section
2.1. Materials and methods
All reagents and solvents were obtained commercially and used without any purification. Crystal data were obtained from a Rigaku Oxford Diffraction Gemini diffractometer, equipped with a Mo Kα with ω-scan technique. The powder X-ray diffraction patterns (PXRD) were recorded on a Rigaku D/Max-2500 diffractometer and the intensity data were recorded by continuous scan in a 2θ mode from 5 to 50, with a step size of 0.1 and a scan speed of 20 min−1. A PerkinElmer Diamond SII thermal analyser was utilized for thermo gravimetric analysis (TGA) tests from 298 to 1173 K, at a heating rate of 10 K min−1 under a nitrogen atmosphere. A Nicolet 6700 spectrometer was applied to measure the Fourier transform infrared reflectance spectroscopy (IR) spectra in the range 4000–400 cm−1. The fluorescence spectra were measured on a Hitachi F-7000 at 298 K. The fluorescence lifetime was determined by FLS 980 fluorescence spectrometer. Inductively coupled plasma spectroscopy (ICP) was recorded on an OPTIMA 2100 DV spectrometer. XPS characterization was carried out by using a Thermo Fisher Scientific ESCALAB spectrometer with Al Kα X-rays (1486.6 eV) as the light source. UV-vis measurements were conducted with a UH 4150 spectrophotometer.
2.2. Synthesis of RE-CPs
A similar procedure was used to obtain all products (1-Eu, 1-Tb, 1-Y, 1-Gd). The mixture of RE3+ (0.2 mmol), H4BPTC (0.1 mmol, 33 mg), 7 mL N,N-dimethylacetamide (DMA) and 0.5 mL deionized water was sealed in a 20 mL Teflon lined stainless steel container and heated to 150 °C for 3 days then cooled to 35 °C at a rate of 0.5 °C min−1. Subsequently, colourless blocky-like crystals were collected by washing with deionized water and drying under vacuum. 1-Eu, 1-Tb and 1-Gd were investigated in our previous work. The characterization of novel 1-Y was discussed in detail. PXRD of the as-synthesized mixed RE-CPs revealed that the as-synthesized samples have good phase purity and high crystallinity. IR (KBr, cm−1): 3434 (s), 2924 (w), 1615 (m), 1538 (m), 1415 (m), 1354 (m), 1256 (w), 1177 (w), 1082 (w), 1025 (w), 828 (w), 787 (m), 720 (m), 657 (m), 597 (w), 530 (m), 429 (w).
2.3. Syntheses and characterization of doped bimetallic EuxY1−x and TbxY1−x
As illustrated in Scheme 2, doped bimetallic RE-CPs (EuxY1−x and TbxY1−x, x = 0.1, 0.2, 0.3, 0.4, 0.5, 0.6, 0.7, 0.8, 0.9) in this work were different synthesized by adopting the identical procedure except for the stoichiometric ratios of Y3+/Eu3+ and Y3+/Tb3+. The powder X-ray diffraction (PXRD) proved the isostructural structures of the doped complexes and the pure RE-CPs (Fig. S2 and S3†). As shown in Fig. S4 and S5,† the peak at 1695 cm−1 was ascribed to the C O stretching vibration of H4BPTC in the Fourier transform infrared spectra but disappeared in the spectrum of CPs, suggesting that carboxylate groups coordinated to RE3+ ions. Inductively coupled plasma (ICP) spectroscopy was executed to determine the relative molar ratios within the doped CPs (Table S2†). X-ray photoelectron spectroscopy (XPS) characterization were applied to validate the coordination effect between the carboxyl group on H4BPTC and RE3+ ions. As demonstrated in the full XPS profiles, (Fig. S6a†), the peaks at the ranges of 154.6–160.1 eV and 1164.2–1134.9 eV pertaining to Y 3d and Eu 3d manifest the existence of Y(iii) and Eu(iii) ions in the EuxY1−x. Analogously, the peaks at the ranges of 154.6–160.1 eV and 1241.2–1276.9 eV pertaining to Y 3d and Tb 3d demonstrate the existence of Y(iii) and Tb(iii) ions in the TbxY1−x (Fig. S7a†).
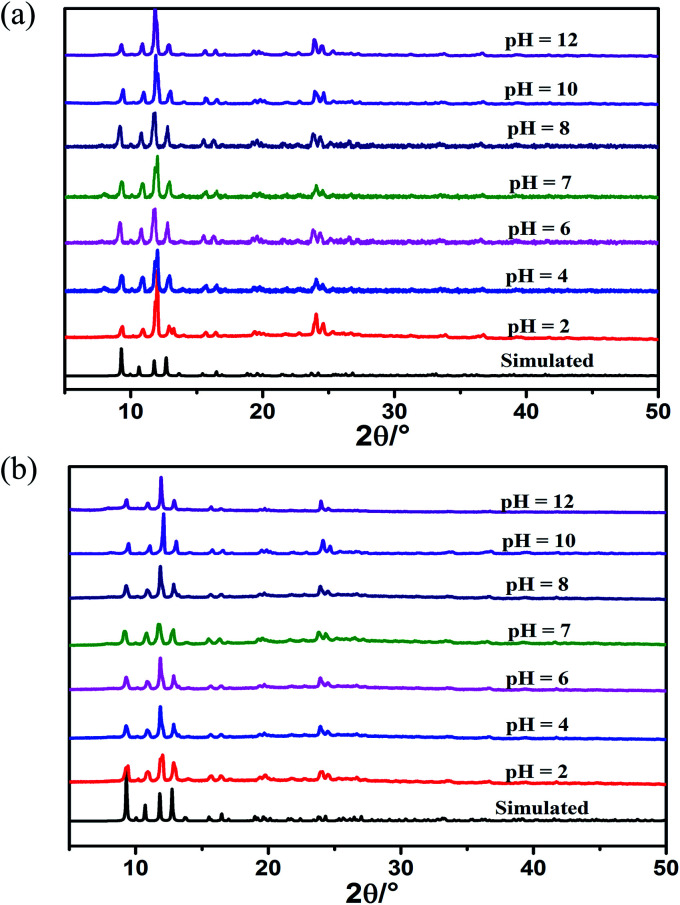
It is well known that yttrium salt is much cheaper than europium and terbium. Additionally, the introduction of Y3+ enhances its luminescence lifetime and quantum yield. Considering the cost and efficiency, we choose Eu0.1Y0.9 and Tb0.1Y0.9 as the representative research object. The mixed RE-CPs exhibited excellent chemical and thermal stability. PXRD patterns of mixed RE-CPs were measured after being soaked in different pH solution (from 2 to 12) and various organic solutions for 24 h. The measured PXRD patterns maintain original structure and show excellent chemical stability (Fig. 1 and S28†). The thermal behaviour of mixed RE-CPs were studied on the crystal samples under N2 atmosphere with a heating rate of 10 °C min−1. The TGA curves suggested that were stable up to 330 °C for Eu0.1Y0.9 and Tb0.1Y0.9 (Fig. S12†).
Fig. 1. PXRD patterns of (a) Eu0.1Y0.9 and (b) Tb0.1Y0.9 immersed in different pH (2–12) solutions for 24 hours.
3. Results and discussion
3.1. Crystal structure
In our previous research, we have successfully synthesized a series of RE-CPs (1-Eu, 1-Tb, 1-Gd) based on H4BPTC. Single-crystal X-ray diffraction analysis shows that 1-Y is isomorphous with the previous structure. Herein, structure of 1-Y will be discussed as a representative example (Fig. S1†). In one asymmetric unit, there are two crystallographically independent Y3+ ions that form a dinuclear cluster as a secondary building unit (SBU). These two Y3+ ions exhibit the same coordination environments. Y1 is coordinated by seven carboxylate oxygen atoms and one from DMA molecule. The dinuclear cluster are further connected by H4BPTC resulting in two dimensional network structures. The lengths Y–O [2.211(2) − 2.561(9) Å] are within normal values found for related compounds.41 The whole framework could be simplified into a (4,4)-connected sql-type net with the point symbol (44,62).
3.2. Solid-state luminescent properties
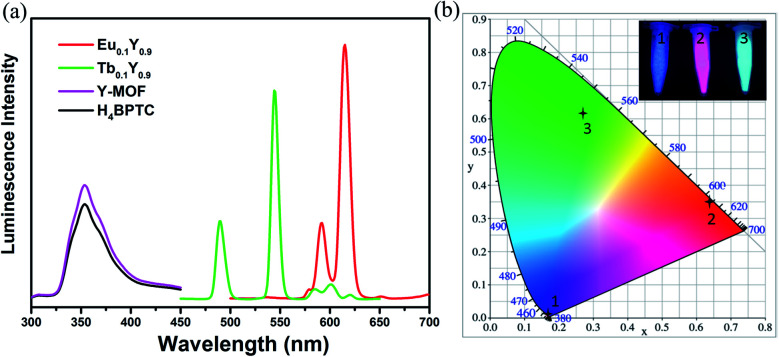
The excitation spectra were tested to confirm the excitation wavelength (Fig. S10†). The introduction of Y3+ does not change the luminescence characteristic peak of 1-Eu and 1-Tb but enhances its intensity (Fig. S11†), luminescence lifetime (Fig. S8 and S9†) and quantum yield (Table S3†). As displayed in Fig. 2, the luminescence spectrum for H4BPTC was first recorded in the solid state at room temperature. It is observed free H4BPTC exhibits emission peak at 354 upon excitation at 275 nm, which can be attributed to the intra-ligand n–π or π–π* transition. It should be emphasized that yttrium itself has no luminescent property, and the luminescence spectrum of 1-Y is derived from ligand luminescence.
Fig. 2. (a) The solid-state luminescence of 1-Y, Eu0.1Y0.9 and Tb0.1Y0.9 (λex = 275 nm). (b) CIE chromaticity diagram for 1-Y, Eu0.1Y0.9 and Tb0.1Y0.9. Inset: photographs of (1) 1-Y, (2) Eu0.1Y0.9 and (3) Tb0.1Y0.9 under ultraviolet light of 365 nm.
The characteristic luminescence emissions of 1-Eu and 1-Tb indicated the occurrence of the antenna effect from ligand to CPs. The emission spectrum of compound 1-Eu displays typical bands at 591, 615, 651 and 696 nm when excited at 275 nm, ascribed to the transitions 5D0 → 7Fj (j = 1, 2, 3 and 4), respectively. The decay lifetime of 1-Eu is estimated to be 1.068 ms (Fig. S8†), and the fluorescence quantum yield of 1-Eu attains 62.65%. 1-Tb shows four typical Tb3+ bands at 489, 544, 589 and 620 nm upon excitation at 275 nm. These emissions attribute to the transitions 5D0 → 7Fj (j = 6, 5, 4 and 3), respectively. The decay lifetime of 1-Tb is estimated to be 1.079 ms (Fig. S9†), and the fluorescence quantum yield was 20.23%.
Upon the radiation of UV light, Eu0.1Y0.9 shows highly intense visible red emission while Tb0.1Y0.9 gives highly intense visible green emission. Luminescence spectrum of Eu0.1Y0.9 show strong red emission in the visible region upon excitation at 275 nm. The emission bands observed at 591, 615, 651, 696 nm can be assigned to the 5D0 → 7F1, 5D0 → 7F2, 5D0 → 7F3, 5D0 → 7F4 transitions, respectively, based on H4BPTC sensitized Eu3+ centred emission. Similarly, Tb0.1Y0.9 exhibits strong green emission in the visible region upon excitation at 275 nm. The emission bands observed at 489, 544, 589 and 620 nm can be assigned to the 5D4 → 7F6, 5D4 → 7F5, 5D4 → 7F4 and 5D4 → 7F3 transitions, respectively.
As revealed in Fig. S8 and S9,† the luminescence lifetime of doped complexes were enhanced along with the increase of Y3+ in the bimetallic system. The largest luminescence lifetime of Eu0.1Y0.9 and Tb0.1Y0.9 are 1.157 ms and 1.247 ms, with increases of 0.089 ms and 1.168 ms comparing with 1-Eu and 1-Tb, correspondingly.
3.3. Energy transfer process
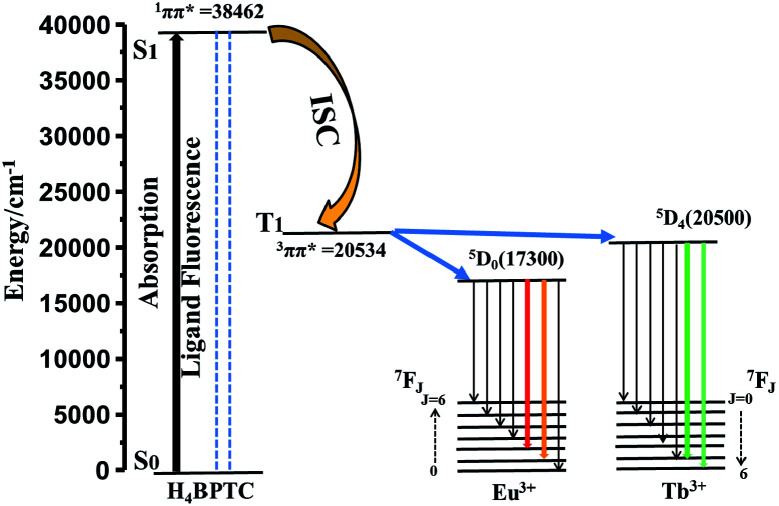
RE-CPs or MOFs show unique luminescence by the antenna effect, in which organic ligands function as sensitizers. In this process, the light was first absorbed by the ligands, followed by inter-system crossing (ISC) process, and then energy transfer from triplet (T1) state to f levels of RE3+, resulting in a metal-centred luminescence.46 The electronic states of ligands are crucial to investigate the energy-transfer process. The UV-vis absorption spectrum for H4BPTC was first recorded in the solid state at room temperature (Fig. S13†). It is observed that H4BPTC exhibits two intense broad excitation bands centered at 260 and 300 nm, which can be attributed to π–π* transitions of the aromatic rings. The singlet (S1) state of the ligand is estimated to be 38 462 cm−1 by UV-vis absorbance of H4BPTC, and the triplet (T1) state of 1-Gd is calculated to be 20 534 cm−1 from the low temperature phosphorescence spectrum owing to the extremely high energy level of the first excited state 6P7/2 of the Gd3+ ion (32 150 cm−1) and the large difficulty of the energy transition from ligand to Gd3+ ion. On the basis of Reinhoudt's empirical rule, when the energy gap ΔE (S1 − T1) surpasses the limit value of 5000 cm−1, the inter-system crossing (ISC) process will be effective.42 For H4BPTC, the energy gap ΔE (S1 − T1) is calculated to be 17 928 cm−1 which is favourable for an efficient ISC process.
Following the rule of Latva, an efficient energy transfer from ligand to lanthanide(iii) requires the following parameters: ΔE[=E(T1) − E(5Dj)] = 2500 − 4500 cm−1 for Eu(iii) and Tb(iii).43–45 Herein, the energy differences between T1 of the H4BPTC and the resonance energy level of the Eu3+ ion (5D0, 17 300 cm−1) [ΔE = E(T1) − E(5D0)] is 3234 cm−1, within the ideal limit value of 2500−4000 cm−1 based on Latva's empirical rule. However, the energy levels of T1 of the H4BPTC are only slightly higher than the resonance energy level of Tb3+ ion (5D4, 20 500 cm−1) less than the ideal limit value (Fig. 3). The smaller energy gap of the Tb3+ ion revealed that the H4BPTC could sensitize the Eu3+ ion more sufficiently than the Tb3+ ion. The characteristic luminescent emissions of Eu0.1Y0.9 and Tb0.1Y0.9 indicated the occurrence of the antenna effect. Y3+ has no 4f electrons, the excitation energy of Y3+ is higher than carboxylate ligand triplet energy level, thus, the energy transition is difficult to occur from ligand to Y3+. Therefore, the bridge ligand between Ln3+ and Y3+ could sensitizer Eu3+/Tb3+ centrally compared with pure RE-MOFs.
Fig. 3. The energy transfer process of Eu0.1Y0.9 and Tb0.1Y0.9.
3.4. Cations and organic molecules detection
The prominent properties of Eu0.1Y0.9 and Tb0.1Y0.9 promoted us to further investigate their potential application for the detection of harmful metal ions and small organic molecule. To rule out the quenching phenomenon of ligand, 2 mg H4BPTC were dissolved in different metal halide (MClx) aqueous solution (2 mL, 1 × 10⁻² M, M = Ca2+, Co2+, Cu2+, Fe2+, K+, Mn2+, Ni2+, Fe2+, Cd2+, Al3+, Cr3+ and Fe3+) and different organic solvent (2 mL) including methanol (MT), ethanol (EA), acetone (CP), isopropanol (IPA), dichloromethane (MC), ethyl acetate (EAC), tetrahydrofuran (THF), DMF and DMA for luminescence testing. It could be seen that there was no obvious change in luminescence spectra of the H4BPTC in the presence of these analytes.
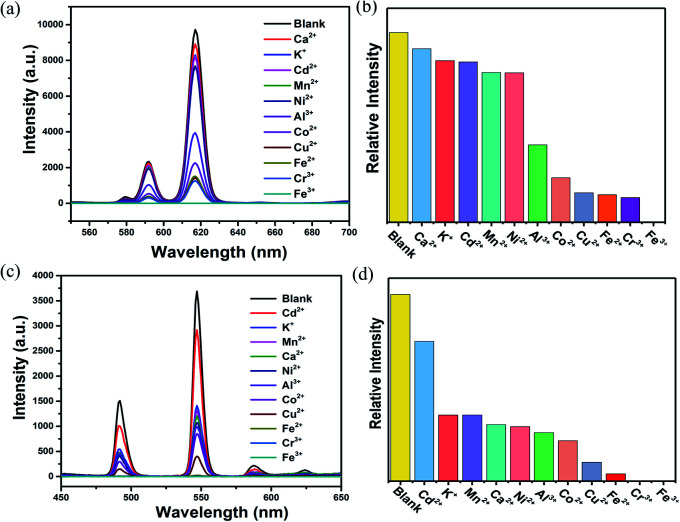
Subsequently, 2 mg ground crystal sample of Eu0.1Y0.9 and Tb0.1Y0.9 was initially added to 2 mL above metal halide (MClx) aqueous solution and then dealt with an ultrasonic instrument to form an emulsion solution for luminescence testing (monitored at 615 nm for Eu0.1Y0.9 and 544 nm for Tb0.1Y0.9, respectively). It was found that the fluorescent intensities of them are greatly dependent on the identities of the metal ions. Among all metal ions in this work, Fe3+ and Cr3+ ion exhibits the most significant quenching effect based on luminescent intensity compared with the blank sample (Fig. 4). To further access sensing sensitivity towards Fe3+ and Cr3+ ion, the luminescence intensity was evaluated by adding Fe3+ and Cr3+ (1 × 10⁻² M) in the suspension of Eu0.1Y0.9 and Tb0.1Y0.9 (Fig. S14–17†). The quenching results could be quantitatively analyzed with the Stern–Volmer (S–V) equation, (I0/I) = Ksv[N] + 1, I0 is the initial luminescence intensity and I is the luminescence intensity after adding cations, [N] is the molar concentration of analytes, and Ksv is the quenching constant (M−1).47 The emission intensity excited at 275 nm was gradually quenched as addition of increasing concentrations of Fe3+ and Cr3+. The observed Ksv values are 4 × 10⁴ M−1, 2 × 10⁴ M−1 for Fe3+ of Eu0.1Y0.9 and Tb0.1Y0.9, respectively. While the obtained Ksv values are 1.2 × 10³ M−1, 0.7 × 10³ M−1 for Cr3+ of Eu0.1Y0.9 and Tb0.1Y0.9, respectively. To get additional insight into the sensing process density functional theory (DFT) calculations were carried out by Gaussian calculation. The possible sensor-analyte sites within the RE-CPs were proposed on the basis of the structural characteristics of RE-CPs. The minimum energy for each metal ion was selected to calculate the adsorption energies with the coordination polymers (Fig. S32†). The calculated binding energy were −2.27, −2.26, −2.11, −1.28, −1.24, −1.22, −1.18, −1.16, −1.16, −0.86, −0.31 Ha (1 Ha = 27.211 eV) for Cr3+, Fe3+, Al3+, Cu2+, Co2+, Ni2+, Fe2+, Mn2+, Cd2+, Ca2+, K+, respectively. Inspiringly, the result was quite consistent with the above experimental experiment phenomenon. The trivalent cations Fe3+ and Cr3+ possessed negative binding energies of −2.26 and −2.27 Ha, respectively, much lower other ions in this work. This result indicated that these interactions may influence the energy transfer and the luminescence changes.
Fig. 4. Luminescent spectra of (a) Eu0.1Y0.9 and (c) Tb0.1Y0.9 upon the addition of various metal ions in DMF (λex = 275 nm); quenching efficiency values of (b) Eu0.1Y0.9 and (d) Tb0.1Y0.9 in DMF by different metal ions (1 × 10⁻² M).
The crystal sample of mixed RE-CPs (2 mg) were ground and dispersed in various organic solvent. As displayed in Fig. 5a and S18a,† the doped RE-CPs exhibit most obvious quenching response to acetone among various organic solutions. Next, the grinded powder sample were dispersed in 2 mL DMF, acetone were added to the suspensions of RE-CPs gradually (Fig. 5c and S18c†). The emission intensity was gradually quenched as the concentration of acetone increases. The obtained Ksv values are 4 × 10⁴ M−1 and 3 × 10⁴ M−1 for Eu0.1Y0.9 and Tb0.1Y0.9, respectively (Fig. S19†). These results illustrate mixed RE-CPS could be promising visual luminescence sensor for detecting acetone with good visual luminescence sensor for detecting acetone with good sensitivity and high selectivity. To further illuminate the sensing process, the adsorption locate were performed for acetone using the Sorption module are illustrated in Fig. S33.† All the calculations were completed in the Materials Studio 7.0 package according to the literature method. The atomic locations were derived from the experimental crystal data and calculated charges were applied. The acetone molecule was geometrically optimized by using DMol3 model based on the B3LYP function. The favorable adsorption sites were simulated by the locate task in Sorption model. The binding energy was calculated by the energy task in DMol3 model based on the B3LYP function. The calculated binding energy of 1-Ln for acetone was −0.014 Ha.
Fig. 5. (a) Luminescent spectra of Eu0.1Y0.9 dissolved in different solvents (λex = 275 nm). (b) Bar chart obtained for Eu0.1Y0.9 upon addition of different solvents. (c) Luminescent spectra of Eu0.1Y0.9 with the gradual addition of acetone (0–100 ppm).
3.5. The quenching mechanism
The quenching mechanism of luminescent CPs or MOFs is commonly related to two processes: energy transfer and photo induced electron transfer. Energy transfer occurs only when the emission spectrum or excitation of CPs or MOFs overlaps with the absorption spectrum of the analytes. As demonstrated by Fig. S30 and S31 of the ESI,† the absorption band of Fe3+, Cr3+ has the greatest degree of overlapping with the excitation spectra of Eu0.1Y0.9 and Tb0.1Y0.9. In addition, acetone has the greatest degree of overlapping with the excitation spectra of Eu0.1Y0.9 and Tb0.1Y0.9 while the spectral overlapping is negligible for other organic solution. The absorption of the excitation energy by these analytes reduces the excitation energy to sensitize the Eu3+ and Tb3+, which lead to luminescence quenching. The spectral overlapping is in good agreement with the maximum quenching efficiency observed for Fe3+, Cr3+ and acetone.
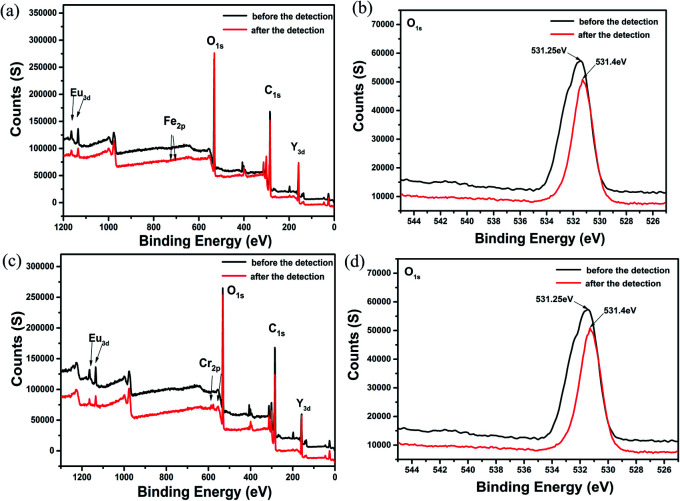
When absorbing energy from light, these delocalized electrons transferred from ground state to excited state to become excited electrons. However, because of the instability of the excited electrons, they fall back to the ground state of the ligands. During this process, the absorbed energy will release in the form of light, thus yielding fluorescence. When Fe3+, Cr3+ ions and acetone were added into this system, the excited electrons transferred to the lowest unoccupied molecular orbital (LUMO) of Fe3+, Cr3+ ions and acetone and then fell back to the ground state of the ligands. The interactions were also further validated by XPS (Fig. 8 and S29†). On the basis of the XPS spectra, the O 1s peak at 531.25 eV was shifted to 531.4 eV in Fe3+@Eu0.1Y0.9. Such a shift (cal. 0.15 eV) reflected the possible higher binding energy of O atoms in Fe3+@Eu0.1Y0.9. The shift of O 1s peak also occurred in Cr3+@Eu0.1Y0.9, Fe3+@Tb0.1Y0.9, Fe3+@Tb0.1Y0.9, which illustrate the interaction between ions and mixed RE-CPs.
Fig. 8. The XPS spectra of Eu0.1Y0.9 before and after the detection of Fe3+ and Cr3+.
3.6. Durability and repeatability of Eu0.1Y0.9 and Tb0.1Y0.9
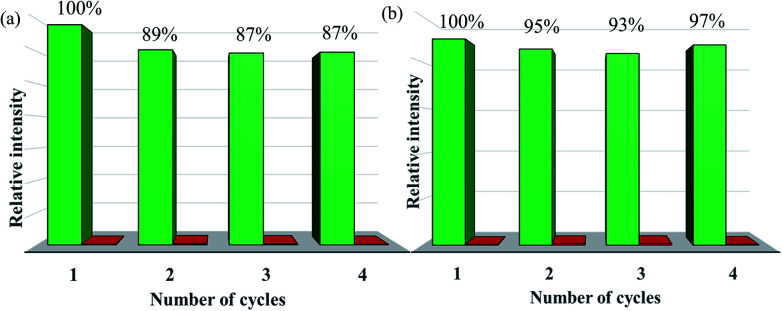
The measured PXRD patterns after the detection of Fe3+, Cr3+ and various organic solvents show retained crystallinity and unchanged structures, implying their excellent stability and durability (Fig. S27 and S28†). Recyclability for a sensor material is a vital parameter to evaluate the sensor's practicability, and so the detection of Fe3+ recycling performance of doped CPs sensors was investigated. When 100 ppm of Fe3+ was added to the suspension of Eu0.1Y0.9, its luminescence intensity at 615 nm is decreased by 99%. After completion of the luminescence measurement, Eu0.1Y0.9 was conveniently recycled by centrifugation and then washed with deionized water for several times. The result in Fig. 7a shows the luminescence intensity of Eu0.1Y0.9 can recover to 89% of its original state through simple process of ultrasonic washing. After this adding and washing process was performed four cycles, the fluorescence intensity exhibits no obvious change. The similar phenomenon was also observed for Tb0.1Y0.9. The luminescence intensity of Tb0.1Y0.9 at 544 nm could recover to 97% of its original state. These results clearly show that mixed RE-CPs have good recyclability and stability.
Fig. 7. Durability and stability of (a) Eu0.1Y0.9 and (b) Tb0.1Y0.9 dispersed in Fe3+ ions aqueous solution (the green bars represent the initial fluorescence intensity, and the red bars represent the intensity upon addition an aqueous solution of 1 mL of 1 × 10⁻² M Fe3+ ion).
3.7. Time-dependent luminescence
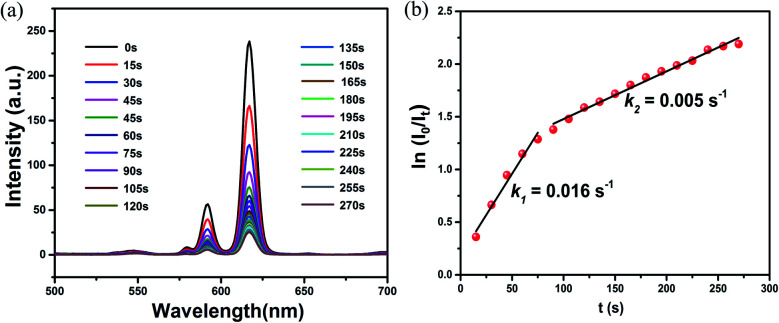
The time-dependent luminescence measurement was carried out to evaluate the sensitivity of doped CPs. As illustrated in Fig. 6 and S20–S26,† a real-time luminescent sensor was performed. The time-dependent luminescence emission intensity of Eu0.1Y0.9 shows a continuously decrease upon exposure to Fe3+ (50 ppm), with a 50% fluorescence decrement in 50 s, which further decreased to 90% in 4 min. Such a response time is comparable to 1-Eu and 1-Tb. By applying the first-order kinetic model, the related linear correlations of ln(I0/It) versus time (I0 and It stand for luminescent intensity at the initial and at the intervals stage of the Eu0.1Y0.9 and Tb0.1Y0.9, respectively) were obtained to evaluate the reaction rates of the reduction of luminescent intensity. Eu0.1Y0.9 has rate constant (k) of 1.6 × 10⁻² s−1, 2 × 10⁻³ s−1 for Fe3+ and Cr3+, respectively, and Tb0.1Y0.9 has rate constant (k) of 1.0 × 10⁻² s−1 and 1 × 10⁻³ s−1, respectively. These values are superior to 1-Eu and 1-Tb as displayed in S23–S26† (1-Eu has rate constant (k) of 2.0 × 10⁻³ s−1, 6.0 × 10⁻⁴ s−1 for Fe3+ and Cr3+, respectively, and 1-Tb has rate constant (k) of 1.0 × 10⁻³ s−1 and 6.0 × 10⁻⁴ s−1, respectively).
Fig. 6. (a) Time-dependent emission spectra after exposure of Eu0.1Y0.9 to the Fe3+. (b) Fluorescence quenching percentage by Fe3+ (λex = 275 nm). (b) Plots of ln(I0/It) for the luminescent intensity of Eu0.1Y0.9 at 615 nm obtained from the spectra.
3.8. Test paper
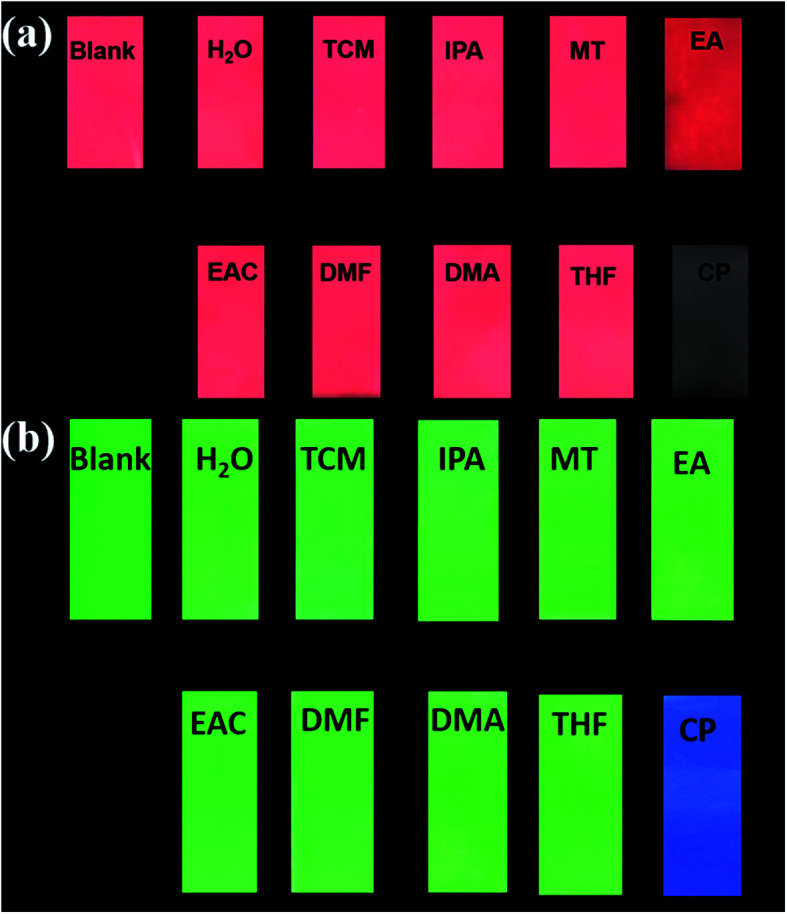
To achieve real-time and convenient detection, luminescence test papers were designed and prepared. The previous reported test paper was developed through immersing a filter paper into ethanol dispersion of MOF and then drying at room temperature.48–52 Herein, we adopting spraying method to prepare test papers to disperse samples uniformly. Firstly, 50 mg of mixed RE-CPs were ground and dispersed in 10 mL ethanol. Subsequently, the suspension was added to spray gun and sprinkled in a piece of filter paper uniformly. The dry test papers of Eu0.1Y0.9 and Tb0.1Y0.9 were soaked in different organic solution for seconds. As shown in Fig. 9, by irradiation of 365 nm UV light, the original bright red/green colour of test paper was retentive for most organic solution, but the colour of the test papers almost disappeared for acetone. The simple and convenient test paper may be applied to the detection in environmental areas and biological system. Next, our further studies will focus on exploring quantitative test paper.
Fig. 9. Optical images of Eu0.1Y0.9 test papers under UV light irradiation at 365 nm after immersion in various solutions.
4. Conclusion
In conclusion, we construct two serious of mixed RE-CPs using Y3+ as a matrix to dilute Eu3+/Tb3+ and reduce the non-radiative transition result from concentration quenching. The introduction of Y3+ does not change the luminescence characteristic peak of 1-Eu and 1-Tb but enhances its intensity, luminescence lifetime and quantum yield. The luminescence of these materials could be selectively quenched by Fe3+, Cr3+ and acetone. Furthermore, Eu0.1Y0.9 and Tb0.1Y0.9 demonstrate high sensitivity and good selectivity towards Fe(iii), Cr(iii) and acetone. Especially, fine fluorescence visibility provides necessary condition for preparation of simple and fast fluorescent test paper in order to achieve real-time and convenient detection of these toxic materials. These results further highlight a new and promising method by using low-cost Y3+ in place of partial Eu3+/Tb3+ to construct bimetallic RE-CPs as effective luminescent sensors.
Conflicts of interest
There are no conflicts to declare.
Supplementary Material
Acknowledgments
This work was supported by the National Natural Science Foundation of China (No. 21401095 and 21601160), Liaocheng University Start-up Fund for Doctoral Scientific Research (31805) and Student's Platform for Innovation and Entrepreneurship Training Program (CXCY2018057). And this work was supported by Open Project of Shandong Collaborative Innovation Center for Antibody Drugs (No. CIC-AD1836, CIC-AD1835) and Taishan Scholar Research Foundation.
Electronic supplementary information (ESI) available: Synthesis of crystal data, PXRD patterns, TGA curves, IR patterns, and additional fluorescence patterns. CCDC 1989014. For ESI and crystallographic data in CIF or other electronic format see DOI: 10.1039/d0ra06407f
Notes and references
- Zhang Y. N. Niu Q. Gu X. Yang N. Zhao G. Nanoscale. 2019;11:11992–12014. doi: 10.1039/C9NR02935D. [DOI] [PubMed] [Google Scholar]
- Singha D. K. Majee P. Mondal S. K. Mahata P. RSC Adv. 2015;5:102076–102084. doi: 10.1039/C5RA22599J. [DOI] [Google Scholar]
- Zheng M. Tan H. Xie Z. Zhang L. Jing X. Sun Z. ACS Appl. Mater. Interfaces. 2013;5:1078–1083. doi: 10.1021/am302862k. [DOI] [PubMed] [Google Scholar]
- Hou B. L. Tian D. Liu J. Dong L. Z. Li S. L. Li D. S. Lan Y. Q. Inorg. Chem. 2016;55:10580–10586. doi: 10.1021/acs.inorgchem.6b01809. [DOI] [PubMed] [Google Scholar]
- Wang B. Yang Q. Guo C. Sun Y. Xie L. H. Li J. R. ACS Appl. Mater. Interfaces. 2017;9:10286–10295. doi: 10.1021/acsami.7b00918. [DOI] [PubMed] [Google Scholar]
- Wang Y. Wang X. Zhang K. Wang X. Xin X. Fan W. Dai F. Han Y. Sun D. Dalton Trans. 2019;48:2569–2573. doi: 10.1039/C9DT00006B. [DOI] [PubMed] [Google Scholar]
- Smith J. A. Singh-Wilmot M. A. Carter K. P. Cahill C. L. Ridenour J. A. Cryst. Growth Des. 2018;19:305–319. doi: 10.1021/acs.cgd.8b01426. [DOI] [Google Scholar]
- Zhou Y. Yan B. Chem. Commun. 2016;52:2265–2268. doi: 10.1039/C5CC09029F. [DOI] [PubMed] [Google Scholar]
- Liu X. J. Zhang Y. H. Chang Z. Li A. L. Tian D. Yao Z. Q. Jia Y. Y. Bu X. H. Inorg. Chem. 2016;55:7326–7328. doi: 10.1021/acs.inorgchem.6b00935. [DOI] [PubMed] [Google Scholar]
- Yan W. Zhang C. Chen S. Han L. Zheng H. ACS Appl. Mater. Interfaces. 2017;9:1629–1634. doi: 10.1021/acsami.6b14563. [DOI] [PubMed] [Google Scholar]
- Sun X. Wang Y. Lei Y. Chem. Soc. Rev. 2015;44:8019–8061. doi: 10.1039/C5CS00496A. [DOI] [PubMed] [Google Scholar]
- Wen L. Zheng X. Lv K. Wang C. Xu X. Inorg. Chem. 2015;54:7133–7135. doi: 10.1021/acs.inorgchem.5b00098. [DOI] [PubMed] [Google Scholar]
- Zhang L. Kang Z. Xin X. Sun D. CrystEngComm. 2016;18:193–206. doi: 10.1039/C5CE01917F. [DOI] [Google Scholar]
- Gao R. C. Guo F. S. Bai N. N. Wu Y. L. Yang F. Liang J. Y. Li Z. J. Wang Y. Y. Inorg. Chem. 2016;55:11323–11330. doi: 10.1021/acs.inorgchem.6b01899. [DOI] [PubMed] [Google Scholar]
- Cui Y. Yue Y. Qian G. Chen B. Chem. Rev. 2012;112:1126–1162. doi: 10.1021/cr200101d. [DOI] [PubMed] [Google Scholar]
- Hu Z. Deibert B. J. Li J. Chem. Soc. Rev. 2014;43:5815–5840. doi: 10.1039/C4CS00010B. [DOI] [PubMed] [Google Scholar]
- Lustig W. P. Mukherjee S. Rudd N. D. Desai A. V. Li J. Ghosh S. K. Chem. Soc. Rev. 2017;46:3242–3285. doi: 10.1039/C6CS00930A. [DOI] [PubMed] [Google Scholar]
- Wang H. Lustig W. P. Li J. Chem. Soc. Rev. 2018;47:4729–4756. doi: 10.1039/C7CS00885F. [DOI] [PubMed] [Google Scholar]
- He J. Xu J. Yin J. Li N. Bu X.-H. Sci. China Mater. 2019;62:1655–1678. doi: 10.1007/s40843-019-1169-9. [DOI] [Google Scholar]
- Li Y. L. Zhao Y. Wang P. Kang Y. S. Liu Q. Zhang X. D. Sun W. Y. Inorg. Chem. 2016;55:11821–11830. doi: 10.1021/acs.inorgchem.6b01869. [DOI] [PubMed] [Google Scholar]
- Jia X. X. Yao R. X. Zhang F. Q. Zhang X. M. Inorg. Chem. 2017;56:2690–2696. doi: 10.1021/acs.inorgchem.6b02872. [DOI] [PubMed] [Google Scholar]
- Xu C. Bi C. Zhu Z. Luo R. Zhang X. Zhang D. Fan C. Cui L. Fan Y. CrystEngComm. 2019;21:2333–2344. doi: 10.1039/C9CE00005D. [DOI] [Google Scholar]
- Yu Y. Wang Y. Yan H. Lu J. Liu H. Li Y. Wang S. Li D. Dou J. Yang L. Zhou Z. Inorg. Chem. 2020;59:3828–3837. doi: 10.1021/acs.inorgchem.9b03496. [DOI] [PubMed] [Google Scholar]
- Singha D. K. Bhattacharya S. Majee P. Mondal S. K. Kumar M. Mahata P. J. Mater. Chem. A. 2014;2:20908–20915. doi: 10.1039/C4TA05014B. [DOI] [Google Scholar]
- Mahata P. Mondal S. K. Singha D. K. Majee P. Dalton Trans. 2017;46:301–328. doi: 10.1039/C6DT03419E. [DOI] [PubMed] [Google Scholar]
- Zhang J. Zheng B. Zhao T. Li G. Huo Q. Liu Y. Cryst. Growth Des. 2014;14:2394–2400. doi: 10.1021/cg500114k. [DOI] [Google Scholar]
- Yu M. Xie Y. Wang X. Li Y. Li G. ACS Appl. Mater. Interfaces. 2019;11:21201–21210. doi: 10.1021/acsami.9b05815. [DOI] [PubMed] [Google Scholar]
- Liu Y. Lu Y. K. Zhang B. Hou L. Wang Y. Y. Inorg. Chem. 2020;59:7531–7538. doi: 10.1021/acs.inorgchem.0c00402. [DOI] [PubMed] [Google Scholar]
- Zhang Q. Wang J. Kirillov A. M. Dou W. Xu C. Xu C. Yang L. Fang R. Liu W. ACS Appl. Mater. Interfaces. 2018;10:23976–23986. doi: 10.1021/acsami.8b06103. [DOI] [PubMed] [Google Scholar]
- Chen Q. Cheng J. Wang J. Li L. Liu Z. Zhou X. You Y. Huang W. Sci. China: Chem. 2018;62:205–211. doi: 10.1007/s11426-018-9367-y. [DOI] [Google Scholar]
- Ren K. Wu S. H. Guo X. F. Wang H. Inorg. Chem. 2019;58:4223–4229. doi: 10.1021/acs.inorgchem.8b03284. [DOI] [PubMed] [Google Scholar]
- Heine J. Muller-Buschbaum K. Chem. Soc. Rev. 2013;42:9232–9242. doi: 10.1039/C3CS60232J. [DOI] [PubMed] [Google Scholar]
- Xu X. Y. Yan B. ACS Appl. Mater. Interfaces. 2015;7:721–729. doi: 10.1021/am5070409. [DOI] [PubMed] [Google Scholar]
- Liu Q. Tan J. Y. Zhang J. Y. Zhang N. Deng W. CrystEngComm. 2020;22:3871–3883. doi: 10.1039/D0CE00476F. [DOI] [Google Scholar]
- Chen C.-X. Liu Q.-K. Ma J.-P. Dong Y.-B. J. Mater. Chem. 2012;22:9027–9033. doi: 10.1039/C2JM30419H. [DOI] [Google Scholar]
- Feng X. Feng Y. Guo N. Sun Y. Zhang T. Ma L. Wang L. Inorg. Chem. 2017;56:1713–1721. doi: 10.1021/acs.inorgchem.6b02851. [DOI] [PubMed] [Google Scholar]
- Chen W. Li L. Li X.-X. Lin L.-D. Wang G. Zhang Z. Li L. Yu Y. Cryst. Growth Des. 2019;19:4754–4764. doi: 10.1021/acs.cgd.9b00635. [DOI] [Google Scholar]
- (a) Matthes P. R. Höller C. J. Mai M. Heck J. Sedlmaier S. J. Schmiechen S. Feldmann C. Schnick W. Müller-Buschbaum K. J. Mater. Chem. 2012;22:10179–10187. doi: 10.1039/C2JM15571K. [DOI] [Google Scholar]; (b) Serre C. Millange F. Thouvenot C. Gardant N. Pellé F. Férey G. J. Mater. Chem. 2004;14:1540–1543. doi: 10.1039/B312425H. [DOI] [Google Scholar]; (c) Liu J. Pei L. Xia Z. Xu Y. Cryst. Growth Des. 2019;19:6586–6591. doi: 10.1021/acs.cgd.9b01014. [DOI] [Google Scholar]
- Hao H. Wang Y. Yuan S. Li D. Sun J. Acta Crystallogr., Sect. C: Struct. Chem. 2018;74:386–391. doi: 10.1107/S205322961800205X. [DOI] [PubMed] [Google Scholar]
- Hao H. Liu H. Wang Y. Yuan S. Xu H. Zhang J. Wang Y. Li D. Sun J. Acta Crystallogr., Sect. C: Struct. Chem. 2019;75:221–230. doi: 10.1107/S2053229618016972. [DOI] [PubMed] [Google Scholar]
- Zhao T. M. Chen S. Shang R. Wang B. W. Wang Z. M. Gao S. Inorg. Chem. 2016;55:10075–10082. doi: 10.1021/acs.inorgchem.6b00952. [DOI] [PubMed] [Google Scholar]
- Badiane A. M. Freslon S. Daiguebonne C. Suffren Y. Bernot K. Calvez G. Costuas K. Camara M. Guillou O. Inorg. Chem. 2018;57:3399–3410. doi: 10.1021/acs.inorgchem.8b00169. [DOI] [PubMed] [Google Scholar]
- Wang Y. Zhang K. Wang X. Xin X. Zhang X. Fan W. Xu B. Dai F. Sun D. J. Mater. Chem. C. 2020;8:1374–1379. doi: 10.1039/C9TC05471E. [DOI] [Google Scholar]
- Guzman-Mendez O. Gonzalez F. Bernes S. Flores-Alamo M. Ordonez-Hernandez J. Garcia-Ortega H. Guerrero J. Qian W. Aliaga-Alcalde N. Gasque L. Inorg. Chem. 2018;57:908–911. doi: 10.1021/acs.inorgchem.7b02861. [DOI] [PubMed] [Google Scholar]
- Mi X. Sheng D. Yu Y. Wang Y. Zhao L. Lu J. Li Y. Li D. Dou J. Duan J. Wang S. ACS Appl. Mater. Interfaces. 2019;11:7914–7926. doi: 10.1021/acsami.8b18320. [DOI] [PubMed] [Google Scholar]
- Steemers F. J. Verboom W. Reinhoudt D. N. Vandertol E. B. Verhoeven J. W. J. Am. Chem. Soc. 1995;117:9408–9414. doi: 10.1021/ja00142a004. [DOI] [Google Scholar]
- Kent C. A. Liu D. Meyer T. J. Lin W. J. Am. Chem. Soc. 2012;134:3991–3994. doi: 10.1021/ja211271m. [DOI] [PubMed] [Google Scholar]
- Chen D. M. Tian J. Y. Chen M. Liu C. S. Du M. ACS Appl. Mater. Interfaces. 2016;8:18043–18050. doi: 10.1021/acsami.6b04611. [DOI] [PubMed] [Google Scholar]
- Hao J. N. Yan B. Adv. Funct. Mater. 2017;27:1603856. doi: 10.1002/adfm.201603856. [DOI] [Google Scholar]
- Xiao J. N. Liu J. J. Gao X. C. Ji G. F. Wang D. B. Liu Z. L. Sens. Actuators, B. 2018;269:164–172. doi: 10.1016/j.snb.2018.04.129. [DOI] [Google Scholar]
- Liu J. Ji G. Xiao J. Liu Z. Inorg. Chem. 2017;56:4197–4205. doi: 10.1021/acs.inorgchem.7b00157. [DOI] [PubMed] [Google Scholar]
- Li Y. P. Zhu X. H. Li S. N. Jiang Y. C. Hu M. C. Zhai Q. G. ACS Appl. Mater. Interfaces. 2019;11:11338–11348. doi: 10.1021/acsami.8b20410. [DOI] [PubMed] [Google Scholar]
Associated Data
This section collects any data citations, data availability statements, or supplementary materials included in this article.


