Abstract
LiCoPO4 (LCP) is a promising high voltage cathode material but suffers from low conductivity and poor electrochemical properties. These properties can be improved by coating with a conductive carbon layer. Ongoing research is focused on the protective layer with good adhesion and inhibition of electrolyte decomposition reactions. In the present work, we suggest a new robust one-pot procedure, featuring the introduction of UiO-66 metal–organic framework (MOF) nanoparticles during LCP synthesis to create a metal–carbon layer upon annealing. The LiCoPO4/C@UiO-66 was synthesized via the microwave-assisted solvothermal route, and 147 mA h g−1 discharge capacity was obtained in the first cycle. The MOF acts as a source of both carbon and metal atoms, which improves conductivity. Using operando X-ray absorption spectroscopy upon cycling, we identify two Co-related phases in the sample and exclude the olivine structure degradation as an explanation for a long-term capacity fade.
LiCoPO4 (LCP) is a promising high voltage cathode material but suffers from low conductivity and poor electrochemical properties.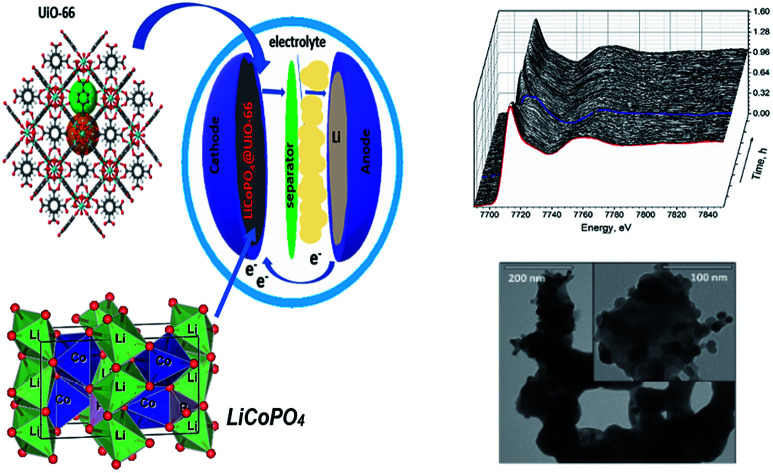
1. Introduction
Ongoing research in the field of Li-ion batteries focuses on the improvement of energy density and power performance.1,2 A straightforward approach to improve these properties is the use of a high voltage positive electrode material.3–5 In the family of LiMPO4 olivines, the voltage of the redox pair equals 3.4 V, 4.1 V, and 5 V for M = Fe, Mn, Co correspondingly.6–9 The corresponding specific energy ranges from 578 W h kg−1 for LiFePO4 to 802 W h kg−1 for LiCoPO4.10,11 However, the practical use of high-voltage materials faces two serious difficulties. First is the stability range of nonaqueous standard electrolyte (usually LiPF6 in EC/DMC), which lies between 3.5 V and 4.8 V versus Li/Li+.12,13 Due to the high voltage of the LiCoPO4, an interaction between cathode material and electrolyte occurs, leading to the decomposition of the electrolyte.10,14,15 LiMnPO4 has a favorable potential of the redox plateau, but its capacity suffers due to the substantial Jahn–Teller lattice distortions upon Mn2+/Mn3+ conversion.16 The second issue is the poor electrical conductivity of LCP, which is six orders of magnitude less than for LiFePO4 – 10−15 cm−1versus 10−9 cm−1.10,17
Surface coating and grain boundary engineering18 play a significant role in improving the cycle stability of the cathode material. Usually, the source of carbon in the form of bulky organic molecules19 is added during material synthesis and then graphitized upon annealing. Metal doping can further improve structural stability, suppress unfavorable phase changes at voltages above 4.5 V, and stabilize surface.20 As a result, sp2 conductive carbon coating improves electron mobility, while both carbon and metal dopants protect the surface of the cathode nanoparticles.21 The choice of coating material is the key to improve electrochemical performance. In this sense, metal–organic frameworks (MOF) can act both as a source of metal and conductive carbon for the surface coating.22,23 Xiao Long Xu et al.24 coated the commercial LiFePO4 by zeolitic imidazolate frameworks, ZIF-8. They report an improvement in cycling properties. In particular, the initial discharge capacity and capacity retention: 159.3 mA h g−1 in the first cycle, and 141 mA h g−1 after 200 cycles.24 Xie et al.25 coated Li1.2Mn0.54Co0.13Ni0.13O2 by ZrO2 using UiO-66-F4 MOF as a precursor. The discharge capacity of the MOF coated material was 279 and 110.0 mA h g−1 at 0.1C and 5C, respectively. MOF-derived carbon was used as a coating layer for Li3V2(PO4)3 cathode material and led to a remarkable enhanced the stability of electrochemistry with high discharge specific capacity at around 113.1 and 105.8 mA h g−1 at a rate of 0.5C and 1C after 1000 cycles.26
Herein we report the one-pot synthesis of LiCoPO4/C@UiO-66 composite using MW-assisted solvothermal method to enhance the surface of LiCoPO4. According to previous studies,27,28 the metal oxides one of the most widely used coating materials, has been testified that they are highly stable under exertive conditions like extended operational potential window and elevated cycling temperature. Zirconium dioxide is a chemically stable compound that can protect cathode material from side reactions at the cathode-electrolyte interface, however, it suffers from the low conductivity due to its dielectric properties. The use of UiO-66 MOF as a precursor for ZrO2 layer formation would provide both additives – protective oxide phase with uniform size distribution and conductive carbon layer. Pnma LCP phase is formed after annealing, and the use of MOF as a source of carbon improves the specific capacity of the material with respect to the glucose source for coating. Cobalt local atomic structure during cycling is addressed by means of operando XANES spectroscopy. We show that capacity fade is proportional to the decrease in efficiency of Co2+/Co3+ phase transition, but no Co-related secondary phases can be derived using the principal component analysis.
2. Experimental methods
2.1. UiO-66 synthesis
Metal precursor ZrCl4, terephthalic acid (H2BDC), benzoic acid (BA), N,N-dimethylformamide (DMF) were purchased from Alfa Aesar and used without further purification. Deionized (DI) water (18 MΩ cm) was obtained from a Simplicity UV ultrapure water system. The synthesis procedure was adopted from ref. 29 and 30. In a typical procedure, ZrCl4 was dissolved in DMF under magnetic stirring, then DI water was added. After that, the BA was added and completely dissolved. Finally, the H2BDC linker was poured to a clear solution. Molar ratio Zr : BDC : BA : H2O : DMF was 1 : 1 : 10 : 3 : 300. The vessel was capped and placed into the preheated oven at 120 °C for 24 h. After cooling to room temperature, a white precipitate was collected using centrifugation, washed one time with DMF and one time with methanol, and dried at 100 °C overnight. The particle size was around 100 nm, and the specific surface area was 1500 m2 g−1.
2.2. LiCoPO4/C@UiO-66 composite synthesis
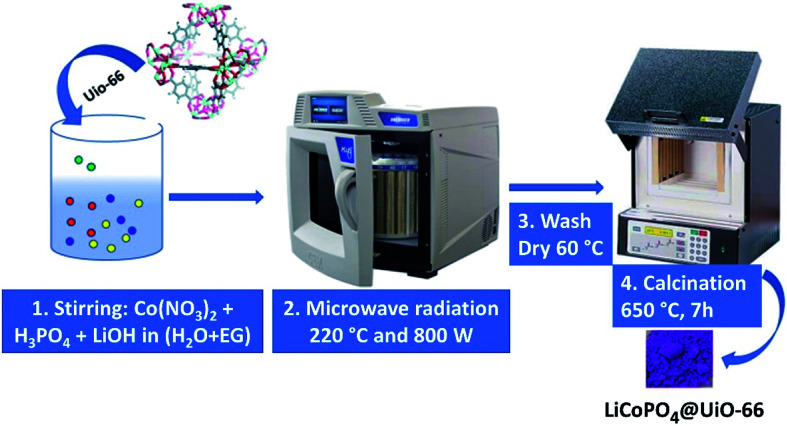
Two solutions A and B were used for the synthesis. Solution A: 0.0735 g of LiOH·H2O was dissolved in 333 μl of water, and 6.67 ml of ethylene glycol was added. Solution B: 0.0420 g of LiOH·H2O was dissolved in 1 ml water, 68.3 μl of H3PO4 was added. After this, the volume of the solution B was adjusted to 3 ml with water, and Co(NO3)2·6H2O (0.2910 g), C6H12O6 (0.1026 g), and 0.0145 g of UiO-66 powder were added and mixed with a magnetic stirrer to obtain a homogeneous solution. Finally, solution A was added to solution B. Resulting mixture was placed in a Teflon vessel at 220 °C for three hours under 800 W power in MW oven. The final blue precipitate was collected by centrifuging and washed with ethanol and water for three times. Then we annealed the product in the air for seven hours at 650 °C, as demonstrated in Fig. 1. The LiCoPO4 covered by glucose (further referred to as LiCoPO4/C) was synthesized according to the same protocol but without the UiO-66 additive.
Fig. 1. The scheme of the reaction procedure to obtain LiCoPO4/C@UiO-66 nanoparticles.
2.3. X-ray characterization
The XRD patterns of resulting powder were recorded by a laboratory X-ray diffractometer D2 Phaser (Bruker, Germany) using Cu Kα1 radiation (λ = 1.540598 Å). Subsequent refinement was performed by the Rietveld technique in the FullProf package.31 Bulk and surface-sensitive elemental analysis was performed using Bruker M4-Tornado X-ray fluorescence spectrometer, operated with Rh anode at 50 kV and 300 μA and ESCALab 5 (Vacuum Generators) X-ray photoelectron spectrometer.
2.4. Electrochemical characterization
The electrochemical performance of as-prepared and annealed materials was tested by galvanostatic charge/discharge using a P-20X potentiostat/galvanostat device (Elins, Russia). The materials were mortared with carbon black (Super P conductive) by weight in 80% : 20% active material to carbon ratio. The resulting mixture was then placed into the cell as a cathode (7.5 mg cm−2 load of active material) vs. Li foil as an anode. Glass microfiber filter (Whatman, grade GF/C) was used as a separator and 1 M LiPF6 in EC/DMC = 50/50 (v/v) (Sigma Aldrich) as an electrolyte. The cells were assembled in Ar-filled glove bag (Sigma Aldrich) and cycled in 3–5.1 V range with C/10 current (where C is the theoretical cell capacity). For measuring the impedance of electronic and ionic resistance, the powder was pressed ∼3-ton pressure to form the pellets approximately 15 mm thick and 10 mm diameter. The pellets were sintered at 700 °C for 2 hours in air and slowly cooled down to room temperature. Suitable thick from graphene was coated on both sides of both pellets. Using PARSTAT 4000 measured the impedance in the frequency range of 1 MHz to 100 mHz with AC amplitude of 10 mV in the room temperature.
2.5. XAS characterization
Ex situ Co K-edge X-ray absorption spectra (XAS) of LiCoPO4 samples and references were measured with R-XAS Looper (Rigaku, Japan) laboratory XAS-spectrometer. All measurements were performed in transmission geometry with Ge (311) crystal as a monochromator, providing energy resolution ΔE = 1.9 eV. The incident beam intensity was measured by Ar-filled (300 mbar) ionization chamber, transmitted intensity – by scintillation counter with a photomultiplier tube. The samples for measurements were mixed with 50 mg of dry cellulose powder and pressed into pellets. The amount of optimal mass for the sample powder was calculated using XAFSmass software.32
Operando XAS measurements were performed utilizing the same laboratory spectrometer and electrochemical cell equipped with X-ray transparent glassy carbon windows serving as current collectors.33 Cathode materials were prepared for measurements in the same way as used for electrochemical characterization. The cell was loaded with 8.5 mg cm−2 of the sample in 2.5–5.3 V range with C/25 current. XAS spectra were measured instantaneously during cycling (around 20 minutes for a single spectrum).
2.6. TEM imaging
Transmission electron microscopy (TEM) images were acquired on the FEI Tecnai G2 Spirit TWIN transmission electron microscope operated at an accelerating voltage of 80 kV.
3. Results and discussion
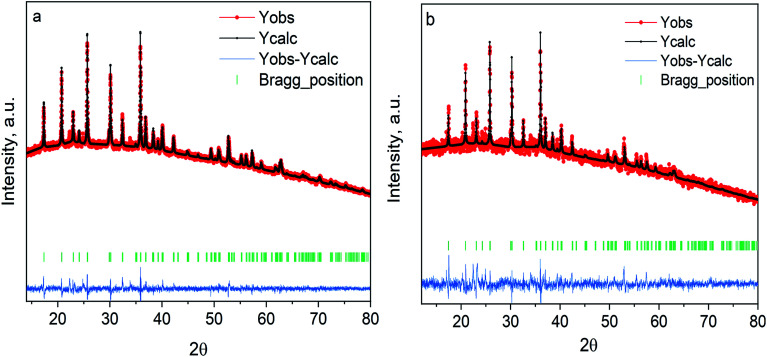
The LiCoPO4/C and LiCoPO4/C@UiO-66 were synthesized by MW-assisted solvothermal technique and characterized by X-ray powder diffraction. Fig. 2 demonstrates the diffraction patterns of glucose and MOF-coated LiCoPO4@UiO-66 after annealing. Both can be indexed by the single olivine structure (Cod: 2300246) with the orthorhombic Pnma space group. We see no reflections from the crystalline UiO-66 phase after annealing. Refined lattice parameters of samples under study are smaller than reported for bulk crystals, as shown in Table 1. This effect is attributed to the small size of MW-synthesized particles and deviations of Li stoichiometry on the surface.
Fig. 2. Experimental XRD patterns for (a) LiCoPO4 coated with carbon (b) LiCoPO4/coated with UiO-66. Red dots are used for the measured intensity (Yobs), black dots for the simulated intensity (Ycalc), the blue line is the residual intensity (Yobs–Ycalc).
The lattice parameters after Rietveld refinement.
| Sample | a (Å) | b (Å) | c (Å) | Volume (Å)3 | Space group | Chi2 |
|---|---|---|---|---|---|---|
| LiCoPO4/C | 10.185 | 5.916 | 4.688 | 282.47 | Pnma | 1.93 |
| LiCoPO4/C@UiO-66 | 10.181 | 5.907 | 4.682 | 281.57 | Pnma | 1.59 |
| LiCoPO4 (ref. 34) | 10.199 | 5.918 | 4.699 | 283.71 | Pnma |
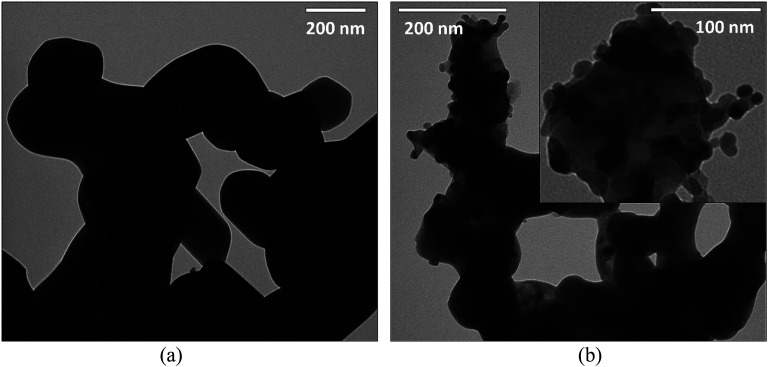
To visualize the microstructure of the LiCoPO4 materials after annealing, we used TEM measurements, as demonstrated in Fig. 3. The LiCoPO4/C consists of agglomerated nanoparticles with an average particle size of 150 nm and a smooth surface. On the contrary, LiCoPO4 particles synthesized in the presence of UiO-66 nanoparticles have an average size of around 70 nm, as shown in Fig. 3b. Visible roughness on the surface of LiCoPO4/C@UiO-66 is attributed to zirconium dioxide nanoparticles formed from UiO-66 after annealing. The size of ZrO2 particles is in the range from 9 to 16 nm, as shown in Fig. 3b (inset).
Fig. 3. The TEM photos for (a) carbon coated LiCoPO4, (b) LiCoPO4/C@UiO-66 composite.
Bulk- and surface-sensitive elemental analysis is described in Sections S2 and S3 of ESI.† The X-ray fluorescence spectroscopy is bulk sensitive and reveals the presence of both Zr and Co emission lines in the spectrum with mass concentrations of 3.7% and 67% correspondingly. The XPS spectroscopy identified the presence of carbon, oxygen, phosphorous, cobalt, and zirconium lines in the overview spectrum as presented in Fig. S3.† The relative intensity of the cobalt line was reduced with respect to the expected values obtained from XRF analysis and we can conclude that LiCoPO4 was covered by derivatives of UiO-66 MOF obtained after annealing.
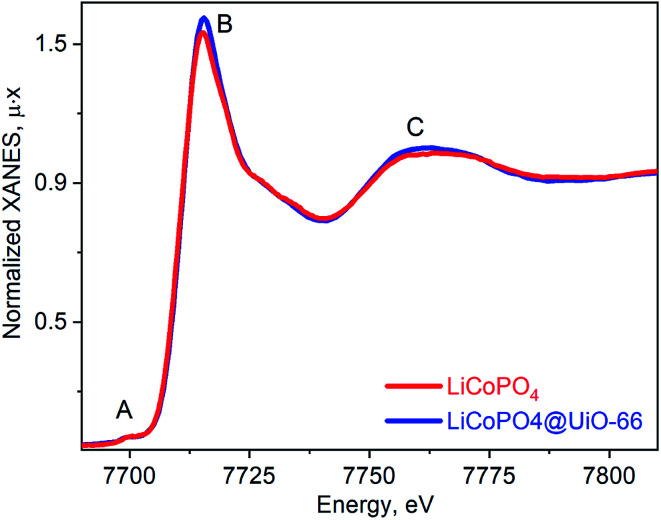
Fig. 4 shows the ex situ Co K-edge XAS was further used to confirm Co oxidation state and phase purity. The spectrum for LiCoPO4/C@UiO-66 is similar to the pristine LCP both in terms of the absorption edge position and maxima positions. Small pre-edge peak A is characteristic of the octahedral local environment of cobalt. The higher intensity of peaks A and B is characteristic to the Co(ii) oxide and can be a signature of this phase in the sample with a contribution below 5%.
Fig. 4. Co K-edge XANES spectra for as prepared LiCoPO4/C (red line) and UiO-66 coated (blue line).
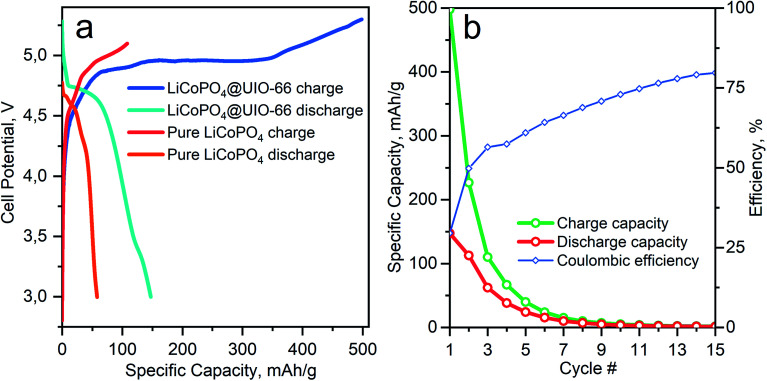
Fig. 5 shows the electrochemical performance of the cathode materials cycled under identical conditions. The galvanostatic lithiation/delithiation test of LiCoPO4 in Li half cell was performed at 0.1C in the potential range from 2.75 to 5.1 V. The initial discharge specific capacity of LiCoPO4/C was 52 mA h g−1, as shown in Fig. 5a, which is a 33% of theoretical capacity. The poor electrochemical performance of the LiCoPO4 is mainly attributed to the irreversible capacity losses, which results from electrolyte decomposition during the first charge in the higher voltage region up to 5 V.15
Fig. 5. (a) Comparison between 1st cycle charge and discharge for carbon and C/UiO-66 coated LiCoPO4 samples. (b) Specific capacity on charge and discharge and coulombic efficiency for LiCoPO4/C@UiO-66 as a function of cycle number during operando Co K-XANES measurements.
Coating by UiO-66 enhances the electrochemical performance of the material. In Fig. S1† we show that conductivity of LiCoPO4/C@UiO-66 measured by impedance spectroscopy is much better than LiCoPO4/C. The initial discharge specific capacity for LiCoPO4/C@UiO-66 is 147 mA h g−1 and corresponds to 87% of the theoretical capacity for LiCoPO4. This enhancement originates from ZrO2 acting as a buffer layer, decreasing the speed of electrolyte decomposition, as demonstrated in Fig. 5a. In Table 2 we compare the discharge capacity of our material with published works where the conductive layer was introduced in situ during synthesis.
Comparison study between our work and results obtained for carbon-coated LCP particles published by other works.
| Precursors | Coating process | Source of carbon | Temperature, time, gas | Methods | Specific capacity mA h g−1 (rate, C) | Ref. |
|---|---|---|---|---|---|---|
| CoSO4·7H2O, Li3PO4 | In situ | Glucose | 200 °C, 24 h, 700 Ar | Hydrothermal | 107.9 (0.1C) | 35 |
| CoSO4·7H2O, Li3PO4 | In situ | Ascorbic acid | 200 °C, 24 h, 700 Ar | Hydrothermal | 112.9 (0.1C) | 35 |
| CoSO4·7H2O, Li3PO4 | In situ | CMC | 200 °C, 24 h, 700 Ar | Hydrothermal | 135 (0.1C) | 35 |
| LiOH, CoSO4·7H2O, (NH4)3PO4·3H2O | In situ | Glucose | 200 °C, 8 h | Hydrothermal | 136 (0.1C) | 36 |
| 750, 12 h Ar | ||||||
| LiOH, CoSO4, H3PO4 | In situ | Glucose | 230 °C, 15 min | Microwave assisted solvothermal | 52 (0.1C) | 37 |
| 700 °C, 1 h, Ar | ||||||
| CH3COOLi·2H2O, Co(C5H7O2)2, H3PO4 | In situ | Carbon | 700 °C, 12 h, Ar | Sol–gel | 114 (2C) | 38 |
| LiOH·H2O, C19H42BrN, H3PO4, Co(CH3COO)2·4H2O | In situ | PVP | 180 °C, 24 | Hydrothermal | 120 (0.1C) | 39 |
| 650 °C, air | ||||||
| LiOH·H2O, Co(NO3)2·6H2O, H3PO4 | In situ | Glucose | 220 °C, 3 h | Microwave assisted solvothermal | 52 (0.1C) | Current work |
| 650 °C, air, 6 h | ||||||
| LiOH·H2O, Co(NO3)2·6H2O, H3PO4, UiO-66 | In situ | UiO-66 | 220 °C, 3 h | Microwave assisted solvothermal | 147 (0.1C) | Current work |
| 650 °C, air, 6 h |
Table 2 demonstrates the superior capacity for LiCoPO4/C@UiO-66 over traditional carbon coatings. However, degradation effects are also present for the composite material as clear from Fig. 5b. The discharge capacity between the 2nd and the 3rd cycles decreases from 110 to 60 mA h g−1 and refers to the instability of electrolyte [LiPF6] on the surface of LiCoPO4. Therefore we apply operando XAS to monitor changes in the Co local atomic and electronic structures upon cycling and degradation.
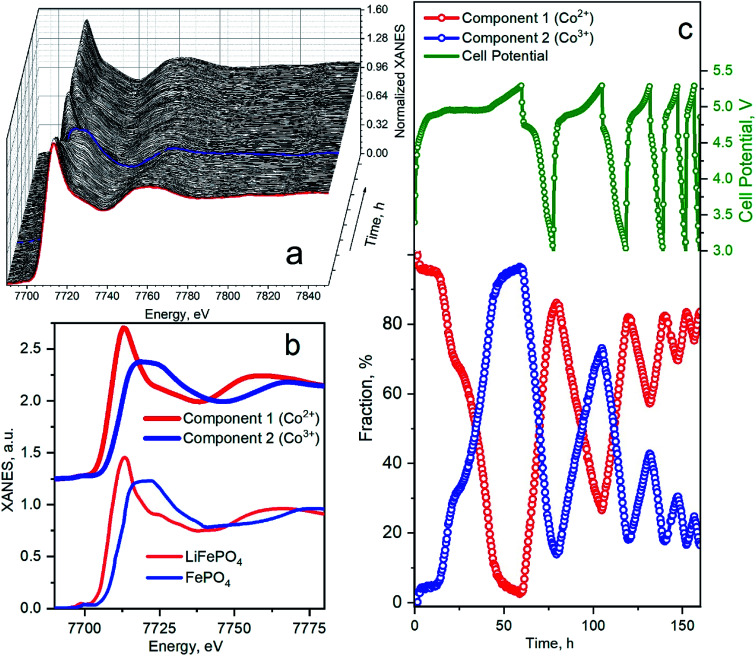
Fig. 6 shows a quantitative analysis of Co K-edge XAS spectra measured during cycling. The whole series of spectra acquired in the first five cycles are presented in Fig. 6a. The first spectrum of the as-prepared material is marked by a bold red line. At the end of the first charge, the absorption edge shifts to the higher energies along with the change of the spectral shape. Kaus et al.11 interpreted these changes as the phase transition to CoPO4 phase. The blue bold line in Fig. 6a corresponds to the fully charged spectrum measured at 5.3 V. In the successive cycles, a variation of spectra was less prominent, indicating a smaller fraction of material that undergoes phase transformation. This set of spectra was decomposed by means of principal component analysis as implemented in the PyFitIt code.40 The two principal components are shown in Fig. 6b in comparison to Fe K-edge LiFePO4, and FePO4 spectra shifted to the energies of Co K-edge. The first component can be attributed to the Co2+ ion in LiCoPO4 and the second component – to the Co3+ in CoPO4. Fig. 6c shows the fraction of each component in % mapped onto the cell voltage profile.
Fig. 6. (a) Co K-edge XANES spectra for LiCoPO4/C@UiO-66 acquired during charge–discharge cycles. The red line corresponds to an as-prepared sample. Blue spectrum was measured at the end of the first charge. (b) Principal components extracted from the series of spectra in panel (a) compared to the experimental spectra for LiFePO4 and FePO4 (ref. 45) (Fe K-XANES spectra are shifted to Co K-edge energies). (c) Cell potential and corresponding fractions of each phase as a function of measurement time during the first five cycles. Dots on a green voltage profile mark the start time for the measurement of each successive XAS spectrum.
Concentration profiles reproduce the trend of capacity fade. In the first charge, Co2+ is almost fully converted to Co3+; therefore, almost of Li ions were extracted from the cathode material. We clearly observe a two-step mechanism in the first charge, which indicates the formation of the intermediate Li0.7CoPO4 phase, observed by Bramnik et al.41. In the first discharge, 15% of Co3+ were not converted back to Co2+ even when cell voltage decreased below 3 V. This amount of residual Co3+ phase remains similar at the end of all discharge cycles. This residual phase could appear due to the instability of the fully delithiated CoPO4 phase, which we obtained in the first cycle.42 The amount of extracted Li and the corresponding fraction of oxidized Co at the end of successive charge cycles decreases. In the second charge, 75% of Co2+ was oxidized to Co3+ while in the 3rd charge cycle, only 45% of Co2+ were oxidized. Remarkably that we could not identify the third component during PCA analysis – i.e., Co local atomic structure is changing between one in LiCoPO4 and CoPO4 upon degradation. Therefore the shortening and disappearance of the plateau on the voltage profile is not related to the material degradation but can be attributed to the blocking the Li-extraction mechanism. This can happen due to the decomposition reaction of the electrolyte upon the charging process.43 The electrolyte is affected by the nucleophilic attack of F− anions in solution on the P atoms, resulting in the breaking of the P–O bonds of the phosphate anions and the formation of soluble LiPO2F2 moieties.15 The protective composite coating reduces the kinetics of this process, but the further modification of electrolyte is required to suppress the dissolution.44
4. Conclusion
The LiCoPO4/C@UiO-66 composite was synthesized via microwave-assisted solvothermal technique in one step and was subsequently annealed. The XRD confirmed the single orthorhombic olivine phase without a significant amount of impurities. The average size of LCP particles synthesized in the presence of UiO-66 nanoparticles decreased from 150–200 nm to 50 nm. The surface of LiCoPO4/C@UiO-66 was covered by small (<10 nm) particles attributed to amorphous zirconium dioxide. The discharge capacity of the new material was 147 mA h g−1 – larger than obtained for conventional carbon-coated LCP. However, when using standard EC/DMC electrolyte, the fade of the capacity was observed. We used laboratory-based operando Co K-edge XAS and monitored the Co local atomic structure during a week of cycling. PCA analysis identifies the presence of only two local geometries around Co ions, which correspond to Co2+ in LiCoPO4 and Co3+ in CoPO4 redox pair. We also found that in the first discharge, around 15% of Li ions can not be inserted back to LCP lattice, and this fraction remains almost constant in other cycles. The latter fact can be attributed to the partial amorphization of delithiated CoPO4 phase which made it not accessible to Li-ion diffusion. Based on the operando XAS analysis we demonstrate that capacity fading is attributed to the impossibility of Li extraction from the LiCoPO4 material.
Conflicts of interest
There is no any conflict of interest.
Supplementary Material
Acknowledgments
The work was financially supported by the Ministry of Science and Higher Education of the Russian Federation (State assignment in the field of scientific activity, no. 0852-2020-0019).
Electronic supplementary information (ESI) available. See DOI: 10.1039/d0ra05706a
References
- Shao T. Liu C. Deng W. Li C. Wang X. Xue M. Li R. Batteries Supercaps. 2019;2:403–427. doi: 10.1002/batt.201800147. [DOI] [Google Scholar]
- Zhang M. Garcia-Araez N. Hector A. L. J. Mater. Chem. A. 2018;6:14483–14517. doi: 10.1039/C8TA04063J. [DOI] [Google Scholar]
- Li W. Song B. Manthiram A. Chem. Soc. Rev. 2017;46:3006–3059. doi: 10.1039/C6CS00875E. [DOI] [PubMed] [Google Scholar]
- Deng D. Energy Sci. Eng. 2015;3:385–418. doi: 10.1002/ese3.95. [DOI] [Google Scholar]
- Aboraia A. M. Shapovalov V. V. Vetlitsyna-Novikova K. Guda A. A. Butova V. V. Zahran H. Y. Yahia I. S. Soldatov A. V. J. Phys. Chem. Solids. 2020;136:109192. doi: 10.1016/j.jpcs.2019.109192. [DOI] [Google Scholar]
- Takahashi M. Tobishima S.-i. Takei K. Sakurai Y. Solid State Ionics. 2002;148:283. doi: 10.1016/S0167-2738(02)00064-4. [DOI] [Google Scholar]
- El Khalfaouy R. Addaou A. Laajeb A. Lahsini A. Int. J. Hydrogen Energy. 2019;44:18272–18282. doi: 10.1016/j.ijhydene.2019.05.129. [DOI] [Google Scholar]
- Kozawa T. Kondo A. Fukuyama K. Naito M. Koga H. Shimo Y. Saito T. Iba H. Inda Y. Oono T. Katoh T. Nakajima K. J. Solid State Electrochem. 2019;23:1297–1302. doi: 10.1007/s10008-019-04218-4. [DOI] [Google Scholar]
- Amalia Fibriyanti A. Astutik W. Fuad A. Prihandoko B. Hidayat N. Mufti N. Diantoro M. Mater. Today: Proc. 2019;13:241–245. [Google Scholar]
- Kosova N. V. Podgornova O. A. Devyatkina E. T. Podugolnikov V. R. Petrov S. A. Kosova N. V. J. Mater. Chem. A. 2014;2:20697–20705. doi: 10.1039/C4TA04221B. [DOI] [Google Scholar]
- Kaus M. Issac I. Heinzmann R. Hahn H. Kubel C. Indris S. Heinzmann R. Doyle S. Mangold S. Hahn H. Chakravadhanula V. S. K. Kubel C. Ehrenberg H. Indris S. Ehrenberg H. Indris S. J. Phys. Chem. C. 2014;118:17279–17290. doi: 10.1021/jp503306v. [DOI] [Google Scholar]
- Mesilov V. V. Shamin S. N. Galakhov V. R. Kellerman D. G. Phys. Met. Metallogr. 2019;120:222–227. doi: 10.1134/S0031918X19030086. [DOI] [Google Scholar]
- Priyadharsini N. Rupa Kasturi P. Shanmugavani A. Surendran S. Shanmugapriya S. Kalai Selvan R. Priyadharsini N. J. Phys. Chem. Solids. 2018;119:183–192. doi: 10.1016/j.jpcs.2018.03.004. [DOI] [Google Scholar]
- Wangda L. Andrei D. Pilgun O. Hugo C. Suhyeon P. Jaephil C. Arumugam M. Nat. Commun. 2017;8:14589. doi: 10.1038/ncomms14589. [DOI] [PMC free article] [PubMed] [Google Scholar]
- Markevich E. Sharabi R. Gottlieb H. Borgel V. Fridman K. Salitra G. Aurbach D. Semrau G. Schmidt M. A. Schall N. Bruenig C. Electrochem. Commun. 2012;15:22–25. doi: 10.1016/j.elecom.2011.11.014. [DOI] [Google Scholar]
- Li J. Luo S.-h. Wang Q. Yan S. Feng J. Ding X. He P. Zong L. J. Electrochem. Soc. 2019;166:a118–a124. doi: 10.1149/2.0401902jes. [DOI] [Google Scholar]
- Wang C. Hong J. Electrochem. Solid-State Lett. 2007;10:A65–A69. doi: 10.1149/1.2409768. [DOI] [Google Scholar]
- Cheng X. Zheng J. Lu J. Li Y. Yan P. Zhang Y. Nano Energy. 2019;62:30–37. doi: 10.1016/j.nanoen.2019.05.021. [DOI] [Google Scholar]
- Rondeau-Gagne S. Morin J. F. Chem. Soc. Rev. 2014;43:85–98. doi: 10.1039/C3CS60210A. [DOI] [PubMed] [Google Scholar]
- Zhang J. N. Li Q. Yu X. Xiao R. Huang X. Chen L. Li H. Zhang J. N. Yu X. Li H. Li Q. Yang W. Ouyang C. Ge M. Huang X. Hu E. Chu Y. Yang X. Q. Ma C. Li S. Liu Y. Yu H. Nat. Energy. 2019;4:594–603. doi: 10.1038/s41560-019-0409-z. [DOI] [Google Scholar]
- Swain P. Viji M. Mocherla P. S. V. Sudakar C. J. Power Sources. 2015;293:613–625. doi: 10.1016/j.jpowsour.2015.05.110. [DOI] [Google Scholar]
- Cao X.-M. Han Z.-B. Chem. Commun. 2019;55:1746–1749. doi: 10.1039/C8CC09847F. [DOI] [PubMed] [Google Scholar]
- Cao X.-M. Sun Z.-J. Zhao S.-Y. Wang B. Han Z.-B. Mater. Chem. Front. 2018;2:1692–1699. doi: 10.1039/C8QM00284C. [DOI] [Google Scholar]
- Xu X. Hao Z. Wang H. Liu J. Yan H. Mater. Lett. 2017;197:209–212. doi: 10.1016/j.matlet.2017.02.093. [DOI] [Google Scholar]
- Xie Y. Chen S. Lin Z. Yang W. Zou H. Sun R. W.-Y. Electrochem. Commun. 2019;99:65–70. doi: 10.1016/j.elecom.2019.01.005. [DOI] [Google Scholar]
- Liao Y. Li C. Lou X. Hu X. Ning Y. Yuan F. Chen B. Shen M. Hu B. Electrochim. Acta. 2018;271:608–616. doi: 10.1016/j.electacta.2018.03.100. [DOI] [Google Scholar]
- Yao L. Liang F. Jin J. Chowdari B. V. R. Yang J. Wen Z. Chem. Eng. J. 2020;389:124403. doi: 10.1016/j.cej.2020.124403. [DOI] [Google Scholar]
- Qi P. Han Y. Zhou J. Fu X. Li S. Zhao J. Wang L. Fan X. Feng X. Wang B. Chem. Commun. 2015;51:12391–12394. doi: 10.1039/C5CC03710G. [DOI] [PubMed] [Google Scholar]
- Butova V. V. Budnyk A. P. Charykov K. M. Vetlitsyna-Novikova K. S. Lamberti C. Soldatov A. V. Chem. Commun. 2019;55:901–904. doi: 10.1039/C8CC07709F. [DOI] [PubMed] [Google Scholar]
- Butova V. V. Burachevskaya O. A. Ozhogin I. V. Borodkin G. S. Starikov A. G. Bordiga S. Damin A. Lillerud K. P. Soldatov A. V. Microporous Mesoporous Mater. 2020;305:110324. doi: 10.1016/j.micromeso.2020.110324. [DOI] [Google Scholar]
- Casas-Cabanas M. Rodríguez-Carvajal J. Canales-Vázquez J. Laligant Y. Lacorre P. Palacín M. R. J. Power Sources. 2007;174:414–420. doi: 10.1016/j.jpowsour.2007.06.216. [DOI] [Google Scholar]
- Klementiev K. Chernikov R. J. Phys.: Conf. Ser. 2016;712:012008. doi: 10.1088/1742-6596/712/1/012008. [DOI] [Google Scholar]
- Shapovalov V. V. Guda A. A. Kosova N. V. Podgornova O. A. Kubrin S. P. Aboraia A. M. Lamberti C. Soldatov A. V. Radiat. Phys. Chem. 2018;175:108065. [Google Scholar]
- Kreder K. J. Assat G. Manthiram A. Chem. Mater. 2015;27:5543–5549. doi: 10.1021/acs.chemmater.5b01670. [DOI] [Google Scholar]
- Maeyoshi Y. Miyamoto S. Noda Y. Munakata H. Kanamura K. J. Power Sources. 2017;337:92–99. doi: 10.1016/j.jpowsour.2016.10.106. [DOI] [Google Scholar]
- Wang F. Yang J. NuLi Y. Wang J. J. Power Sources. 2011;196:4806–4810. doi: 10.1016/j.jpowsour.2011.01.055. [DOI] [Google Scholar]
- Murugan A. V. Muraliganth T. Manthiram A. J. Electrochem. Soc. 2009;156:A79–A83. doi: 10.1149/1.3028304. [DOI] [Google Scholar]
- Rommel S. M. Rothballer J. Schall N. Brünig C. Weihrich R. Ionics. 2015;21:325–333. doi: 10.1007/s11581-014-1191-3. [DOI] [Google Scholar]
- Wu X. Meledina M. Tempel H. Kungl H. Mayer J. Eichel R.-A. J. Power Sources. 2020;450:227726. doi: 10.1016/j.jpowsour.2020.227726. [DOI] [Google Scholar]
- Martini A. Guda S. A. Guda A. A. Smolentsev G. Algasov A. Usoltsev O. Soldatov M. A. Bugaev A. Rusalev Y. Lamberti C. Soldatov A. V. Comput. Phys. Commun. 2020;250:107064. doi: 10.1016/j.cpc.2019.107064. [DOI] [Google Scholar]
- Bramnik N. N. Nikolowski K. Baehtz C. Bramnik K. G. Ehrenberg H. Chem. Mater. 2007;19:908–915. doi: 10.1021/cm062246u. [DOI] [Google Scholar]
- Osnis A. Kosa M. Aurbach D. Major D. T. J. Phys. Chem. C. 2013;117:17919–17926. doi: 10.1021/jp402755r. [DOI] [Google Scholar]
- Richards W. D. Wang Y. Kim J. C. Ceder G. Miara L. J. Ceder G. Ceder G. Chem. Mater. 2016;28:266–273. doi: 10.1021/acs.chemmater.5b04082. [DOI] [Google Scholar]
- Wu F. Maier J. Yu Y. Yu Y. Yu Y. Chem. Soc. Rev. 2020;49:1569–1614. doi: 10.1039/C7CS00863E. [DOI] [PubMed] [Google Scholar]
- Haas O. Deb A. Cairns E. J. Wokaun A. J. Electrochem. Soc. 2005;152:A191–A196. doi: 10.1149/1.1833316. [DOI] [Google Scholar]
Associated Data
This section collects any data citations, data availability statements, or supplementary materials included in this article.


