

Summary
Many mammalian neurons release multiple neurotransmitters to activate diverse classes of postsynaptic ionotropic receptors. Entopeduncular nucleus somatostatin (EP Sst+) projection neurons to the lateral habenula (LHb) release both glutamate and GABA, but it is unclear if these are packaged into the same or segregated pools of synaptic vesicles. Here we describe a method combining electrophysiology, spatially-patterned optogenetics, and computational modeling designed to analyze the mechanism of glutamate/GABA co-release in mouse brain. We find that the properties of postsynaptic currents elicited in LHb neurons by optogenetically activating EP Sst+ terminals are only consistent with co-packaging of glutamate/GABA into individual vesicles. Furthermore, presynaptic neuromodulators that weaken EP Sst+ to LHb synapses maintain the co-packaging of glutamate/GABA while reducing vesicular release probability. Our approach is applicable to the study of multi-transmitter neurons throughout the brain and our results constrain the mechanisms of neuromodulation and synaptic integration in LHb.
Keywords: neurotransmitter co-release, basal ganglia, lateral habenula, entopeduncular nucleus, digital micromirror device, computational modeling
eTOC Blurb
Somatostatin-expressing entopedunculus projections to the lateral habenula release glutamate and GABA. Using mathematical simulations and new electrophysiological approaches, Kim et al. show that both neurotransmitters are packaged into the same synaptic vesicles. Inhibitors of release, like serotonin, affect both transmitters by reducing probability of release of these copackaged vesicles.
Introduction
Many neurons in the mammalian brain produce, store and release multiple neurotransmitters (Tritsch et al., 2016). Despite the prevalence of multi-transmitter neurons, our understanding of how, when, and where multiple neurotransmitters are released and what purpose co-release serves remains incomplete. At some multi-transmitter synapses, multiple small-molecules (i.e. non-peptide) are packaged into the same vesicle (Jonas et al., 1998; Shabel et al., 2014; Tritsch et al., 2012) whereas in other cases a cell makes multiple classes of presynaptic boutons, each releasing a different transmitter (Granger et al., 2020; Lee et al., 2010; Zhang et al., 2015). Furthermore, even if two transmitters are released in the same vesicle from a single synaptic bouton, the opposing postsynaptic target may not have receptors for both, preventing co-transmission. Conversely, two transmitters may be released from different terminals, but, if these form synapses onto the same cell, co-transmission will occur. For these reasons, the mechanisms of co-release at synapses formed by multi-transmitter neurons are difficult to determine from the average synaptic responses, necessitating experiments examining single release events from individual synapses.
Co-transmitting neurons are found in the entopeduncular nucleus (EP), a basal ganglia nucleus comprised of multiple neural populations. Among these, somatostatin positive (Sst+) EP neurons project to the lateral habenula (LHb) and express the molecular machinery necessary to release glutamate and GABA (Wallace et al., 2017). Stimulation of EP Sst+ axons causes glutamate/GABA co-release and generates compound synaptic currents in LHb neurons mediated by opening of ionotropic glutamate and GABA receptors (Root et al., 2018; Wallace et al., 2017). At this synapse, glutamate and GABA may be packaged the same vesicles, as supported by the detection of biphasic miniature spontaneous synaptic responses in LHb neurons (Shabel et al., 2014). Alternatively, they may be segregated in different pools of synaptic vesicles that are independently released from the same terminal, as supported by ultrastructural and biochemical evidence that glutamate and GABA vesicular transporters are found in separate pools of vesicles in LHb (Root et al., 2018).
The mechanism of glutamate/GABA co-release, and how it may be modulated by plasticity will impact our understanding of EP-to-LHb circuit in context of altered behavioral states. LHb regulates major monoaminergic centers in the brain (Hu et al., 2020; Matsumoto and Hikosaka, 2009, 2007) and the EP is implicated in aversion, encoding of reward prediction error and action-outcome evaluation (Hong and Hikosaka, 2008; Li et al., 2019; Shabel et al., 2012; Stephenson-Jones et al., 2016). Furthermore, synaptic plasticity that shifts the relative proportion of glutamate/GABA co-transmission from EP to LHb alters the excitability (Li et al., 2011) and bursting states of LHb neurons (Yang et al., 2018). This change is thought to drive animals towards maladaptive behavior states, such as depression, chronic-stress induced passive coping, and addiction (Cerniauskas et al., 2019; Li et al., 2011; Maroteaux and Mameli, 2012; Meye et al., 2016; Shabel et al., 2014; Trusel et al., 2019).
Here we combine molecular, computational, pharmacological and electrophysiological analyses to determine whether glutamate/GABA co-released at synapses between EP Sst+ and LHb neurons are packaged into the same or different synaptic vesicles. Immunohistochemical analysis of the distributions of synaptic proteins reveals that the proteins necessary for glutamate and GABA release are colocalized within individual EP Sst+ terminals. We characterize differential statistical features expected by the two distinct release modes and compare them to experimental results collected using an optogenetic approach that activates individual EP Sst+ boutons. We discover that glutamate and GABA are co-packaged in the same vesicles in EP Sst+ terminals. In addition, serotonin and adenosine each reduce the release probability of both transmitters while maintaining the correlation between glutamatergic and GABAergic unitary responses, further supporting that the two transmitters are released in the same vesicles.
Results
Functional and molecular evidence of co-release from EP Sst+ axons in LHb
To gain optogenetic control over EP Sst+ cells, we bilaterally injected adeno-associated virus (AAV) that expresses the channelrhodopsin variant oChIEF in a Cre-dependent manner into the EP of Sst-IRES-Cre (Sst-Cre) mice (Fig. 1A) (Lin et al., 2009; Taniguchi et al., 2011; Wallace et al., 2017). Optogenetic activation of EP Sst+ axons in brain slices triggered a biphasic postsynaptic current (PSC) in voltage-clamped LHb neurons (holding voltage, Vh=−35 mV) in the presence of NMDA receptor antagonist (CPP, Fig. 1B). This current profile results from the faster channel kinetics of AMPA receptors (AMPARs) relative to GABAA receptors (GABAARs). GABAergic and glutamatergic PSCs persist in the presence of TTX/4-AP, confirming direct release of both transmitters from the terminals (Wallace et al., 2017).
Fig. 1. Electrophysiological and molecular evidence for glutamate/GABA co-release from EP Sst+ axons in LHb.
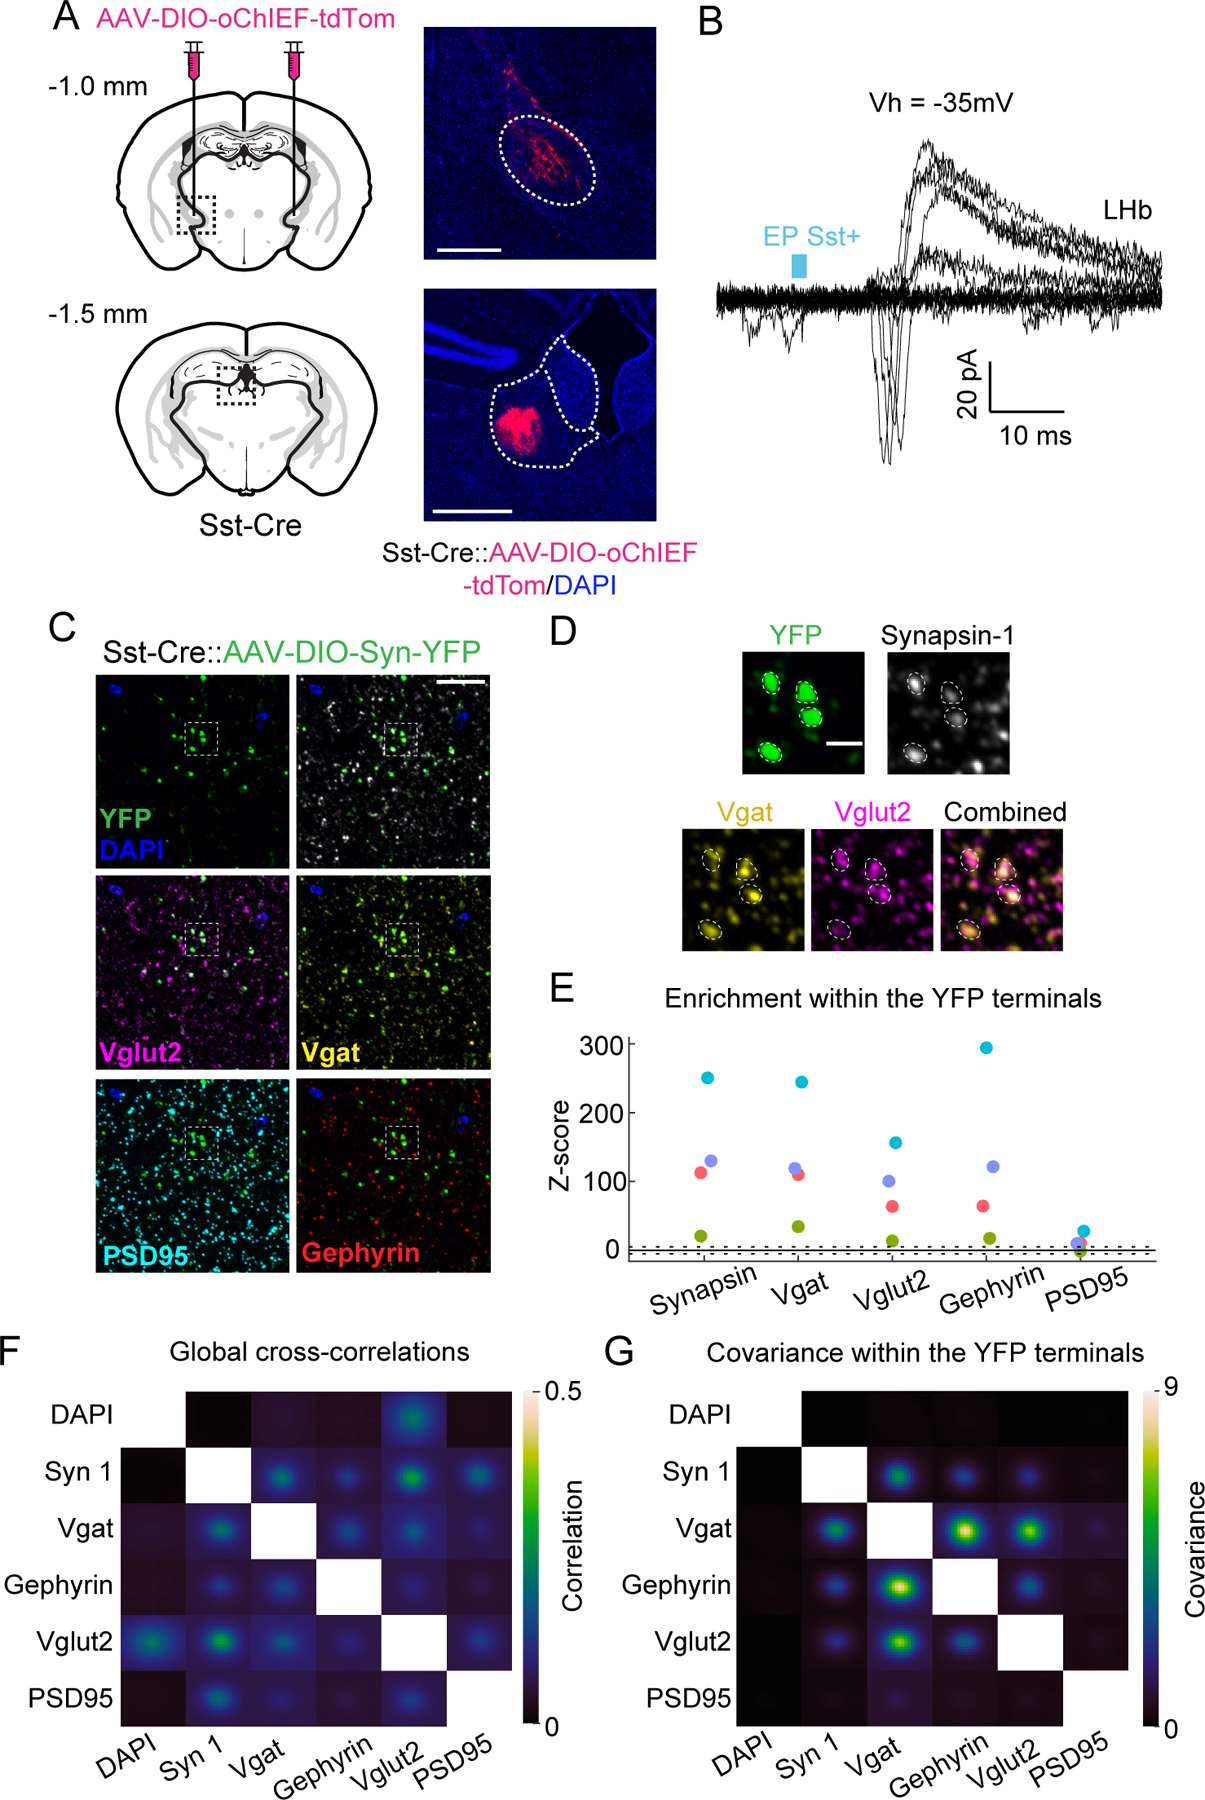
A) left, Injection of Cre-dependent AAV encoding the optogenetic activator oChIEF into the EP of Sst-Cre mice. right, Expression of tdTom in soma at the injection site (top) and in axons of EP Sst+ neurons in the LHb (bottom). Scale bars=500 µm.
B) PSCs recorded from a LHb neuron (Vh=−35 mV) following optogenetic activation of EP Sst+ axons using minimal stimulation in an acute brain slice. Some trials result in failures whereas others evoke both inward and outward PSCs as seen in the biphasic PSCs. Blue: timing and duration of the laser pulse.
C) Serial sections of brain tissue containing EP Sst+ terminals expressing Synaptophysin-YFP were sequentially immunostained for multiplex fluorescence imaging. Field of view with antibodies against the pre- (Synapsin 1 (white), Vglut2 (magenta), and Vgat (yellow)) and post-(PSD95 (cyan), Gephyrin (red)) synaptic markers.
D) Enlargement of the inset in C) demonstrating colocalization in Synapsin-1-expressing YFP-labelled Sst+ terminals (top) of proteins necessary for GABA (Vgat) and glutamate (Vglut2) release (bottom).
E) Z-scored enrichment of immunopuncta within YFP+ boutons relative to that expected at random. Colors indicate data from the same image stack. Dashed lines: ±5 Z-scores.
F) Average cross-correlations of Z-scored fluorescence signals for all pairs of antibodies.
G) Average co-variances of Z-scored fluorescence signals for all pairs of antibodies within the YFP+ terminals.
Individual EP Sst+ neurons express genes required for co-transmission (Root et al., 2018; Shabel et al., 2014; Wallace et al., 2017). To examine if individual EP Sst+ boutons express the proteins required for release of both transmitters, we used array tomography (Micheva and Smith, 2007). Cre-dependent expression of synaptophysin-YFP induced by AAV injection into EP labeled Sst+ boutons in LHb. Serial sections were immunolabeled for YFP, Synapsin-1, Vglut2, Vgat, PSD95, and Gephyrin (Fig. 1C–D).
The presynaptic protein Synapsin-1 was found within the YFP+ regions far more often than expected by chance (Fig. 1E; SFig. 1B). Similarly, Vgat and Vglut2 puncta often overlapped (Fig. 1D), with both found in YFP+ terminals far above chance (Fig. 1E; SFig. 1C). We also found strong non-random overlap of Gephyrin and weak but still above-chance overlap of PSD95 puncta with YFP+ boutons (Fig. 1D–E; SFig. 1C).
Whole-image analysis revealed weak cross-correlations across channels (mean: 0.003–0.294; individual: 0.0007–0.423) (Fig. 1F), peaking at 0 pixel image displacement. Restricting analysis to the image areas within YFP-labeled terminals (n=8493; mean ~0.3% of the image pixels; 4 tissue stacks, 3 animals) (Fig. 1G) revealed high positive covariance of Vgat-Vglut2 signals, indicating overlap of glutamate and GABA vesicular transporters in EP Sst+ boutons. Similarly analyzed Vgat-Gephyrin signals had high positive covariance, consistent with overlap of inhibitory pre- and postsynaptic densities for GABAergic terminals (Fig. 1F–G). PSD95 signal did not exhibit positive covariance with other antibodies, possibly due its low enrichment within the YFP+ boutons (Fig. 1E, G) (Granger et al., 2020; Saunders et al., 2015). Thus, individual EP Sst+ presynaptic boutons in the LHb have the molecular machinery necessary to release both glutamate and GABA and colocalize with GABA receptors-associated scaffolding proteins.
Statistical features of PSCs generated by two models of co-release
We considered 2 models of glutamate/GABA co-release in LHb: one in which the 2 neurotransmitters are packaged in separate vesicles released from the same terminal (Root et al., 2018) (the ‘independent’ model) and the other in which transmitters are packaged and released in the same vesicles (Shabel et al., 2014) (the ‘co-packaging’ model) (Fig. 2A). The PSCs produced by release under both models can appear identical when averaged across multiple stimuli of a single bouton or pooled across many coactive boutons. However, trial-by-trial analyses of PSCs resulting from stimulation of individual co-transmitting boutons differ in each model when vesicle release is stochastic (i.e. release probability, pr, <1) (Fig. 2A–B).
Fig. 2. Statistical features of PSCs predicted by two models of co-release.
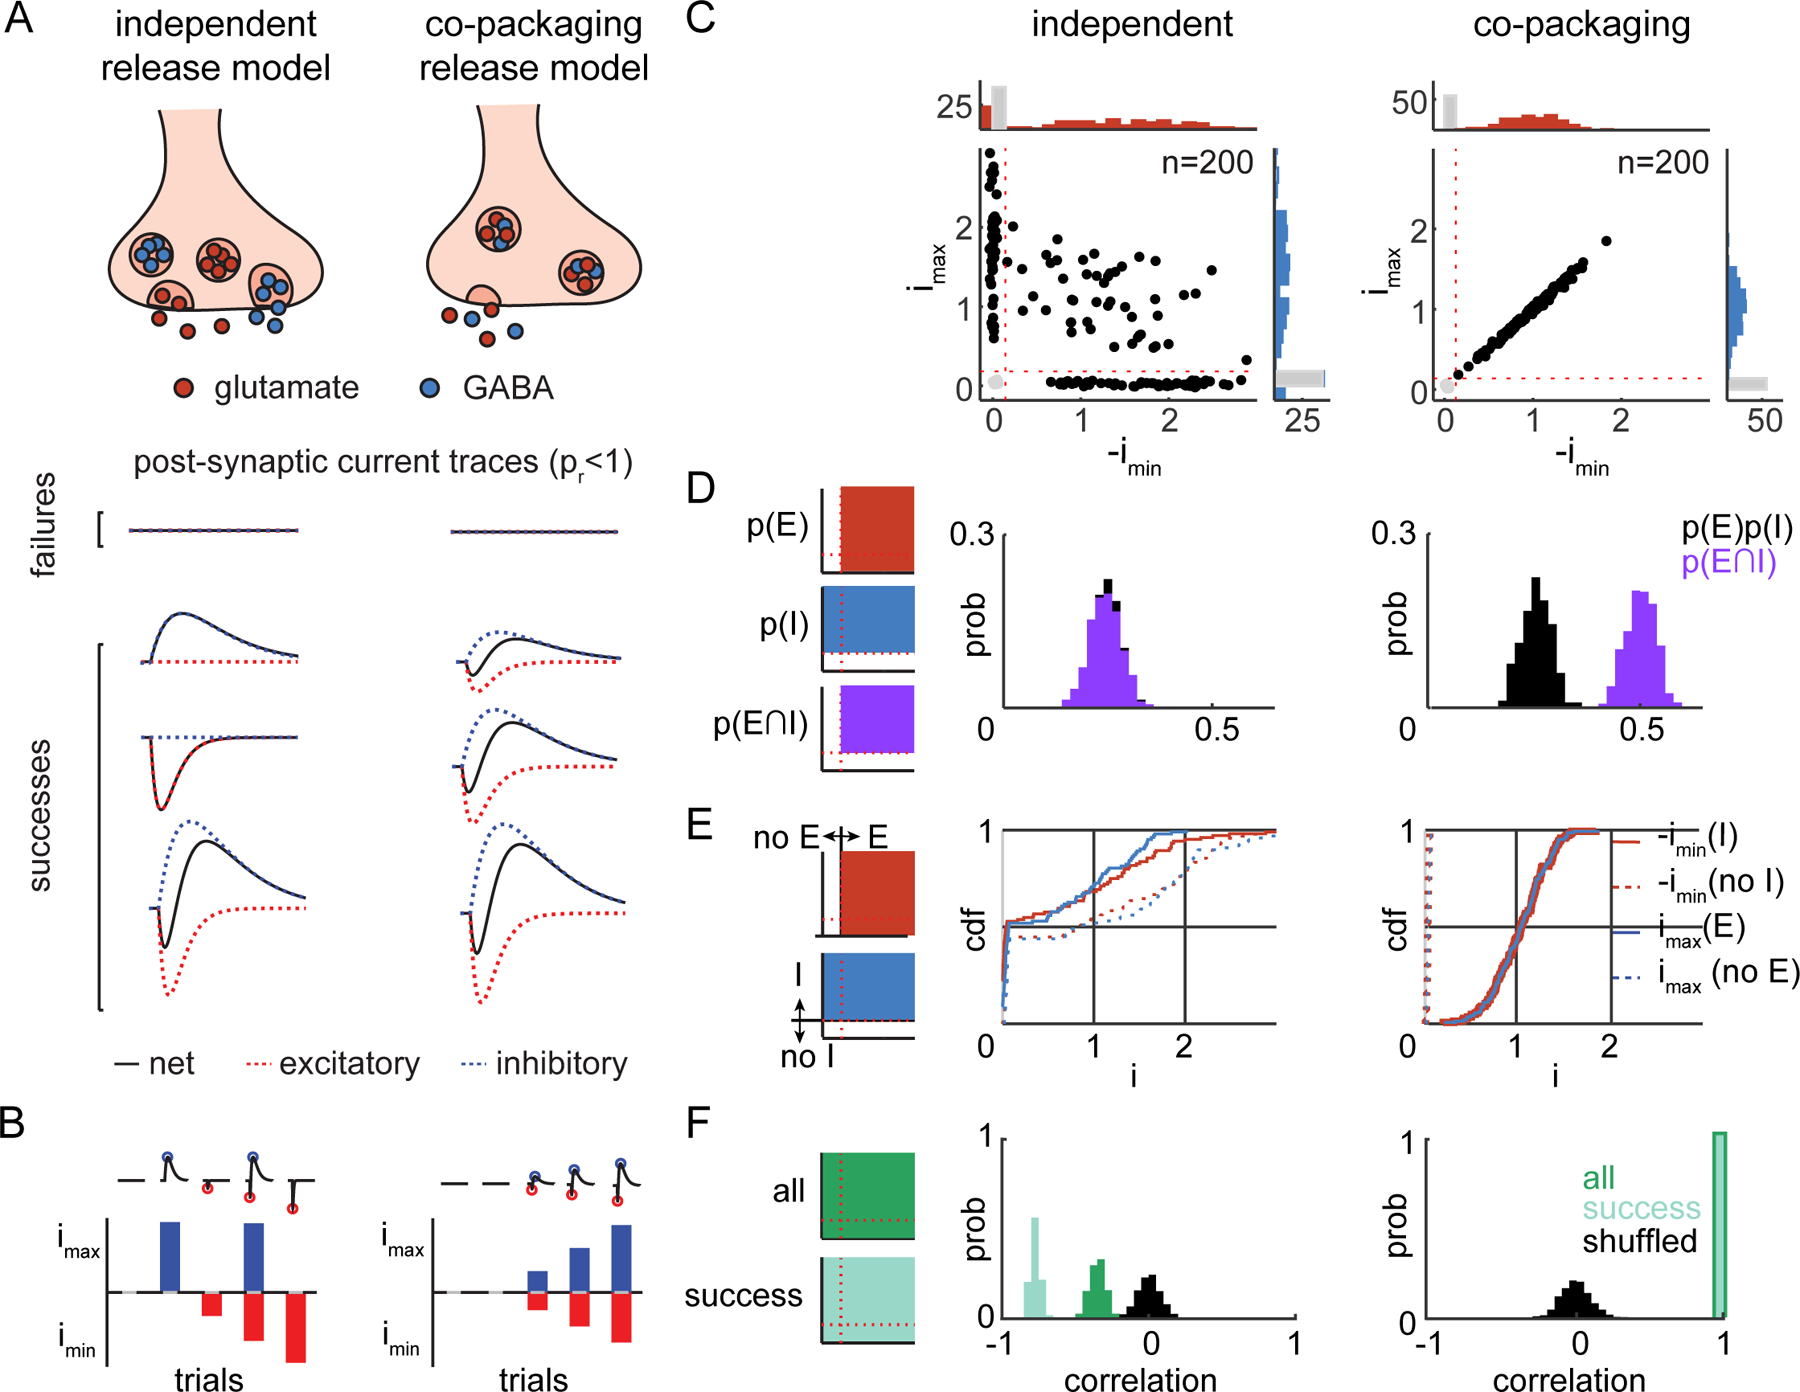
A) top, Potential modes of glutamate and GABA co-release from individual synaptic terminals in which each class of vesicle is released independently (left) or the neurotransmitters are co-packaged and released together in the same vesicle (right). bottom, PSCs predicted by the independent (left) and co-packaging (right) models at low pr.
B) imax and imin for trials in A) for the independent (left) and co-packaging (right) models.
C) Scatterplots of imax and -imin of 200 PSCs generated by simulations of independent (pr=0.5, left) and co-packaging (pr=0.75, right) models with the same rate of synaptic failures (0.25). Amplitudes are normalized to the average imax (y-axis) and -imin (x-axis) of success trials. Histograms (in counts) of the normalized imax and -imin with successes of release shown on the right (blue) and top (red) and failures of release in each shown in gray. Successes of release (imax or -imin exceed the thresholds indicated by red dotted lines) trials are shown by black filled circles whereas failures are in gray.
D) left, Schematics of the areas within the scatterplots used to count events and calculate the probabilities of detecting inhibitory (p(I)) or excitatory (p(E)) currents as well as of biphasic currents (p(E∩I)). center and right, The statistical independence of the probabilities of detecting inhibitory (p(I)) and excitatory (p(E)) PSCs for the two models; the observed probability of excitatory and inhibitory PSCs (p(E∩I), purple) was compared to that expected by chance (p(E)p(I), gray). Results for independent (center) and co-packaging (right) models are shown with pr=0.5 and were used in E)-F) as well.
E) left, Schematics of the areas within the scatterplots used to determine presence or absence of excitatory (top) and inhibitory (bottom) PSCs in each trial. center and right, Simulated cdfs of imax (blue) given the presence (imax(E), solid) or absence (imax(no E), dashed) of EPSC in the independent (center) and co-packaging (right) models. Similar analyses were performed for the -imin (red) given the presence (-imin(I), solid) or absence (-imin(no I), dashed) of an IPSC.
F) left, Schematics of the areas of the scatterplots that contain all (top) or success (bottom) trials. center and right, Analysis of the trial-by-trial correlation of imax and -imin of all trials (dark green), success trials (light green), and after shuffling (gray).
We simulated PSCs generated by stochastic synaptic vesicle release under the independent and co-packaging models and computed 3 statistical features from the simulated datasets that quantify the qualitative differences evident in scatter plots of the maximum and minimum amplitudes of PSCs generated under the 2 models (Fig. 2C). These features rely, at a varying level, on the ability to accurately detect the presence of an excitatory (EPSC) or inhibitory (IPSC) PSC in each trial (i.e. to distinguish successes from failures). Below the maximum (imax) and minimum (imin) current during a defined time window refer to amplitudes measured without judging if a release event has occurred (i.e. they may be due to noise). In contrast, IPSC and EPSC and their amplitudes refer to the components of PSCs that were judged to be a success of GABA or glutamate release, respectively (i.e. the excitatory or inhibitory component rises out of the noise).
First, we considered the probabilities of detecting PSCs with different components and tested if:
| (1) |
in which p(E), p(I), and p(E∩I) are the measured probabilities of detecting an EPSC, IPSC, and compound PSC, respectively (Fig. 2D). As expected, only independent release generated a distribution of joint probabilities that matched the distribution of the products of the individual probabilities (Fig. 2D). Second, we compared the cumulative distribution functions (cdfs) of imax and imin in trials grouped by the presence and absence of EPSCs (‘E’ vs. ‘no E’) and IPSCs (‘I’ vs. ‘no I’) (Fig. 2E). Only the co-packaging model is consistent with the presence or absence of one current fully predicting the presence or absence of the other current (Fig. 2E). Although this assay requires detecting the presence of either the EPSC or the IPSC on each trial, it is robust to some errors in the accuracy of detection (SFig. 2A). Third, we examined the trial-to-trial correlation of imax and -imin (Fig. 2F). In the independent model, imax and -imin are negatively correlated (Fig. 2F) as a large EPSC will reduce the size of an independently-generated IPSC and vice versa. The co-packaging model produces strong positive correlations (~1) (Fig. 2F) due the co-occurrence of successes and failures in EPSCs/IPSCs and their shared variance due to vesicle-to-vesicle size differences.
DMD-based optogenetic stimulation to study co-release from EP Sst+ axons
Experimentally testing the predictions of the models requires a method to record minimal responses from individual synapses in many trials. Thus, we implemented a digital micromirror device (DMD)-based optogenetic stimulation approach to activate co-releasing EP Sst+ boutons in the LHb (Fig. 3A). Variants of this approach have been used to map connectivity and the spatial arrangement of cortical synapses (Petreanu et al., 2009, 2007).
Fig. 3. Approach to measure PSCs evoked by optogenetic stimulation of EP Sst+ axons in LHb.

A) DMOS setup. S: mechanical shutter; HD: holographic diffuser (10° diffusing angle); DMD: digital micromirror device; L1–2: lens; OBJ: objective lens.
B) Workflow schematic of Cre-dependent AAV encoding the optogenetic activator oChIEF injection into the EP of Sst-Cre mice, followed by recordings in acute-brain slices of LHb.
C) Optically-evoked average E- and IPSCs acquired at Vh=−70 (red) or 0 (dark blue) mV, respectively. Light blue vertical bars: timing of the laser stimulation pulses with each delivered to a different location in the slice. PSCs are the average of 5 trials.
D) The number of stimulation spots triggering PSCs (x-axis) in individual (top, y-axis) or across all (bottom) cells grouped by EPSC only (orange), IPSC only (blue), or both (purple).
E) Optically-evoked average biphasic, compound PSCs recorded at Vh=−35 mV, in the same neuron as in C). PSCs are the average of 5 trials. Inset shows the expanded PSC inside the gray shaded box.
F) Fitted IPSC/EPSC amplitude relationships for data from 6 LHb cells (left) and corresponding R2 values (right). Colors indicate cell identity as in D).
We first examined DMD-evoked responses at high laser powers that activate many EP to LHb Sst+ boutons in brain slices (Fig. 3B). LHb neurons were voltage-clamped at −70 and 0 mV, respectively, to record EPSCs and IPSCs (Fig. 3C). In each neuron, a subset of the stimulation spots (252/576, 6 cells, 3 animals; 16–68/96 spots per cell) elicited PSCs. Over 80% of spots that evoked EPSCs also evoked IPSCs, with shared onset timing (204/252; Fig. 3C–D; SFig. 6A). The amplitudes of EPSCs and IPSCs were typically correlated in each cell but the IPSC/EPSC ratio varied cell-to-cell (Fig. 3F; SFig. 3E–G). These results are consistent with both transmitters being co-released from Sst+ axons and detected by the same postsynaptic cell.
In recordings at intermediate potentials (Vh=−27 or −35 mV), we observed biphasic PSCs following photo-stimulation of the same spots at which isolated EPSCs and IPSCs were detected at each reversal potential (Fig. 3C,E). imax and -imin of the biphasic PSCs were highly correlated, consistent with these representing the summation of two oppositely signed synaptic currents (SFig. 3I).
Heterogeneity in unitary responses from EP Sst+ co-releasing axons
We modified the conditions of DMD-based optogenetic activation to generate minimal responses and called this approach DMOS – DMD-based minimal optogenetic stimulation. Voltage-clamp recordings were performed in the presence of TTX/4-AP to optogenetically activate presynaptic boutons without propagating action potentials (Fig. 4A) and prevent polysynaptic responses (Petreanu et al., 2009). We adjusted stimulation intensities and spot sizes to achieve EPSCs that appeared stochastically trial-to-trial and whose amplitudes (Vh=−64 mV) were similar to those of miniature spontaneous EPSCs (mEPSCs) (Fig. 4B). At −35 or −27 mV, minimally-stimulating EP Sst+ axons occasionally evoked biphasic PSCs with imin and imax of similar amplitudes to mEPSCs and mIPSCs, respectively (SFig. 4E–F).
Fig. 4. DMOS evoked unitary responses from EP Sst+ axons in LHb.

A) Spatial heatmaps showing the effects of sequential addition of TTX and 4-AP on total charge of EPSCs (Vh=−64mV) of all stimulation spots using DMOS under high photo-stimulation intensity. The cell was located approximately at the center.
B) Spatial heatmaps comparing total charge of EPSCs (Vh=−64mV) using DMOS under high (top) and minimal (bottom) photo-stimulation intensity.
C) Average (top) and individual (bottom) unitary PSCs recorded at an intermediate Vh. Repetitive stimulation at 3 spots consistently evoked EPSC-only (red), IPSC-only (blue), or biphasic (purple) PSCs.
D) The proportions of minimal stimulation spots that triggered PSCs at Vh=−27 or −35 mV, as indicated (top), or across all cells (bottom) grouped as EPSC-only (orange), IPSC-only (blue), or biphasic (purple). Asterisks indicate statistical significance (Fisher’s exact test) of differences in proportions of each group at −27 and −35 mV.
Using DMOS, we observed stimulation spots that evoked EPSC-only, IPSC-only, or both currents on every success trial (total trials: 50–205, mean: 111) (Fig. 4C). Overall, the majority (~64%) of all hotspots (n=44, 14 cells) exhibited both PSCs, consistent with the co-packaging model (Fig. 4D; SFig. 4B–D/6B–E). We hypothesized that some of the “EPSC-only” and “IPSC-only” unitary PSCs result from masking of the other current rather than a true lack of IPSC and EPSC, due to reduction of ion channel driving forces at an intermediate Vh. Indeed, the relative proportion of “IPSC-only” hotspots increased to 34% (2/21➔10/23 hotspots, 7 cells/group, Fisher’s test p=0.0174) when the Vh was increased from −35 to −27 mV (Fig. 4D).
Examples of unitary responses that support independent and co-packaging models
Among DMOS-activated spots that generated biphasic PSCs, we found examples consistent with independent (Fig. 5A–E) as well as co-packaging (Fig. 5F–J) models. Note that the common failure modes of our analyses will artificially support a model of independent release of glutamate and GABA.
Fig. 5. Unitary responses from glutamate/GABA co-releasing boutons.

A) Optically-evoked PSCs from a hotspot consistent with the independent model. top, Example traces aligned to stimulus onset (blue region). imax (blue dot) and imin (red dot) were extracted from within the gray region. bottom, Histogram of imax (blue) and imin (red) timing.
B) Scatterplot of -imin vs. imax for all trials at the spot shown in A).
C) Comparison of the p(E∩I) (purple) to p(E)*p(I) (gray). left, Histograms of probabilities generated from bootstrap analysis of actual (top) and shuffled (bottom) data. right, Simulated histograms of probabilities generated by independent (top) and co-packaging (bottom) models using synaptic parameters extracted from the data in B).
D) Cdfs of imax(E) (blue solid), imax(no E) (blue dashed), -imin(I), (red solid), and -imin(no I) (red dashed) for data in B).
E) Correlation of imax and -imin across all trials (dark green), success trials (light green), and across all trials after shuffling (gray). Bootstrapped correlation coefficients for data from B) (left) and for results of simulations (parameters as in C)) of independent (middle) and co-packaging (right) models.
F-J) As in panels A)-E) but for a spot with properties consistent with the co-packaging model.
At sites consistent with independent release, heterogeneous PSCs were observed across trials with imin typically preceding imax (Fig. 5A). A scatter plot of -imin vs. imax (Fig. 5B) revealed a dispersed pattern with a negative slope consistent with the independent model (Fig. 2C). Furthermore, a bootstrapped probability distribution of detecting both PSCs in single trials was not different from that expected by chance (Fig. 5C). We simulated the biophysical models of the two different co-release modes using the experimental PSC parameters (i.e. the number of trials, p(E), and p(I)). The distributions of the joint probability of detecting imax and imin together matched that generated by the independent model rather than the co-packaging model (Fig. 5C). Similarly, cdfs of -imin in trials with or without an IPSC showed no difference (Fig. 5D), consistent with the independent model prediction (Fig. 2E). The same was true for the imax cdfs. Finally, bootstrapped correlation distributions of imax and -imin pairs were centered around zero for all trials and slightly negative for success trials (Fig. 5E). Thus, this set of PSCs generated by DMOS-stimulation of one site 145 times is best described by the independent release model. This conclusion may reflect true independent release and detection of glutamate and GABA at a single synapse, or may result from the presence of both a glutamate-only and a GABA-only synapse in the illuminated site.
At sites whose stimulation produced PSCs consistent with co-packaging, all successful event traces consisted of biphasic PSCs (Fig. 5F). The scatter plots of imax vs. -imin exhibited a positive correlation (Fig. 5G; Fig. 2C). The bootstrapped probability distribution of detecting both PSCs was significantly greater (p<0.001) than the distribution predicted by chance (Fig. 5H). The difference between the distributions disappeared when the imax and -imin were separately shuffled across trials. Furthermore, in agreement with the increased probability of detecting both PSCs in single trials, this data was best fit by simulations of the co-packaging model. In addition, cdfs of the -imin and imax were well-separated when comparing across trials categorized by the absence vs. presence of an IPSC or EPSC, respectively (Fig. 5I; Fig. 2E). Lastly, bootstrapped imax and -imin pairs exhibited a large positive correlation for all trials and slightly smaller positive correlation for success trials (Fig. 5J; Fig. 2F). Hence, our dataset contains PSCs consistent with co-packaging of glutamate and GABA in the same vesicle, a conclusion that is difficult to produce by random events or technical artifacts (SFig. 5).
Unitary responses of co-transmitting boutons are consistent with the co-packaging model
For each spot (n=28, 11 cells) that exhibited DMOS-evoked biphasic PSCs we performed the full analyses depicted in Fig. 5A–E. To quantify how much each statistical feature supported either model, a “model feature indicator” was parametrized (Fig. 6A). This resulted in 5 model feature indicators that summarize the deviation from random (see Methods).
Fig. 6. Statistical analyses of all co-releasing terminals support the co-packaging model.

A) Parametrization of a model feature indicator calculated by subtracting the medians of the cdfs (Δcdf0.5) representing the distributions of p(E∩I) (purple) and p(E)*p(I) (gray).
B) Histograms of the model feature indicators for the 5 statistical features. The data represent “both” group in Fig 4F. Bin width is 0.05.
C) Heatmap of transformed model feature indicators from B (y-axis) across spots exhibiting both PSCs (x-axis). Color intensity represents increasing support for the co-packaging model.
D) Correlation heatmap of model feature indicators.
E) Average model feature indicators of all unitary co-releasing spots from C). Each dot is data from one spot, with color indicating the cell identity. Larger values indicate greater support for the co-packaging model. Data from the black outlined spots are shown in detail in G.
F) Three noise sources in the recordings.
G) Scatterplots of imax and -imin for ambiguous (left, green dot from E) and co-packaging (right, orange dot from E) hotspots. Histograms of the imax and -imin of evoked (right, blue; top, red) and spontaneous (brown) PSCs.
H) Average model feature indicators for individual spots are correlated with the fraction of outlier current values during baseline periods (left) and the average imax and -imin SNR (right). Colors indicate cells identities as in E). Pearson correlation coefficients are given.
Extremes values of parameters indicate strong fit by either the co-packaging or independent model whereas values closer to zero reflect uncertain categorization (Fig. 6B). As our study was designed to test if any synaptic responses were statistically compatible with co-packaging of glutamate/GABA, the model feature indicators were transformed to range from 0 (ambiguous or consistent with independent model) to 1 (high confidence for co-packaging). The heatmap of transformed model feature indicators revealed column-like structure, indicating consistency in their degree of site-by-site support for the co-packaging model (Fig. 6C–D). Using this metric, 22/28 sites had feature average greater than 0 (0.0057–0.722, mean=0.253) (Fig. 6E).
To investigate how various failure modes of analyses contribute to our results, we considered 3 noise metrics (Fig. 6F). Two major differences between an ambiguous and a strongly supported co-packaging sites were: (1) the signal separation between spontaneous activity erroneously picked up by our analysis vs. evoked imax and imin; and (2) the SNR of imax and -imin (Fig. 6G). At a population level, the sites with the best recording quality (low noise and low spontaneous synaptic events) had greater support for the co-packaging release model (Fig. 6H, SFig. 5C). This suggests that confounds of recording conditions may underlie the existence of sites that support the independent model or are ambiguous, such that most, if not all, co-transmitting sites might reflect synapses at which glutamate and GABA are co-packaged.
Pharmacological perturbations confirm co-packaging of glutamate and GABA in individual vesicles
A strong test of the co-packaging model is to examine if the correlations between glutamatergic and GABAergic PSCs remain when pr is lowered: if both transmitters are in the same vesicle, then the co-occurrence of evoked inward and outward PSCs should persist, whereas, if release of each transmitter is independent, then a n-fold reduction in pr should reduce the probability of biphasic PSCs n2-fold.
Serotonin reduces the probability of glutamate and GABA release from the EP axons in the LHb (Shabel et al., 2014, 2012) but it is unknown if serotonin has a similar effect on EP Sst+ axons or equally on glutamatergic and GABAergic transmission. We examined the effect of serotonin (5-HT) on PSCs in LHb neurons resulting from activating groups of EP Sst+ synapses (Fig. 7A). Optogenetic ring stimulation using the DMD elicited composite PSCs in all cells (EPSC median (IQR)=395 pA (367 pA); IPSC median (IQR)=624 pA (456 pA); n=15 cells, 9 animals; Fig. 7B), which were blocked by TTX (1 µM) and not recovered by 4-AP (400 µM), consistent with being evoked by propagating action potentials. Application of 5-HT (1 µM) reduced inward and outward PSCs in most cells (5/6 for EPSC; 6/6 for IPSC; unpaired t-test p<0.05; SFig. 7A), consistent with inhibition of both glutamate and GABA release from EP Sst+ axons. Furthermore, 5HT1b receptor agonist CP93129 (1 µM) reduced inward and outward PSCs (4/4 cells; unpaired t-test p<0.05; SFig. 7A). In addition, adenosine receptor agonist, 2-chloroadenosine (2-CA), decreased EPSCs and IPSCs in 3/ and 4/5 cells, respectively (unpaired t-test, p<0.05; SFig. 7A). Consistent with reduction in pr, paired-pulse ratios increased after application of 5-HT (n=6 cells) and 2-CA (n=5 cells) (paired t-test p<0.05; SFig. 7B).
Fig. 7. 5-HT reduces pr of glutamate and GABA while maintaining their co-packaging.

A) DMD ring stimulation used to generate propagating action potentials in EP Sst+ axons.
B) Average EPSC (Vh=−64 mV) and IPSC (Vh=10 mV) using ring stimulation (blue box) recorded in a LHb neuron before (gray dashed) and after (black) application of 5-HT (1 µM).
C-D) Schematic of DMOS to activate individual presynaptic boutons (C) and average biphasic PSCs (Vh=−35 mV, black line) before (top, n=141 trials) and after (bottom, n=147 trials) application of 5-HT (250 nM) (D). 5-HT proportionally reduced the PSC – the average PSC before 5-HT application is shown scaled and overlaid (gray) on the bottom.
E) Optically-evoked PSCs from a hotspot consistent with the co-packaging model depicted as in Fig. 5F.
F) Scatterplot of imax and -imin for the spot shown in E) depicted as in Fig. 5G). The probabilities of detecting an EPSC, IPSC, and both are given.
G) left, Optically-evoked biphasic unitary PSCs (Vh=−35 mV) of the “both” success trials. right, Cdfs of imax (blue) and -imin (red) of these trials.
H) Analysis of statistical features for the data in F): left, Comparison of the p(E∩I) (purple) to p(E)*p(I) (gray). middle, Cdfs imax (blue) given the presence (solid) or absence (dashed) of an EPSC and vice versa. right, Correlation of imax and -imin across all (dark green), success (light green), and shuffled (gray) trials.
I-L) As in panels E-H after 5-HT (250 nM) bath application for the same site.
To test whether serotonin and adenosine receptors modulate biphasic PSCs resulting from activation of individual EP Sst+ boutons, we examined the effects of 5-HT and 2-CA on DMOS-evoked hotspots with characteristics consistent with the co-packaging model. A low concentration of 5-HT (0.25 µM) reduced both imax and imin of biphasic PSCs (Fig. 7D–E, SFig. 7C). Moreover, distributions of imax and imin and the 3 statistical features were consistent with release under the co-packaging model (Fig. 7F,H). 5-HT reduced probability of success trials overall as well as of EPSCs, IPSCs, and biphasic PSCs (Fig. 7J,L; SFig. 7D). Thus, 5-HT reduces both glutamate and GABA release from individual terminals that appear to package both transmitters in individual vesicles.
The distributions of imax and -imin spanned similar ranges before and after 5-HT application (Fig. 7F,J). Waveforms and the cdfs of the imax and imin of the biphasic PSC trials were comparable (Fig. 7G,K) and the bootstrapped Kolmogorov-Smirnov (K-S) tests indicated no significant difference between the two groups (p=0.4695 (imin), p=0.6924 (imax); STable 1). In the same dataset, cdfs of imin and imax of success trials were not significantly different (STable 1). Only 2/6 cells had significantly different cdfs of imin and only 1/ 6 had a significantly different imax cdf (Stable 1) in the “both” success trials. Thus, the major effect of 5-HT on DMOS-evoked unitary PSCs is to reduce probability of release but may have additional effects on postsynaptic receptor opening (i.e. synaptic potency). Lastly, we developed an alternative test comparing quantiles of imax and imin distributions before and after drug application, which confirmed that the data were most consistent with a reduction of pr in the co-packaging model (Fig. 8A–B, SFig. 7E–F).
Fig. 8. Summary of 5-HT effects on glutamate/GABA co-packaging.

A) 5-HT effect on quantiles of imax and -imin for the data shown in 7E-L. Dots show the amplitudes of the average trace for quantile of the data before (gray) and after (black) 5-HT application.
B) As in A) for showing the predictions of the independent (orange) and co-packaging (black) models.
C) 5-HT effects on average model feature indicators of unitary co-releasing spots consistent with co-packaging model based on the statistical features shown in Fig. 6C. Arrows indicate the direction of the change due to 5-HT application.
D) Average ratio between PSC and noise of individual spots vs. average model feature indicators. Pearson correlation coefficient is given.
E) Comparison of observed model axis change due to 5-HT and that predicted by simulation with considering changes in pr, noise, and amplitudes of biphasic PSCs. Linear fit (solid gray), the 95% prediction interval (dashed), and the Pearson correlation coefficient are shown.
After 5-HT bath application, the 3 statistical features in all sites continued to support the co-packaging model (Fig. 7H,L; Fig. 8C; n=6/6 spots) such that mean model indicator value remained > 0. Nevertheless, the mean model indicator decreased by 0.33±0.07 (STable 1), as expected from reduced SNR due to 1) effects on synaptic potency or 2) increased current noise and run down of PSCs that invariably occur during long recordings. Indeed, model indicator values pooled from 2 conditions were strongly correlated with the ratio of the PSC amplitude and current noise of the individual spots (r=0.74, p=0.0063; Fig. 8D). Changes in the pr, baseline noise, and PSC amplitude in “both” success trials accounted for the observed changes in model indicator value (r=0.70, p=0.12; norm of residuals of fit=0.29; Fig. 8E). These results demonstrate that 5-HT reduces pr of both glutamate and GABA from EP Sst+ inputs to the LHb but that terminals with features consistent with co-packaging continue to exhibit these features after reductions in pr.
Trial-by-trial analysis of unitary PSCs with DMOS revealed that, after 2-CA (100 µM) application, the statistical features of individual synapses consistent with the co-packaging model are preserved (SFig. 8A–H). Overall, 2-CA decreased imax and imin of DMOS evoked biphasic hotspots (SFig. 8I; mean number of trials: 103±2.42; n=4 spots, 4 cells, 4 animals). The observed model indicator value changes induced by 2-CA are well fit by changes in the pr, baseline noise, and PSC amplitudes (SFig. 8K–M). In summary, although serotonin and adenosine receptor agonists reduce glutamate and GABA release from EP Sst+ terminals, the statistical features of PSCs in the presence of each neuromodulator continue to support the co-packaging model.
Discussion
Here we describe an experimental and statistical approach that distinguishes between distinct mechanisms of neurotransmitter co-transmission. We identify 3 statistical features that differentiate between release models in which neurotransmitters are released independently or in which they are packaged in the same synaptic vesicles. We apply this method to analyze glutamate/GABA co-transmission at EP Sst+ terminals in LHb and uncover examples of synapses that, when repetitively activated by DMOS, generate PSCs whose properties are consistent only with packaging of both transmitters in the same vesicles. Pharmacological perturbations confirm that the statistical properties expected from release of co-packaged glutamate and GABA are preserved when pr is lowered. Lastly, analysis of the effects of recording quality suggest that synapses labeled as more consistent with independent release of glutamate and GABA, may actually reflect co-packaged release but with the expected correlations between glutamate/GABA currents obscured by noise. Thus, we conclude that EP Sst+ neurons package glutamate and GABA into the same vesicles and release them to activate correlated EPSCs and IPSCs in LHb neurons.
EP Sst+ axons form glutamate/GABA co-releasing synapses in LHb
We found enrichment of glutamate and GABA vesicular transporters, Vglut2 and Vgat, respectively, in EP Sst+ boutons in LHb. High covariance of expression of these presynaptic proteins agrees with ultrastructural analysis supporting that glutamate and GABA are released from the same terminals (Root et al., 2018; Shabel et al., 2014). Curiously, the postsynaptic scaffolding protein Gephyrin, but not PSD95, is highly enriched near EP Sst+ terminals despite the clear glutamatergic nature of these boutons (Li et al., 2011; Maroteaux and Mameli, 2012). This may indicate that an alternative MAGUK forms the core of these postsynaptic terminals. A positive correlation between Vglut2 expression and that of Synapsin-1 and PSD95 across all terminals in LHb indicates the existence of other molecularly distinct glutamatergic synapses in LHb (Barker et al., 2017; Hu et al., 2020; Knowland et al., 2017; Stamatakis et al., 2016).
The existence of vesicles containing both glutamate and GABA was suggested by the observation of biphasic mPSCs in LHb neurons (Shabel et al., 2014). The source of these responses was unknown since LHb receives projections that release glutamate and GABA from several brain regions (Barker et al., 2017; Stamatakis et al., 2016), including the ventral-tegmental areas (VTA) (Root et al., 2014a, 2018). Interestingly, although the VTA also sends glutamate/GABA co-releasing axons to LHb, these are thought to release each transmitter from a separate pool of vesicles (Root et al., 2018).
Glutamate/GABA co-packaging may result from expression of Vglut2 and Vgat on the same vesicle. The number of transporter proteins on each vesicle is ~10 (Takamori et al., 2006), suggesting that individual vesicles may accommodate more than one type of transporter. As number of vesicular transporters determines the amount of neurotransmitter loaded into vesicles (Wojcik et al., 2004), the numbers Vglut2 and Vgat per vesicle may determine the glutamate/GABA content and its variability across vesicles.
Function of the EP, LHb, and co-release
EP neurons preferentially target LHb neurons projecting to GABAergic rostromedial tegmental nucleus neurons (Meye et al., 2016), suggesting an indirect function of EP Sst+ neurons in regulating dopamine release. Since increased LHb activity can have aversive and reinforcing effects (Lammel et al., 2012; Proulx et al., 2014; Stamatakis and Stuber, 2012), the net ratio of glutamate/GABA released from EP Sst+ terminals may determine the behavioral consequence resulting from modulation of these cells. Indeed, GABA transmission from EP-to-LHb is altered by experience, resulting in changes in the ratio of glutamate/GABA currents (Lalive et al., 2021; Meye et al., 2016).
The ratios of glutamate/GABA currents from multiple synapses are similar in each postsynaptic LHb neuron but differ across LHb neurons. We speculate that co-packaging glutamate and GABA in the same vesicles grants flexibility to LHb neurons in determining the transformation calculated from a common set of EP Sst+ inputs via changes in postsynaptic receptor composition. This allows each LHb neuron to have net inhibitory or excitatory effects from activity in the same EP Sst+ inputs and choose the synaptic sign and weight that best predict an aversive outcome. Thus, negative weights are assigned to inputs whose activity coincides with or predicts a good outcome and positive weights are assigned to those associated with bad outcomes.
Compared to the net effect and function of glutamate/GABA co-release from EP terminals to LHb neurons, the function of co-release from VTA terminals in LHb has been better characterized. Activating VTA-to-LHb glutamate/GABA co-releasing neurons inhibits most and excites some postsynaptic LHb neurons (Root et al., 2014b). Moreover, VTA-to-LHb glutamate/GABA co-releasing neurons signal rewarding or aversive outcomes without responding to learned predictors in classical conditioning tasks (Root et al., 2020). Thus, these glutamate/GABA co-releasing neurons, like VTA dopamine neurons, encode violations of reward expectations.
Neuromodulation of glutamate and GABA co-releasing neurons
Applications of serotonin or adenosine receptor agonists reduce the amplitude of EPSCs and IPSCs evoked in LHb neurons by stimulation of EP Sst+ axons. This is consistent with previous conclusions that serotonin reduces the probabilities of glutamate and GABA release from EP axons (Shabel et al., 2014, 2012). We show that this effect is due in part at least to effects on Sst+ EP inputs and additionally demonstrate that these synapses are also modulated by adenosine receptors. In synapses that co-package glutamate/GABA, the major effect of serotonin as well as of 2-CA is to decrease the pr of these vesicles with a potential additional effect on synaptic potency. Serotonin 1B and adenosine A1 receptors are both predicted to be expressed in EP Sst+ neurons and likely mediate the presynaptic effect of 5-HT and 2-CA, respectively, through Gi/o mediated signaling (SFig. 7A) (Hwang and Chung, 2014; Wallace et al., 2017).
Serotonin signaling in LHb has been investigated in context of depression and its treatment. In animal models of depression, presynaptic changes have been described that shift the ratio of EP-to-LHb glutamate/GABA transmission, and this effect is reversed by treatment with selective serotonin reuptake inhibitor (SSRI)-type antidepressants (Shabel et al., 2014). Although our results suggest that the short-term effect of 5-HT is to inhibit release from Sst+ inputs in LHb, longer-term additional effects of 5-HT on glutamate/GABA co-packaging vesicles remain unknown.
STAR Methods
Resource Availability
Lead Contact
Further information and requests for resources and reagents should be directed to and will be fulfilled by the lead contact, Bernardo L. Sabatini (bsabatini@hms.harvard.edu)
Materials Availability
This study did not generate new unique reagents.
Data and Code Availability
Electrophysiology data have been deposited at Zenodo. Accession numbers are listed in the key resources table. Array tomography data reported in this paper will be shared by the lead contact upon request.
All custom code for analyzing this data is pulicaly available as of the date of publication. DOIs are listed in the key resource table.
Any additional information required to reanalyze the data reported in this paper is available from the lead contact upon request.
KEY RESOURCES TABLE
| REAGENT or RESOURCE | SOURCE | IDENTIFIER |
|---|---|---|
| Antibodies | ||
| chicken α-GFP | GeneTex | GeneTex Cat# GTX13970, RRID:AB_371416 |
| mouse α-Gephyrin | Biosciences Pharmigen | BD Biosciences Cat# 612632, RRID:AB_399669 |
| rabbit α-Synapsin-1 | Cell Signaling Tech | Cell Signaling Technology Cat# 5297, RRID:AB_2616578 |
| rabbit α-PSD95 | Cell Signaling Tech | Cell Signaling Technology Cat# 3450, RRID:AB_2292883 |
| mouse α-VGAT | Synaptic Systems | Synaptic Systems Cat# 131 011, RRID:AB_887872 |
| rabbit α-VGLUT2 | Synaptic Systems | Synaptic Systems Cat# 135 403, RRID:AB_887883 |
| Bacterial and Virus Strains | ||
| AAV8-EF1α-DIO-oChIEF(E163A/T199C)-P2A-dTomato-WPRE-BGHpA | Lin et al. 2009, Boston Children’s Hospital Viral Core | RRID:Addgene_51094 |
| AAV8-CMV-DIO-Synaptophysin-YFP | UNC Vector Core | N/A |
| Chemicals, Peptides, and Recombinant Proteins | ||
| Serotonin hydrochloride | Tocris | Cat# 3547 |
| 2-Chloroadenosine | Tocris | Cat# 3136 |
| CP93129 hydrochloride | Tocris | Cat# 1032 |
| AM251 | Tocris | Cat# 1117 |
| (R)-CPP | Tocris | Cat# 0247 |
| Tetrodotoxin citrate (TTX) | Abcam | Cat# 120055 |
| 4-Aminopyridine (4-AP) | Tocris | Cat# 0940 |
| Deposited Data | ||
| Raw data files for electrophysiology recordings | This paper | GitHub: https://github.com/seulah-kim/coreleaseAnalysis_Kim2021;DOI: 10.5281/zenodo.5810663 |
| Experimental Models: Organisms/Strains | ||
| Mouse: Sst-Cre: Ssttm2.1(cre)Zjh/J | Jackson Laboratories | Cat# 013044; MGI# 4838416 |
| Mouse: C57BL/6J | Jackson Laboratories | Cat# 000664; MGI# 3028467 |
| Software and Algorithms | ||
| Fiji | Schindelin et al. 2012 | https://imagej.net/software/fiji/ |
| MATLAB | MathWorks | https://www.mathworks.com/ |
| Custom MATLAB scripts | SeulAh Kim | GitHub: https://github.com/seulah-kim/coreleaseAnalysis_Kim2021;DOI: 10.5281/zenodo.5810663 |
| ScanImage (2015b version) | Bernardo Sabatini | https://github.com/bernardosabatini/SabalabAcq.git |
| Other | ||
| Digital Micromirror Device | Texas Instruments | DLP LightCrafter Evaluation Module |
Experimental Model and Subject Details
Mice
Sst-Cre (Jackson Labs #013044; MGI #4838416) homozygous and heterozygous mice (C57BL/6; 129 background) were bred with C57BL/6J mice. Both sexes of mice between 2–6 months in age were used. All animal care and experimental manipulations were performed in accordance with protocols approved by the Harvard Standing Committee on Animal Care following guidelines described in the US NIH Guide for the Care and Use of Laboratory Animals
Method details
Viruses
To achieve specific expression of light-gated cation channel in the Sst+ population in EP, we used a Cre-dependent adeno-associated virus (AAV) that encodes oChIEF, a variant of channelrhodopsin (Lin et al., 2009), driven by the EF1a promoter (AAV8-EF1a-DIO-oChIEF(E163A/T199C)-P2A-dTomato-WPRE-BGHpA). The plasmid was commercially obtained from Addgene (#51094) and the AAV was packaged by Boston Children’s Hospital Viral Core. For intracranial injections, the virus was diluted to a titer of ~9 x 10¹² gc/ml.
Intracranial Virus Injections
Adult mice (>P50) were anesthetized with 2–3% isoflurane. Under the stereotaxic frame (David Kopf Instruments), the skull was exposed in aseptic conditions and the virus was injected bilaterally into the EP (coordinates: −1.0mm A/P, +/− 2.1mm M/L, and 4.2mm D/V, from bregma) through a pulled glass pipette at a rate of 50 nl/min with a UMP3 microsyringe pump (World Precision Instruments). 150 nl was infused per injection site. At least 4 weeks passed after virus injection before experiments were performed.
Array Tomography
Mice injected with AAV(8)-CMV-DIO-Synaptophysin-YFP in EP were deeply anesthetized, perfused transcardially with room temperature phosphate-buffered saline (PBS) followed by 4% paraformaldehyde (PFA) in PBS. The brain was removed from the skull, post-fixed overnight at 4°C in 4% PFA, rinsed and stored in PBS. 250 µm thick coronal sections were cut with a Leica VT1000s vibratome. Sections containing the habenula with high Synaptophysin-YFP expression were noted using an epifluorescence microscope, and approximately 0.5 × 0.5 mm squares of tissue were cut out under a dissecting scope with Microfeather disposable ophthalmic scalpels. These small tissue squares were then dehydrated with serial alcohol dilutions and infiltrated with LR White acrylic resin (Sigma Aldrich L9774), and placed in a gel-cap filled with LR White to polymerize overnight at 50°C. Blocks of tissue were sliced on an ultramicrotome (Leica EM UC7) into ribbons of 70 nm sections.
Antibody staining of these sections was performed as described previously (Saunders et al. 2015). Briefly, antibodies were applied across multiple staining sessions (up to three antibodies per session) and a fourth channel left for DAPI. Typically, Session 1 stained against YFP (chicken ɑ-GFP, GTX13970, GeneTex), Gephyrin (mouse ɑ-Gephyrin, 612632, Biosciences Pharmingen), and Synapsin-1 (rabbit ɑ-Synapsin-1, 5297S, Cell Signaling Tech); Session 2 for PSD-95 (rabbit ɑ-PSD95, 3450 Cell Signaling Tech.); Session 3 for Vgat (mouse ɑ-VGAT, 131 011 Synaptic Systems), and VGLUT2 (rabbit ɑ-VGLUT2, 135 403 Synaptic Systems). In one sample the staining order was reversed, and revealed that order-dependent differences in staining quality did not alter the analysis. Each round of staining was imaged on a Zeiss Axio Imager upright fluorescence microscope before the tissue ribbons were stripped of antibody and re-stained for a new imaging session. Four images were acquired with a 63x oil objective (Zeiss) and stitched into a single final image (Mosaix, Axiovision). Image stacks were processed by aligning in Fiji with the MultiStackReg plug-in, first on the DAPI nuclear stain and with fine alignments performed using the Synapsin 1 stack. Fluorescence intensity was normalized across all channels, such that the top and bottom 0.1% of fluorescence intensities were set to 0 and maximum intensity, respectively.
Image analysis was performed as described previously (Granger et al. 2020). Pre-processing steps included trimming the image edges and masking out regions that correspond to cell nuclei as defined by DAPI signal. Background subtraction was performed at rolling ball radius of 10 pixels in Fiji with the Rolling Ball Background Subtraction plug-in. Synaptophysin-YFP channel was used to create 3D binary masks corresponding to EP Sst+ terminals.
For co-localization analysis, antibody fluorescence puncta were fit with a gaussian distribution to identify and assign a pixel location corresponding to the centroid of the gaussian. The YFP mask was overlaid to the antibody puncta location distributions and co-localization was calculated as the number of pixels that overlapped within the YFP mask divided by the total number of pixels of the YFP mask. To estimate colocalization level by chance, the locations of each centroid were randomized prior to co-localization calculation. This randomization was repeated 1000 times to used calculate a Z-score per sample per antibody signal to pool across samples (SFig. 1).
In cross-correlation analysis that does not require identifying individual immunopuncta, each antibody stack was z-scored and two stacks from the same sample were compared by shifted one image up to ±10 pixels in increments of 1 pixel vertically and horizontally. At each shift, the co-variance of the images were calculated (Fig. 1F). Co-variance was also measured specifically within the YFP mask by restricting the above calculation to the image area within the YFP mask (Fig. 1G).
DMOS optical setup
A digital micromirror device (DMD) surface was exposed from a DLP LightCrafter Evaluation Module (Texas Instruments) and mounted in the optical path to direct the reflected laser beam to the back aperture of a 0.8 NA 40x objective lens (Olympus). A 473nm collimated beam of width ~1mm was emitted from the laser (gem 473, Laser Quantum) and was uncollimated by passing through a static holographic diffuser (Edmund Optics) with 10° divergence angle. A mechanical shutter (Uniblitz, model LS6Z2) was mounted between the laser and the diffuser to control the timing of light exposure. The uncollimated, divergent light after the diffuser was converged using a lens (f=30 mm) to cover the DMD surface. The diffracted beam from the DMD was collected by a second lens (f=100 mm) and relayed to the back-aperture of the objective to form a conjugate DMD image in the sample plane. The optical setup achieved 22x magnification of the DMD image onto the sample plane with a resultant field of view of 299µm (width) x 168 µm (height).
Custom software written for ScanImage in MATLAB was used to control the individual DMD mirrors. Light power was controlled using Laser Quantum RemoteApp software via the RS232 port. The power efficiency of the system was ~5% from laser output to specimen, resulting in maximum power of 10 mW at the sample plane when all mirrors were in the “on” position. The validation of the DMD alignment using electrophysiological recording was performed as shown in SFig. 3.
Acute brain slice preparation
A cute brain slices were obtained from adult mice anesthetized by isoflurane inhalation and perfused transcardially with ice-cold, carbogen-saturated artificial cerebral spinal fluid (aCSF) containing (in mM): 125 NaCl, 2.5 KCl, 25 NaHCO3, 1.25 NaH2PO4, 2 CaCl2, 1 MgCl2, and 17 glucose (300 mOsm/kg). The brain was dissected, blocked, and transferred into a tissue slicing chamber containing ice-cold aCSF. 250–300 µm thick coronal slices containing LHb were cut using a Leica VT1000s or VT1200 vibratome. Following cutting, each slice was recovered for 9–11 min individually in a pre-warmed (34°C) choline-based solution containing (in mM): 110 choline chloride, 11.6 ascorbic acid, 3.1 pyruvic acid, 2.5 KCl, 25 NaHCO3, 1.25 NaH2PO4, 0.5 CaCl2, 7 MgCl2, and 25 glucose, then for at least 20 min in a secondary recovery chamber filled with 34°C aCSF. After recovery, the slices in aCSF were cooled down to and maintained at room temperature until use. Choline and aCSF solutions were under constant carbogenation (95% O2/5% CO2).
Electrophysiology
For whole-cell recordings, individual slices were transferred to a recording chamber mounted on an upright customized microscope with the DMOS system. LHb neurons were visualized using an infrared differential interference contrast method under a 40x water-immersion Olympus objective. Epifluorescence (LED light source from X-Cite 120Q, Excelitas) was used to confirm virus expression and to identify regions displaying high density of SSt+ tdTom+ axons within the LHb. Recording pipettes (2–3MΩ) were pulled from borosilicate glass using P-97 Flaming/Brown type micropipette puller (Sutter). Pipettes were filled with cesium-based internal recordings solution consisting of (in mM): 135 CsMeSO3, 10 HEPES, 1 EGTA, 4 Mg-ATP, 0.3 Na-GTP, 8 Na2-Phosphocreatine, 3.3 QX-314 (Cl-salt), pH adjusted to 7.3 with CsOH, and diluted to 290–295 mOsm/kg. Whole-cell voltage clamp recording was performed in acute slices continuously perfused with carbogenated aCSF at room temperature at a flow rate of 3~4ml/min. After forming an intracellular seal with a target LHb neuron, 473nm light stimulus was delivered using the full field-of-view of the DMOS setup to activate oChIEF expressing Sst+ presynaptic axons to confirm a synaptic transmission onto the postsynaptic cell. In LHb neurons that elicited PSCs, we subsequently delivered stimulation pulses (2~5ms pulse duration, 100ms interstimulus interval) consisting of 96 patterns of 23x28 µm boxes that tiled the entirety of the DMOS field-of-view to identify regions that gave rise to PSCs due to groups of axons. Voltage-clamp recordings were amplified and low-pass filtered at 3 kHz using a Multiclamp700 B (Axon Instruments, Molecular Devices) and digitized at 10 kHz using an acquisition board (National Instruments). Data was saved with a custom version of ScanImage written in MATLAB with the DMOS package that enabled mapping of the electrophysiological recording that contain PSC elicited by photo-stimulation to a spatial coordinate on the sample plane. Using this mapping table, we were able to reconstruct a spatial heatmap indicating the location coordinate of presynaptic axons that synapsed onto the postsynaptic neuron that we recorded from. All recordings were performed with R,S-3-(2-carboxypiperazin-4-yl) propyl-1-phosphonic acid (CPP, 10μM Tocris) in bath solution to block NMDAR-mediated excitatory postsynaptic current. For all experiments, the membrane potentials were left uncorrected for liquid junction potential (empirical=9.3 mV; theoretical=10.6 mV).
For the compound PSC recording experiment described in Fig. 3, LHb neurons were voltage-clamped at a holding potential of −70 mV while the DMOS system delivered a light stimulation pattern consisting of a spatiotemporal sequence of 96 different spots for five consecutive sweeps. The cell was subsequently depolarized to a holding potential of 0 mV and delivered the same stimulation pattern for another five consecutive sweeps.
For the minimal stimulation PSC recording experiment described in Fig. 4, LHb neurons were voltage-clamped at an intermediate holding potential of −35 mV or −27mV while the DMOS setup delivered light stimulation pattern of 96 different spots in each trial. To ensure that we are only targeting presynaptic boutons, tetrodotoxin (TTX, 1μM Tocris) and 4-Aminopyridine (4-AP, 40µ0M Tocris) were present in the bath solution at room temperature (24±0.5 °C) throughout the experiment. Initial five trials collected using high laser intensity were used to determine the spatial map of input-output responses in the recorded cell. Next, custom software written in MATLAB was used to select a few hotspots out of the 96 candidate spots to enable rapid collection of hundreds of trials of data in these hotspots. In some occasions, these spots were then subdivided into smaller regions and the final hotspots widths ranged from 10~30 µm, depending on our ability to evoke a PSC after reducing the stimulation spot size. After finalizing a stimulation pattern, we then manually adjusted the laser intensity using the Laser Quantum RemoteApp software until some of these spots elicited PSCs stochastically upon repetitive stimulation.
For the serotonin, 2-chloroadenosine, and CP93129 bath application experiment with DMD ring illumination (Fig. 7A–B, SFig. 8A–C), LHb neuron voltage-clamp recordings were performed at holding potentials of −64mV and 10mV, in presence of CB1 receptor antagonist AM251 (1M, Tocris) at physiological bath temperature (34±0.5 °C). 1µM Serotonin hydrochloride (Tocris), 100 µM 2-chloroadenosine (Tocris), or 1µM CP93129 hydrochloride (Tocris) was applied to perfusion chamber to compare the effect of serotonin on glutamate/GABA co-release at a macroscopic level. For the serotonin bath application experiment with presynaptic terminal stimulation (Fig. 7C–L), same experimental condition as in Fig. 4 was used with 0.25µM serotonin hydrochloride (Tocris) to reduce synaptic release probability. For the 2-chloroadenosine bath application experiment with presynaptic terminal stimulation (Fig. 8), same experimental condition as in Fig. 4 was used with 100 µM 2-chloroadenosine (Tocris) to reduce synaptic release probability.
Model simulations
We developed a biophysical model simulating a probabilistic neurotransmitter release with small variance in the vesicle content. To simulate excitatory and inhibitory postsynaptic currents due to a single vesicle release, we used the alpha function of the form:
| (2) |
where τ is the time constant determining on- and off-kinetics of the function (τE=1ms and τI=3ms were used for excitatory and inhibitory PSCs, respectively), Imax is the maximum amplitude of the current change, and u(t) is a unit step function that represents the onset of vesicle release. In the co-packaging version of the model, the excitatory and inhibitory PSCs occurred together and the vesicle noise was shared. In the independent version, the two PSCs occurred independently from each other with independent vesicle noise. The currents mediated by two different neurotransmitters were summed to generate net currents of two versions of release model:
| (3) |
| (4) |
where ξ (t) is the white noise with standard deviation σ = 0.05, which scales with the signal size. ai and bi represent the scaling factor of the single vesicle content of the ith trial
| (5) |
| (6) |
where σvesicle is the standard deviation of fluctuations in the vesicle content across trials. We simulated two hundred trials to generate a distribution of net currents using the same parameters for the two versions of model in MATLAB (available from https://github.com/seulah-kim/coreleaseAnalysis_Kim2021).
Analysis of electrophysiology data
All analysis steps were performed in MATLAB (available from https://github.com/seulah-kim/coreleaseAnalysis_Kim2021). Schematic of analysis pipeline is shown in SFig. 4A.
Quality check.
To ensure that we only include data collected with stable recording and that observed changes in evoked current peak size across trials are not due to variable amount of filtering due to fluctuations in resistance, access resistance between the pipette and the target cell was computed for every trial by fitting an RC response curve with two exponential functions and extrapolating the instantaneous peak size. The estimated access resistances across trials were median filtered, using window size of 2ms, to identify trials that exceeded 25% percentage of the initial access resistance, which was estimated from a median value of the first third trials of the total data recorded. In addition, we eliminated trials with >30pA drift in voltage-clamp recording within the trial. Across trials, any outliers that exceeded 30pA from the median of average trial value were eliminated.
Pre-processing.
Raw current signals were baseline subtracted using the mean of baseline period (299.9 ms) of each trial. The offset signal was then low-pass filtered at 2kHz and smoothed using a savitsky-golay filter with polynomial order of 5 and frame length of 2.7 ms, followed by a moving median filter of 0.6 ms window. The current traces of all trials were grouped based on the stimulation location and then aligned with respect to the light onset of individual spots. Each trial was subsequently baseline offset based on the average current of the stimulation period.
Identification of putative hotspots and change point analysis.
Median absolute deviation of individual time point was calculated across trials, for individual spots. If a spot contained time points that exceeded the 3 scaled median absolute deviation away from the median value for longer than five consecutive milliseconds, it was sorted as a hotspot. The rest of spots that did not meet these criteria were sorted as null spots. To determine the time window for trial-by-trial statistical analysis, change point analysis was performed on the light onset aligned traces of hotspots. This method identified an onset and an offset of evoked response time window such that the sum of the residual error of the three partitioned regions is minimized in the local root mean square level.
Fitting a noise model for individual cells.
Null spots and 30ms period prior to photo-stimulation onset data were pooled to fit a gaussian distribution noise model for individual cells and extract standard deviation of the symmetric noise centered around the baseline current recording of each cell.
Maximum/minimum amplitude extraction and trial classification.
To extract maximum and minimum amplitudes described in Fig. 5, hotspots traces (time x trials) were further divided into pre-stim (−30ms to 0ms, relative to light-onset) and evoked periods. Maximum and minimum peak locations were identified trial-by-trial per hotspot for individual periods. Amplitudes of maximum and minimum peaks during evoked period were estimated by computing 1 ms average around the initial peak locations and subtracting the average value of the time window spanning −13ms to −3ms, prior to the individual peaks as baselines. Same steps were repeated using the pre-stim period data to create the null distribution of maximum and minimum amplitudes. Trials with either the maximum or minimum amplitude that was greater than 2 scaled standard deviation of symmetric noise of a given cell were classified as success. The rest of the trials were classified as failures.
Classification of hotspots and subtypes.
To determine the final list of hotspots, we bootstrapped maximum and minimum amplitude pairs extracted from the pre-stim periods of individual hotspots 10,000 times to generate null distributions of probability of excitatory (p(E)), inhibitory (p(I)), and both (p∩ I) PSCs using the same criteria defined above for classifying trials as presence or absence of events. This was to account for spontaneous activity rate that would give rise to success rate observed during pre-stim period, and we wanted to ask whether observed success rate during the evoked period was statistically significant compared to the null success rate of pre-stim period.
Furthermore, we categorized individual hotspots into EPSC-only, IPSC-only, and both subtypes described in Fig. 4. In EPSC only hotspots, only the p(E) during evoked period exceeded the 95% confidence interval of the bootstrapped null distribution of p(E). In IPSC only hotspots, only the p(I) of evoked period exceeded the 95% confidence interval of the bootstrapped null distribution of p(I). In both hotspots, both p(E) and p(I) of evoked period exceeded 95% CI of the bootstrapped null distributions of p(E) and p(I), respectively.
DMOS spatial heatmaps
Total charge of PSC was measured in a 5–25ms time window after the onset of photo-stimulation.
3 Statistical features
Probability feature determines the presence or absence of the EPSC and IPSC on each trial but does not consider amplitudes of the detected currents. The occurrence of two events (e.g. detecting an EPSC or an IPSC) are statistically independent if and only if the probability of the events occurring together, or the joint probability, is equal to the product of the probabilities of each occurring. We adopted this framework to test if the observed probabilities of occurrence of PSCs with EPSCs, IPSCs, or both are consistent with the results predicted by statistical independence.
Cdf feature examines if the minimum PSC amplitude distributions are the same whether or not an IPSC was detected in the trial (“I” or “no I” trials, respectively). The converse – the PSC maximum amplitude distributions for EPSC and no EPSC containing trials (“E” or “no E trials”, respectively) – was also examined. In fact, the requirement of judging the presence or absence of either component can be relaxed and the same analysis can be performed by simply dividing the PSC into those with, for example, large and small amplitude IPSCs and asking if this influences the distribution of EPSC amplitudes (SFig. 2A). The relaxed requirement still produces distinguishable differences between the two models, demonstrating that, even if signal-to-noise (SNR) of recordings is low, this statistical test is robust.
Correlation analysis was performed separately for all trials and for success trials to account for possible analysis artifacts resulting from inclusion of noisy failure trials. In the independent release model, the distributions of the correlations between maximum and minimum PSC amplitudes are consistently negative when calculated for all trials and for success trials (Fig. 2F). The negative correlation is explained by the fact that a large (compared to the mean) EPSC reduces the peak of an independently generated (and therefore, on average, mean amplitude) IPSC and vice versa. In contrast, simulation of the co-packaging model produces strong positive correlations (essentially 1) for all-trials and for success-trials (Fig. 2F). This high correlation results from (1) co-occurrence of successes and failures in EPSCs/IPSCs and (2) shared variance due to vesicle-to-vesicle size differences, which co-modulates the two opposing currents. In each case, null correlation distributions were computed by shuffling the maximum and minimum amplitudes across trials and, as expected, are centered at zero in both models (Fig. 2F). This assay, when applied to all trials, does not require judging the presence or absence of either the EPSC or IPSC in each trial.
Simulations of biophysical models using the experimental PSC parameters were performed n=500 runs.
Parametrization of model feature indicator
Model feature indicator derived from probability feature was computed by subtracting the probability value for which cdf=0.5 of p(E)*p(I) distribution (gray) from that of p(E ∩ I) distribution (purple) (Fig. 5C,H and Fig. 6A). Δ cdf0.5 captures the direction and magnitude of the relative shift of the feature distribution compared to the null.
For imin feature output, model feature indicator was calculated as a difference in normalized minimum amplitude, i, for which cdf=0.5 between the groups with presence (solid red) and absence (dashed red) of an inhibitory current (Fig. 5D,I). Similar analyses were performed for imax feature output for maximum amplitudes between groups with presence (solid blue) and absence (dashed blue) of an excitatory current. Model feature indicators for correlationall and correlations outputs were calculated as difference in correlation value for which cdf=0.5 between all trials (dark green) and shuffled (gray) and success only trials (light green) and shuffled (gray) groups, respectively (Fig. 5E,J). For transformation of model feature indicator shown in Fig. 6C , probability feature values less than 0 were assigned to zero and then normalized by 0.25, which is the theoretical maximum difference if p(E) and p(I) were assumed to be the same. Correlation features (correlationall and correlations) and cdf features (imin and imax) values were cut off at 0 (floor) and 1 (ceiling). To reduce dimension after parametrization and transformation, we projected each spot on the model axis as the average of five model feature indicators (Fig. 6D).
Three types of noise metrics
Symmetric baseline recording noise was computed by fitting a gaussian function (mean and standard deviation) on pooled data consisting of portion of traces that are null spots (SFig. 4A) and 300ms baseline period across trials. Spontaneous activity peaks were extracted using the same method of minimum and maximum amplitude as described above applied to 30ms prior to photo-stimulation onset on each trial. As a reflection of both the rate and duration of the spontaneous synaptic events, outlier fraction was calculated as the fraction of datapoints exceeding 3 scaled median absolute deviation from the pooled data consisting of null spots and 300ms baseline period.
SNR of imin and imax were calculated by comparing imin and imax to the EPSC/IPSC detection threshold limited by the baseline current noise.
Analysis of 5-HT pharmacological effect
K-S test was performed with bootstrapping (10,000 times) with resampling size matching the smaller number of trials of the two groups (normally this is post 5-HT group size) to compare before and after 5-HT on the minimum and maximum amplitudes.
imin and imax subset distributions analysis (Fig. 7M–N; SFig. 7D1–6) was performed by aligning individual trials by the imin time point within the time window determined by change point analysis. Trials were sorted in ascending order based on the imin size and then grouped in 10 trials. Maximum and minimum amplitudes were extracted from the average trace of each group aligned by imin peak location.
To specifically test if the correlation between glutamate and GABA receptor currents was maintained after 5-HT application as predicted for the co-packaging model, we developed an alternative test that uses paired data from the basal and drug condition but does not require sorting trials into successes and failures. We compared the distribution of imin and imax amplitudes in trials sorted and binned by imin amplitude – i.e., the 5 trials with largest imin in group 1, the next 5 largest in group 2, etc… A positive correlation of the binned distributions of imin and imax confirmed that these sites were consistent with the co-packaging model (Pearson correlation coefficient=0.893 (before), 0.817 (after) ; p < 0.001 (before and after)) (Fig. 7M; SFig. 7E). Co-packaging vs. independent release models make different predictions of the effect of 5-HT on this relationship. In the former, assuming no change in synaptic potency, the range of the data and slope of the relationship showed remain unchanged; indeed, this was the effect observed in the example site (Fig. 7M). If there is an additional change in synaptic potency, the relationship should scale along the diagonal whereas, if the effects are differential on glutamate and GABA receptors, the relationship should change slope. In contrast, in an independent release model in which the pre-5-HT consistency with co-packing arose by chance, the relationship should be randomized after 5-HT or possibly reveal a negative correlation reflecting the mutual overlap of excitatory and inhibitory synaptic currents (Fig. 7N).
Overall, we found that, after 5-HT application, the binned imin vs. imax distribution maintained the correlation slope in 3 out of 6 spots (SFig. 7E1, E4, and E6). In the remaining the three spots, a correlation was maintained but the data shifted, consistent with larger effect on the imax (i.e. IPSC amplitude) distribution (SFig. 7E2, E3, and E5). Such effects could arise from a larger effect on potency of GABAergic vs. glutamatergic currents or reflect AMPA receptor saturation in the larger excitatory currents.
For the prediction of model feature indicator change (Fig. 7Q), the trials of pre 5-HT condition was analyzed with gaussian noise added to match the post 5-HT condition, subset of success trials were included to match the release probability of post 5-HT condition, and the imin and imax amplitudes of “both” success trials were scaled to match the scaling of pre vs. post 5-HT condition of median amplitudes of success trials.
Technical concerns involving our study of glutamate/GABA co-release
The success of our analysis method depends on the SNR of the recording and the ability of the algorithm to detect glutamate or GABA-mediated currents with differing kinetics and amplitudes (SFig. 6). The performance of the algorithms and the power of the models depend on the EPSC/IPSC transmission ratio and receptor kinetics and degrade with increasing spontaneous synaptic activity, baseline holding current noise, electronic noise, and numbers of active terminals within each optogenetic stimulation spot. These factors tend to make co-packaging synapses appear as independent synapses. Indeed, our study finds that the likelihood of individual unitary response hotspots being categorized as corresponding to a co-packaging synapse is anticorrelated with level of spontaneous PSCs and correlated with average EPSC/IPSC SNR of the synapse (Fig. 6E–G).
In this study, the ability to detect glutamate and GABA release depends on the expression of ionotropic receptors for each transmitter in the postsynaptic terminal associated with the stimulated bouton. Therefore, we are unable to state if synapses in which we observe only glutamate or only GABA mediated currents reflect terminals that release only one transmitter or postsynaptic terminals that are exposed to both transmitters but lack one of the receptor classes. Furthermore, given the small size of unitary synaptic currents and the ability of excitatory and inhibitory currents to obscure each other, in some glutamate-only or GABA-only spots it is possible that the missing current was simply hidden.
A possible source of error that could make independent sites appear as co-packaging sites is large variability in stimulation intensity that drives the correlation of amplitudes observed across trials. In this case the stimulation intensity would have to vary sufficiently to stochastically excite one or a small set of synapses that independently release glutamate and GABA, but do so with probability of release near 1. However, online measurements of the DMOS photo-stimulation intensity demonstrate that trial-to-trial variations in stimulation intensity are small (<1%) and uncorrelated with the categorization of each trial as success or the amplitude of the EPSC and IPSC in a given trial (Supplemental Fig 5B).
Quantification and Statistical Analysis
Comparisons of proportions of hotspots were done using Fisher’s exact test. Formal tests were not used to assess data distributions. Bootstrapping (10,000 times) method was used to simulate variance in the sampling for statistical tests. Lower boundary of p-value for bootstrapped results was set by the bootstrap number (e.g. p=1/10,000=0.0001). Cumulative distributions were compared using Kolmogorov-Smirnov tests.
Graphs were generated with custom-written scripts in MATLAB. The figures were assembled in Illustrator (Adobe). The detailed statsitics for all experiments can be found in the respective results and methods sections and figure legends. P-values smaller than 0.001 were reported as p < 0.001. The following code was used for p values in the figures: n.s. not significant; * <0.05
Supplementary Material
Highlights.
Different modes of synaptic co-release are computationally modeled and simulated
A new method permits repeated analysis of individual synapses formed onto 1 neuron
Individual synaptic vesicles of EP Sst+ boutons in LHb contain glutamate and GABA
Co-release of glutamate/GABA results in correlated activation of AMPAR and GABAAR
Acknowledgments
We thank A. Bègue, P. Gorelik, and O. Mazor for technical help; M. El-Rifai and A. Granger for help with array tomography; and Sabatini lab members for helpful discussions. This work was supported by NIH (R01NS103226 to B.L.S, R00NS105883-03 to M.L.W., and P30NS072030 to the Neurobiology Imaging Facility).
Footnotes
Publisher's Disclaimer: This is a PDF file of an unedited manuscript that has been accepted for publication. As a service to our customers we are providing this early version of the manuscript. The manuscript will undergo copyediting, typesetting, and review of the resulting proof before it is published in its final form. Please note that during the production process errors may be discovered which could affect the content, and all legal disclaimers that apply to the journal pertain.
Declaration of Interests
B.L.S. is a member of the Neuron advisory board.
References
- Barker DJ, Miranda-Barrientos J, Zhang S, Root DH, Wang H-L, Liu B, Calipari ES, Morales M, 2017. Lateral Preoptic Control of the Lateral Habenula through Convergent Glutamate and GABA Transmission. Cell Rep 21, 1757–1769. 10.1016/j.celrep.2017.10.066 [DOI] [PMC free article] [PubMed] [Google Scholar]
- Cerniauskas I, Winterer J, de Jong JW, Lukacsovich D, Yang H, Khan F, Peck JR, Obayashi SK, Lilascharoen V, Lim BK, Földy C, Lammel S, 2019. Chronic Stress Induces Activity, Synaptic, and Transcriptional Remodeling of the Lateral Habenula Associated with Deficits in Motivated Behaviors. Neuron 104, 899–915.e8. 10.1016/j.neuron.2019.09.005 [DOI] [PMC free article] [PubMed] [Google Scholar]
- Granger AJ, Wang W, Robertson K, El-Rifai M, Zanello AF, Bistrong K, Saunders A, Chow BW, Nuñez V, Turrero García M, Harwell CC, Gu C, Sabatini BL, 2020. Cortical ChAT+ neurons co-transmit acetylcholine and GABA in a target- and brain-region-specific manner. Elife 9. 10.7554/eLife.57749 [DOI] [PMC free article] [PubMed] [Google Scholar]
- Hong S, Hikosaka O, 2008. The Globus Pallidus Sends Reward-Related Signals to the Lateral Habenula. Neuron 60, 720–729. 10.1016/j.neuron.2008.09.035 [DOI] [PMC free article] [PubMed] [Google Scholar]
- Hu H, Cui Y, Yang Y, 2020. Circuits and functions of the lateral habenula in health and in disease. Nat Rev Neurosci 21, 277–295. 10.1038/s41583-020-0292-4 [DOI] [PubMed] [Google Scholar]
- Hwang E-K, Chung J, 2014. 5HT1B receptor-mediated pre-synaptic depression of excitatory inputs to the rat lateral habenula. Neuropharmacology 81, 153–165. 10.1016/j.neuropharm.2014.01.046 [DOI] [PubMed] [Google Scholar]
- Jonas P, Bischofberger J, Sandkühler J, 1998. Corelease of Two Fast Neurotransmitters at a Central Synapse. Science 281, 419–424. 10.1126/science.281.5375.419 [DOI] [PubMed] [Google Scholar]
- Knowland D, Lilascharoen V, Pacia CP, Shin S, Wang EH-J, Lim BK, 2017. Distinct Ventral Pallidal Neural Populations Mediate Separate Symptoms of Depression. Cell 170, 284–297.e18. 10.1016/j.cell.2017.06.015 [DOI] [PMC free article] [PubMed] [Google Scholar]
- Lalive AL, Congiu M, Clerke JA, Tchenio A, Ge Y, Mameli M, 2021. Synaptic inhibition in the lateral habenula shapes reward anticipation. bioRxiv 2021.01.21.427572. 10.1101/2021.01.21.427572 [DOI] [PubMed] [Google Scholar]
- Lammel S, Lim BK, Ran C, Huang KW, Betley MJ, Tye KM, Deisseroth K, Malenka RC, 2012. Input-specific control of reward and aversion in the ventral tegmental area. Nature 491, 212–217. 10.1038/nature11527 [DOI] [PMC free article] [PubMed] [Google Scholar]
- Lazaridis I, Tzortzi O, Weglage M, Märtin A, Xuan Y, Parent M, Johansson Y, Fuzik J, Fürth D, Fenno LE, Ramakrishnan C, Silberberg G, Deisseroth K, Carlén M, Meletis K, 2019. A hypothalamus-habenula circuit controls aversion. Molecular Psychiatry 24, 1351–1368. 10.1038/s41380-019-0369-5 [DOI] [PMC free article] [PubMed] [Google Scholar]
- Lee S, Kim K, Zhou ZJ, 2010. Role of ACh-GABA cotransmission in detecting image motion and motion direction. Neuron 68, 1159–1172. 10.1016/j.neuron.2010.11.031 [DOI] [PMC free article] [PubMed] [Google Scholar]
- Li B, Piriz J, Mirrione M, Chung C, Proulx CD, Schulz D, Henn F, Malinow R, 2011. Synaptic potentiation onto habenula neurons in the learned helplessness model of depression. Nature 470, 535–539. 10.1038/nature09742 [DOI] [PMC free article] [PubMed] [Google Scholar]
- Li H, Pullmann D, Jhou TC, 2019. Valence-encoding in the lateral habenula arises from the entopeduncular region. eLife 8, e41223. 10.7554/eLife.41223 [DOI] [PMC free article] [PubMed] [Google Scholar]
- Lin JY, Lin MZ, Steinbach P, Tsien RY, 2009. Characterization of engineered channelrhodopsin variants with improved properties and kinetics. Biophys J 96, 1803–1814. 10.1016/j.bpj.2008.11.034 [DOI] [PMC free article] [PubMed] [Google Scholar]
- Maroteaux M, Mameli M, 2012. Cocaine Evokes Projection-Specific Synaptic Plasticity of Lateral Habenula Neurons. J Neurosci 32, 12641–12646. 10.1523/JNEUROSCI.2405-12.2012 [DOI] [PMC free article] [PubMed] [Google Scholar]
- Matsumoto M, Hikosaka O, 2009. Two types of dopamine neuron distinctly convey positive and negative motivational signals. Nature 459, 837–841. 10.1038/nature08028 [DOI] [PMC free article] [PubMed] [Google Scholar]
- Matsumoto M, Hikosaka O, 2007. Lateral habenula as a source of negative reward signals in dopamine neurons. Nature 447, 1111–1115. 10.1038/nature05860 [DOI] [PubMed] [Google Scholar]
- Meye FJ, Soiza-Reilly M, Smit T, Diana MA, Schwarz MK, Mameli M, 2016. Shifted pallidal co-release of GABA and glutamate in habenula drives cocaine withdrawal and relapse. Nature Neuroscience 19, 1019–1024. 10.1038/nn.4334 [DOI] [PubMed] [Google Scholar]
- Micheva KD, Smith SJ, 2007. Array Tomography: A New Tool for Imaging the Molecular Architecture and Ultrastructure of Neural Circuits. Neuron 55, 25–36. 10.1016/j.neuron.2007.06.014 [DOI] [PMC free article] [PubMed] [Google Scholar]
- Petreanu L, Huber D, Sobczyk A, Svoboda K, 2007. Channelrhodopsin-2-assisted circuit mapping of long-range callosal projections. Nat Neurosci 10, 663–668. 10.1038/nn1891 [DOI] [PubMed] [Google Scholar]
- Petreanu L, Mao T, Sternson SM, Svoboda K, 2009. The subcellular organization of neocortical excitatory connections. Nature 457, 1142–1145. 10.1038/nature07709 [DOI] [PMC free article] [PubMed] [Google Scholar]
- Proulx CD, Hikosaka O, Malinow R, 2014. Reward processing by the lateral habenula in normal and depressive behaviors. Nature Neuroscience 17, 1146–1152. 10.1038/nn.3779 [DOI] [PMC free article] [PubMed] [Google Scholar]
- Root DH, Barker DJ, Estrin DJ, Miranda-Barrientos JA, Liu B, Zhang S, Wang H-L, Vautier F, Ramakrishnan C, Kim YS, Fenno L, Deisseroth K, Morales M, 2020. Distinct Signaling by Ventral Tegmental Area Glutamate, GABA, and Combinatorial Glutamate-GABA Neurons in Motivated Behavior. Cell Reports 32, 108094. 10.1016/j.celrep.2020.108094 [DOI] [PMC free article] [PubMed] [Google Scholar]
- Root DH, Mejias-Aponte CA, Qi J, Morales M, 2014a. Role of Glutamatergic Projections from Ventral Tegmental Area to Lateral Habenula in Aversive Conditioning. J Neurosci 34, 13906–13910. 10.1523/JNEUROSCI.2029-14.2014 [DOI] [PMC free article] [PubMed] [Google Scholar]
- Root DH, Mejias-Aponte CA, Zhang S, Wang H-L, Hoffman AF, Lupica CR, Morales M, 2014b. Single rodent mesohabenular axons release glutamate and GABA. Nature Neuroscience 17, 1543–1551. 10.1038/nn.3823 [DOI] [PMC free article] [PubMed] [Google Scholar]
- Root DH, Zhang S, Barker DJ, Miranda-Barrientos J, Liu B, Wang H-L, Morales M, 2018. Selective Brain Distribution and Distinctive Synaptic Architecture of Dual Glutamatergic-GABAergic Neurons. Cell Reports 23, 3465–3479. 10.1016/j.celrep.2018.05.063 [DOI] [PMC free article] [PubMed] [Google Scholar]
- Saunders A, Granger AJ, Sabatini BL, 2015. Corelease of acetylcholine and GABA from cholinergic forebrain neurons. eLife 4, e06412. 10.7554/eLife.06412 [DOI] [PMC free article] [PubMed] [Google Scholar]
- Shabel SJ, Proulx CD, Piriz J, Malinow R, 2014. GABA/glutamate co-release controls habenula output and is modified by antidepressant treatment. Science 345, 1494–1498. 10.1126/science.1250469 [DOI] [PMC free article] [PubMed] [Google Scholar]
- Shabel SJ, Proulx CD, Trias A, Murphy RT, Malinow R, 2012. Input to the lateral habenula from the basal ganglia is excitatory, aversive, and suppressed by serotonin. Neuron 74, 475–481. 10.1016/j.neuron.2012.02.037 [DOI] [PMC free article] [PubMed] [Google Scholar]
- Stamatakis AM, Stuber GD, 2012. Activation of lateral habenula inputs to the ventral midbrain promotes behavioral avoidance. Nature Neuroscience 15, 1105–1107. 10.1038/nn.3145 [DOI] [PMC free article] [PubMed] [Google Scholar]
- Stamatakis AM, Van Swieten M, Basiri ML, Blair GA, Kantak P, Stuber GD, 2016. Lateral Hypothalamic Area Glutamatergic Neurons and Their Projections to the Lateral Habenula Regulate Feeding and Reward. J Neurosci 36, 302–311. 10.1523/JNEUROSCI.1202-15.2016 [DOI] [PMC free article] [PubMed] [Google Scholar]
- Stephenson-Jones M, Yu K, Ahrens S, Tucciarone JM, van Huijstee AN, Mejia LA, Penzo MA, Tai L-H, Wilbrecht L, Li B, 2016. A basal ganglia circuit for evaluating action outcomes. Nature 539, 289–293. 10.1038/nature19845 [DOI] [PMC free article] [PubMed] [Google Scholar]
- Südhof TC, Rizo J, 2011. Synaptic Vesicle Exocytosis. Cold Spring Harb Perspect Biol 3, a005637. 10.1101/cshperspect.a005637 [DOI] [PMC free article] [PubMed] [Google Scholar]
- Takamori S, Holt M, Stenius K, Lemke EA, Grønborg M, Riedel D, Urlaub H, Schenck S, Brügger B, Ringler P, Müller SA, Rammner B, Gräter F, Hub JS, Groot BLD, Mieskes G, Moriyama Y, Klingauf J, Grubmüller H, Heuser J, Wieland F, Jahn R, 2006. Molecular Anatomy of a Trafficking Organelle. Cell 127, 831–846. 10.1016/j.cell.2006.10.030 [DOI] [PubMed] [Google Scholar]
- Takamori S, Rhee JS, Rosenmund C, Jahn R, 2000a. Identification of a vesicular glutamate transporter that defines a glutamatergic phenotype in neurons. Nature 407, 189–194. 10.1038/35025070 [DOI] [PubMed] [Google Scholar]
- Takamori S, Riedel D, Jahn R, 2000b. Immunoisolation of GABA-Specific Synaptic Vesicles Defines a Functionally Distinct Subset of Synaptic Vesicles. J. Neurosci. 20, 4904–4911. 10.1523/JNEUROSCI.20-13-04904.2000 [DOI] [PMC free article] [PubMed] [Google Scholar]
- Taniguchi H, He M, Wu P, Kim S, Paik R, Sugino K, Kvitsani D, Fu Y, Lu J, Lin Y, Miyoshi G, Shima Y, Fishell G, Nelson SB, Huang ZJ, 2011. A Resource of Cre Driver Lines for Genetic Targeting of GABAergic Neurons in Cerebral Cortex. Neuron 71, 995–1013. 10.1016/j.neuron.2011.07.026 [DOI] [PMC free article] [PubMed] [Google Scholar]
- Tritsch NX, Ding JB, Sabatini BL, 2012. Dopaminergic neurons inhibit striatal output through non-canonical release of GABA. Nature 490, 262–266. 10.1038/nature11466 [DOI] [PMC free article] [PubMed] [Google Scholar]
- Tritsch NX, Granger AJ, Sabatini BL, 2016. Mechanisms and functions of GABA co-release. Nature Reviews Neuroscience 17, 139–145. 10.1038/nrn.2015.21 [DOI] [PMC free article] [PubMed] [Google Scholar]
- Trusel M, Nuno-Perez A, Lecca S, Harada H, Lalive AL, Congiu M, Takemoto K, Takahashi T, Ferraguti F, Mameli M, 2019. Punishment-Predictive Cues Guide Avoidance through Potentiation of Hypothalamus-to-Habenula Synapses. Neuron 102, 120–127.e4. 10.1016/j.neuron.2019.01.025 [DOI] [PubMed] [Google Scholar]
- Wallace ML, Saunders A, Huang KW, Philson AC, Goldman M, Macosko EZ, McCarroll SA, Sabatini BL, 2017. Genetically Distinct Parallel Pathways in the Entopeduncular Nucleus for Limbic and Sensorimotor Output of the Basal Ganglia. Neuron 94, 138–152.e5. 10.1016/j.neuron.2017.03.017 [DOI] [PMC free article] [PubMed] [Google Scholar]
- Wojcik SM, Rhee JS, Herzog E, Sigler A, Jahn R, Takamori S, Brose N, Rosenmund C, 2004. An essential role for vesicular glutamate transporter 1 (VGLUT1) in postnatal development and control of quantal size. PNAS 101, 7158–7163. 10.1073/pnas.0401764101 [DOI] [PMC free article] [PubMed] [Google Scholar]
- Yang Y, Cui Y, Sang K, Dong Y, Ni Z, Ma S, Hu H, 2018. Ketamine blocks bursting in the lateral habenula to rapidly relieve depression. Nature 554, 317–322. 10.1038/nature25509 [DOI] [PubMed] [Google Scholar]
- Zhang S, Qi J, Li X, Wang H-L, Britt JP, Hoffman AF, Bonci A, Lupica CR, Morales M, 2015. Dopaminergic and glutamatergic microdomains within a subset of rodent mesoaccumbens axons. Nat Neurosci 18, 386–392. 10.1038/nn.3945 [DOI] [PMC free article] [PubMed] [Google Scholar]
Associated Data
This section collects any data citations, data availability statements, or supplementary materials included in this article.
Supplementary Materials
Data Availability Statement
Electrophysiology data have been deposited at Zenodo. Accession numbers are listed in the key resources table. Array tomography data reported in this paper will be shared by the lead contact upon request.
All custom code for analyzing this data is pulicaly available as of the date of publication. DOIs are listed in the key resource table.
Any additional information required to reanalyze the data reported in this paper is available from the lead contact upon request.
KEY RESOURCES TABLE
| REAGENT or RESOURCE | SOURCE | IDENTIFIER |
|---|---|---|
| Antibodies | ||
| chicken α-GFP | GeneTex | GeneTex Cat# GTX13970, RRID:AB_371416 |
| mouse α-Gephyrin | Biosciences Pharmigen | BD Biosciences Cat# 612632, RRID:AB_399669 |
| rabbit α-Synapsin-1 | Cell Signaling Tech | Cell Signaling Technology Cat# 5297, RRID:AB_2616578 |
| rabbit α-PSD95 | Cell Signaling Tech | Cell Signaling Technology Cat# 3450, RRID:AB_2292883 |
| mouse α-VGAT | Synaptic Systems | Synaptic Systems Cat# 131 011, RRID:AB_887872 |
| rabbit α-VGLUT2 | Synaptic Systems | Synaptic Systems Cat# 135 403, RRID:AB_887883 |
| Bacterial and Virus Strains | ||
| AAV8-EF1α-DIO-oChIEF(E163A/T199C)-P2A-dTomato-WPRE-BGHpA | Lin et al. 2009, Boston Children’s Hospital Viral Core | RRID:Addgene_51094 |
| AAV8-CMV-DIO-Synaptophysin-YFP | UNC Vector Core | N/A |
| Chemicals, Peptides, and Recombinant Proteins | ||
| Serotonin hydrochloride | Tocris | Cat# 3547 |
| 2-Chloroadenosine | Tocris | Cat# 3136 |
| CP93129 hydrochloride | Tocris | Cat# 1032 |
| AM251 | Tocris | Cat# 1117 |
| (R)-CPP | Tocris | Cat# 0247 |
| Tetrodotoxin citrate (TTX) | Abcam | Cat# 120055 |
| 4-Aminopyridine (4-AP) | Tocris | Cat# 0940 |
| Deposited Data | ||
| Raw data files for electrophysiology recordings | This paper | GitHub: https://github.com/seulah-kim/coreleaseAnalysis_Kim2021;DOI: 10.5281/zenodo.5810663 |
| Experimental Models: Organisms/Strains | ||
| Mouse: Sst-Cre: Ssttm2.1(cre)Zjh/J | Jackson Laboratories | Cat# 013044; MGI# 4838416 |
| Mouse: C57BL/6J | Jackson Laboratories | Cat# 000664; MGI# 3028467 |
| Software and Algorithms | ||
| Fiji | Schindelin et al. 2012 | https://imagej.net/software/fiji/ |
| MATLAB | MathWorks | https://www.mathworks.com/ |
| Custom MATLAB scripts | SeulAh Kim | GitHub: https://github.com/seulah-kim/coreleaseAnalysis_Kim2021;DOI: 10.5281/zenodo.5810663 |
| ScanImage (2015b version) | Bernardo Sabatini | https://github.com/bernardosabatini/SabalabAcq.git |
| Other | ||
| Digital Micromirror Device | Texas Instruments | DLP LightCrafter Evaluation Module |