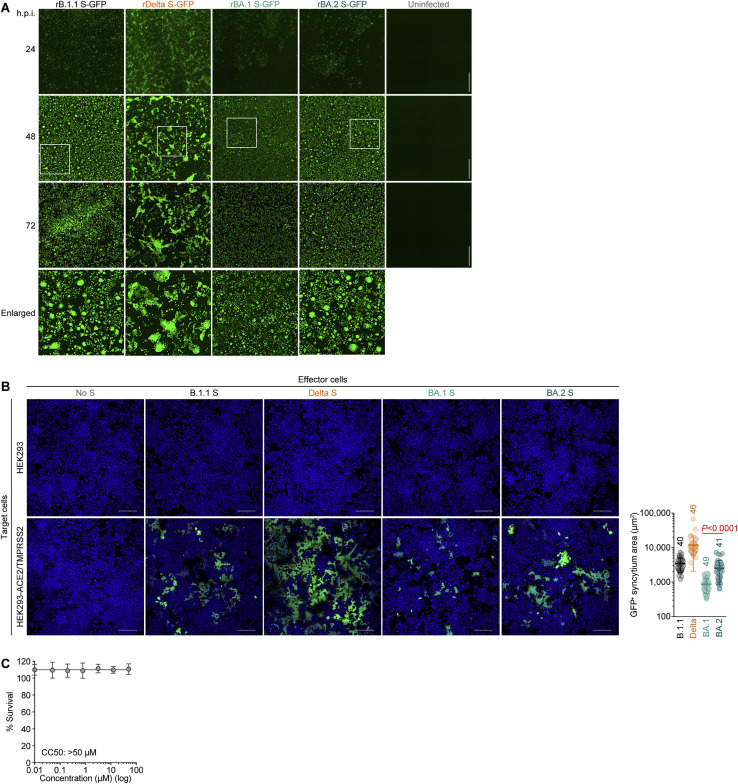
Figure S3.
Virological features of BA.2 in vitro, related to Figure 3
(A) Fluorescence microscopy. The GFP area were measured in infected VeroE6/TMPRSS2 cells (m.o.i. 0.01) at 24, 48, and 72 h.p.i. Higher-magnification views of the regions indicated by squares are shown at the bottom. The panels at 48 h.p.i. are identical to those shown in Figure 3C.
(B) Coculture of S-expressing cells with HEK293-ACE2/TMPRSS2 cells. Left, representative images of S-expressing cells cocultured with HEK293 cells (top) or HEK293-ACE2/TMPRSS2 cells (bottom). Nuclei were stained with Hoechst 33342 (blue). Right, size distribution of syncytia (green). The numbers in the panel indicate the numbers of GFP-positive syncytia counted.
(C) Cytotoxicity of E64d in HOS-ACE2-TMPRSS2 cells. The cells were cultured in the presence of serially diluted E64d for 48 h, and the cytotoxicity was measured using a cell counting kit-8 solution. The assay for each concentration was performed in sextuplicate, and the data are expressed as the average ± SD. CC50, 50% cytotoxic concentration.
Scale bars, 500 μm (A) or 200 μm (B).

