

Abstract
Intra organ of Corti (OC) vibrations differ from those measured at the basilar membrane (BM), with higher amplitudes and a wide-band nonlinearity extending well below a region’s best frequency. The vibrations are boosted by the cochlear amplifier, the active processes within the mammalian hearing organ, and are thus sensitive to metabolic or pharmacological manipulation. We introduced salicylate, a known blocker of outer hair cell (OHC) based electromotility, into the perilymphatic space by applying sodium salicylate onto the round window membrane. Vibration patterns of an area of the OC were mapped with phase sensitive optical coherence tomography before and after treatment; distortion product otoacoustic emissions (DPOAEs) were measured at similar times to assess the cochlear condition. Following treatment, all regions showed a loss of vibration amplitude and tuning while OHC-region vibrations retained their wide-band nonlinearity. OC vibrations, which had been relatively confined in a region including OHCs and extending to the BM at the outer pillar foot, became less confined with structures lateral to the OHCs sometimes exhibiting the highest amplitudes. Vibrations and DPOAEs could recover to baseline levels over approximately three hours post treatment.
Keywords: Cochlear amplifier, Organ of Corti, Outer Hair Cells, Salicylate
Introduction
The mammalian hearing organ, the cochlea, uses active mechanisms to boost its vibratory response to low level sounds. Sound waves transmitted to the cochlea give rise to traveling waves whose frequency components each peak at a specific longitudinal location along the organ’s length, and stimulate the mechanosensitive hair cells. The active process, or cochlear amplifier, endows the auditory system with high sensitivity to faint sounds, a compressive nonlinearity which greatly expands its dynamic range over ~120 dB or six orders of magnitude in pressure, and sharpened frequency selectivity at each location’s best frequency (BF). A consequence of the cochlear nonlinearity is the production of distortion product otoacoustic emissions (DPOAEs): when two or more frequencies or tones are simultaneously presented to the ear, internal vibrations generate combination tones that propagate through the auditory pathway in reverse and can be measured in the ear canal with a sensitive microphone. The most prominent DPOAE is the 2f1−f2 frequency which is generated by pure tones f1 and f2 (f2 > f1) and is used in both human and animal studies to test normal auditory function. The hallmarks of the cochlear amplifier are all physiologically sensitive: they vanish shortly post mortem and are compromised to varying levels in hearing impaired humans and animals.
Because the amplifier operates under feedback, experimentally dissecting all of its components is challenging. One approach uses transgenic animals, often genetically engineered mice expressing genes orthologous to those causing deafness in humans. A second approach, taken in this study, involves the administration of ototoxic drugs to animals with otherwise normal hearing and monitoring changes in the cochlea’s sound-evoked electrophysiological and vibratory responses.
A key component of the amplifier is generated by the outer hair cells (OHCs) whose basolateral cell bodies undergo contraction/expansion when the cells are depolarized/hyperpolarized, which is based in a piezoelectric-like protein, prestin (Zheng et al., 2000). This electromotility boosts the vibrations of the cochlear partition. In genetically modified animals in which prestin was present but genetically disabled, compound action potential (CAP) thresholds were elevated by ~ 40 dB (Dallos et al., 2008). In a full prestin knock-out mouse, the vibration BF shifted to lower frequency, with reduced tuning, but showed similar absolute sensitivity as the wildtype, perhaps due to reduced stiffness in the mutant (Mellado Lagarde et al., 2008). Post-mortem changes were absent in the knock-out, confirming that the active process was missing.
Salicylates and salicylic acid compounds have been known to be ototoxic since acetylsalicylic acid (aspirin) became the first widely available modern analgesic in the 1890s (reviewed in Sheppard et al. (2014)). In humans, administration of high doses of salicylate causes temporary threshold elevations, tinnitus and changes to DPOAEs (Long and Tubis, 1988; Janssen et al., 2000). Similar changes are seen in mammalian species that are frequently used as animal models to study the auditory system. Salicyalte’s negative effects on the auditory system are usually reversible with the timescale of recovery depending on dosage, administration pathway, and species.
Salicylate acts through a number of mechanisms at both the auditory periphery and further upstream. In isolated OHCs, millimolar concentration of salicylate in the extracellular bath is known to reduce electromotility (Shehata et al., 1991; Santos-Sacchi et al., 2006) and reduce or abolish the nonlinear capacitance that is frequently used as a surrogate for electromotility (Kakehata and Santos-Sacchi, 1996). In addition to reducing somatic electromotility, salicylate changes other mechanical and electrical properties of the hair cells. Salicylate increases the basolateral conductance of the OHCs (Shehata et al., 1991), an effect that complicates interpretation of salicylate-induced changes in the in vivo cochlear microphonic (Murugasu and Russell, 1995). Isolated OHCs show an ~ 65 % reduction in axial stiffness in vitro when bathed in extracellular solution containing 5 mM salicylate (Russell and Schauz, 1995). There is also evidence that salicylate can reduce stereocilia pivoting stiffness. Hakizimana and Fridberger used a relatively intact in situ guinea pig temporal bone preparation to measure sound-evoked motion of structures within the OC (Hakizimana and Fridberger, 2015). Following perfusion with salicylate, the stereocilia deflections increased. Additional evidence that salicylate acts through several pathways, some of which can directly affect the hair bundles, comes from non-mammalian vertebrates, whose orthologues of prestin are not believed to have a motor function, yet for which salicylate affects DPOAEs or evoked potentials (Stewart and Hudspeth, 2000; Schaechinger and Oliver, 2007).
Upstream of the sensory cells, salicylate can damage spiral ganglion nerve (SGN) fibers, which presumably underlies the tinnitus that frequently accompanies acute salicylate toxicity (Feng et al., 2010; Wei et al., 2010; Sheppard et al., 2014). Cultured OC treated with millimolar salicylate show irreversible loss of SGN fibers but normal counts of outer hair cells (Wei et al., 2010; Sheppard et al., 2014). Such damage to the SGN fibers is unlikely to feed back into the mechanical responses over the timescale of our OCT-based experiments, on the order of a few hours post treatment.
In vivo, the effects of salicylate on basilar membrane (BM) vibrations have been studied in several rodent species (Murugasu and Russell, 1995; Santos-Sacchi et al., 2006; Fisher et al., 2012; Nin et al., 2012). Murugasu and Russell used a self-mixing interferometer to measure the sound-evoked motion of the BM in guinea pig before and after perfusing the scala tympani with artificial perilymph containing several millimolar sodium salicylate. The resulting tuning curves were broadened, showed a reversible ~ 45 dB reduction in the BF peak, and a reduction in the frequency of the peak. Similar effects, also in guinea pig, were seen by Santos-Sacchi et al. (2006) who used a laser Doppler vibrometer to measure BM vibrations before and after perfusing millimolar salicylate into the scala tympani. Because of technological constraints, traditional cochlear vibrometry has been limited to studying one surface in the OC, usually the BM when measuring near the cochlear base. Recent developments in optical coherence tomography (OCT) have allowed for measurements of multiple structures across the cochlear partition and have revealed that the structures deeper within the OC exhibit larger amplitudes and different tuning than the BM. Additionally, the vibrations in a relatively narrow region, or hot spot, around the OHCs and extending approximately from their bases to the reticular lamina (RL) exhibit compressive nonlinearity across a wide frequency band (Cooper et al., 2018; Fallah et al., 2019, 2021), while the BM vibrations are nonlinear in a narrow band centered on the BF. The wide-band nonlinearity is more pronounced when the stimuli are themselves wide band (containing multiple tones, and thus of higher overall amplitude). In gerbil, salicylate abolished the electrically evoked vibrations at both the BM and RL (Ren et al., 2016). To our knowledge, the effects of salicylate on the sound-evoked motion of other structures within the OC in vivo have not been measured, and observations of the recovery have not been documented.
Rather than perfusing directly into the perilymphatic spaces, Sadreev et al. (2019) placed 5 μL of 100 mM salicylate on the round window membrane in guinea pigs and measured CAP threshold elevations over a range of frequencies as a function of time. By combining their results with a model of passive diffusion and active extrusion, the authors calculated the salicylate concentration at different longitudinal locations along the cochlea as a function of time. Near the base, the concentration reached a steady state value ~ 5 % of the extracochlear value ~ 10 minutes after the drug introduction. We used a similar protocol to Sadreev et al. to introduce sodium salicylate into the perilymphatic spaces of the gerbil cochlea in vivo, and used phase sensitive OCT to measure OC vibrations before and after treatment. DPOAEs were measured at nearly the same time points to gauge the general cochlear condition and to assess the efficacy of the drug introduction and subsequent recovery. In most experiments, we introduced 50 mM sodium salicylate into the round window space and allowed the drug to passively diffuse into the scala tympani for 10 – 30 minutes. Assuming similar rates of diffusion in the two species, and recognizing the smaller volume of scala tympani in gerbils (Thorne et al., 1999), the salicylate concentration in the basal perilymph is expected to be at least 2.5 mM and possibly somewhat greater, sufficient to reduce electromotility and similar to the concentrations used in vitro, in situ, and in vivo.
In one set of experiments, we measured OC vibrations along one axis centered near the intersection of the arcuate and pectinate zones of the BM, and traversing the OHC region. Frequency and sound pressure level (SPL) were sampled relatively densely and measurements were taken before, and for up to five hours after the introduction of salicylate. In a second set of experiments, we reduced the number of SPLs and frequencies probed and measured the OC vibrations in slices spaced approximately radially in 10 μm steps, and constructed maps of the vibration patterns in a 120 – 160 μm wide region centered on the OHCs. To give a brief preview of findings: In the first measurement after salicylate treatment, BM responses resembled a passive cochlea, showing reduced amplitudes, a loss of the BF peak, and linear growth with increasing SPL. Intra-OC vibrations around the OHC region likewise showed reduced amplitudes and a loss of the BF peak, but retained their wide-band nonlinearity. Around 50 minutes post treatment, the vibrations began to recover both in amplitude and nonlinearity, with nearly complete recovery observed in the best preparations some three hours after the drug delivery. In the vibration maps, the pattern of motion before salicylate was a relatively confined and oblong distribution extending from the OHCs to a region of the BM near the outer pillar foot. Following salicylate this changed to a more diffuse lateral distribution, returning to the tighter distribution as the vibrations recovered. DPOAEs recovered over a similar timescale as the vibration.
Materials and Methods
Gerbil Preparation
Protocols were approved by the Columbia University Institutional Animal Care and Use Committee. Young adult gerbils, approximately 7–11 weeks old, of either sex were anesthetized with intraperitoneal (IP) injections of ketamine (40 mg/kg) and sodium pentobarbital (40 mg/kg). Anesthesia was maintained with supplemental doses of pentobarbital given if the animals displayed a reflex in response to a light toe pinch. Buprenorphine (0.2 mg/kg) was administered IP every six hours and some animals were given subcutaneous injections of 2 % lidocaine in the scalp and pinna (~ 0.01 mL at each injection site). The gerbil’s scalp was removed and the head attached to a two-axis goniometer (Melles-Griot) with dental cement (Durelon, 3M). The left pinna and most of the cartilaginous ear canal were resected and the animals were tracheotomized to facilitate breathing. The tissue and muscle over the left temporal bone were carefully dissected and a narrow opening in the bulla was made by chipping the bone with fine forceps. A second window was made in the bulla at a more rostral location and was used to position a fine needle for delivery of solutions into the round window niche. A bridge of dental cement was used to firmly attach the bulla to the goniometer. Throughout the surgery and experiment, the animal’s temperature was maintained at 38°C with a servo-controlled heating blanket and monitored with a rectal thermometer. During OCT measurements, additional heating was supplied by a lamp and a disposable hand warmer (Hot Hands, Heat-Max Inc.) positioned on the goniometer. Experiments were conducted on an optics table in an acoustical isolation booth (Industrial Acoustics Corp.).
Acoustical System
Acoustic signals were generated using a Tucker Davis Technologies (TDT) system with a sampling rate of 97656.25 S/s. The sound was played by a Radio Shack tweeter and delivered closed-field to the ear canal through a plastic tube. Pressures were measured with an ultrasonic microphone (Sokolich) whose probe tube was positioned 1 – 2 mm from the tympanic membrane. Sound pressure levels are reported as dB SPL referenced to the standard value, 0 dB SPL = 20 μPa. In each experiment we measured DPOAEs evoked by two simultaneously presented tones of frequencies f1 and f2 where f2 was swept from 1 to 48 kHz, f1, f2 had a fixed ratio of f2/f1 = 1.2, and the two tones were presented at equal levels of 50 and 70 dB SPL. The signals played for 1 second, were divided into 50 identical presentations and averaged. The cubic distortion product 2f1−f2 serves as a good indicator of the global health of the cochlea and a large reduction in the DPOAE evoked by the 50 dB primaries following the application of salicylate on the round window membrane was used to assess the drug’s efficacy. Gradual recovery of the 50 dB DPOAEs over the subsequent few hours served as a monitor of the recovery of the active process. Cochlear vibrations were measured in response to zwuis multi-tone complexes, in which a number of frequencies, n = 15 or 40 depending on the measurement, were presented simultaneously. The zwuis complexes were generated such that each frequency component contained an integer number of samples per cycle and thus there was no spectral leakage and such that all frequency components in the complex were linearly independent, that is containing no harmonics or distortion products, up to third order (Versteegh and van der Heijden, 2012; Cooper et al., 2018). Each sinusoidal component in the complex was assigned a random phase so the pressure magnitude of the complex was higher than the magnitude of each component. A discussion of the use of single-tone (narrow-band) and multi-tone (wide-band) stimulation is in (Van der Heijden and Joris, 2003). Following the main sets of multi-tone experiments, four experiments were performed with a subset of single tones.
Optical Coherence Tomography and Spectral Domain Phase Microscopy
Cochleae were imaged with a ThorLabs Telesto III OCT, central wavelength ~ 1300 nm, equipped with an LSM03 5×, 0.055 NA objective lens. After the initial surgery, the gerbils were placed under the OCT and the instrument’s video camera and an operating microscope were used to position the head. Recordings were made in the cochlear base through the intact round window membrane, typically near the 25 kHz location. In a few preparations, we were able to measure from a somewhat more apical position close to the 20 kHz location. Once the gerbils were placed under the OCT, continuous two-dimensional scans (or Bscans) were taken with the ThorImage program and minor adjustments were made to the head until we had a clear view of the OC. For vibrometry, the OCT and TDT systems were synchronized as previously described (Lin et al., 2018). Briefly, the clock signal from the TDT zBus was modified using a custom built digital/analog circuit to give a high duty cycle (80% high, 20% low) 5 V square wave which served as the TTL trigger for the OCT’s line camera. The OCT was controlled with custom software written in C++, based on the ThorLabs software development kit (SDK). The first steps in the post-processing, transforming the photodetector data from wavelength to wavenumber (λ to k) domain, and then Fourier transforming the k-domain data into Ascans (one-dimensional maps of brightness vs. depth) were implemented in the C++ program. The resulting series of time-dependent Ascans were exported to a solid state drive as 16-bit raw files for offline analysis. Before and after each vibrometry measurement, the OCT took 1 mm-wide Bscans and false color images of the two Bscans were compared to check that the sample position was stable over the course of the measurements, ~ 3 to 17 minutes depending on the experiment. A small number of recordings were discarded because the OC displayed too much drift for the structures to be tracked or fluid accumulated in the round window niche.
In the first set of experiments, we measured vibrations along a single Ascan that traversed the BM and the OHC region. In these measurements, the stimuli were zwuis tone complexes containing 40 frequencies from ~ 5 to 35 kHz presented from 40 to 80 dB SPL in 10 dB steps and presented for ~ 5.7 s. A complete set of tuning curves, 5 amplitudes, took ~ 2.5 minutes, primarily due to the time required to transform the raw data into Ascans and save the resulting files to a solid state drive. Local maxima in the magnitude of the Ascan correspond to different structures in the OC, and pixels corresponding to these local maxima were chosen for displacement measurements. The time variation of the phase of the time-series of complex Ascans (Mscan), at a given pixel, is proportional to the axial displacement of the structure at the pixel: the Mscan phase as a function of time is proportional to the time waveform of the structure’s displacement. After finding the time waveform, the amplitude and phase at each frequency component in the stimulus were extracted with a time-to-frequency domain Fourier analysis. For each frequency component, the response was deemed significant if its amplitude was three standard deviations higher than the noise level measured in ten neighboring bins. Scripts for determining the displacements as a function of time were written in MatLab.
In the second set of experiments, we mapped the axial vibration pattern in a 120 – 160 μm wide region centered around the OHCs. For these experiments, the stimuli contained 15 frequencies from ~ 10 to 35 kHz or from ~ 7 to 30 kHz depending on the BF and were played from either 50 or 60 to 80 dB SPL in 10 dB steps for 1.07 s. Mscans were taken in 10 μm steps and the displacement time waveforms at each pixel of interest were extracted as above. Linear interpolation was applied to the coarsely sampled grids of displacement amplitude (typically normalized to ear canal pressure as gain) at each location to yield maps that had the same resolution, or number of pixels per unit length in the radial direction, as the original Bscan. The resulting maps of the axial vibration patterns were overlaid on greyscale images of the Bscan to identify the anatomical location of each region of interest. These measurements took 12 – 15 minutes per set, depending on the number of positions, or slices, that were scanned and the number of amplitudes.
In a final set of four experiments, we measured vibrations in response to pure tone stimuli at three levels: 65, 75, and 85 dB SPL and two frequencies: one close the location’s BF, where the BM nonlinearity is strongest, and a second close to BF/2 where the BM responses are linear. The BF was estimated at the start of the experiment by measuring displacements over a wide frequency range in response to a 15-component zwuis complex. In these experiments, the stimuli were presented for approximately 1 second and the final displacements were averaged over 50 repetitions in the time domain.
The noise level in the vibration measurement is determined by the magnitude of the selected Ascan pixel, which depends on the feature and reflectivity (the size of the Ascan peak). In the best preparations, the noise floor could be as low as .02 – .05 nm. Noise rises if the Ascan peak is reduced, which can happen due to micrometer-scale shifts in the preparation.
Experimental Procedure
After the positioning described above we took two or three baseline measurements each consisting of a set of DPOAE-grams and vibration tuning curves. Once the baseline recordings were completed, 5 μL of 50 mM sodium salicylate in artificial perilymph (0.125 mM NaCl, 0.35 mM KCl, 25 mM NaHCO3, 1.2 mM MgCl2, 1.3 mM CaCl2, NaH2PO4, 5 mM glucose, pH 7.4) was placed onto the round window membrane and allowed to passively diffuse into the scala tympani. In most experiments, the salicylate solution was removed with a paper wick after 10 minutes and the round window membrane was washed with 5 μL of fresh artificial perilymph for 3 – 5 minutes and then dried with a paper wick. The solution was delivered with a Hamilton syringe and custom-made needle, 10 cm in length with inner and outer diameters of 250 and 360 μm, made from fused silica tubing (Polymcro Technologies). Because the excess fluid in the round window niche refracted the light from the OCT, it was not possible to take vibration recordings with the solution present. In preliminary experiments, after removing the sodium salicylate solution, some preparations showed persistent fluid accumulation in the round window space, perhaps due to the higher osmolarity of the salicyate solution. Washing the round window niche with fresh artificial perilymph reduced, but usually did not completely eliminate, this fluid accumulation. Between recordings, we checked the round window space with the operating microscope, wicked off any excess fluid, and monitored the position of the OC with ThorImage and made minor adjustments to the position of the animal’s head as needed to keep the OC approximately centered in the field of view. Some drift in the preparation was inevitable due to the long time scale, 3 – 5 hours post treatment, of the experiments. Because it was not possible to perfuse the perilymphatic spaces while simultaneously taking OCT-based measurements, we relied on the cochlea’s natural mechanisms to recover from the brief application of salicylate.
Immediately after applying the salicylate, we took a DPOAE-gram and repeated this 10 minutes later, right before the washout. The high frequency (typically above ~ f2 ~ 15–20 kHz) DPOAEs typically declined within this ten minutes indicating that the salicylate had reached the OHC bodies. In the single-line vibration experiments, we measured DPOAE-grams and OCT tuning curves after the washout and repeated the measurements every ten minutes. Because the areal vibrometery measurements took 12 – 15 minutes per set, these were instead repeated every 20 minutes. At the conclusion of the experiment, the animals were overdosed with pentobarbital and in some cases, a set of post mortem tuning curves or vibration maps were measured.
Results
A total of 28 gerbils were used in this study. Following the initial surgery and prior to the introduction of sodium salicylate into the cochlea, all ears tested showed robust 2f1−f2 DPOAE-grams in response to 50 and 70 dB SPL primaries and baseline vibrations were healthy. BM tuning curves showed a well defined peak around the location’s BF that grew nonlinearly with increased sound pressure, while responses below the BF showed linear growth. OHC-region tuning curves, measured ~ 55 – 60 μm deeper, also showed a peak near the BF, had larger amplitudes than the BM vibrations, and exhibited a wide-band nonlinearity across all frequencies tested, consistent with recent measurements of OC vibrations (Cooper et al., 2018; Fallah et al., 2019; Strimbu et al., 2020). Three animals were used for preliminary experiments, primarily to devise the surgical approach for the salicylate delivery onto the round window membrane. In four early experiments, we introduced 100 mM sodium salicylate into the round window space. In those cases, both BM and OHC-region vibrations appeared passive ~ 30 – 40 minutes post treatment and failed to recover over the timescale of the experiment, up to ~ 5 hours after the salicylate was introduced. In subsequent experiments, 50 mM sodium salicylate was used instead. We also did a control experiment, in which 100 mM glucose was added to artificial perilymph, to match the osmolarity of salicylate solution. In that case no changes were observed.
Immediately after the salicylate was applied, DPOAEs evoked by the 50 dB primaries were typically abolished above ~ f2 = 30 kHz and there was a modest drop in the levels at lower frequencies. As little as 10 – 20 minutes following the salicylate, DPOAEs were significantly reduced, with the 50 dB DPOAEs above f2 ~ 15 kHz typically falling into the noise level and substantial reduction in those evoked by the 70 dB primaries. The loss of distortion products at frequencies close to the BF of the location of interest, ~ 25 kHz, indicates that the cochlear amplifier at that location was significantly compromised.
In 11 experiments, we measured OC vibrations in a single line in a region near the intersection of the arcuate and pectinate zones and traversing the OHC region (Fig. 1 shows one Bscan with the recording region indicated). Fig. 2 shows tuning curves measured at select times during one such experiment that showed good recovery. (In the 11 experiments, a range of recovery was observed. As noted above, with 100 mM salicylate, recovery was not observed, and observing a range of recovery with the 50 mM salicylate is probably due to both differences in the diffusion of salicylate into the scala tympani, and the particular physiological state of the individual cochleae.) The top row shows a set of baseline tuning curves measured in response to the 40-frequency component zwuis complex. Fig. 2 A and B show the BM and OHC region vibration sensitivity or gain, in nm/Pa, and panel C shows the phase in cycles, referenced to the ear canal pressure. In these and other figures, the BM tuning curves are shown in blue, and the OHC-region tuning curves are shown in orange with darker shades denoting higher SPLs. Both sets of tuning curves show a well defined peak at the BF, around 27 kHz in this cochlea, and OHC-region amplitudes that can be ~ 10× greater than the BM at lower SPLs. (BF is defined as the peak frequency at the lowest SPL measured, 40 or 50 dB SPL.) The BM tuning curves show nonlinear growth within the BF peak and linear growth for frequencies well below the BF while the OHC region shows a compressive nonlinearity at all frequencies tested. 20 minutes post treatment both BM and OHC-region show depressed amplitudes and a loss of the BF peak. The BM vibrations resembled those of a passive or post mortem cochlea, showing linear growth at all frequencies and levels. The OHC region vibrations showed little-to-no measurable responses around the 27 kHz BF and generally depressed amplitudes. They retained the wide-band nonlinearity, although at the lower stimulus levels (to 60 dB SPL) the responses became almost linear, perhaps due to the smaller response amplitudes compared to baseline. Around 50 minutes post treatment, vibration amplitudes began to show steady improvement and a gradual re-emergence of the BF peak. These improvements progressed over subsequent recordings and by 220 minutes the responses were essentially fully recovered. (The BM responses are less clear, due to an elevated noise level at the BM pixel compared to the original measurements.) At further times, there was no further improvement, as shown for the BF in the summary plots in the final row of the figure. The phase (panels C, F, I, L) was not substantially affected by the salicylate, and we emphasize the amplitude variations in this report. The last panel, O, shows a heat map plot of the changes in DPOAEs evoked by the 50 dB primaries before and after salicylate. In general, the recovery of the DPOAEs following salicylate was reasonably correlated with the recovery of the vibration amplitudes and tuning.
Figure 1:

A. Bscan from experiment #846, 11-12-2020. Arrows show the beam direction, which defines the direction of vibration measurement. B. Bscan labeled and colored to identify significant components and landmarks. The single red arrow in A represents a single-line measurement from the first set of experiments, in which vibrations of structures along a single Ascan line that included the OHC region were measured. The multiple arrows in A represent the motion mapping of the second set of experiments, in which vibrations of structures along several Ascan lines were measured, and subsequently presented as heat maps of vibration amplitude.
Figure 2:
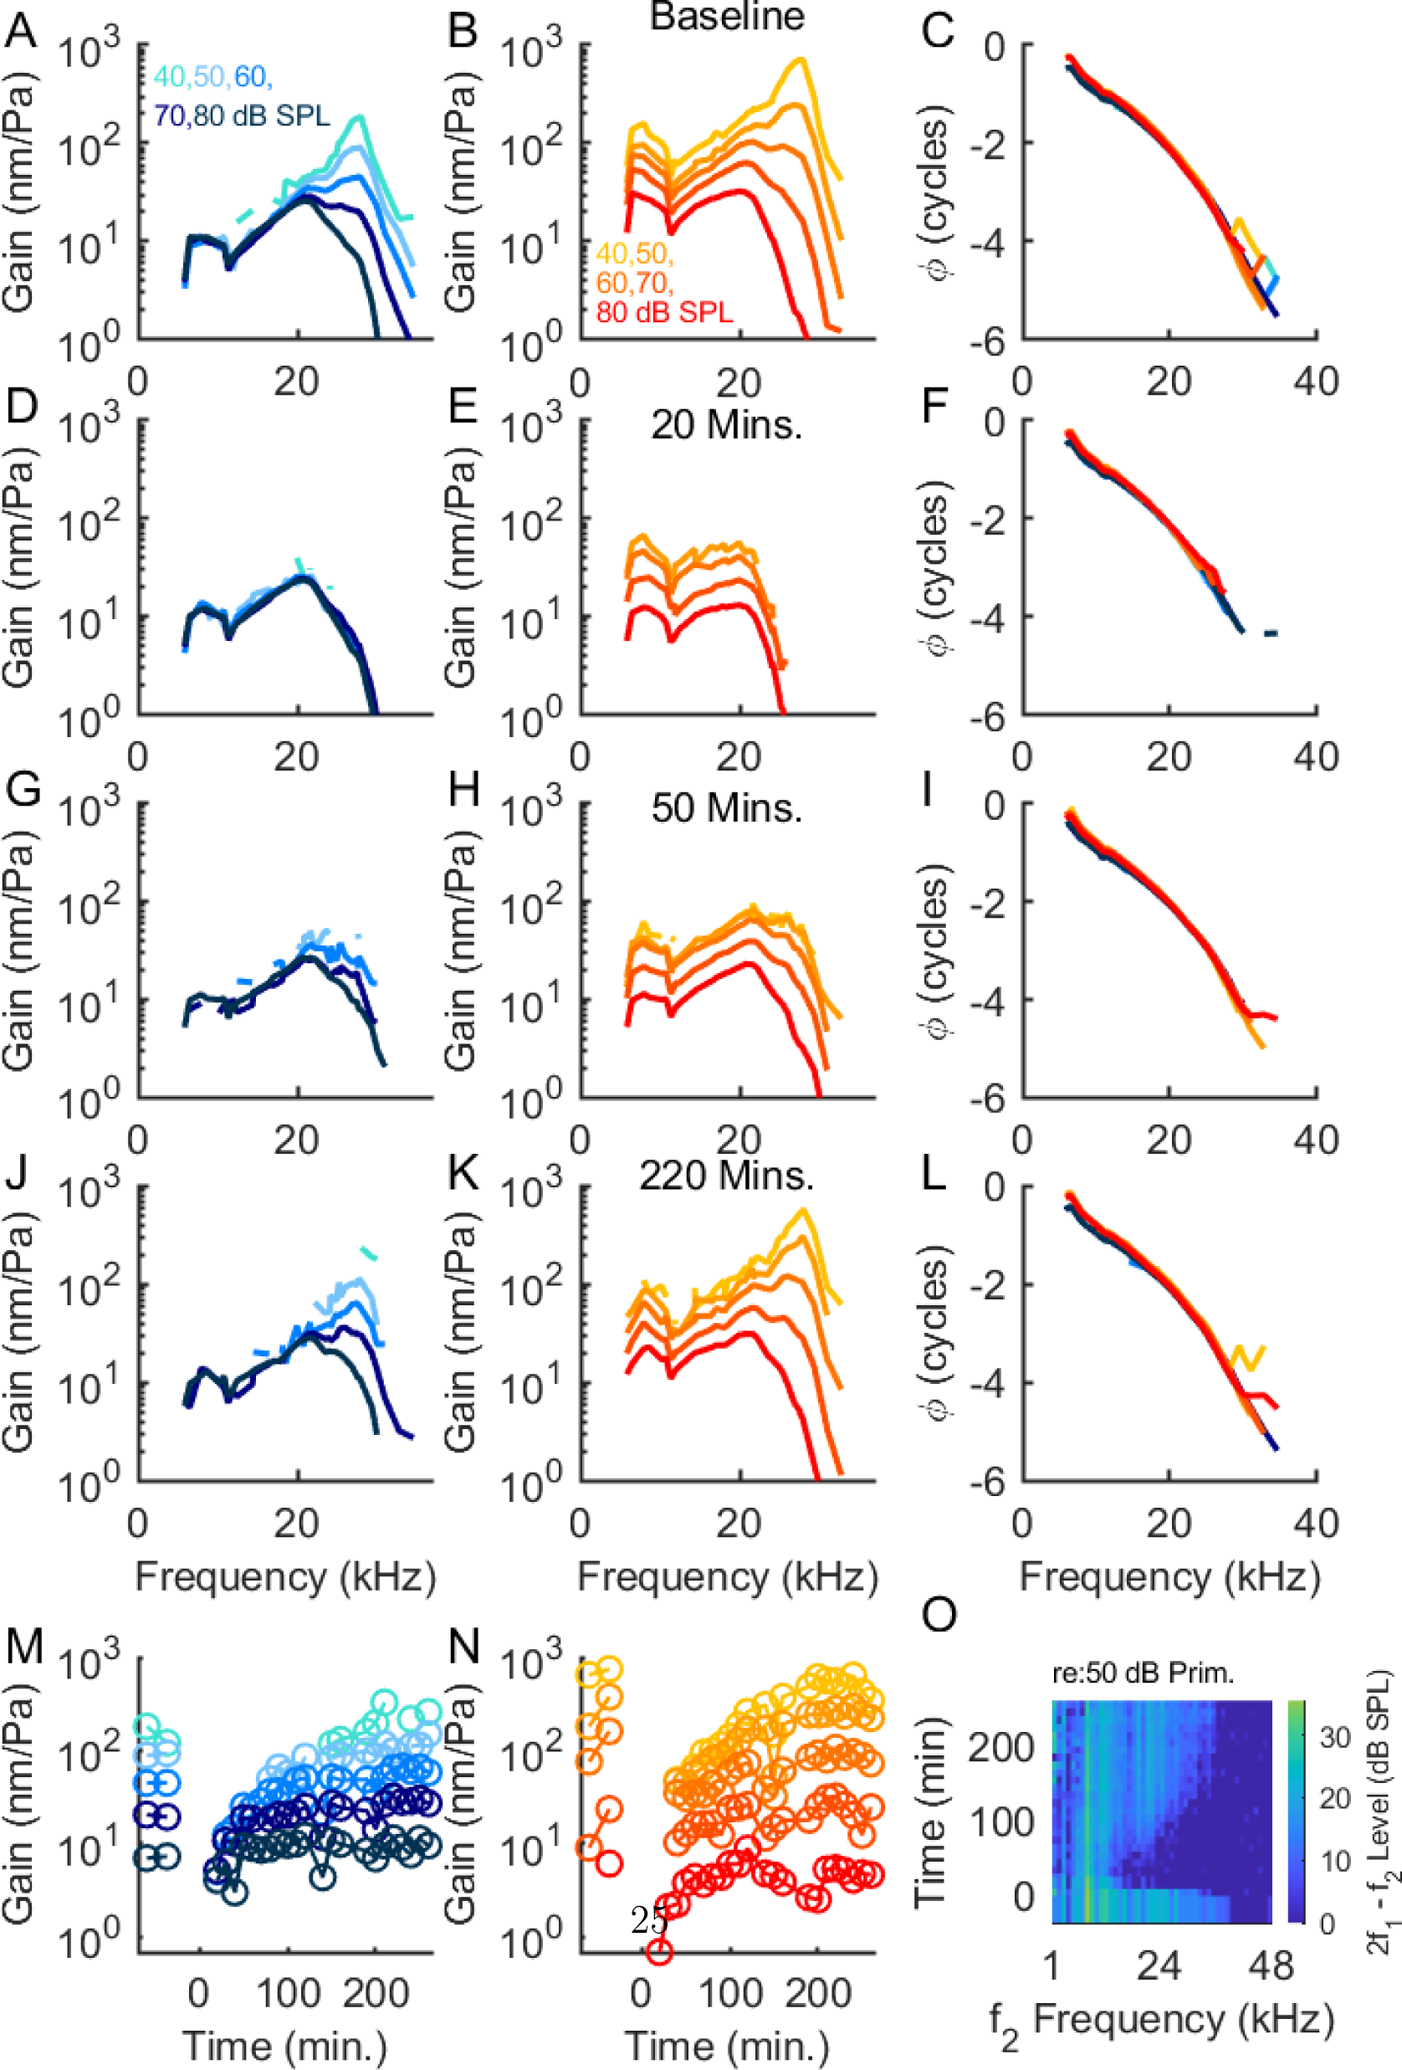
Loss and recovery of cochlear amplification following salicylate. The top row (panels (A) – (C)) shows baseline tuning curves measured before the application of salicylate. In this and all subsequent figures, time t = 0 corresponds to the application of the sodium salicylate onto the round window membrane. Panel (A) shows the BM tuning curves which are plotted in shades of blue and (B) shows OHC-region, ~ 50 – 60 μm deeper in the OC, in shades of orange. Darker shades indicate higher SPLs (key in top panels). Panel (C) shows phase referenced to ear canal pressure. (D) – (F) show the gains and phases 20 minutes after salicylate application. The BM responses resemble those of a passive cochlea, while the OHC responses retained wide-band nonlinearity but lost the BF peak. Around 50 minutes post treatment, panels (G) – (I), BM and OHC-region vibrations began to recover and at around 220 minutes (J) – (L) the responses had largely recovered to baseline levels. (M) and (N) summarize the gains at the BF for the BM and OHC-region and the heat map plot in panel (O) shows the drop and subsequent recovery of the 2f1 − f2 DPOAEs evoked by the 50 dB SPL primaries. The DPOAE level is indicated by the colorbar at the right and the times are on the vertical axis. Experiment #846, 11/12/2020.
In the second set of six experiments we mapped vibration patterns by taking successive Mscans at 13 – 17 radial locations in 10 μm steps, or slices, across the OC. The axial direction (of the OCT light beam) was the same for all slices, so the direction of the vibration measurement is the same, and is the vertical direction in the maps (Fig. 1). Because of the large number of recordings, we used a shorter experimental window, ~ 1 second of OCT recordings rather than the ~ 5 seconds used for the single axis measurements. Because these shorter recordings have a lower signal to noise ratio (limiting the ability to measure vibrations at the lowest SPLs) and to reduce the total number of scans, these experiments only ran from 50 or 60 to 80 dB SPL. Fig. 1 shows an initial Bscan from one such experiment. In this and some other preparations the tectorial membrane (TM) is visible and the inner spiral sulcus can be clearly delineated. The RL, a thin, stiff lamina that is continuous with the apical surface of the hair cells and runs between the inner sulcus and the lateral cells, is also visible in this image. (We use the term “lateral cells” to refer to the region adjacent to the outer tunnel composed of Hensen, tectal and lateral tunnel cells (Spicer et al. (2003)).)
Representative heat maps are presented in Figs. 3, 4, 5, 6. The color-coded heat maps of the vibration patterns were overlaid on greyscale Bscans. In the E panels, the position of the pillar cells is approximated, and by referring to Fig. 1, the location of other landmarks can be identified. In each of the heat-map figures, the top row shows the loss and recovery of DPOAEs at both stimulus levels and the right-hand panel shows the mean (solid line) and standard deviation (shaded region) of three DPOAE bins around f2 ≈ 20 kHz. The heat maps in Figs. 3, 4, 5, 6 panels (D) – (F) show vibration amplitudes at three frequencies (the highest frequency shown corresponds to the BF) and the two highest SPLs (70 and 80 dB SPL). (At lower SPLs many regions in the Bscan heat maps would not emerge from the noise; in order to see the vibration patterns the relatively high SPLs were used. Tuning curves extending to lower SPL are shown in separate figures.) The colorbars at the far right apply to all maps in the set. Regions with the largest vibration amplitudes – within two standard deviations of the maximum – are outlined in white to visualize vibration patterns.
Figure 3:
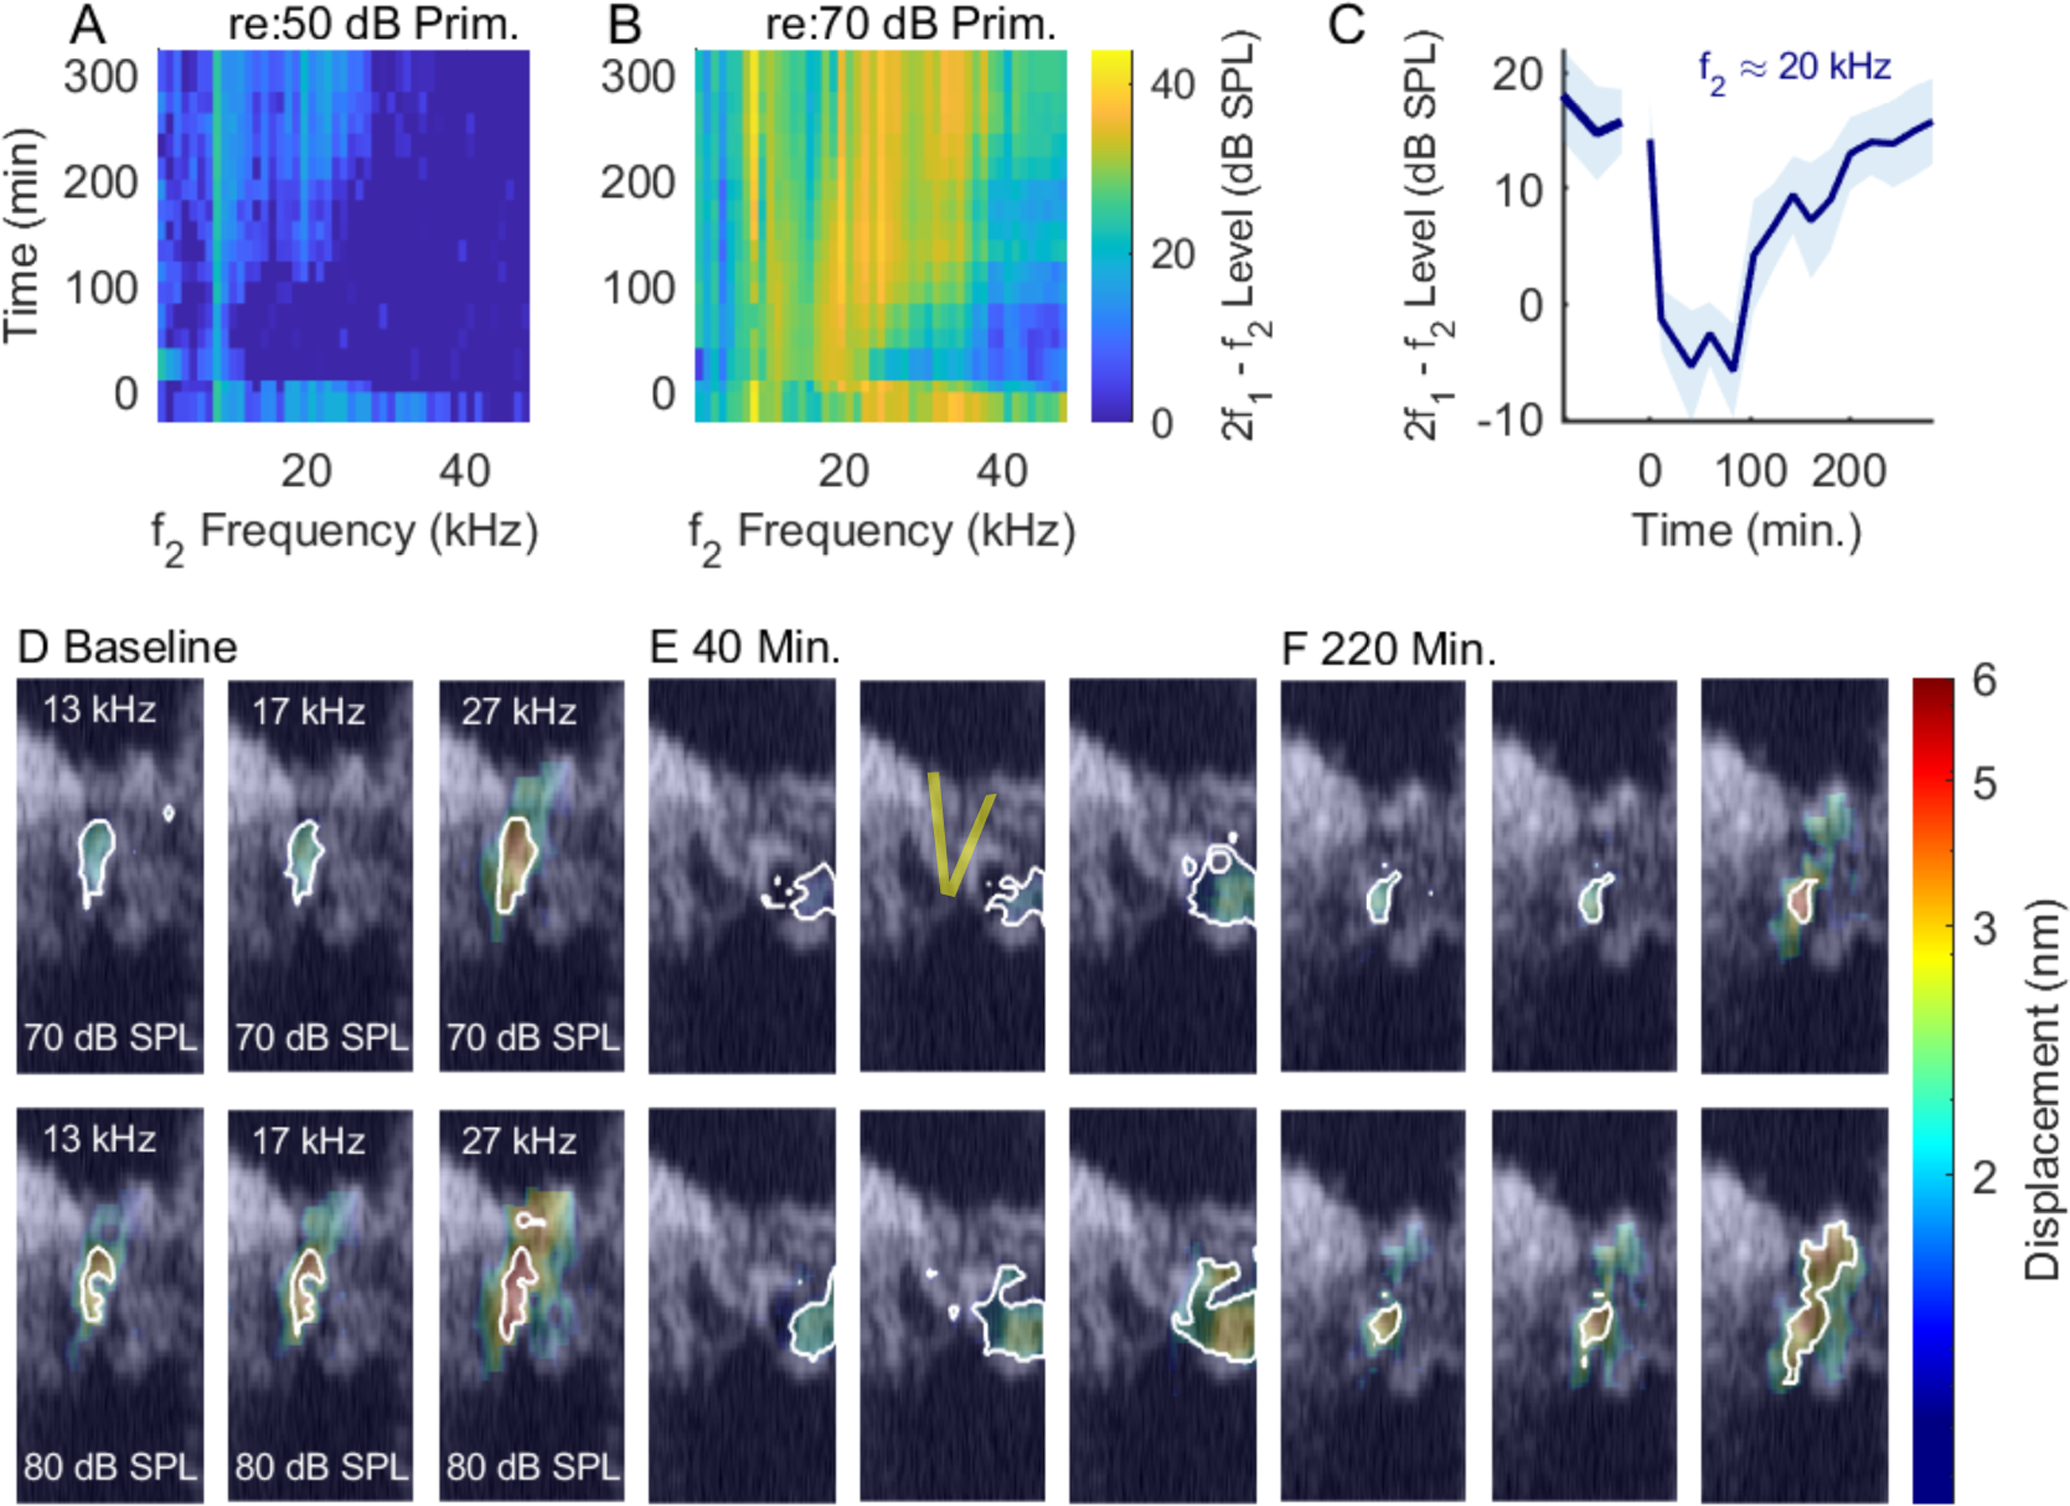
Areal vibration patterns before and after salicylate treatment. Panels (A) and (B) show the loss and recovery of DPOAEs evoked by 50 dB (A) and 70 dB SPL (B) primaries after salicylate was applied. Panel (C) shows the time course of the f2 ≈ 20 kHz, DPOAE evoked by 50 dB SPL primaries. This is plotted as the mean (solid blue line) and standard deviation (shaded region) measured from three adjacent f2 frequencies, ≈19 – 21 kHz. The individual panels in (D) show heat maps of the vibration patterns in a 160 μmwide region of the OC overlaid on the structural Bscan. Pixels whose amplitudes were less than three standard deviations above the noise floor were assigned a value of 0, and appear as transparent in this and subsequent figures. Three frequencies, and the two highest SPLs are shown as labeled in the baseline panels at the left. The highest frequency shown (27 kHz) was the peak frequency for 50 dB SPL stimulation. The colorbar at the right applies to all the vibration maps. Regions of highest vibration, within two standard deviations of the maximum amplitude of each panel, are outlined in white to indicate the main vibration pattern. (E) and (F) show the same regions at later times: 40 minutes post treatment and 220 minutes post treatment, when the vibrations reached their best recovery. The location of the pillar cells is schematized in (E). After salicylate, the vibrations were not as tightly contained around the OHC-region and at 40 minutes, structures lateral to the OHCs show the largest vibrations. Experiment #855, 12/15/2020.
Figure 4:
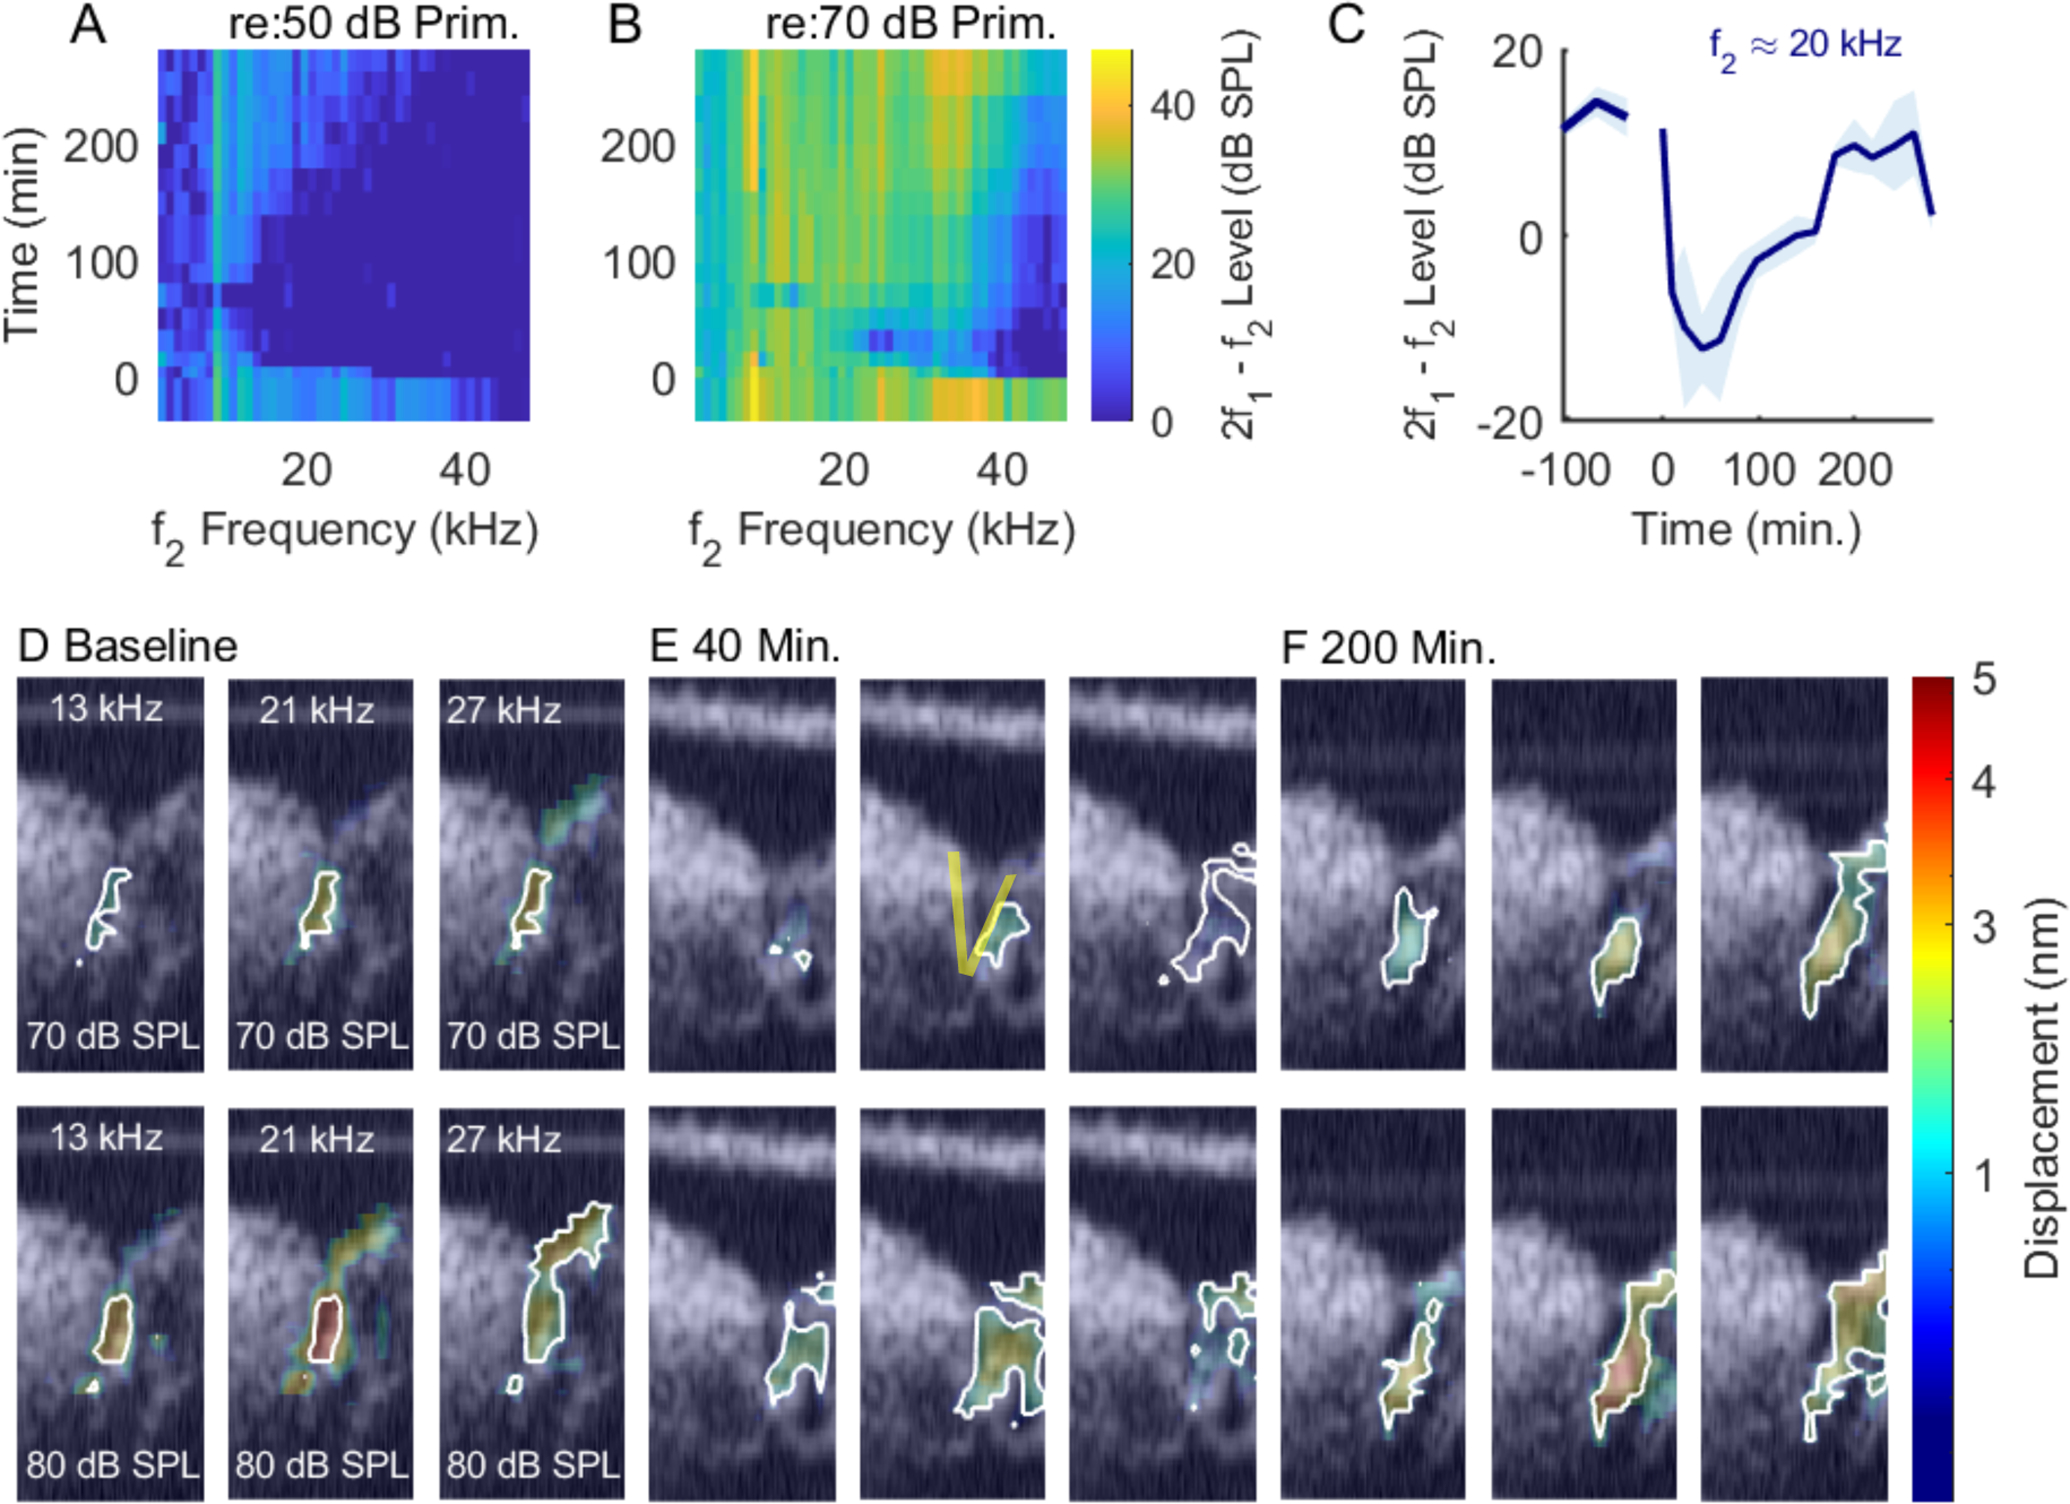
Similar to the previous figure. This preparation exhibited its fullest recovery at 200 minutes post treatment. Experiment #878, 3/19/2021.
Figure 5:

Similar to the previous figures. This experiment showed poor recovery in the DPOAEs and the vibrations. Experiment #859, 1/12/2021.
Figure 6:
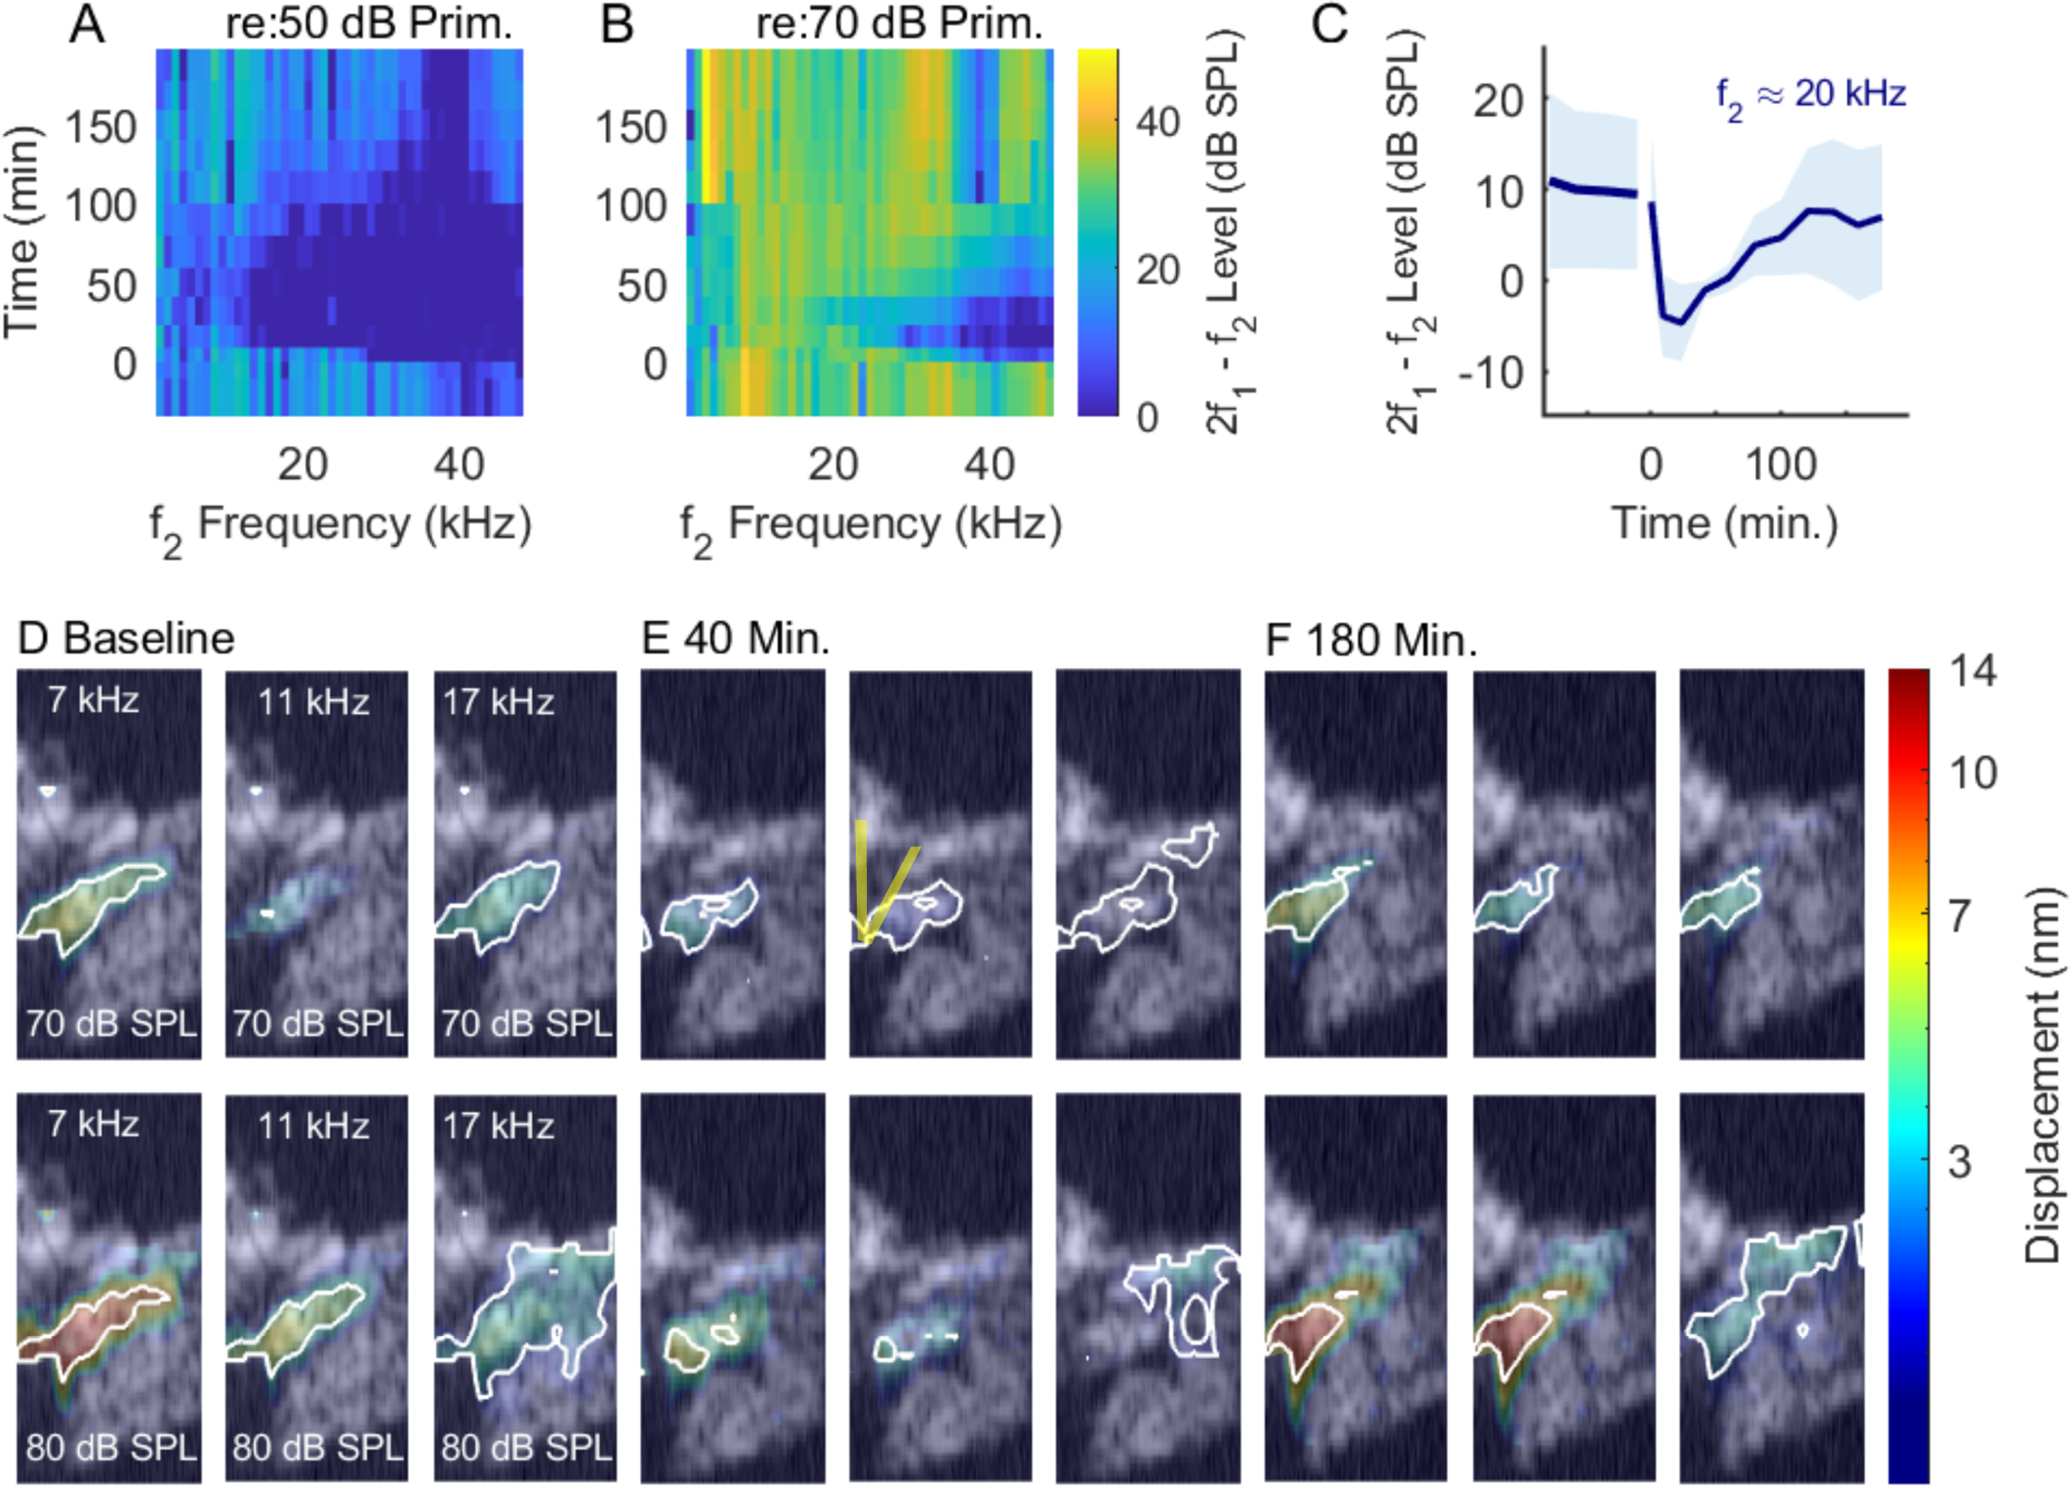
Similar to the previous figures, but in this preparation data were taken from a lower frequency location, BF ~ 20 kHz. Post-salicylate the responses were low-pass in this experiment, so the highest frequency shown (17 kHz) is slightly lower than the BF. Likely due to viewing further down the cochlear spiral in this preparation, the Bscan image is somewhat different from the Bscans in the other experiments. Experiment # 884, 4/15/2021.
Prior to the salicylate treatment, the vibration patterns showed a stereotypical pattern in which the largest amplitudes are relatively confined in an oblong region including OHCs and extending to the BM at the outer pillar foot. Following the salicylate treatment, there was a general decline in amplitude and also qualitative changes in the shape of the vibration patterns. At 40 minutes, structures lateral to the OHCs showed greater motion than the OHC region itself, albeit at lower amplitudes than the baseline conditions. In preparations with good recovery, the vibration patterns returned approximately to baseline conditions by ~ 3 hrs. Fig. 9 shows tuning curves measured at three points from the experiment of Fig. 3, with the BM position in blue, OHC-region in orange, and a position close to the RL in red. As noted above, the RL extends from the inner sulcus to the lateral cells, and the data denoted “RL” in our presented tuning curves was typically from a slice 10 – 20 μm medial from where OHC-region measurements were made. Panel F in Fig. 9 includes tuning curves, plotted in grey, measured 20 μm lateral to the OHC region at a time point 20 minutes after salicylate was introduced, when the lateral region showed significantly higher amplitudes than what we usually identify with the OHC-region, adjacent to the outer pillar cell. 20 minutes post salicylate, all three regions showed the characteristic loss of amplitude and tuning. Tuning curves at the three regions of interest (RL, OHC, BM) are shown for the experiments of Figs. 4, 5 and 6 in Figs. 10, 11 and 7, respectively.
Figure 9:
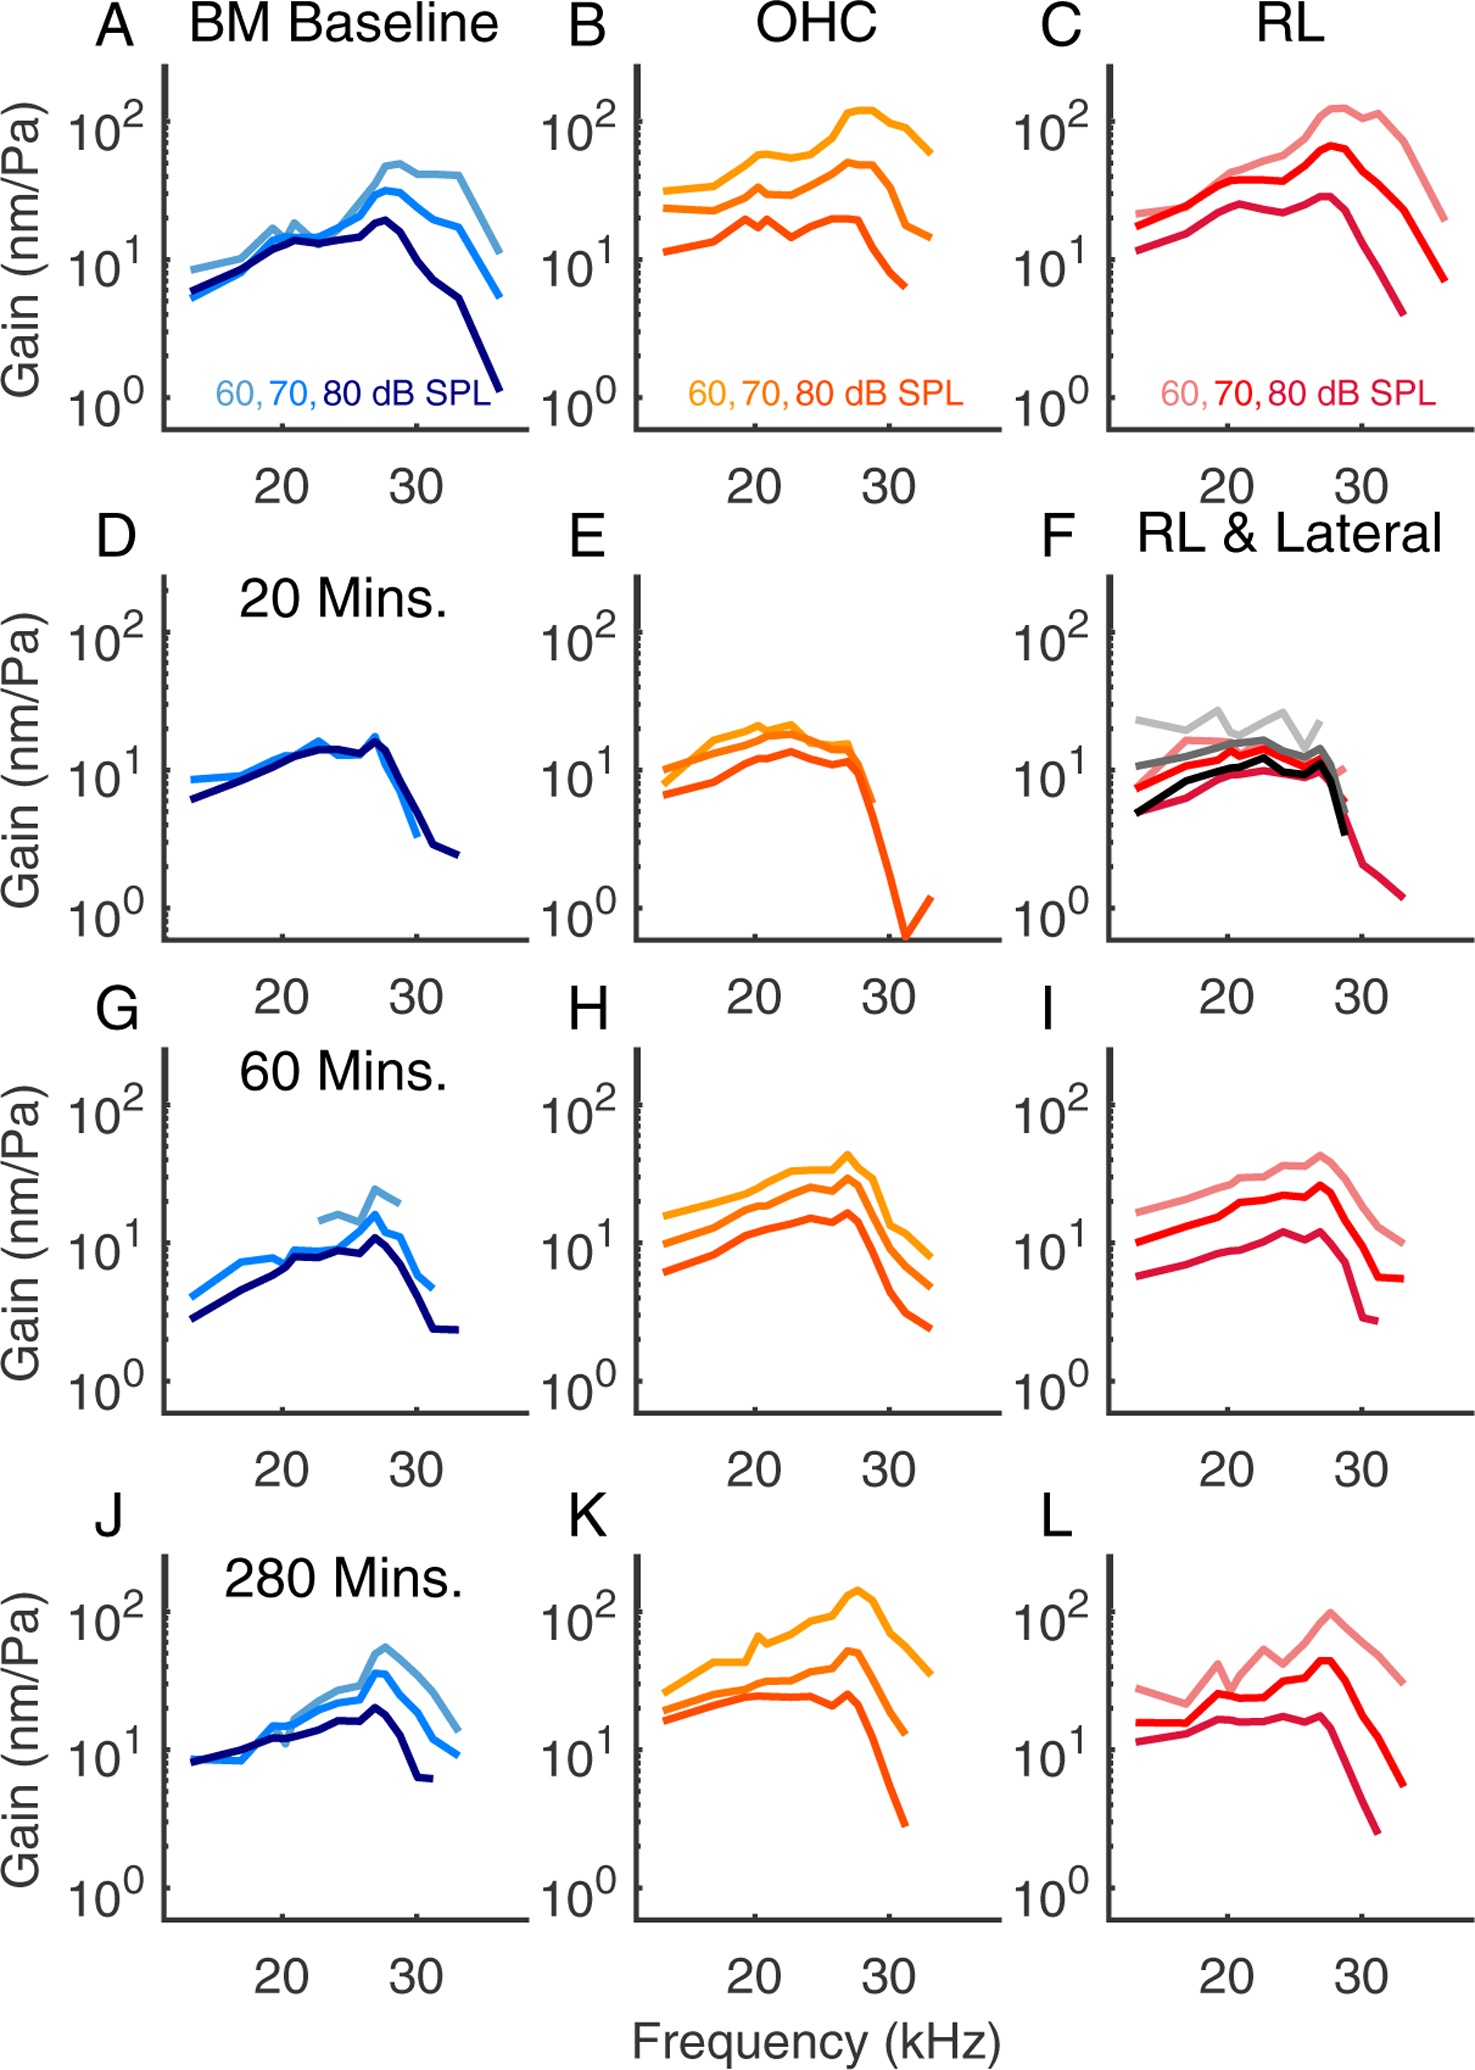
Tuning curves from the same preparation as Fig. 3, experiment #855. In panel (F), the tuning curves measured 20 μm lateral to the OHCs are plotted in shades of grey, with darker shades indicating higher SPLs.
Figure 10:
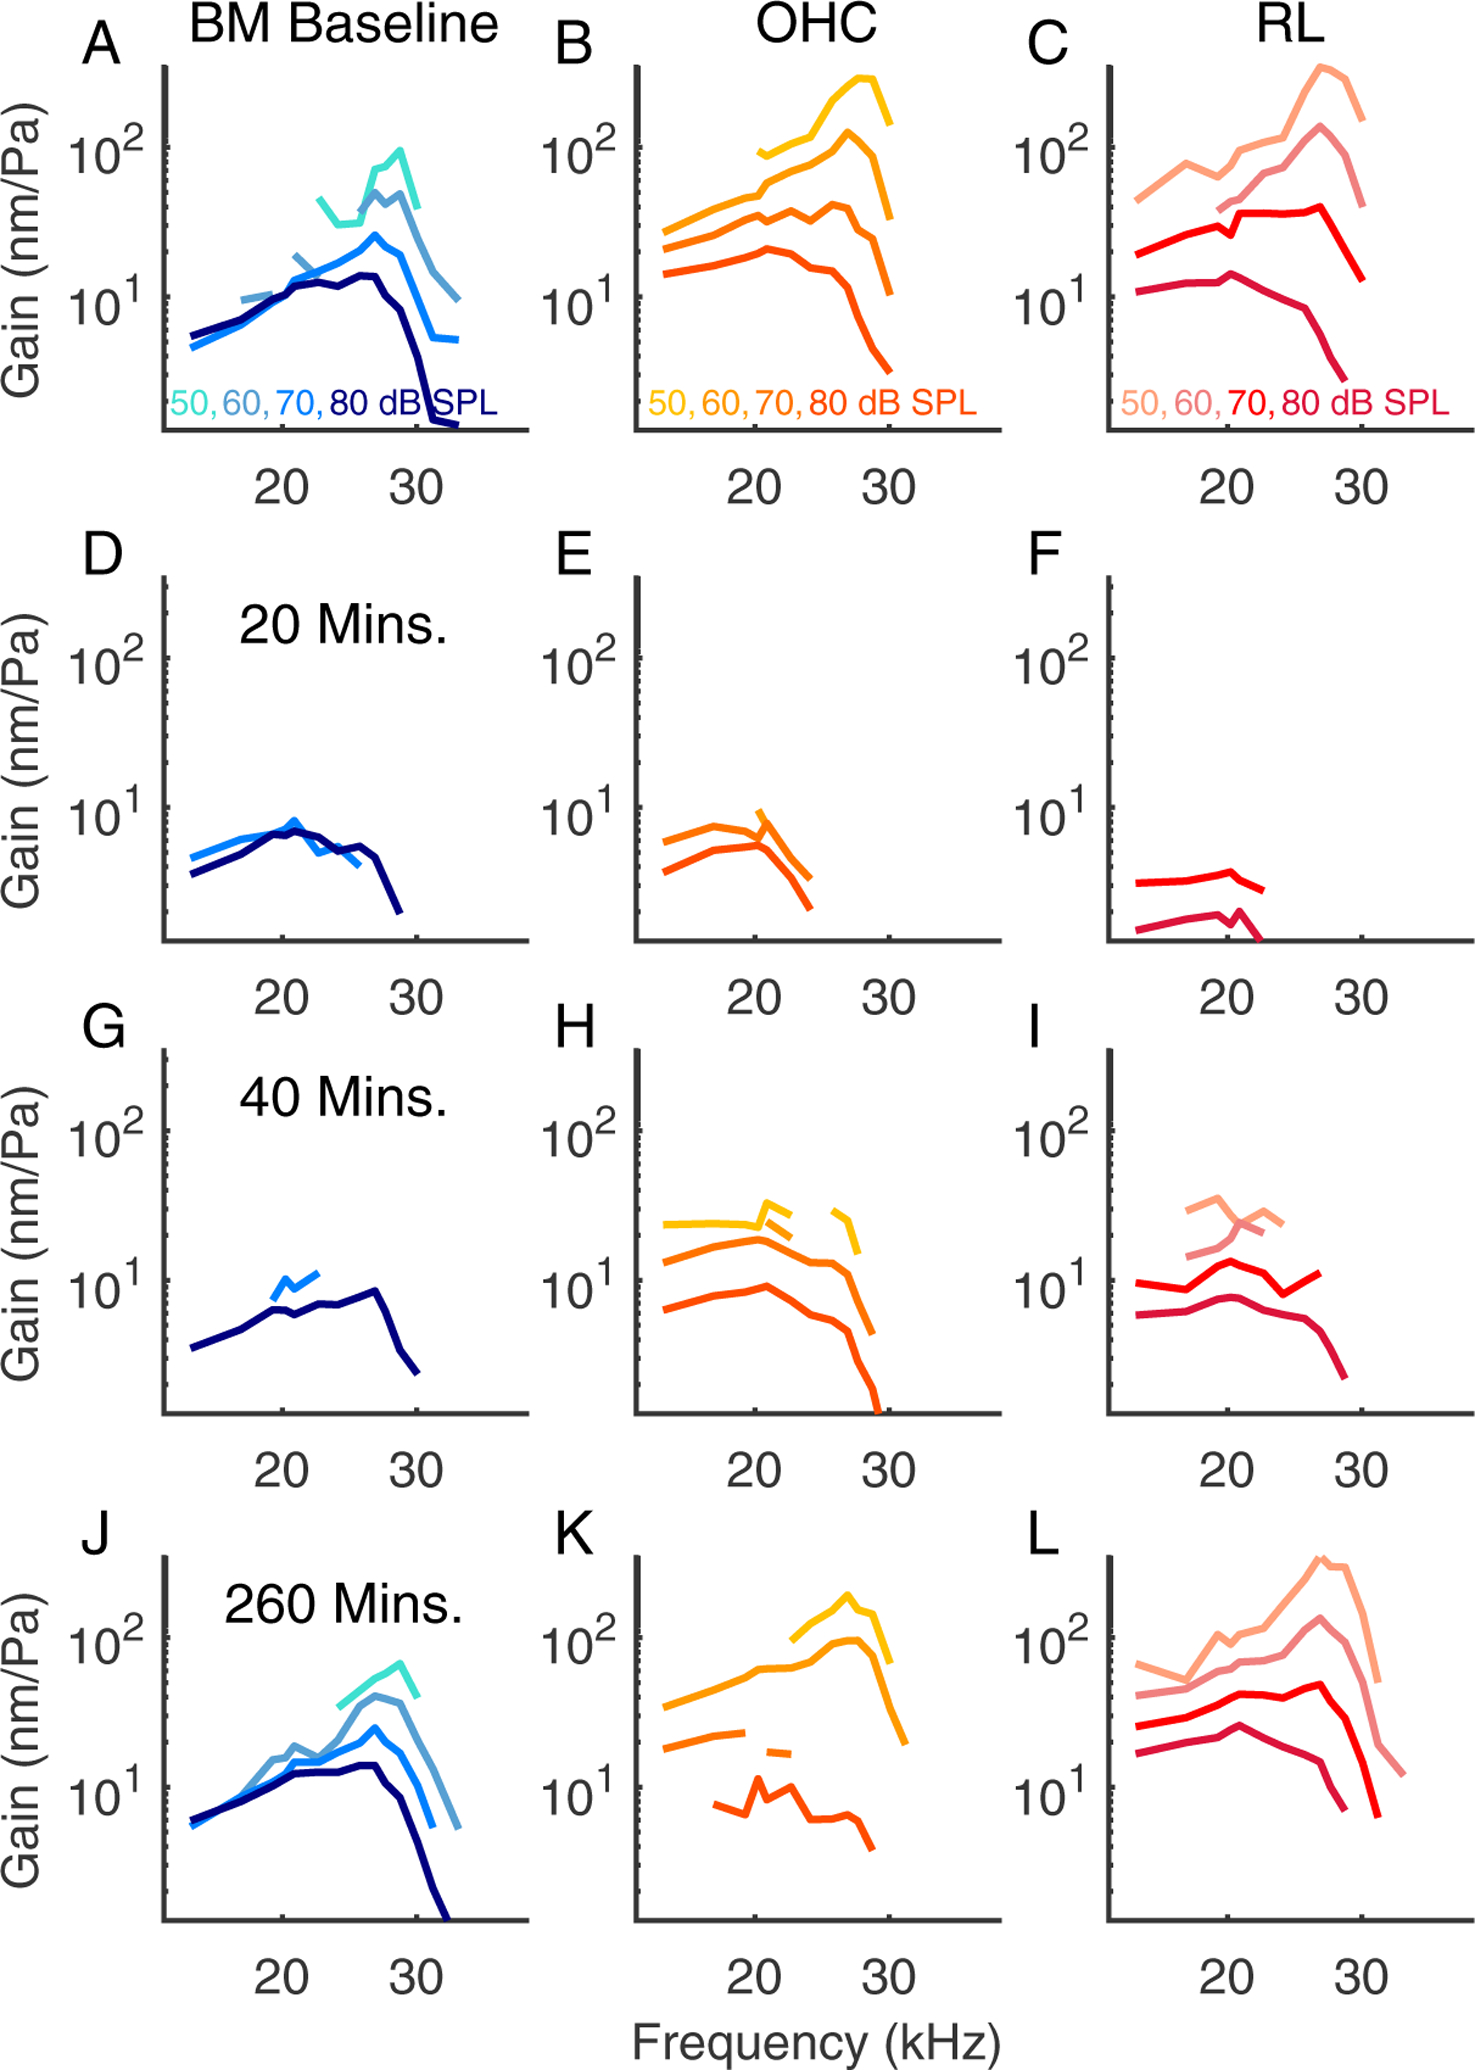
Tuning curves from the same preparation as Fig. 4, experiment #878.
Figure 11:
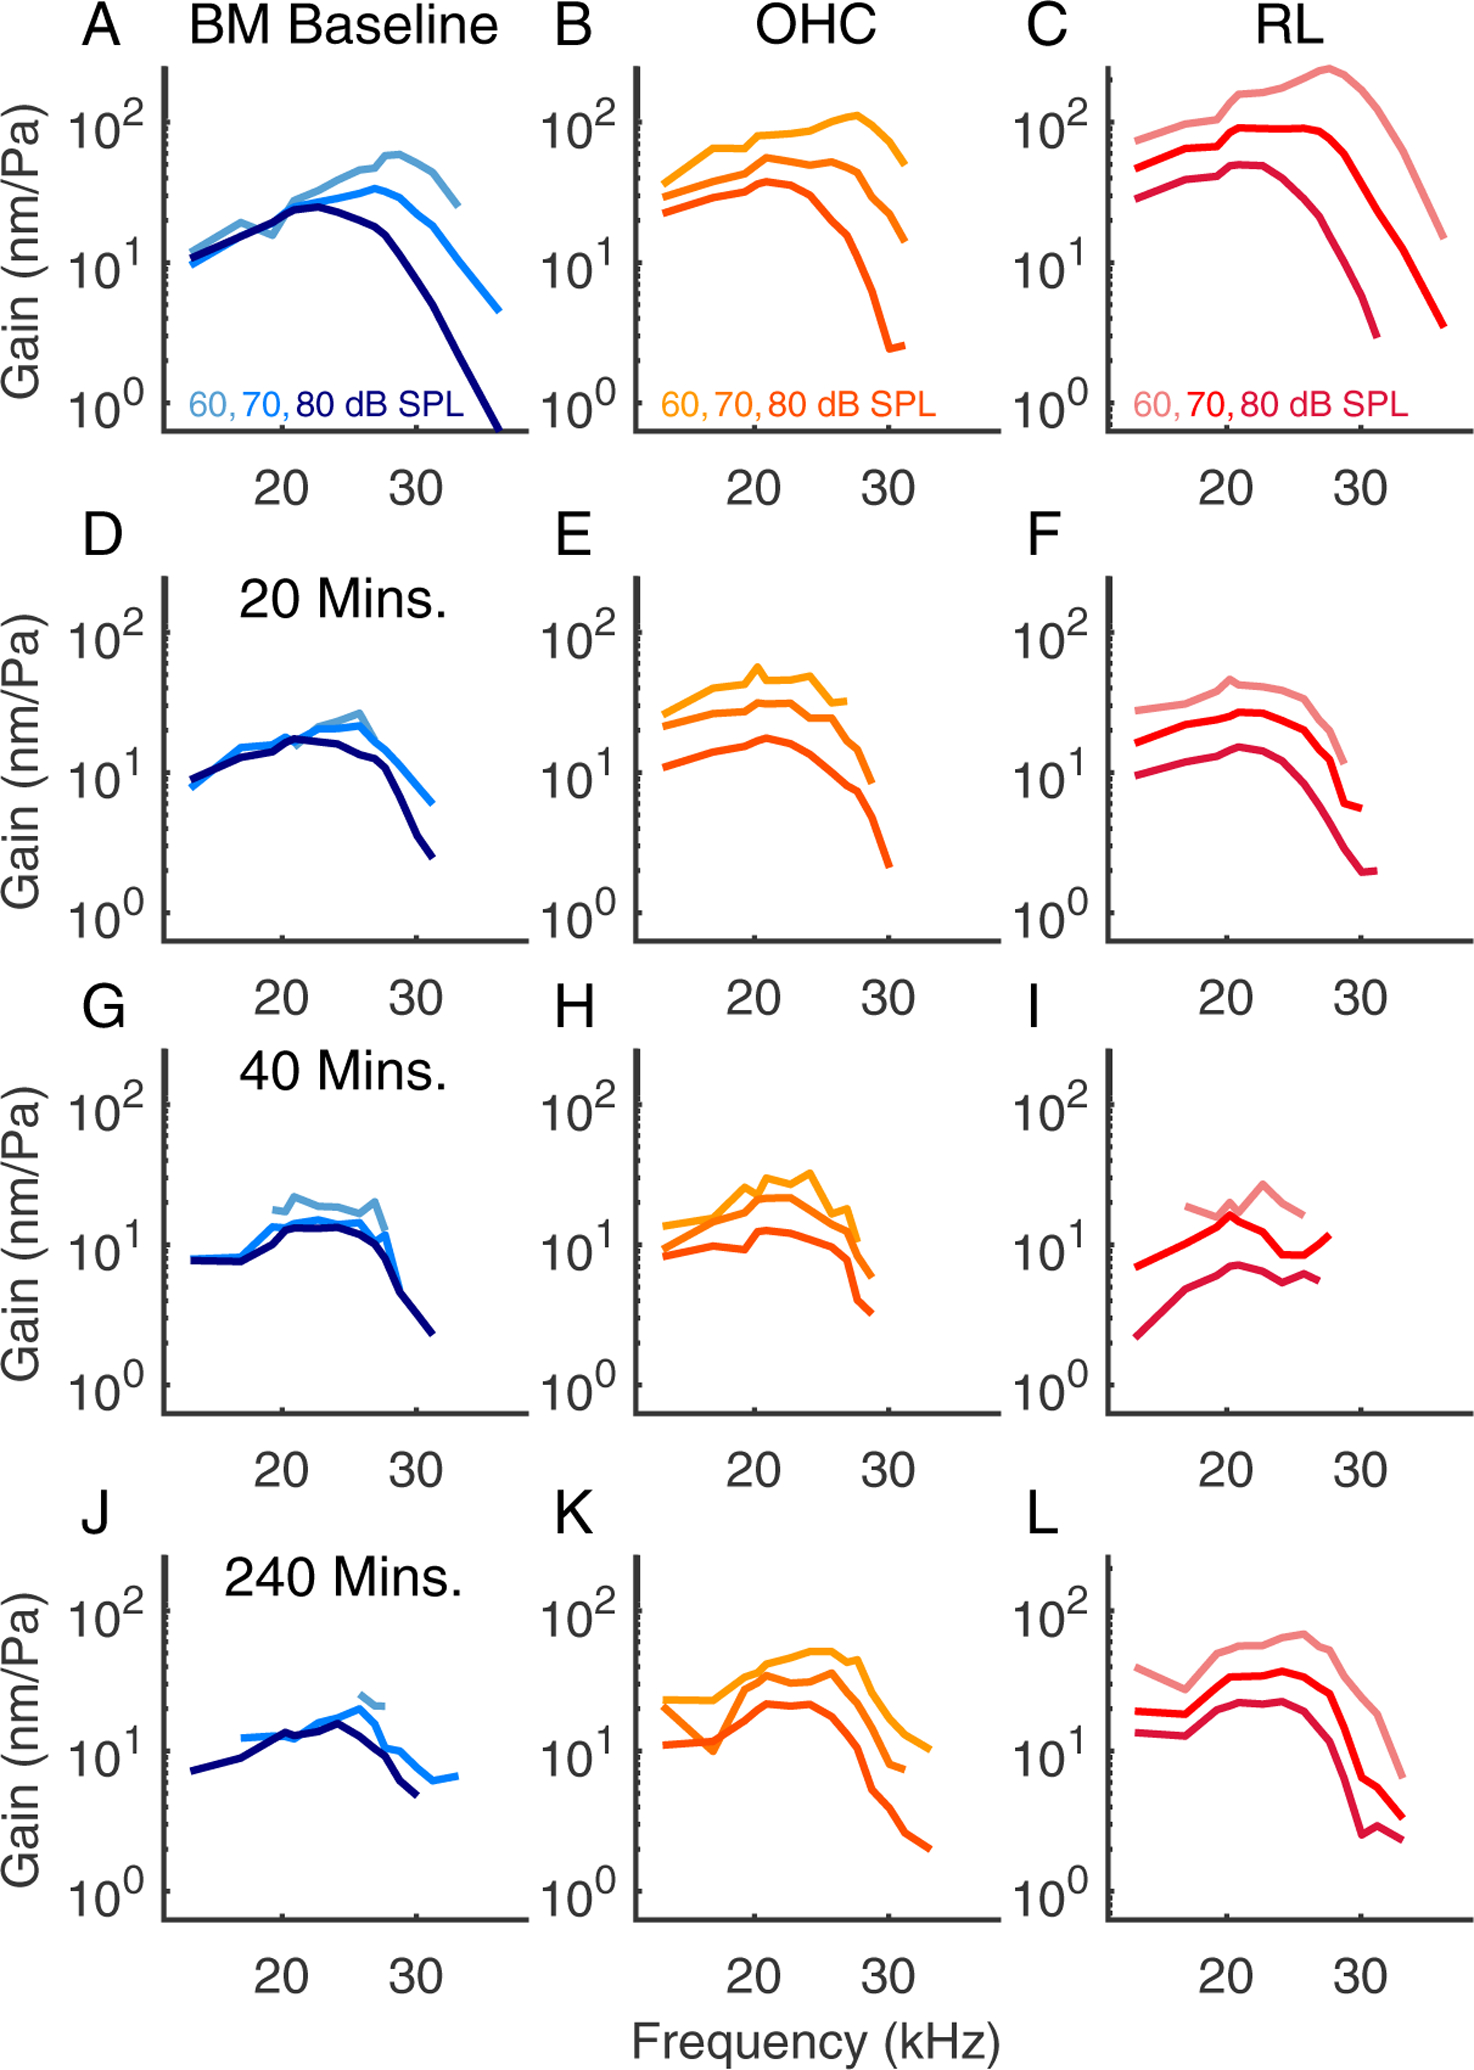
Tuning curves from the same preparation as Fig. 5, experiment # 859. This cochlea did not recover following salicylate application.
Figure 7:
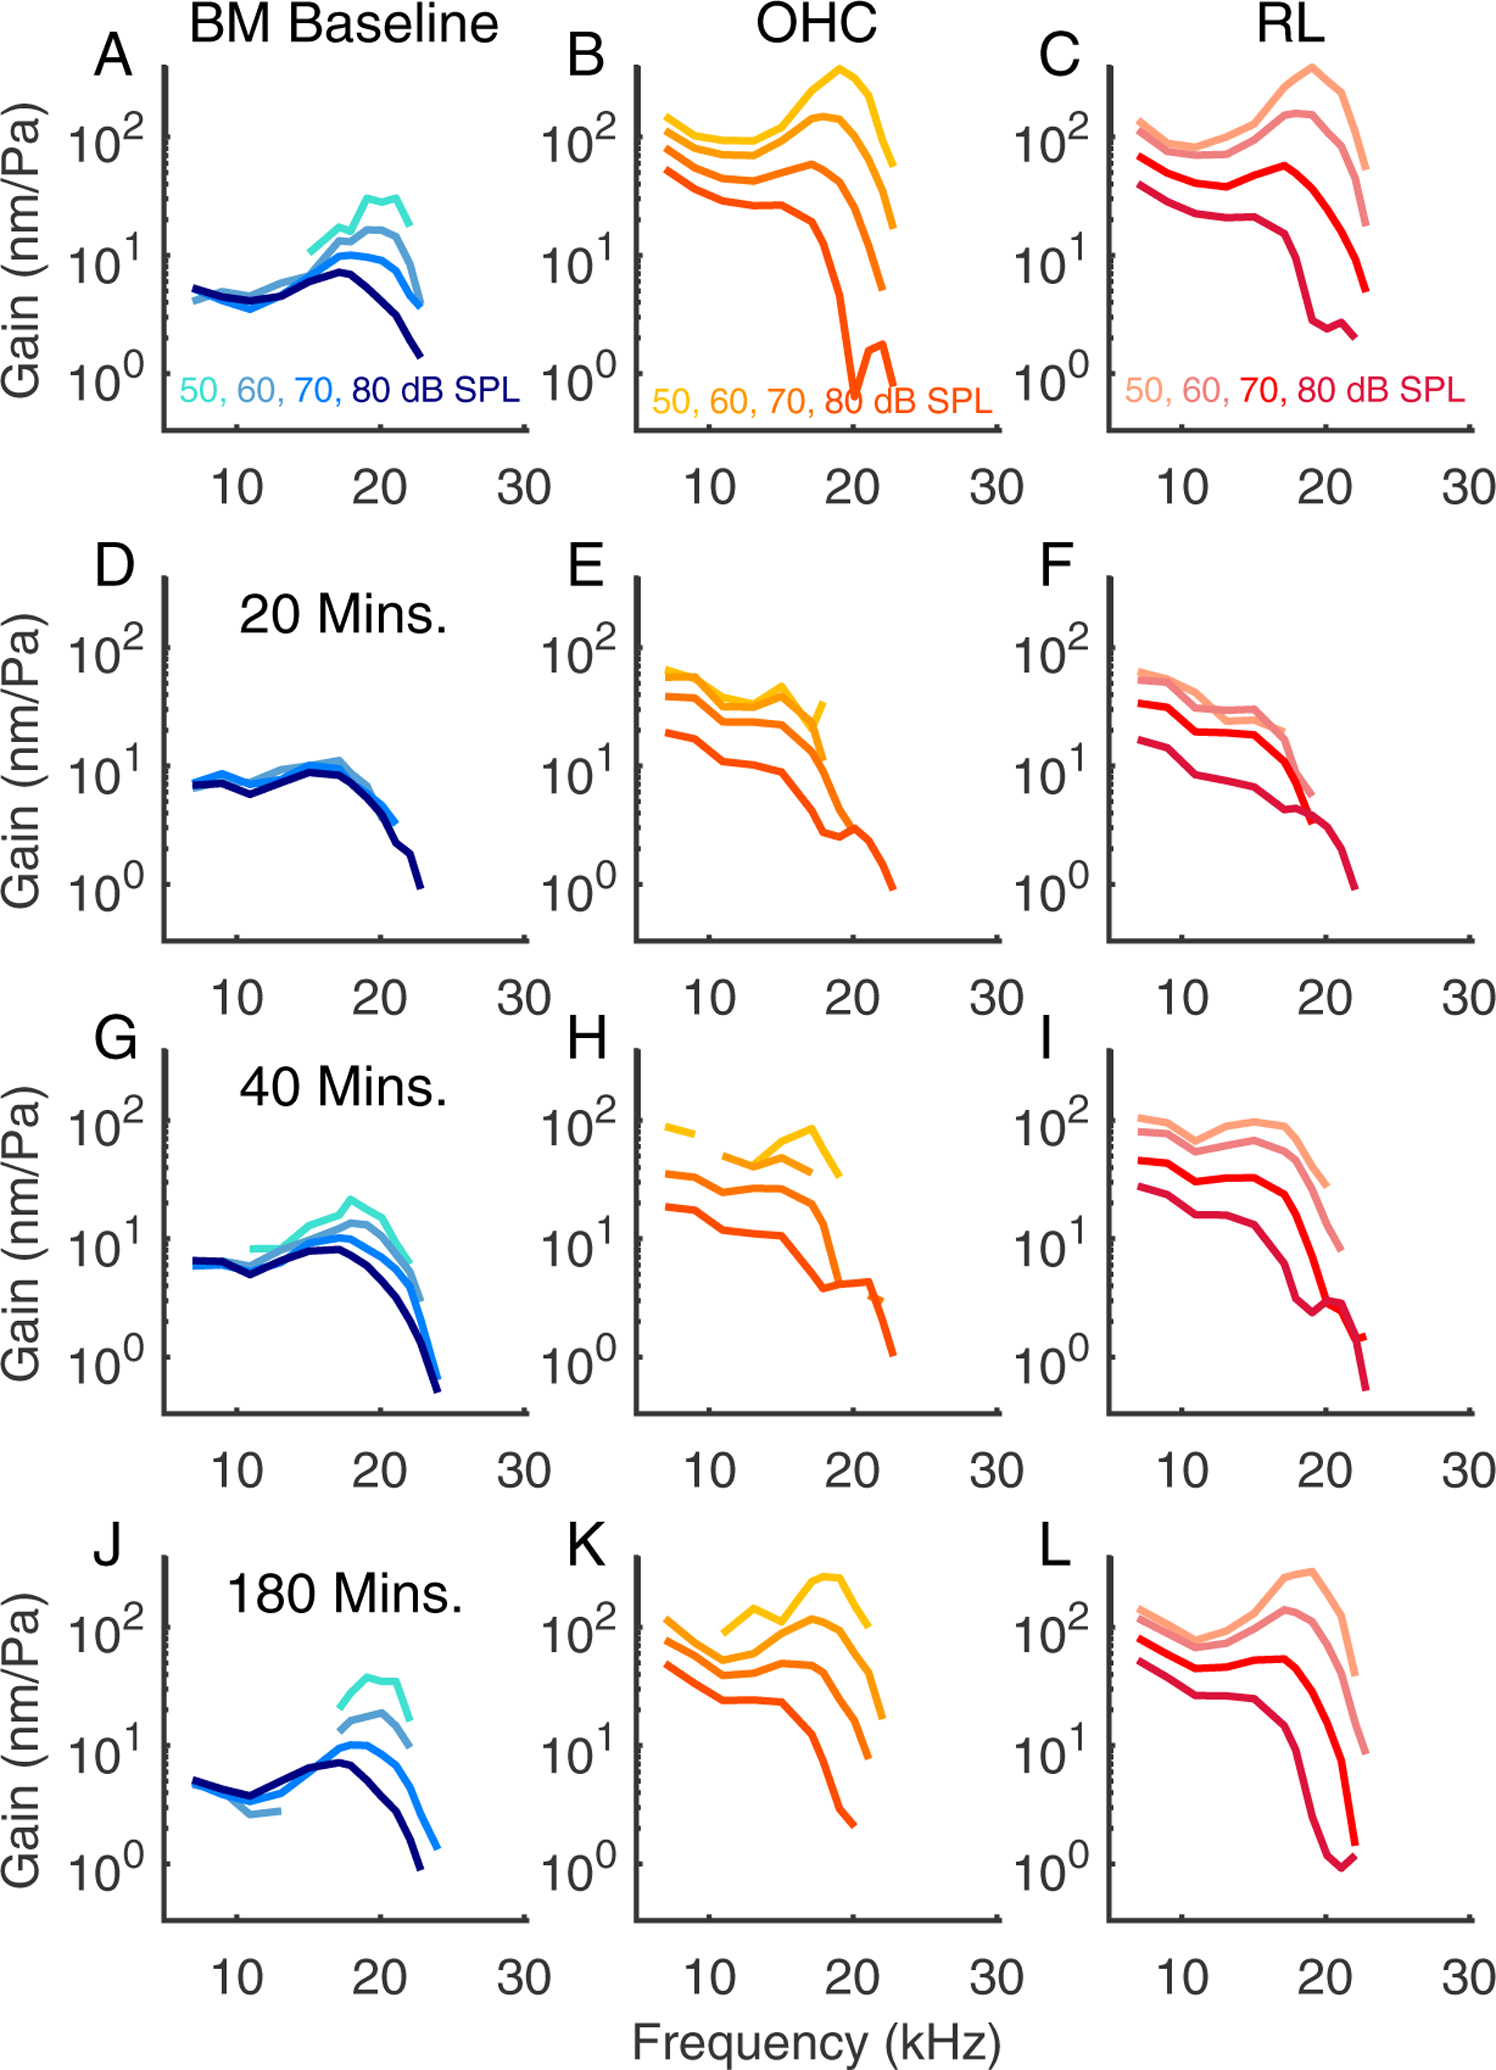
Individual tuning curves recorded from three regions of interest at different times before (top row) and after application of salicylate (three subsequent rows). Same preparation as Fig. 6, experiment #884. The reticular lamina vibrations, labeled RL, were measured at the most medial location along the RL from which we obtained reliable sets of tuning curves, 10 μm medial to the BM/OHC-regions. Refer to Fig. 8 for the locations of the RM, OHC-region, and RL.
Fig. 7 shows a preparation where data were recorded from a slightly more apical location with a BF around 20 kHz. The BM vibrations at the 20 minute mark appeared passive (panel D) while the OHC and RL-regions had responses that retained their wide-band nonlinearity but were low-pass in character. At the relatively low SPLs of 50 and 60 dB the OHC and RL responses were approximately linear at the 20 minute mark, perhaps because of the smaller response amplitudes compared to baseline. In this experiment, although the response to salicylate was robust, the BF peak re-emerged more quickly, around the 40 minute mark, and in general the vibrations recovered more quickly than in other experiments.
Fig. 8 shows a summary of the data from the experiment of Figs. 6 and 7. Panel (A) shows a Bscan, which for clarity has been drawn stretched in the radial direction. The dashed vertical lines show the locations at which the Mscans were recorded – to avoid clutter only the odd numbered Mscans are labeled and the color-coded circles and diamonds indicate the location of BM, OHC-region, and RL-region. Panels (B) – (D) show the BM, OHC-region, and RL amplitudes at different times. Amplitudes at two points along the BM and within the OHC-region are shown, as indicated by the color- and symbol-coded plots. OHC and BM vibrations are shown from two slices to indicate that the particular slice of measurement did not have a substantial effect on the observations. OHC and RL regions recovered nearly monotonically and smoothly in this experiment; the BM recovery showed a degree of non-monotonicity at ~ 100 minutes, but this was not a general feature of the data (for example it was not observed in the summary panel of Fig. 2M). All regions had essentially full recovery by ~ the 150 minute mark.
Figure 8:
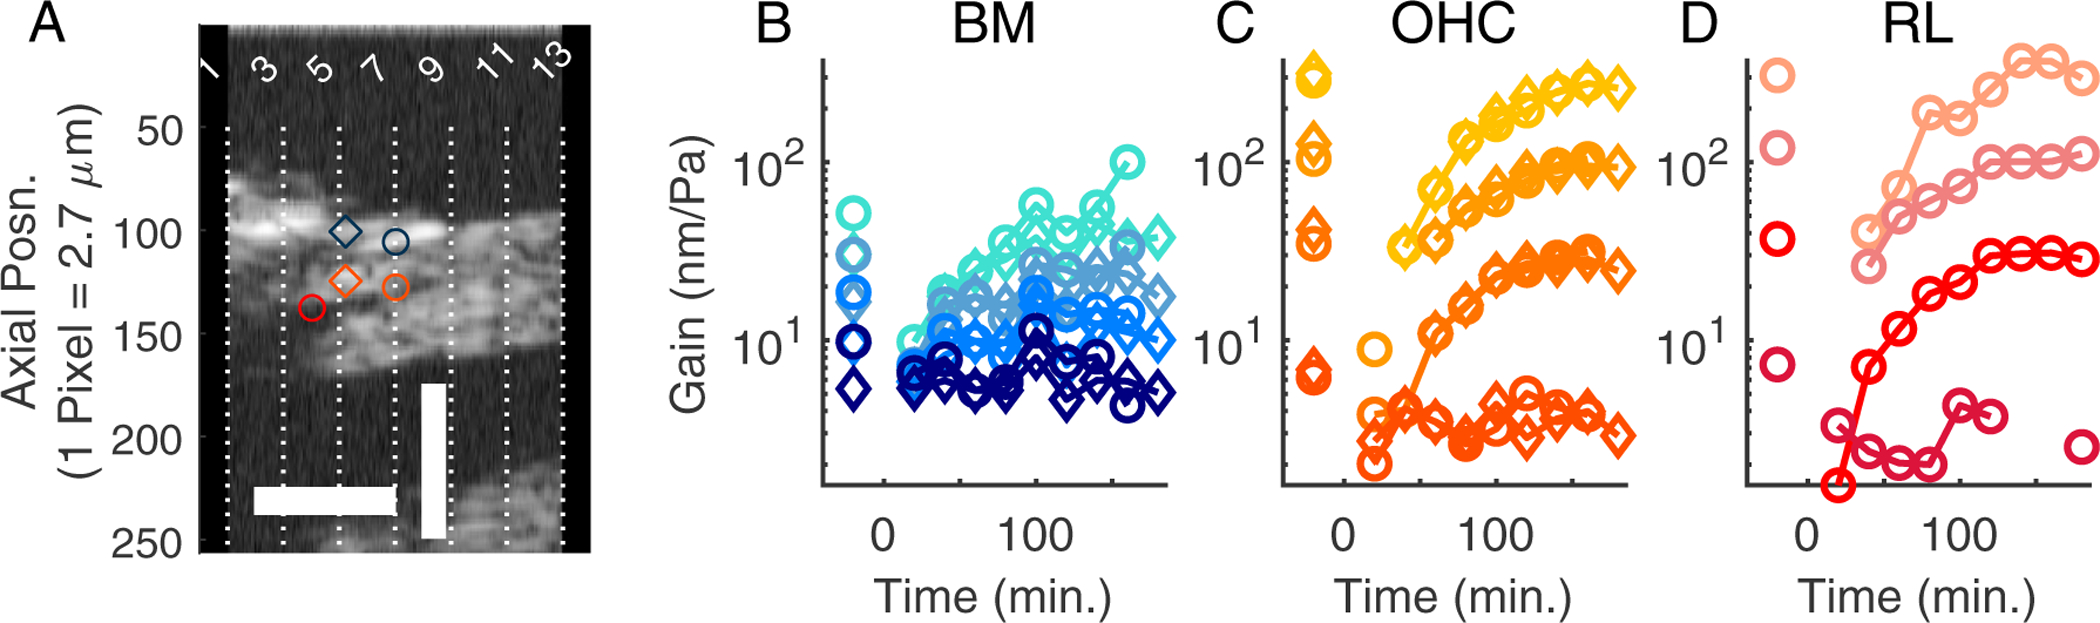
Summary of the loss and recovery of amplification in the vibrations following salicylate. Panel (A) shows a reference Bscan taken at the start of vibration measurements. For clarity, the image has been stretched in the horizontal direction. Horizontal and vertical scale bars are 50 μm and 200 μm respectively. Half of the optical sections where the vibration measurements were made are marked with dashed lines and labeled. The blue, orange, and red symbols are the locations of the BM-, OHC-, and RL-regions whose vibration gains (at BF) are shown in the subsequent panels. By 180 minutes, post treatment, the vibration amplitudes at the BF had largely recovered. For the BM and OHC-regions, gains at two radial locations, 20 μm apart, are shown. The vibration amplitudes of these structures varied little within this 20 μm radial section. The symbols in the line plots correspond to the markers in the Bscan and the color code (50 – 80 dB SPL with darker shades indicating higher SPLs) is the same as the previous figure. Same preparation as Figs. 6 and 7, experiment #884.
Figs. 4 and 10 are from another preparation that showed good recovery in vibration and DPOAE (BF=27 kHz). These results are included to substantiate the findings of recovery of functional cochlear amplification, along with the recovery of the baseline vibration pattern. Figs. 5 and 11 are from a preparation that showed poor recovery. The OHC and RL-region vibrations retained wide-band nonlinearity but did not recover the baseline amplitude and the BF peak never emerged in any location in Fig. 11. DPOAEs also showed poor recovery (Fig. 5), and the shape of the vibration pattern did not regain the oblong shape apparent in the baseline condition.
The results shown to this point were observed using zwuis multi-tone stimulation. Many frequencies are captured together, which is necessary due to the long data acquisition times and signal to noise limitations of the OCT measurements. The multi-tone stimuli are also useful in that the intra-OCC sub-BF nonlinearity, which is an interesting and illuminating finding of OCT measurements, is emphasized due to the overall high SPL of the stimulus compared to single tones. For completeness, we followed the multi-tone experiments with four single-tone experiments, three of which showed good recovery following the salicylate treatement. Following a multi-tone run to determine BF, responses were measured at two single frequencies, BF and BF/2. Based on observations from previous studies (Fallah et al. (2019); Wang et al. (2019)), at BF/2 we expected to observe less baseline nonlinearity with single-tone versus multi-tone stimulation. The response to salicylate was expected to be similar with the single and multi-tones: we expected to observe a reduction and then recovery in response amplitude. At BF, we expected to see a large reduction, corresponding to loss of functional amplification. These expectations were borne out in Fig. 12, which shows single-tone data in panels B and C and tuning curves generated with the zwuis multi-tone stimulus in panel A. Panels D-F are from a multi-tone experiment, the same preparation as in Figs. 6, 7, 8, and included for easy comparison. The BF results were similar for multi and single-tones, strongly nonlinear at baseline and regaining that nonlinearity as the responses recovered following salicylate application. At the earliest time point following salicylate, the BF responses were approximately linear and passive when they are detectable, at the highest SPLs. The baseline BF/2 responses were approximately linear for the single tones (panel C), were reduced slightly following salicylate (by a factor less than 2, largest reduction at the highest SPL) and recovered over the same 200 minute time scale as the BF tones, while retaining nearly linear scaling with level. The near-linearity of the single-tone BF/2 results is consistent with expectations that the nonlinearity observed in the cochlea is primarily due to saturation of the mechanoelectric transduction (MET) current. (Electromotility will eventually saturate, but at larger motions than are sufficient to saturate MET transduction (Adachi et al. (2000); Olson (2020)).) With a single tone stimulus, the overall level of the stimulus is smaller than with a multi-tone stimulus, and with BF/2 stimulation the MET channel is apparently not driven into saturation, even at 85 dB SPL (see also Fallah et al. (2019)). Salicylate caused a reduction in the motion, presumably due to reduced electromotility, but with the single tone BF/2 stimulation the motion still scaled nearly linearly with SPL following salicylate, reaffirming the linearity of MET current under these stimulus conditions.
Figure 12:
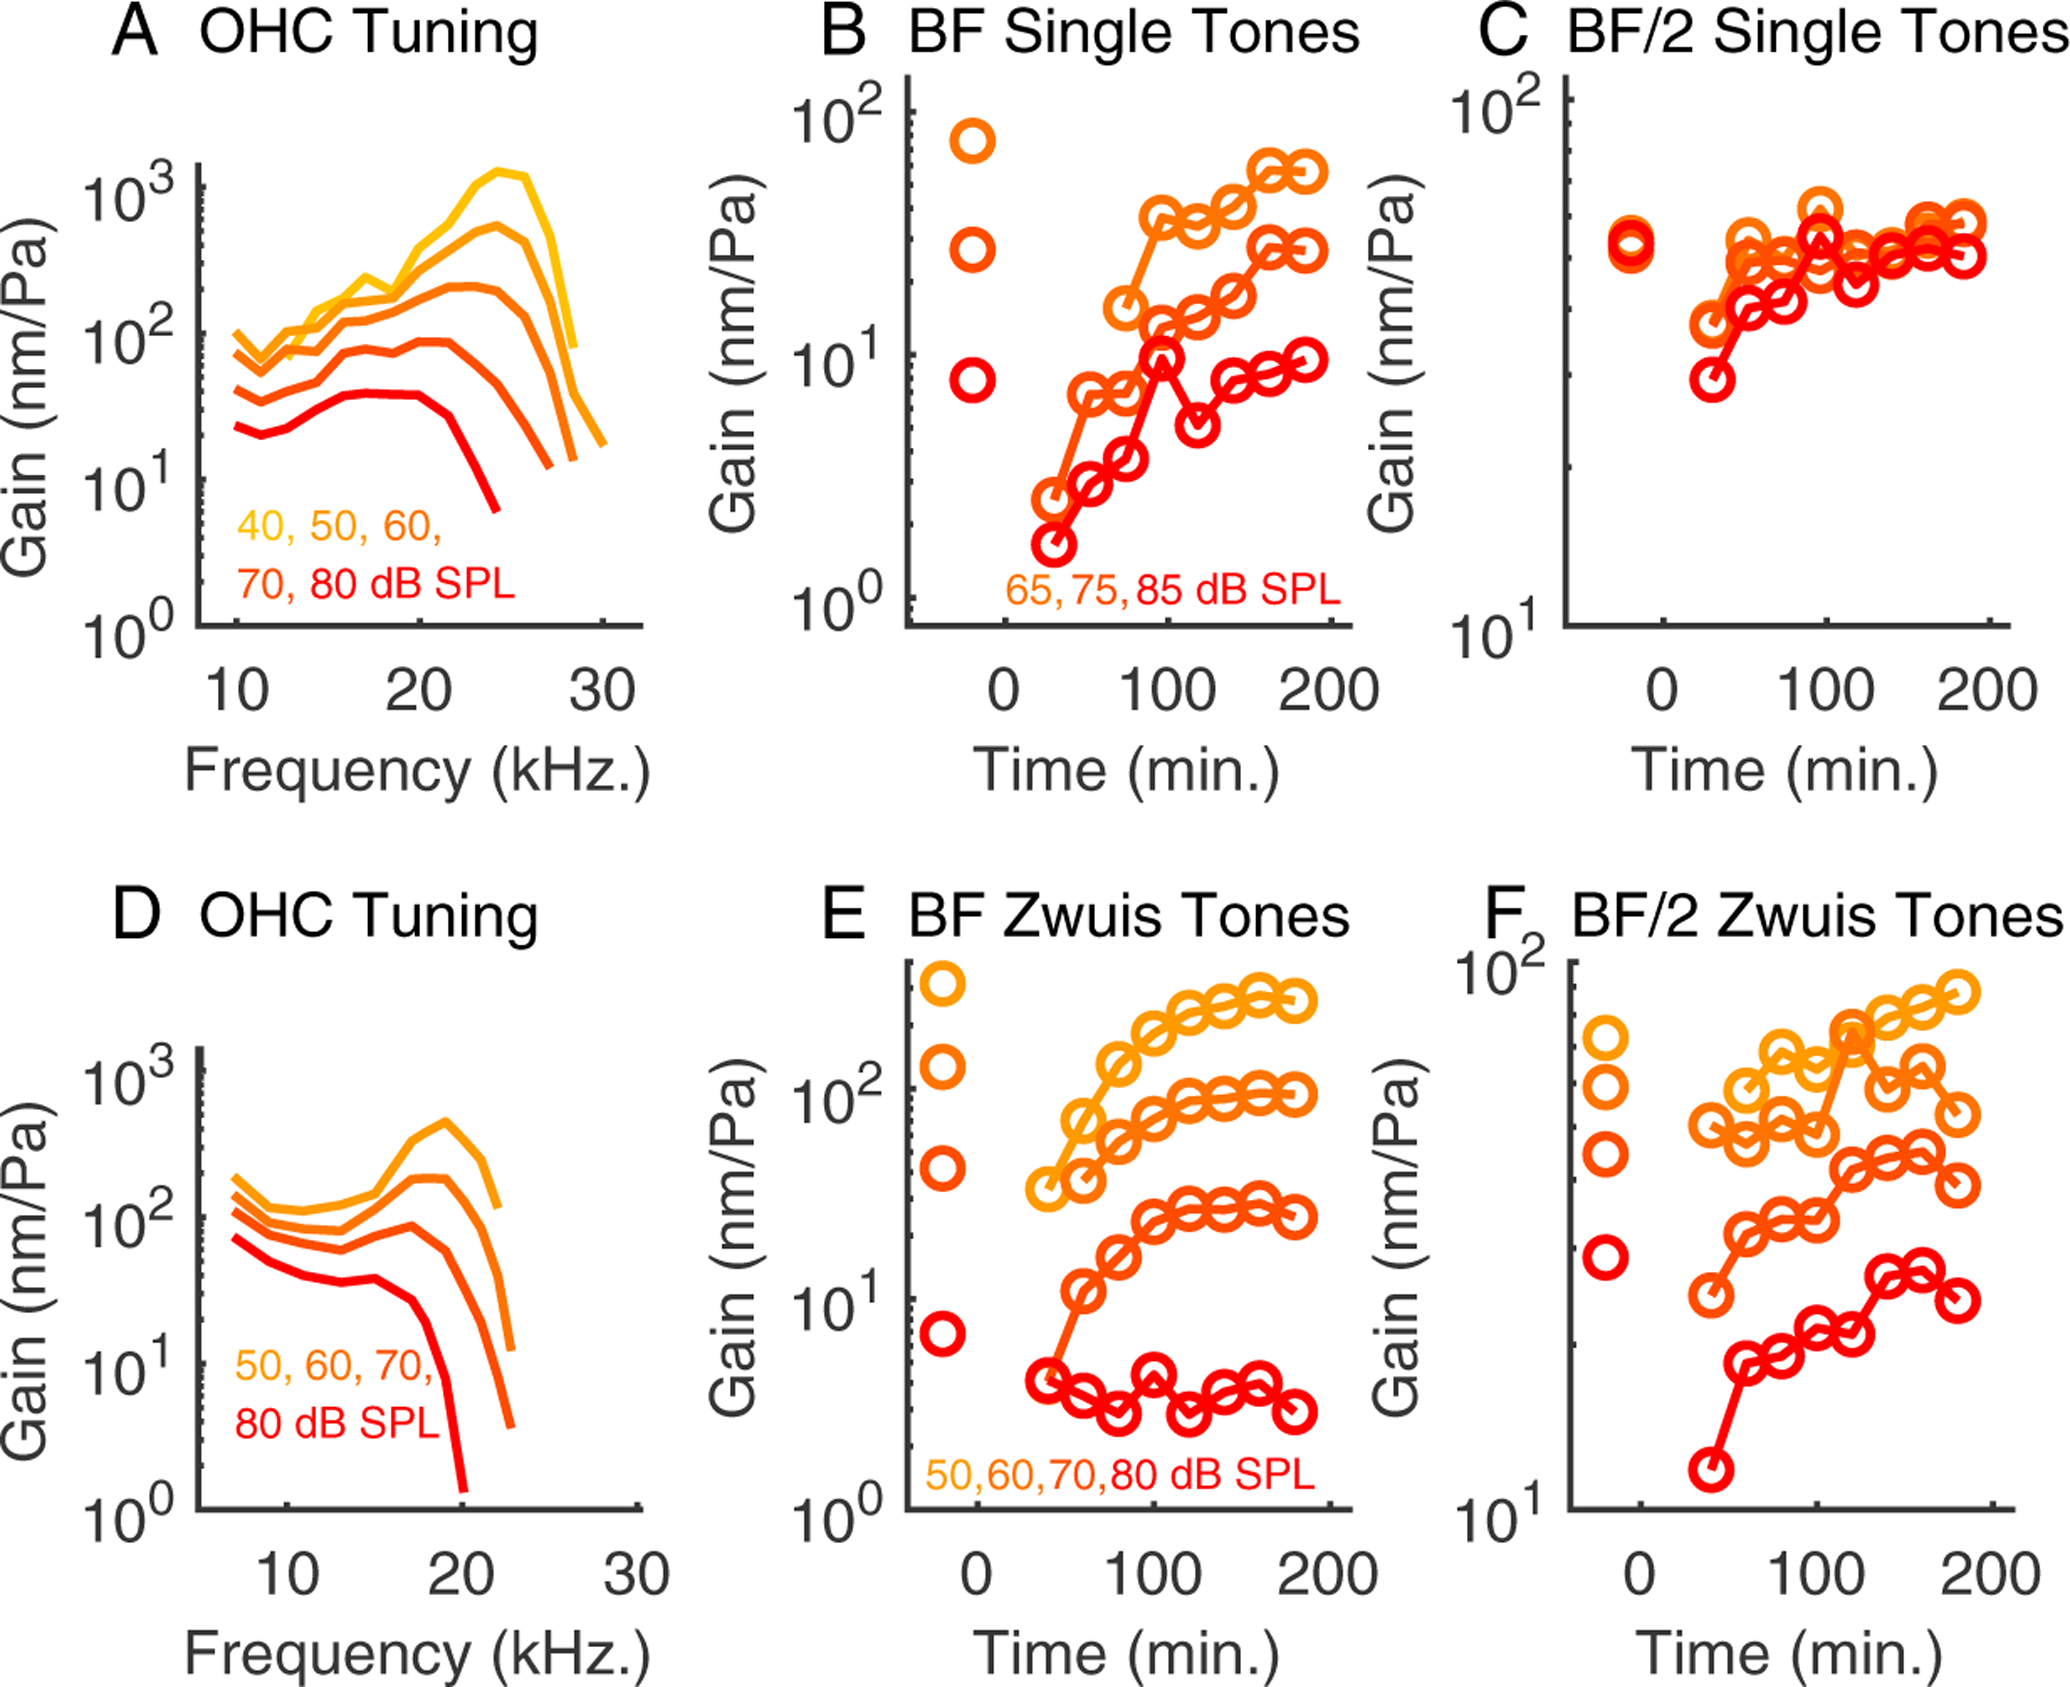
Reduction and recovery of OHC-region vibrations in response to pure tone stimulation following salicylate. Panel (A) shows the OHC-region vibrations measured in response to a 15 component zwuis complex at the start of the experiment. These tuning curves were used to determine BF. Panels (B) and (C) show the loss and recovery of gain in response to a pure tones close to BF (B) and BF/2 (C) at 65, 75, and 85 dB SPL. At BF/2, prior to salicylate treatement the OHC region vibrations were essentially linear and became weakly nonlinear following the salicylate treatment. The weak nonlinearity diminished over the subsequent three hours as the amplitude steadily recovered. Experiment #901. For comparison, panels (D) - (F) show corresponding data from multi-tone experiment #884.
On close inspection, after the salicylate the BF/2 tones did show a small degree of nonlinearity at the highest SPLs (going from 75 to 85 dB SPL). The multi-tone BF/2 results (panel F) also showed more reduction at the highest than at lower SPLs. These SPL dependencies are subtle, but suggest that the MET channel is saturating more strongly after salicylate and it is possible that the salicylate influences MET to a degree, perhaps via material stiffness changes in the OC. The overall effect of salicylate on mechanics is discussed further below.
Discussion
While the effects of salicylate treatment on BM vibrations in vivo have been previously studied (Murugasu and Russell, 1995; Santos-Sacchi et al., 2006; Fisher et al., 2012; Nin et al., 2012), its consequences on intra-OC sound-evoked vibrations were not known. Phase sensitive OCT has allowed for intra-OC vibrations to be observed, including the effect of salicylate. To recap our major observations: The vibrations in all regions showed a wide-band decrease in amplitude and a loss of BF peak following salicylate treatment. The OHC and RL-region vibrations retained their wide-band nonlinearity throughout and could even become low-pass in character. This persistent nonlinearity means that electromotility, which is driven by (nonlinear) OHC transducer current was reduced but not eliminated by salicylate. On the other hand, the BF peak that is the hallmark of the cochlear amplifier was temporarily eliminated. Maps of the axial vibration amplitudes in an approximately radial section reveal both quantitative and qualitative changes in the motion patterns following salicylate. Following treatment with salicylate, there was a loss of amplitude and amplification at all regions and in some cochleae structures lateral to the OHC-region exhibited the highest vibration amplitudes. Baseline vibration amplitudes and patterns recovered by ~ 3 hrs.
Phase sensitive OCT and other interferometric techniques such as laser Doppler vibrometry measure displacement or velocity in one dimension, parallel to the axis of the light beam. Sound-evoked vibrations within the OC are complex with components in the transverse, radial, and longitudinal directions (Lee et al., 2016; Ren et al., 2016; Cooper et al., 2018). Indeed, the true mechanical input into the MET channels is the radial motion of the hair bundles, driven by the relative shear between the TM and the RL. Determining the three-dimensional vibration patterns with an instrument having a single light beam requires measuring vibrations from the same structures at multiple angles (Lee et al., 2016). In our experiments, cochleae were imaged with a field of view as shown in Fig. 1, and the axial measurement would ideally be transverse (perpendicular to the plane of the BM), but volumetric imaging indicates that our vibration measurements include significant longitudinal and radial components. These different components cannot be resolved with a single-axis measurement. In our recent studies of recovery following furosemide, there was correspondence between changes in motion, local cochlear microphonic (LCM) and DPOAEs following furosemide (Wang et al., 2019; Strimbu et al., 2020). Similarly, in the present study with salicylate, the reduction and recovery in motion was closely tied to changes in DPOAEs. These correlations indicate that the single-axis motion measurement is an informative, albeit incomplete, monitor of cochlear response. Quantifying the orientation of the OC and its substructures during the OCT experiments and resolving the individual components of the motion is an ongoing project in our lab.
Two recent papers from our group (Wang et al., 2019; Strimbu et al., 2020) reported the effects of furosemide on cochlear potentials, DPOAEs, and vibrations. Furosemide transiently abolishes the endocochlear potential (EP) by blocking the Na+/K+/2Cl− transporter in the stria vascularis lining the interior of the otic capsule. The EP is essential to normal cochlear amplification and the ototoxic effects of furosemide are typically reversible. It is informative to compare the response of the cochlea to furosemide and salicylate. Immediately after the intravenous furosemide injection, the EP dropped from its normal physiological value of ~+ 80 mV to negative values consistent with a passive diffusion potential. EP recovered first rapidly, then more gradually over ~ 40 minutes to a relatively stable but depressed value around +40 to +60 mV. Following furosemide, the DPOAEs, LCM and evoked vibrations showed a biphasic recovery. An initial recovery of sub-BF vibration and LCM responses occurred over ~ 1 hr, followed by recovery of the BF-peak starting at ~ 70 minutes, reaching nearly or complete baseline values ~ 2 hrs post treatment. The DPOAEs reached a global minimum shortly after the drug delivery, then underwent a relatively rapid but incomplete recovery over the subsequent 10 – 20 minutes, followed by a second minimum some 50 minutes after treatment, and finally by a slow recovery to nearly baseline levels over the following 2 hrs. By analysing DPOAEs and harmonics in the LCM in terms of the hair bundles’ MET function, the furosemide data indicated that the MET apparatus underwent an operating point shift during the time interval the EP was most depressed and subsequently readjusted, with the major readjustment occurring along with the recovery of the BF peak.
In contrast to the two-stage recovery of DPOAEs following furosemide, following salicylate application the recovery of the DPOAEs was largely monotonic. DPOAEs reached a minimum some 10 minutes following the salicylate application, likely due to the time required for salicylate to diffuse into the scala tympani and reach a concentration sufficient to block prestin, and exhibited a steady recovery to baseline levels in the subsequent few hours. The recovery of vibrations was also different in the two studies - with the furosemide study, the sub-BF vibrations recovered fully by ~ 50 minutes, before the BF peak recovered. With the salicylate, while the OHC and RL-region vibrations retained wide-band nonlinearity throughout, the sub-BF amplitude recovery occurred on a similar time scale as the BF peak.
In the present study we used areal vibration mapping, which revealed that following salicylate the OC moved differently than it moved in the healthy state – it went from a contained oblong shape, including OHCs and extending from the RL to the BM at the foot of the outer pillar cell, to a more diffuse state that was often largest lateral of the OHCs. The shape change has similarity with the post-mortem changes that have been documented ((Cooper et al., 2018)), although the active process (nonlinearity) maintained a presence in the case of salicylate. The salicylate-induced vibration shape change is likely caused in part by the reduced amplitude and forcing of OHC electromotility and also influenced by the reduced OHC turgor pressure and somatic and bundle stiffness changes that have been observed in in vitro studies (Dallos et al., 2008; Russell and Schauz, 1995; Shehata-Dieler et al., 1994; Hakizimana and Fridberger, 2015). The cochlea relies on both its passive mechanical properties, such as the local stiffness, damping and longitudinal coupling, and its active mechanisms to achieve sharp frequency selectivity and amplification at each longitudinal location. Perturbing the stiffness of the OHC bodies or the hair bundles will alter the local mechanical properties of the cochlear partition and reduce the efficacy of the active process (Fisher et al., 2012; Dewey et al., 2018).
To summarize, the recovery from both furosemide and salicylate involves multiple factors - in the case of furosemide, it involves (substantial) restoration of the drive voltage to MET current, and the recentering of MET channels; with salicylate it involves both electromotility recovery and the re-establishment of physical properties needed for functional patterns of vibration.
Highlights.
Salicylate applied to the cochlea caused temporary reductions in cochlear responses
Basilar membrane responses became approximately passive following salicylate
Organ of Corti responses retained wide-band nonlinearity following salicylate
Patterns of vibration shifted laterally and were relatively diffuse following salicylate
Following salicylate, responses recovered nearly completely over ~ 3 hours
Acknowledgments
This work was funded by NIH Grant R01-DC015362 and the Emil Capita Foundation. We thank the other members of the Fowler Memorial Laboratory for assistance and feedback during the experiments and for commenting on the manuscript.
Footnotes
Publisher's Disclaimer: This is a PDF file of an unedited manuscript that has been accepted for publication. As a service to our customers we are providing this early version of the manuscript. The manuscript will undergo copyediting, typesetting, and review of the resulting proof before it is published in its final form. Please note that during the production process errors may be discovered which could affect the content, and all legal disclaimers that apply to the journal pertain.
References
- Adachi M, Sugawara M, Iwasa KH, 2000. Effect of Turgor Pressure on Outer Hair Cell Motility. J Acoust Soc Am 108, 2299–2306. [DOI] [PubMed] [Google Scholar]
- Cooper NP, Vavakou A, van der Heijden M, 2018. Vibration hotspots reveal longitudinal funneling of sound-evoked motion in the mammalian cochlea. Nat Commun 9, 3054. [DOI] [PMC free article] [PubMed] [Google Scholar]
- Dallos P, Wu X, Cheatham MA, Gao J, Zheng J, Anderson CT, Jia S, Wang X, Cheng WH, Sengupta S, He DZ, Zuo J, 2008. Prestin-based outer hair cell motility is necessary for mammalian cochlear amplification. Neuron 58, 333–339. [DOI] [PMC free article] [PubMed] [Google Scholar]
- Dewey JB, Xia A, Mller U, Belyantseva IA, Applegate BE, Oghalai JS, 2018. Mammalian Auditory Hair Cell Bundle Stiffness Affects Frequency Tuning by Increasing Coupling along the Length of the Cochlea. Cell Rep 23, 2915–2927. [DOI] [PMC free article] [PubMed] [Google Scholar]
- Fallah E, Strimbu CE, Olson ES, 2019. Nonlinearity and amplification in cochlear responses to single and multi-tone stimuli. Hear Res 377, 271–281. [DOI] [PMC free article] [PubMed] [Google Scholar]
- Fallah E, Strimbu CE, Olson ES, 2021. Nonlinearity of intracochlear motion and local cochlear microphonic: Comparison between guinea pig and gerbil. Hear Res 405, 108234. [DOI] [PMC free article] [PubMed] [Google Scholar]
- Feng H, Yin SH, Tang AZ, Cai HW, Chen P, Tan SH, Xie LH, 2010. Caspase-3 activation in the guinea pig cochlea exposed to salicylate. Neurosci Lett 479, 34–39. [DOI] [PubMed] [Google Scholar]
- Fisher J, Nin F, Reichenbach T, Uthaiah R, Hudspeth A, 2012. The spatial pattern of cochlear amplification. Neuron 76, 989–997. [DOI] [PMC free article] [PubMed] [Google Scholar]
- Hakizimana P, Fridberger A, 2015. Effects of salicylate on sound-evoked outer hair cell stereocilia deflections. Pflugers Arch 467, 2021–2029. [DOI] [PubMed] [Google Scholar]
- Van der Heijden M, Joris PX, 2003. Cochlear Phase and Amplitude Retrieved from the Auditory Nerve at Arbitrary Frequencies. J Neuroscience 23, 9194–9198. [DOI] [PMC free article] [PubMed] [Google Scholar]
- Janssen T, Boege P, Oestreicher E, Arnold W, 2000. Tinnitus and 2f1-f2 distortion product otoacoustic emissions following salicylate overdose. J Acoust Soc Am 107, 1790–1792. [DOI] [PubMed] [Google Scholar]
- Kakehata S, Santos-Sacchi J, 1996. Effects of salicylate and lanthanides on outer hair cell motility and associated gating charge. J Neurosci 16, 4881–4889. [DOI] [PMC free article] [PubMed] [Google Scholar]
- Lee HY, Raphael PD, Xia A, Kim J, Grillet N, Applegate BE, Ellerbee Bowden AK, Oghalai JS, 2016. Two-Dimensional Cochlear Micromechanics Measured In Vivo Demonstrate Radial Tuning within the Mouse Organ of Corti. J Neurosci 36, 8160–8173. [DOI] [PMC free article] [PubMed] [Google Scholar]
- Lin NC, Strimbu CE, Hendon CP, Olson ES, 2018. Adapting a commercial spectral domain optical coherence tomography system for timelocked displacement and physiological measurements. AIP Conference Proceedings 1965, 080004. doi: 10.1063/1.5038488. [DOI] [Google Scholar]
- Long GR, Tubis A, 1988. Modification of spontaneous and evoked otoacoustic emissions and associated psychoacoustic microstructure by aspirin consumption. J Acoust Soc Am 84, 1343–1353. [DOI] [PubMed] [Google Scholar]
- Mellado Lagarde MM, Drexl M, Lukashkin AN, Zuo J, Russell IJ, 2008. Prestin’s role in cochlear frequency tuning and transmission of mechanical responses to neural excitation. Curr Biol 18, 200–202. [DOI] [PubMed] [Google Scholar]
- Murugasu E, Russell IJ, 1995. Salicylate ototoxicity: The effects on basilar membrane displacement, cochlear microphonics, and neural responses in the basal turn of the guinea pig cochlea. Auditory Neuroscience 1, 139–150. [DOI] [PMC free article] [PubMed] [Google Scholar]
- Nin F, Reichenbach T, Fisher JAN, Hudspeth AJ, 2012. Contribution of active hair-bundle motility to nonlinear amplification in the mammalian cochlea. Proc Natl Acad Sci U S A 109, 21076–21080. [DOI] [PMC free article] [PubMed] [Google Scholar]
- Olson ES, 2020. Mechanics of the Cochlea. Reference Module in Neuroscience and Biobehavioral Psychology, Elsevier, Amsterdam, Netherlands. [Google Scholar]
- Ren T, He W, Barr-Gillespie PG, 2016. Reverse transduction measured in the living cochlea by low-coherence heterodyne interferometry. Nat Commun 7, 10282. [DOI] [PMC free article] [PubMed] [Google Scholar]
- Russell I, Schauz C, 1995. Salicate ototoxicity: Effects on the stiffness and electromotility of outer hair cells isolated from the guinea pig cochlea. Auditory Neuroscience 1, 309–319. [Google Scholar]
- Sadreev II, Burwood GWS, Flaherty SM, Kim J, Russell IJ, Abdullin TI, Lukashkin AN, 2019. Drug Diffusion Along an Intact Mammalian Cochlea. Front Cell Neurosci 13, 161. [DOI] [PMC free article] [PubMed] [Google Scholar]
- Santos-Sacchi J, Song L, Zheng J, Nuttall AL, 2006. Control of mammalian cochlear amplification by chloride anions. Journal of Neuroscience 26, 3992–3998. [DOI] [PMC free article] [PubMed] [Google Scholar]
- Schaechinger TJ, Oliver D, 2007. Nonmammalian orthologs of prestin (SLC26A5) are electrogenic divalent/chloride anion exchangers. Proc Natl Acad Sci U S A 104, 7693–7698. [DOI] [PMC free article] [PubMed] [Google Scholar]
- Shehata WE, Brownell WE, Dieler R, 1991. Effects of salicylate on shape, electromotility and membrane characteristics of isolated outer hair cells from guinea pig cochlea. Acta Oto-Laryngologica 111, 707–718. [DOI] [PubMed] [Google Scholar]
- Shehata-Dieler WE, Richter CP, Dieler R, Klinke R, 1994. Effects of endolymphatic and perilymphatic application of salicylate in the pigeon. I: Single fiber activity and cochlear potentials. Hear Res 74, 77–84. [DOI] [PubMed] [Google Scholar]
- Sheppard A, Hayes SH, Chen GD, Ralli M, Salvi R, 2014. Review of salicylate-induced hearing loss, neurotoxicity, tinnitus and neuropathophysiology. Acta Otorhinolaryngol Ital 34, 79–93. [PMC free article] [PubMed] [Google Scholar]
- Spicer SS, Smythe N, Schulte BA, 2003. Ultrastructure Indicative of Ion Transport in Tectal, Deiters, and Tunnel Cells: Differences Between Gerbil and Chinchilla Basal and Apical Cochlea. Anatomical Record Part A 271A, 342–359. [DOI] [PubMed] [Google Scholar]
- Stewart CE, Hudspeth AJ, 2000. Effects of salicylates and aminoglycosides on spontaneous otoacoustic emissions in the Tokay gecko. Proc Natl Acad Sci U S A 97, 454–459. [DOI] [PMC free article] [PubMed] [Google Scholar]
- Strimbu CE, Wang Y, Olson ES, 2020. Manipulation of the Endocochlear Potential Reveals Two Distinct Types of Cochlear Nonlinearity. Biophys J 119, 2087–2101. [DOI] [PMC free article] [PubMed] [Google Scholar]
- Thorne M, Salt AN, DeMott JE, Henson MM, Henson OW, Gewalt SL, 1999. Cochlear fluid space dimensions for six species derived from reconstructions of three-dimensional magnetic resonance images. Laryngoscope 109, 1661–1668. [DOI] [PubMed] [Google Scholar]
- Versteegh CP, van der Heijden M, 2012. Basilar membrane responses to tones and tone complexes: nonlinear effects of stimulus intensity. J Assoc Res Otolaryngol 13, 785–798. [DOI] [PMC free article] [PubMed] [Google Scholar]
- Wang Y, Fallah E, Olson ES, 2019. Adaptation of Cochlear Amplification to Low Endocochlear Potential. Biophys J 116, 1769–1786. [DOI] [PMC free article] [PubMed] [Google Scholar]
- Wei L, Ding D, Salvi R, 2010. Salicylate-induced degeneration of cochlea spiral ganglion neurons-apoptosis signaling. Neuroscience 168, 288–299. [DOI] [PMC free article] [PubMed] [Google Scholar]
- Zheng J, Shen W, He DZ, Long KB, Madison LD, Dallos P, 2000. Prestin is the Motor Protein of Cochlear Outer Hair Cells. Nature 405, 149–155. [DOI] [PubMed] [Google Scholar]