

Abstract
We aimed to test main, additive, interactive effects, and feasibility of all possible combinations of six intervention components implemented for 8 weeks (Cooking/Serving Resources; Meal Delivery; Ingredient Delivery; Community Kitchen; Nutrition Education; Cooking Demonstrations). Primary outcomes were family meal frequency and preschoolers’ dietary quality; secondary outcomes included family meal preparation type, meal preparation barriers, family functioning, and kitchen inventory adequacy. All possible intervention combinations were tested using a randomized factorial trial design in the first phase of a Multiphase Optimization Strategy (MOST). Feasibility was assessed via attendance, delivery logs, and satisfaction. Parent-reported data collection included: socio-demographics, frequency and type of family meals; preschooler dietary intake; perceived barriers to meal planning and preparation; assessment of family functioning; and a kitchen inventory of materials generally needed for meal preparation. Participants (n=499) were recruited at two Head Start agencies in mid-Michigan with data collection and delivery of some intervention components in participants’ homes. Promising intervention bundles were identified by evaluating pre- to post-intervention effect sizes. The combination of Cooking/Serving Resources and Meal Delivery increased family meal frequency (Cohen’s d=0.17), cooking dinner from scratch (d=0.21), prioritization of family meals (d =0.23), and kitchen inventory (d=0.46) and decreased use/consumption of ready-made (d= −0.18) and fast foods (d= −0.23). Effects on diet quality were in the expected direction but effect sizes were negligible. Community Kitchen, Nutrition Education, and Cooking Demonstration showed poor feasibility due to low attendance while Ingredient Delivery was infeasible due to staffing challenges related to its labor intensity. Additionally, although not one of our pre-specified outcomes, Cooking/Serving Resources (RR=0.74) and Meal Delivery (RR=0.73) each decreased food insecurity. Cooking/Serving Resources combined with Meal Delivery showed promise as a strategy for increasing family meal frequency.
Keywords: Head Start, low-income preschoolers, MOST, multiphase optimization strategy, obesity prevention
1. Introduction
Family meals have been reported to contribute to a range of beneficial outcomes in children, including improved nutrient intake, healthier eating behaviors, better social skills, greater family connectedness, and lower obesity risk (Hammons & Fiese, 2011; Martin-Biggers et al., 2014; McCullough et al., 2016). Identifying effective strategies for increasing family meal frequency, and the effects of these strategies on children’s health, is important because implementing family meals can be challenging, (Dwyer et al., 2008; Moss et al., 2014; Quick et al., 2011) especially among low-income families (Berge et al., 2013).
Family meal intervention approaches have targeted meal planning skills and knowledge (Fulkerson et al., 2014) or parental modeling of healthy eating (Mazzeo et al., 2012), but there is an evidence gap about types and level of intensity of resources needed to implement family meals among low-income families specifically. Qualitative research suggests that single-headed households, which tend to be lower income, report different barriers to family meals (e.g., cost and burden of preparing meals) than the barriers reported by dual-headed households (e.g., time constraints, feeling tired, lack of meal ideas) (Berge et al., 2013). Cross-sectional findings also suggest that lower income families have fewer food preparation supplies available (Appelhans et al., 2014), further substantiating the need for family meal interventions tailored to the needs of low-income families. Not only must family meal interventions be evidence-based in their ability to improve the frequency and healthfulness of family meals, but they must be well accepted by low-income families, given competing stressors (Agrawal et al., 2018). Additionally, family meal interventions used as an obesity prevention strategy must be able to be conducted on a large-scale (e.g., through public health policies) to benefit the health of populations.
Our aim was to identify concrete, supportive intervention components that help low-income families implement more frequent family meals and improve preschooler’s diet quality. We also assessed intervention effects on secondary outcomes including family meal preparation type, barriers to meal preparation, family functioning, and kitchen inventory adequacy. Our approach was built on the premises that: 1) enhancing the ability of parents to implement healthy family meals and mealtimes is critical to effective obesity prevention; and 2) when parents do not implement regular healthy family meals, it is not solely due to a lack of knowledge regarding the importance of family meals (Berge et al., 2013), but to the combined adverse effects of poverty on food costs (Oberle et al., 2020) and planning and implementing healthy family meals (Agrawal et al., 2018).
Given that a combination of support/intervention components is likely to be more effective than a single intervention component in increasing the family meal frequency, we took a phased approach to identify the most effective bundled intervention using the Multiphase Optimization Strategy (MOST) (Collins et al., 2007). The MOST approach consists of multiple phases: Screening, Refining, and Evaluation. In the Screening Phase, interventions for which there are a theoretical basis for hypothesized effectiveness are tested in varying combinations to identify those that contribute to positive outcomes or are neutral or counterproductive. Decisions about which intervention components should be retained are made based on effect sizes (in contrast to statistical significance at an alpha level of 0.05) identified using a randomized factorial design. Process data, including feasibility and satisfaction are also important to collect to assist in making final decisions about which intervention components to retain to ensure the final intervention is both well-accepted by participants and feasible to conduct by future interventionists. At the conclusion of the Screening Phase, a bundled set of intervention combinations to be retained for further examination is identified to be tested in a traditional two-arm randomized controlled trial. The trial registration for the Simply Dinner Study (Clinical Trials ID: NCT02487251) includes a description of all phases of the study with the final primary outcome of change in BMIz. The purpose of this paper is to report only the results of the Screening Phase of the Simply Dinner Study, in which we identified a bundled family mealtime intervention combination—as defined by a combination of factors including the main, additive, and interactive effect results, as well as feasibility—to be assessed a future randomized controlled trial.
2. Methods
2.1. Study Design
In a factorial design with six intervention components (see section 2.5), individual participants were randomized to one of 64 experimental conditions. The 64 conditions resulted from the crossing of six interventions, each of which had two conditions (provided vs. not) and reflected all possible combinations (ranging from receiving no intervention to all six intervention components; see Figure 1). The rationale for the sample size has previously been described (Brophy-Herb et al., 2017).
Figure 1.
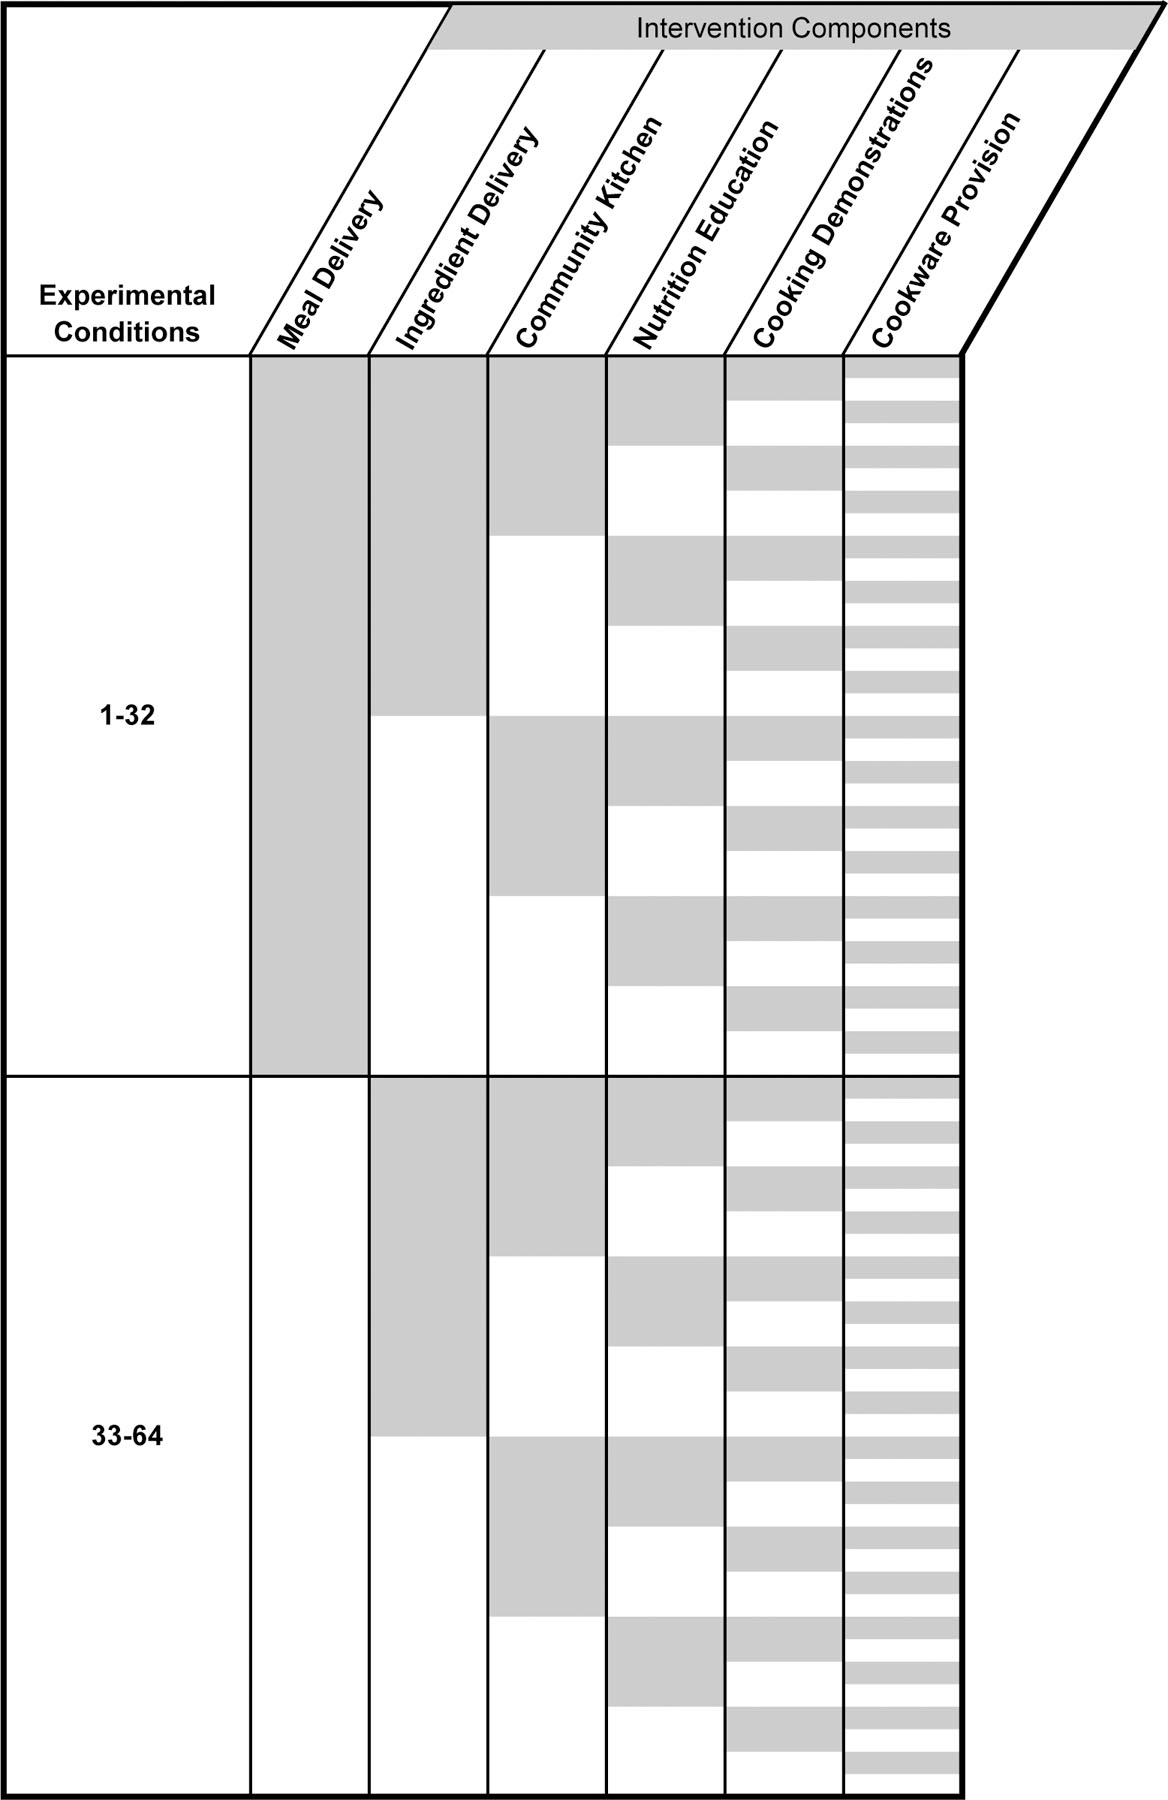
Illustration of randomization in factorial design with 64 conditions. Shaded areas indicate assignment to an intervention component, non-shaded areas indicate usual care. Row height was condensed for clarity (planned n=8 per row/condition).
2.2. Setting and Participants
Families were recruited from two Head Start agencies* serving a mix of rural and urban areas in mid-Michigan over the years 2016–2018. Inclusion criteria were child age (3 or 4 years at study enrollment) and Head Start participation. Exclusions were food allergies, serious medical problems that affect appetite or eating, significant developmental disabilities that would preclude participation, family anticipated leaving the Head Start program during the school year, child was in the foster care system, or parent was non-English speaking.
2.3. Recruitment Techniques and Randomization
Participants were recruited on-site at their child’s Head Start program via distribution of informational packets at parent events or sent home in children’s backpacks by the classroom teachers. The written study material explained the study as seeking to “understand how certain programs related to dinner meals might promote children’s health and well-being.” Parents who expressed interest in study participation were asked to provide contact information to the study data collection staff who then contacted interested parents by telephone to screen for eligibility. Written informed consent was obtained from all participants during a home visit. Families were assigned to study interventions through an automated random number generator. All study procedures were approved by the institutional review boards at Michigan State University (Study ID: LEGACY14-1297) and the University of Michigan (Study eResearch ID: HUM00097848).
2.4. Data Collection Procedures
Data collection teams were distinct from the intervention staff and were managed separately. Data collection staff were blinded to the intervention components to which participants were assigned. Data collection staff and interventionists were blinded to study research questions. After obtaining consent and prior to starting the intervention, a data collector made a 60–90-minute home visit to measure maternal and child weight and height and complete a series of questionnaires with the primary caregiver. If needed, child weight and height were measured at the Head Start program. Following the implementation of the intervention, a post-intervention data collection visit was conducted at which time the same measures were obtained. Questionnaires were completed using computer-assisted interviewer administration.
2.5. Intervention Components
The six intervention components have been described previously in detail along with a review of the research to support their inclusion (Brophy-Herb et al., 2017), but are noted briefly here. The intervention duration was 8 weeks.
Cooking/Serving Resources: Participants received a one-time provision of matching pans, basic cooking utensils, measuring cups/spoons, casserole dish, cutting board, potholders, dishes (e.g., plates, bowls, mugs), and flatware for use in making and serving meals.
Meal Delivery: Prepared dinner meals were delivered weekly to the home ready to heat and eat (one meal per week).
Ingredient Delivery: Ingredients to make one meal per week were delivered weekly to the home.
Community Kitchen: Participants were encouraged to attend a weekly group session to prepare one main dish to take home and eat.
Nutrition Education Classes: Participants were encouraged to attend a weekly group nutrition education class that included food preparation and tasting.
Cooking Demonstrations: Participants were encouraged to attend a weekly group cooking lesson that included food tasting.
For the interventions involving home delivery of meals or ingredients, meals (size customized to family size and including a lean protein source, vegetable, fruit, and whole grain) were prepared by Head Start and study staff trained in meal preparation in a licensed kitchen and according to all health and safety guidelines. For interventions involving groups, lessons occurred in-person at Head Start with childcare and transportation provided as needed; teaching was provided by a university Extension Educator.† All intervention components except Cooking/Serving Resources included recipes so that participants could potentially recreate the dishes or meals that were provided.
Recipes for all intervention components were selected using a multi-step process beginning with those identified on the US Department of Agriculture’s What’s Cooking website (https://www.whatscooking.fns.usda.gov/) as having 5 or fewer ingredients and cooking times of 30 minutes or less, excluding those with nut products, and reviewing with partnering agencies to determine meals that might be most attractive to families. By design, some participants were assigned to multiple intervention components, so each component included different recipes, but recipes were designed to be nutritionally equivalent across groups. Kasper et al.’s Healthy Meal Index (HMI), which measures meal healthfulness based on current dietary guidelines (the Dietary Guidelines for Americans, MyPlate and the American Heart Association Dietary Guidelines), was used to measure the healthfulness of the included recipes. HMI scores are compiled based on nutritional adequacy (i.e., the presence of food recommended for a healthy diet) and moderation (i.e., the absence of foods recommended for moderate consumption only). The presence of fruits, vegetables, dairy or dairy substitutes, proteins, and grains (excluding fried or salty snacks), whole grains, and healthy fats were awarded points which were summed to get the Adequacy score. Additional points were added to the Adequacy score if the meal included multiple vegetables and if the vegetables were high nutritional quality (e.g., dark green, red, orange vegetables, legumes). The Moderation score was based on the absence of convenience foods, sugar-sweetened or diet beverages, added and saturated fats, and desserts; thus higher Moderation scores indicated fewer “unhealthy” foods. The Adequacy score and the Moderation score were summed to create the overall HMI score, with higher scores indicating healthier meals (Kasper et al., 2016). All selected recipes fell in the top 10% of HMI scores for nutritional adequacy and moderation.
2.6. Primary Outcomes
2.6.1. Family Meal Frequency
Family meal frequency was assessed with the question: “How many nights a week out of 7 did you and your child eat dinner together in the same place at home (such as around the table) for most of the meal?” Additional family meal details were assessed as secondary outcomes (see section 2.7.1).
2.6.2. Proxy Indicators of Dietary Quality
Children’s dietary intake was assessed using the Block Dietary Data Systems Kids Food Screener—Last Week (BKFS, Version 2), which is a 41-item survey designed to evaluate nutrients and food groups in children aged 2–17 years (Hunsberger et al., 2015). Nutrients and food groups are reported from multiple items summed from each survey construct. To assess dietary quality, we used the food groups “fruit/fruit juice” and “vegetables excluding potatoes and legumes” and “legumes and whole grains”, each measured in cup equivalents, as proxy indicators of dietary patterns representing higher dietary quality (Aljadani et al., 2013). We used saturated fat intake (grams), the food group “potatoes including French fries” in cup equivalents, and “sugar-sweetened beverages” in servings as proxy indicators of dietary patterns representing lower dietary quality (Nicklas & O’Neil, 2015).
2.7. Secondary Outcomes and Other Measurements
2.7.1. Family Meal Preparation Type
Parents also reported the weekly frequency of different meal preparation types by answering the following four questions. These questions were adapted slightly from the published version (Storfer-Isser, 2013) by altering wording to better reflect the current study.
“How many nights out of 7 did you cook dinner mostly from scratch (using basic ingredients such as raw or uncooked meat, fresh, canned, or frozen vegetables, bagged salad greens, etc.”)
“How many nights out of 7 did you cook dinner mostly using only ready-made foods/dinners? Ready-made ingredients include foods like boxed macaroni and cheese, canned soup, deli potato/pasta salad, frozen meals, etc.
“How many nights out of 7 did you cook dinner using ready-made dinners (include foods like frozen lasagna and ready-made meals in the grocery deli like a cooked chicken)”
“How many nights out of 7 did you or your child eat fast food for dinner at the restaurant or at home (such as McDonalds, Wendy’s, Taco Bell, Culvers, KFC, Arby’s, Pizza Hut)?”
2.7.2. Barriers to Mealtime Planning/Preparation
Changes in perceptions of barriers were addressed with adaptations to the Time Scarcity and Fatigue Barrier scales (Storfer-Isser & Musher-Eizenman, 2013) (pre- and post-intervention alphas = 0.80 and 0.78 for meal planning; 0.64 and 0.71 for meal preparation). Items related to time and energy as barriers to planning (3 items) and preparing meals (5 items), with higher scores indicating higher barriers. Sample items included “I do not have enough time or energy to plan meals for my children” and “I do not have enough time or energy to cook meals for my children.” Items were rated on a 7-point scale from (1) strongly disagree to (7). We also included items relative to stress and decision making/competing demands including the Priority for Family Meals Scale (Neumark-Sztainer et al., 2002) (pre- and post-intervention alphas = 0.67 and 0.73), which consisted of 5 items rated on a 4-point scale from 1 (strongly disagree) to 4 (strongly agree), with higher scores reflecting greater priority placed on mealtimes. Sample items included “In my family, it is important that the family eat at least one meal a day together” and “I am often too busy to eat dinner with my family.”
2.7.3. Parental Distress and Family Functioning
We also included measures of parenting stress and family functioning to assess associations between provision of mealtime supports and potential improvements in parenting stress and family functioning. We utilized the parental distress subscale of the Parenting Stress Index (Abidin, 1990). Twelve items were scored on a 1 (strongly disagree) to 5 (strongly agree) scale with higher scores reflecting greater distress in the parenting role (pre- and post-intervention alphas = 0.83 and 0.85). The general functioning subscale of the McMaster Family Assessment Device assessed family functioning (Epstein et al., 1983). Twelve items (pre- and post-intervention alphas = 0.85 and 0.90) were scored from 1 (strongly agree) to 4 (strongly disagree) such that lower scores reflected more optimal family functioning. Sample items included “We can express our feelings to each other” and “We are able to make decisions about how to solve problems.”
2.7.4. Cooking Resources
We constructed a brief scale to measure participants’ perceived adequacy of resources needed to plan, prepare, and serve meals (e.g., access to materials such as recipes, cooking tools and materials, dinnerware). This was developed by an informal process initiated by study staff and reviewed by Head Start partners for face validity. Parents completed a checklist indicating how many of 35 items they had or to which they had access. Categories of resources included: cooking utensils (e.g., measuring cups), eating utensils (e.g., silverware), cookware (e.g., baking dish), working appliances (e.g., oven), and miscellaneous items (e.g., potholders).
2.7.5. Covariates and Other Measurements
All sociodemographic variables were parent-reported. Food security/insecurity was measured using the USDA Household Food Security Scale (Bickel et al., 2008). Given the short duration of the intervention period (i.e., 8 weeks), we did not anticipate substantial changes in body mass index (BMI), but we did measure height and weight, in part to assess feasibility. Children were weighed without shoes or heavy clothing using the Detecto DR-550-C and height was measured using a SECA stadiometer. BMI was calculated and child BMI z-scores and percentiles were derived using the US Centers for Disease Control and Prevention reference growth charts for age and sex (Grummer-Strawn et al., 2010). Children were categorized as with overweight if BMI ≥85th percentile and <95th percentile, and with obesity if BMI ≥95th percentile.
2.7.6. Process Outcomes
To assess the feasibility of the intervention components, attendance at intervention activities was assessed through attendance logs kept by intervention facilitators. Delivery logs for Meal Delivery and Ingredient Delivery were used to determine delivery success. Participant satisfaction was assessed through a series of questions specific to each intervention component (e.g., “How much do you think your family would like the food you tried in the cooking demonstration today?” for the Cooking Demonstration intervention component; “Did you find that your questions about how to feed your child healthy foods were answered?” for the Nutrition Education intervention component; “How much easier did the Simply Dinner (meal ingredients or meal) make dinner time for your family?”, for Ingredient Delivery and Meal Delivery). For those receiving meal delivery, questions were also asked at the end of the 8-week intervention duration (e.g., “What did you like most/least about getting the meals delivered each week” and “Why do you think some families might not want meals delivered to them each week?”). Participants also scored their overall satisfaction from 1 (not at all satisfied) to 5 (extremely satisfied). All process evaluation questions are available upon request.
2.8. Statistical Analysis
The main, additive, and interactive effects of the six intervention components were identified by means of a factorial experiment involving the following factors: 1) Cooking/Serving Resources (provided vs. not); 2) Meal Delivery (provided vs. not); 3) Ingredient Delivery (provided vs. not); 4) Community Kitchen (provided vs. not); 5) Nutrition Education Classes (provided vs. not); and 6) Cooking Demonstrations (provided vs. not). Pre- to post-intervention change scores were calculated for each intervention condition, and only complete pre-post data were included in analyses. Using Cohen’s d to assess effect sizes of pre-post changes for each primary and secondary outcome, results were categorized using the following a priori thresholds for interpretation and compared to the control condition: small (d=0.2), medium (d=0.50), and large (d=0.80) (Cohen, 1988). The decision-making process used to select the bundled intervention included first identifying the highest effect sizes for each condition and then considering feasibility results for each of the six intervention components.
After selecting the final bundled intervention combination, paired t-tests were conducted to examine pre- to post-intervention changes in the group that received that combination. Additionally, in an exploratory analysis that was not pre-specified, we estimated the effect of the pre-post change on food insecurity in the group receiving the final bundled intervention combination using relative risk (RR).
3. Results
3.1. Participants
Of the 674 families assessed for eligibility, 499 parent-child dyads provided consent and were randomized to one of 64 conditions (see Figure 2 for Consolidated Standards of Reporting Trials [CONSORT] diagram and section 2.1 for description of study design). Complete pre-post data was collected from 407 dyads. As shown in the “Total Sample” column of Tables 1a and 1b, the enrolled children were distributed nearly equally by sex, and with race and ethnicity reflecting the local Head Start population (42% White, 25% African American, 11% Hispanic). Mean (SD) child age was 4.1 (0.6) years. Mean (SD) age of the parents was 29.8 (6.8) years. Approximately half of parents had ≤ high school degree (49%); were unmarried/not in a committed relationship (48%); were not working outside the home (50%); and were food insecure (53%). The proportion categorized as overweight or obese was 35% for children and 71% for parents. The distribution of participant characteristics among groups receiving each experimental condition is also shown in Tables 1a and 1b.
Figure 2.

Participant/analytic sample flow diagram
Notes: The terminology “ON” or “OFF” refers to whether participants were randomized to receive that intervention component (ON) or not (OFF). The final analytic sample included n=407. Participants were excluded from the analysis if they had a missing value for at least one of the primary outcome variables in either the pre- or post-intervention time points, i.e., listwise deletion (n=27). The distribution of participants who were excluded from the analysis is shown here by intervention component.
Table 1a.
| Total Sample (n = 499) |
Cooking/Serving Resources | Meal Delivery | Ingredient Delivery | |||||||||||
|---|---|---|---|---|---|---|---|---|---|---|---|---|---|---|
| Provided | Not | Provided | Not | Provided | Not | |||||||||
| n | % | n | % | n | % | n | % | n | % | n | % | n | % | |
| Child Characteristics | ||||||||||||||
| Race and Ethnicity | ||||||||||||||
| White | 211 | 42.28 | 107 | 42.29 | 104 | 42.28 | 105 | 41.5 | 106 | 43.09 | 104 | 42.28 | 107 | 42.29 |
| African American | 125 | 25.05 | 65 | 25.69 | 60 | 24.39 | 59 | 23.32 | 66 | 26.83 | 65 | 26.42 | 60 | 23.72 |
| Biracial or Multiracial | 94 | 18.84 | 43 | 17.00 | 51 | 20.73 | 50 | 19.76 | 44 | 17.89 | 41 | 16.67 | 53 | 20.95 |
| Other Races Combined | 13 | 2.61 | 8 | 3.16 | 5 | 2.03 | 8 | 3.16 | 5 | 2.03 | 9 | 3.66 | 4 | 1.58 |
| Hispanic/LatinX | 56 | 11.22 | 30 | 11.86 | 26 | 10.57 | 31 | 12.25 | 25 | 10.16 | 27 | 10.98 | 29 | 11.46 |
| Sex (Female) | 245 | 49.10 | 117 | 46.25 | 128 | 52.03 | 120 | 47.43 | 125 | 50.81 | 130 | 52.85 | 115 | 45.45 |
| Weight Status (BMI Z-score Category) | ||||||||||||||
| Underweight | 6 | 1.29 | 1 | 0.42 | 5 | 2.19 | 1 | 0.42 | 5 | 2.18 | 2 | 0.88 | 4 | 1.67 |
| Normal | 295 | 63.30 | 157 | 65.97 | 138 | 60.53 | 148 | 62.45 | 147 | 64.19 | 140 | 61.67 | 155 | 64.85 |
| Overweight | 93 | 19.96 | 50 | 21.01 | 43 | 18.86 | 51 | 21.52 | 42 | 18.34 | 50 | 22.03 | 43 | 17.99 |
| Obese | 72 | 15.45 | 30 | 12.61 | 42 | 18.42 | 37 | 15.61 | 35 | 15.28 | 35 | 15.42 | 37 | 15.48 |
| Parent/Household Characteristics | ||||||||||||||
| Education Level | ||||||||||||||
| ≤High School Graduate | 242 | 48.50 | 115 | 45.45 | 127 | 51.63 | 119 | 47.04 | 123 | 50 | 118 | 47.97 | 124 | 49.01 |
| ≥Some College | 257 | 51.50 | 138 | 54.55 | 119 | 48.37 | 134 | 52.96 | 123 | 50 | 128 | 52.03 | 129 | 50.99 |
| Marital Status | ||||||||||||||
| Single | 237 | 47.98 | 118 | 46.83 | 119 | 49.17 | 110 | 43.82 | 127 | 52.26 | 117 | 47.95 | 120 | 48.00 |
| Married/Committed relationship | 257 | 52.02 | 134 | 53.17 | 123 | 50.83 | 141 | 56.18 | 116 | 47.74 | 127 | 52.05 | 130 | 52.00 |
| Household Food Security (Insecure) | 255 | 53.13 | 132 | 53.66 | 123 | 52.56 | 120 | 49.38 | 135 | 56.96 | 119 | 50.00 | 136 | 56.20 |
| Parent hours worked outside home | ||||||||||||||
| None | 247 | 50.00 | 136 | 53.97 | 111 | 45.87 | 131 | 52.19 | 116 | 47.74 | 133 | 54.51 | 114 | 45.60 |
| <40 (and >0) | 137 | 27.73 | 67 | 26.59 | 70 | 28.93 | 70 | 27.89 | 67 | 27.57 | 58 | 23.77 | 79 | 31.60 |
| ≥40 | 110 | 22.27 | 49 | 19.44 | 61 | 25.21 | 50 | 19.92 | 60 | 24.69 | 53 | 21.72 | 57 | 22.80 |
| Weight Status/BMI (kg/m2) Category | ||||||||||||||
| Underweight (<18.5) | 10 | 2.04 | 3 | 1.20 | 7 | 2.92 | 7 | 2.79 | 3 | 1.25 | 1 | 0.41 | 9 | 3.60 |
| Normal (18.5 to 24.9) | 133 | 27.09 | 75 | 29.88 | 58 | 24.17 | 61 | 24.30 | 72 | 30.00 | 65 | 26.97 | 68 | 27.20 |
| Overweight (25 to 29.9) | 112 | 22.81 | 54 | 21.51 | 58 | 24.17 | 59 | 23.51 | 53 | 22.08 | 57 | 23.65 | 55 | 22.00 |
| Obese (≥30) | 236 | 48.07 | 119 | 47.41 | 117 | 48.75 | 124 | 49.40 | 112 | 46.67 | 118 | 48.96 | 118 | 47.20 |
Sample size refers to child and one parent or caregiver who provided study data
Missing Values: n=33 Child Weight Status; n=5 Parent Marital Status; n=19 Food Security; n=5 Parent Hours Worked Outside House; n=8 Parent Weight Status
Note: Provided=Participants were randomized to intervention component; Not=Not randomized to intervention component
Table 1b.
| Total Sample (n = 499) |
Community Kitchen | Nutrition Education | Cooking Demonstration | |||||||||||
|---|---|---|---|---|---|---|---|---|---|---|---|---|---|---|
| Provided | Not | Provided | Not | Provided | Not | |||||||||
| n | % | n | % | n | % | n | % | n | % | n | % | n | % | |
| Child Characteristics | ||||||||||||||
| Race and Ethnicity | ||||||||||||||
| White | 211 | 42.28 | 99 | 40.24 | 112 | 44.27 | 99 | 39.44 | 112 | 45.16 | 104 | 41.27 | 107 | 43.32 |
| African American | 125 | 25.05 | 63 | 25.61 | 62 | 24.51 | 67 | 26.69 | 58 | 23.39 | 73 | 28.97 | 52 | 21.05 |
| Biracial or Multiracial | 94 | 18.84 | 51 | 20.73 | 43 | 17.00 | 44 | 17.53 | 50 | 20.16 | 40 | 15.87 | 54 | 21.86 |
| Other Races Combined | 13 | 2.61 | 7 | 2.85 | 6 | 2.37 | 7 | 2.79 | 6 | 2.42 | 10 | 3.97 | 3 | 1.21 |
| Hispanic/LatinX | 56 | 11.22 | 26 | 10.57 | 30 | 11.86 | 34 | 13.55 | 22 | 8.87 | 25 | 9.92 | 31 | 12.55 |
| Sex (Female) | 245 | 49.10 | 114 | 46.34 | 131 | 51.78 | 124 | 49.40 | 121 | 48.79 | 126 | 50.00 | 119 | 48.18 |
| Weight Status (BMI Z-score Category) | ||||||||||||||
| Underweight | 6 | 1.29 | 3 | 1.29 | 3 | 1.28 | 3 | 1.31 | 3 | 1.27 | 3 | 1.29 | 3 | 1.29 |
| Normal | 295 | 63.30 | 137 | 59.05 | 158 | 67.52 | 146 | 63.76 | 149 | 62.87 | 142 | 60.94 | 153 | 65.67 |
| Overweight | 93 | 19.96 | 49 | 21.12 | 44 | 18.80 | 45 | 19.65 | 48 | 20.25 | 48 | 20.60 | 45 | 19.31 |
| Obese | 72 | 15.45 | 43 | 18.53 | 29 | 12.39 | 35 | 15.28 | 37 | 15.61 | 40 | 17.17 | 32 | 13.73 |
| Parent/ Household Characteristics | ||||||||||||||
| Education Level | ||||||||||||||
| ≤High School Graduate | 242 | 48.50 | 128 | 52.03 | 114 | 45.06 | 125 | 49.80 | 117 | 47.18 | 124 | 49.21 | 118 | 47.77 |
| ≥Some College | 257 | 51.50 | 118 | 47.97 | 139 | 54.94 | 126 | 50.20 | 131 | 52.82 | 128 | 50.79 | 129 | 52.23 |
| Marital Status | ||||||||||||||
| Single | 237 | 47.98 | 110 | 45.08 | 127 | 50.80 | 117 | 47.18 | 120 | 48.78 | 123 | 49.60 | 114 | 46.34 |
| Married/Committed relationship | 257 | 52.02 | 134 | 54.92 | 123 | 49.20 | 131 | 52.82 | 126 | 51.22 | 125 | 50.40 | 132 | 53.66 |
| Household Food Security (Insecure) | 255 | 53.13 | 123 | 51.68 | 132 | 54.55 | 124 | 50.82 | 131 | 55.51 | 123 | 49.60 | 123 | 51.25 |
| Parent hours worked outside home | ||||||||||||||
| None | 247 | 50.00 | 119 | 48.77 | 128 | 51.20 | 125 | 50.40 | 122 | 49.59 | 111 | 44.76 | 136 | 55.28 |
| <40 (and >0) | 137 | 27.73 | 70 | 28.69 | 67 | 26.80 | 69 | 27.82 | 68 | 27.64 | 75 | 30.24 | 62 | 25.20 |
| ≥40 | 110 | 22.27 | 55 | 22.54 | 55 | 22.00 | 54 | 21.77 | 56 | 22.76 | 62 | 25.00 | 48 | 19.51 |
| Weight Status/BMI (kg/m2) Category | ||||||||||||||
| Underweight (<18.5) | 10 | 2.04 | 4 | 1.66 | 6 | 2.40 | 4 | 1.62 | 6 | 2.46 | 4 | 1.61 | 6 | 2.48 |
| Normal (18.5 to 24.9) | 133 | 27.09 | 60 | 24.90 | 73 | 29.20 | 76 | 30.77 | 57 | 23.36 | 67 | 26.91 | 66 | 27.27 |
| Overweight (25 to 29.9) | 112 | 22.81 | 62 | 25.73 | 50 | 20.00 | 58 | 23.48 | 54 | 22.13 | 57 | 22.89 | 55 | 22.73 |
| Obese (≥30) | 236 | 48.07 | 115 | 47.72 | 121 | 48.40 | 109 | 44.13 | 127 | 52.05 | 121 | 48.59 | 115 | 47.52 |
Sample size refers to child and one parent or caregiver who provided study data
Missing Values: n=33 Child Weight Status; n=5 Parent Marital Status; n=19 Food Security; n=5 Parent Hours Worked Outside House; n=8 Parent Weight Status
Note: Provided=Participants were randomized to intervention component; Not=Not randomized to intervention component
3.2. Selection of the Intervention Bundle
Because of the large number of potential comparisons in examining all the main, additive, and interactive effects for each of the 64 experimental conditions, we only present the main effects here. Table 2 presents the effect size (Cohen’s d) for the pre-post change in key primary and secondary outcomes by intervention component. The most robust effect sizes for study outcomes, however, were for combined intervention components including similar effect sizes for different combinations of the Ingredient Delivery, Cooking/Serving Resources and Meal Delivery components. Some combinations that included the Community Kitchen, Nutrition Education Classes, and Cooking Demonstrations components also had similar effect sizes, but because participation was low in those 3 intervention components (see section 3.4), they were not included in the final intervention bundle. Additionally, because the Ingredient Delivery component posed staff and participant feasibility challenges (see section 3.4), we did not include it in the final intervention bundle. The combination of Cooking/Serving Resources and Meal Delivery was selected as our final intervention bundle. Participants receiving this combination of intervention components (n=65) may have also received other intervention components; the breakdown is shown in Table 3.
Table 2.
Effect Size (Cohen’s d) Corresponding to Pre-Post Change in Key Outcome Measures by Intervention Component
| Change in frequency of parent and child eating together | Change in fruit and vegetable servings | Change in daily sugar-sweetened beverage servings | Change in frequency of making dinner mostly “from scratch” | Change in frequency of making dinner using only ready-made foods | Change in frequency of fast-food consumption for evening meal | |||||||
|---|---|---|---|---|---|---|---|---|---|---|---|---|
| (Cohen’s d) | (Cohen’s d) | (Cohen’s d) | (Cohen’s d) | (Cohen’s d) | (Cohen’s d) | |||||||
|
| ||||||||||||
| Factor | Provided | Not | Provided | Not | Provided | Not | Provided | Not | Provided | Not | Provided | Not |
| Cook/Serv Resources | 0.05 | 0.07 | −0.04 | −0.03 | −0.07 | 0.00 | 0.03 | −0.05 | −0.20 | −0.03 | −0.07 | 0.02 |
| Meal Delivery | 0.04 | 0.07 | −0.05 | −0.02 | −0.11 | 0.03 | 0.02 | −0.03 | −0.11 | −0.13 | −0.09 | 0.02 |
| Ingredient Delivery | 0.02 | 0.10 | −0.05 | −0.02 | −0.07 | 0.00 | −0.09 | 0.08 | 0.01 | −0.24 | 0.01 | −0.09 |
| Community Kitchen | −0.02 | 0.13 | −0.07 | 0.00 | −0.11 | 0.03 | −0.11 | 0.09 | −0.04 | −0.20 | −0.02 | −0.05 |
| Nutrition Education | 0.14 | −0.05 | −0.02 | −0.05 | 0.01 | −0.09 | −0.09 | 0.08 | −0.16 | −0.08 | −0.11 | 0.03 |
| Cooking Demonstration | −0.08 | 0.18 | 0.01 | −0.07 | −0.06 | −0.01 | −0.04 | 0.02 | −0.07 | −0.16 | 0.03 | −0.09 |
Notes: Provided=Participants were randomized to intervention component; Not=Not randomized to intervention component; Cook/Serv=Cooking/Serving
Table 3.
Intervention Conditions for Those Receiving Intervention Combinations that Included Cooking/Serving Resources + Meal Delivery (n=65)
| Intervention Condition | n (%) |
|---|---|
| Cooking/Serving Resources + Meal Delivery + Comm Kitchen + Educ + Cooking Demo | 6 (9%) |
| Cooking/Serving Resources + Meal Delivery + Comm Kitchen + Educ | 8 (12%) |
| Cooking/Serving Resources + Meal Delivery + Educ + Cooking Demo | 8 (12%) |
| Cooking/Serving Resources + Meal Delivery + Educ | 7 (11%) |
| Cooking/Serving Resources + Meal Delivery + Comm Kitchen + Cooking Demo | 9 (14%) |
| Cooking/Serving Resources + Meal Delivery + Comm Kitchen | 8 (12%) |
| Cooking/Serving Resources + Meal Delivery + Cooking Demo | 8 (12%) |
| Cooking/Serving Resources + Meal Delivery | 11 (17%) |
Note: Comm=Community; Educ=Nutrition Education Classes; Demo=Demonstration
3.3. Pre-Post Changes in Primary and Secondary Outcomes for the Bundled Intervention
Pre- and post- measures, effect sizes, and paired t-test results for the primary and secondary outcomes for the combination of Cooking/Serving Resources and Meal Delivery are shown in Table 4. For this intervention combination, small effect sizes were observed for increased family meal frequency (d=0.17) and cooking dinner from scratch (d=0.21), and decreased use/consumption of ready-made (d= −0.18) and fast foods (d= −0.23). Pre-post changes in the proxy indicators of diet quality were in the expected direction but negligible: increased fruit (d=0.12) and vegetable (d=0.07) intake and decreased intake of sugar sweetened beverages (d= −0.12). Pre-post changes for secondary outcomes included increased number of basic cooking utensils (d=0.46) and basic cookware items (d=0.47; as was expected given the provision of cooking/serving resources) and increased priority for family meals (d=0.23), as well as improved family functioning (d=0.37). There were no discernable pre-post changes in time scarcity and fatigue barriers or parental distress. When we restricted the analysis to the group of n=11 that received only Cooking/Serving Resources and Meal Delivery, results were unchanged, with the exception of a pre-post increase in sugar sweetened beverages consumption (d=0.28). Additionally, although not one of our pre-specified outcomes, Cooking/Serving Resources (RR=0.74) and Meal Delivery (RR=0.73) each were related to decreased food insecurity.
Table 4.
Simply Dinner Screening Phase Outcome Measures for the Intervention Combinations that Included Cooking/Serving Resources + Meal Delivery (n=65)
| Measure and Response Scale | Pre-Intervention Measure Mean (SD) | Post-Intervention Measure Mean (SD) | Effect Size Cohen’s d | Paired t-test P-Value |
|---|---|---|---|---|
|
Primary Outcomes
| ||||
| Family Meal Frequency | ||||
| Parent and Child Eating Together (0–7 d/wk) | 5.14 (2.46) | 5.53 (1.92) | 0.17 | 0.21 |
|
Proxy Indicators of Dietary Quality | ||||
| Daily fruit servings | 1.44 (0.82) | 1.54 (0.95) | 0.12 | 0.52 |
| Daily vegetable servings | 0.51 (0.37) | 0.54 (0.37) | 0.07 | 0.37 |
| Daily saturated fat (g) | 17.19 (8.29) | 17.60 (7.96) | 0.05 | 0.94 |
| Daily potato servings, include French fries | 0.24 (0.14) | 0.25 (0.17) | 0.05 | 0.54 |
| Daily sugar-sweetened beverage servings | 0.13 (0.21) | 0.10 (0.21) | −0.12 | 0.48 |
| Fruits + Vegetables combined | 1.94 (1.00) | 2.08 (1.16) | 0.12 | 0.38 |
| Fruits + Vegetables + Legumes combined | 1.98 (1.01) | 2.12 (1.17) | 0.13 | 0.35 |
| Whole grains | 0.61 (0.53) | 0.61 (0.52) | −0.01 | 0.76 |
|
Secondary Outcomes | ||||
| Meal Preparation Type | ||||
| Frequency of making dinner mostly “from scratch” (0–7 d/wk) | 3.97 (1.80) | 4.33 (1.67) | 0.21 | 0.14 |
| Frequency of making dinner using only ready-made foods (0–7 d/wk) | 2.40 (2.05) | 2.05 (1.74) | −0.18 | 0.15 |
| Frequency of fast-food consumption for evening meal (0–7 d/wk) | 1.30 (1.34) | 1.02 (1.13) | −0.23 | 0.08 |
|
Perceptions of Barriers to Mealtimes | ||||
| Time scarcity relative to meal planning (1 [low] to 5 [high]) | 2.51 (1.75) | 2.57 (1.51) | 0.03 | 0.98 |
| Time scarcity relative to meal preparation (1 [low] to 5 [high]) | 2.18 (0.95) | 2.14 (0.91) | −0.05 | 0.74 |
| Priority for Family Meals (1 [low] to 4 [high]) | 3.16 (0.54) | 3.28 (0.57) | 0.23 | 0.31 |
|
Family Functioning | ||||
| Parenting distress sum (higher scores reflect greater distress) (possible range 12 – 72) | 26.00 (7.77) | 25.73 (8.95) | −0.03 | 0.49 |
| Family functioning (lower scores reflect more optimal family functioning) (1 [more optimal] to 4 [less optimal]) | 1.68 (0.44) | 1.52 (0.43) | −0.37 | 0.007 |
|
Availability of Kitchen/Food Preparation Supplies | ||||
| Number of basic cooking utensils (possible range from 0 to 12) | 8.63 (2.39) | 9.67 (2.05) | 0.46 | 0.0009 |
| Number of basic cookware items (possible range from 0 to 8) | 5.56 (1.34) | 6.15 (1.19) | 0.47 | 0.0004 |
3.4. Participation as a Measure of Feasibility
Participant satisfaction as measured by qualitative and quantitative satisfaction surveys was generally very good with most participants very satisfied or extremely satisfied with intervention activities (data available upon request); however, participation differed dramatically by intervention component. Table 5 shows average participation rates for each intervention component. Not unexpectedly, a one-time provision of Cooking/Serving Resources had the highest participation rates, followed by weekly Meal and Ingredient Deliveries. The other 3 intervention components (Community Kitchen, Nutrition Education Classes, and Cooking Demonstrations) had poor participation rates (13%−15%, on average), and were, therefore, not considered viable considerations for inclusion in an Evaluation Phase. Ingredient Delivery, though it had high participation rates, posed feasibility challenges because preparation by intervention staff was extremely labor-intensive. As a result, Ingredient Delivery was also not considered a viable intervention component for inclusion in an Evaluation Phase.
Table 5.
Simply Dinner Screening Phase Participation by Intervention Component1
| Intervention Component | Total Assigned to Intervention Component n |
Average Participation or Attendance n |
Average Participation or Attendance % |
|---|---|---|---|
| Cooking/Serving Resources | 253 | 245 | 97 |
| Meal Delivery | 253 | 210 | 83 |
| Ingredient Delivery | 246 | 204 | 83 |
| Community Kitchen | 246 | 37 | 15 |
| Nutrition Education | 251 | 33 | 13 |
| Cooking Demonstration | 252 | 37 | 15 |
Although rare, there were times when delivery components failed if no one was home to receive components and/or participants requested pick up of deliveries but were not able to complete pick-ups.
4. Discussion
The main purpose of this report is to describe the Screening Phase results of a multiphase study where 64 experimental conditions were tested to identify the bundled intervention that showed the most promise for increasing family meal frequency and diet quality as an obesity prevention strategy. The objective of the Screening Phase of a MOST study design is to build an intervention that meets predetermined standards (Collins, 2018). Based on pre-post changes in primary and secondary outcomes (examining effect sizes only) as well as feasibility (evidenced primarily by participation rates), our selected intervention bundle included two of the six intervention components tested. The most intense intervention (weekly meal deliveries for a duration of 8 weeks), combined with the one-time provision of cooking and serving resources, was associated with a small increase in family meal frequency and making meals mostly from scratch and a decrease in use of fast foods and meals made from only ready-made products. This was accompanied by enhanced priority for family meals, perceived improvements in family functioning, and decreased food insecurity.
Providing families with healthy meals reduces the planning and preparation time and effort needed for implementing family meals, perhaps thereby increasing priority for and frequency of family meals. Families living in ongoing poverty may face more challenges that can impact the organization and implementation of family meals, including decisions about what foods to eat (Moss et al., 2014). Moreover, the increased burden of preparing meals in single-headed households and the demanding work schedules of low-income parents pose additional challenges that may impact family meals (Berge et al., 2013; Agrawal et al., 2018). Eliminating some barriers by providing healthy meals may be one strategy for promoting healthy family mealtimes.
Few studies have utilized meal delivery interventions as an obesity prevention strategy among families with children (Palakshappa et al., 2021), and no study to our knowledge has delivered meals to families with children as an intervention and assessed cooking behaviors as an outcome. It might not be expected that providing meal deliveries would increase cooking behaviors (e.g., cooking from scratch), but it does appear as though the provision of concrete material resources in the form of food and equipment may increase cooking, perhaps on days when there was no meal delivery. This is an interesting finding because we might have expected to only see these results with the Ingredient Delivery intervention component, in which families received ingredients and recipes to facilitate cooking. Ingredient delivery has been shown to increase cooking self-efficacy in adults (Horning et al., 2021) and has been shown to reduce some (but not all) barriers to home cooking among families with children (Oberle et al., 2020). An Australian study found that parents who participate in commercially available meal kits report less food-related decision making, enhanced opportunities for food literacy, and less food consumed away-from-home (Fraser et al., 2022), suggesting that ingredient delivery may increase cooking behaviors among those families who have access to commercial meal kit delivery services. Because we provided recipes with the Meal Deliveries, perhaps seeing the meals and having the recipes in hand—which were designed to have 5 or fewer ingredients and be ready in 30–45 minutes—increased cooking behaviors. Interestingly, our selected intervention bundle had a medium effect size improvement in the perception of family functioning, although it did not change self-reported parental distress or perceptions of time scarcity and fatigue as mealtime barriers. Family mealtimes have been associated with a greater sense of family togetherness and enjoyment (Byrd-Bredbenner et al., 2011). Hence, although the provision of meals and cookware resources may not be adequate to reduce stress in the parenting role, they may lessen family strains either through the provision of these concrete resources or via increased family meals.
In terms of feasibility relative to participant participation, Ingredient Delivery and Meal Delivery required the least energy and emotional resources from families—a fact that is likely very important for highly stressed families, and particularly for the more than half of the families in this study population who were food insecure. Participants who attended the Nutrition Education Classes, Community Kitchens, and/or Cooking Demonstrations reported high satisfaction levels; however, participation was so low that we could not actually test the effectiveness of the interventions. The results indicate that these three strategies may not be viable approaches, and the low feasibility speaks to what we hypothesized about the mental strain on impoverished families (e.g., Baumeister, 2003; Gandy et al., 2016)—the logistics of attending intervention activities may be just too much for impoverished families. Anecdotally, families told our intervention staff that multiple jobs, parenting demands, and time demands were significant barriers to participation, even though transportation and childcare were provided.
There are several limitations to this study. Our measure of family meal frequency was limited, and a more comprehensive measure may have uncovered intervention effects we did not detect. For example, the definition of family meals varies across families, and previous research suggests that those families with flexible definitions of family meals (e.g., including breakfast, lunch, and dinner as family meals, flexibility on location of meal in home, counting even short time frames together as family meals) may be more successful at achieving frequent family meals (Berge et al., 2018). We did not measure family meal rules/manners characteristic of healthy mealtimes (e.g., electronic use, parental feeding practices) which may have also changed based on the family’s involvement in the intervention (Berge et al., 2018). Additionally, while the parent and child may have achieved at least some meals together prior to the intervention due to the child’s young age and inability to prepare their own foods, it is possible that the intervention led to the inclusion of more family members at the meal, which could explain some of the improvement in family functioning. By measuring family meal frequency as the response to ““How many nights a week out of 7 did you and your child eat dinner together in the same place at home (such as around the table) for most of the meal?,” we do not have the specificity to assess these potential outcomes. Additionally, for the proxy measures of diet quality, we used a food screener, and unannounced dietary recalls may have provided more precise measurement of dietary intake.
Implementation of the 64 intervention combinations, which varied in level of complexity and resources, posed additional limitations to our study design. Particularly, Ingredient Delivery, Meal Delivery, and Cooking/Serving Resources were well-accepted as is indicated by high participation rates. As one would expect, these interventions were more resource and time intensive to implement by study staff when compared to less intensive (and less well-accepted) interventions like Nutrition Education Classes, Community Kitchens, and/or Cooking Demonstrations. Some logistical issues encountered were scheduling deliveries to families, families not being home to receive deliveries, and hiring and training staff to prepare meal and ingredient deliveries. Ingredient delivery was particularly staff-intensive with the meal preparation kits being more labor-intensive than meal preparation, which was why we did not choose it as part of the final bundled intervention. While our goal was to select a bundled combination of interventions that are both scalable and feasible, we realize that the intensive staff and material resources needed to implement Meal Delivery and Cooking/Serving Resources may be a barrier for implementation.
There are also several strengths to report for this study. First, because our intervention took place in communities of lower-income and was well-accepted by participants, which is evident by high participation rates, we conclude that our study has ecological validity. Second, the fact that our interventions were led by interventionists from the community is a significant strength for multiple reasons. Community-led interventions promote trust and understanding between the interventionist and the participant (Castillo et al., 2019) which may help alleviate barriers to participation and lead to more effective interventions. Additionally, utilizing skilled community members as interventionists enhances the intervention’s ability to be implemented in diverse, low-resource, and rural communities that may have limited access to highly trained clinician interventionists.
Importantly, the results presented here informed the design of the intervention arm for the Evaluation Phase of this multiphase study. Few studies have addressed barriers to mealtimes by providing practical resources to increase family meal frequency and improve children’s dietary quality. Results may inform policy and future research directions with the goal of reducing childhood obesity prevalence.
Acknowledgements:
The authors thank our partnering Head Start programs, teachers, and participating families.
Financial supports:
This work was funded by a grant to the second author from the United States Department of Agriculture (USDA) National Institute of Food and Agriculture/Agriculture and Food Research Initiative (NIFA/AFRI) [grant number 2015-68001-23239]. This work was partially supported by a NORC Center Grant # P30 DK072476 entitled “Nutrition and Metabolic Health Through the Lifespan” sponsored by NIDDK and by grant U54 GM104940 from the National Institute of General Medical Sciences, which funds the Louisiana Clinical and Translational Science Center.
Footnotes
Publisher's Disclaimer: This is a PDF file of an unedited manuscript that has been accepted for publication. As a service to our customers we are providing this early version of the manuscript. The manuscript will undergo copyediting, typesetting, and review of the resulting proof before it is published in its final form. Please note that during the production process errors may be discovered which could affect the content, and all legal disclaimers that apply to the journal pertain.
Declaration of Competing Interest: None.
Ethics of human subject participation: This study was conducted according to the guidelines laid down in the Declaration of Helsinki, and all procedures involving research study participants were approved by the research review boards at Michigan State University (Study ID: LEGACY14-1297) and the University of Michigan (Study eResearch ID: HUM00097848). Written informed consent was obtained from all participants prior to data collection.
Clinical Trials ID: NCT02487251
Head Start is a program of the United States Department of Health and Human Services that provides comprehensive early childhood education, health, nutrition, and parent involvement services to low-income children and families.
Extension Educators simplify education programs for specific audiences as part of the Cooperative Services division of the United States Department of Agriculture. They are trained to interpret research findings, develop educational materials suited for a given audience, and oversee educational programs from development to implementation.
REFERENCES
- Abidin RR (1990). Parenting Stress Index (PSI). Pediatric Psychology Press. [DOI] [PubMed] [Google Scholar]
- Agrawal T, Farrell TJ, Wethington E, & Devine CM (2018). “Doing our best to keep a routine:” How low-income mothers manage child feeding with unpredictable work and family schedules. Appetite, 120, 57–66. [DOI] [PubMed] [Google Scholar]
- Aljadani HM, Patterson A, Sibbritt D, Hutchesson MJ, Jensen ME, & Collins CE (2013). Diet quality, measured by fruit and vegetable intake, predicts weight change in young women. Journal of Obesity, 2013, 525161. 10.1155/2013/525161 [DOI] [PMC free article] [PubMed] [Google Scholar]
- Appelhans BM, Waring ME, Schneider KL, & Pagoto SL (2014). Food preparation supplies predict children’s family meal and home-prepared dinner consumption in low-income households. Appetite, 76, 1–8. [DOI] [PubMed] [Google Scholar]
- Bickel G, Nord M, & Hamilton W (2008). US Household Food Security Module: Three-Stage Design with Screeners. Washington, DC: USDA. [Google Scholar]
- Baumeister R (2003). The Psychology of Irrationality. The Psychology of Economic Decisions: Rationality and well-being. Oxford University Press. [Google Scholar]
- Berge JM, Hoppmann C, Hanson C, & Neumark-Sztainer D (2013). Perspectives about family meals from single-headed and dual-headed households: A qualitative analysis. Journal of the Academy of Nutrition and Dietetics, 113(12), 1632–1639. 10.1016/j.jand.2013.08.023 [DOI] [PMC free article] [PubMed] [Google Scholar]
- Berge JM, Draxten M, Trofholz A, Hanson-Bradley C, Justesen K, & Slattengren A (2018). Similarities and differences between families who have frequent and infrequent family meals: A qualitative investigation of low-income and minority households. Eating behaviors, 29, 99–106. [DOI] [PMC free article] [PubMed] [Google Scholar]
- Brophy-Herb HE, Horodynski M, Contreras D, Kerver J, Kaciroti N, Stein M, Lee HJ, Motz B, Hebert S, Prine E, Gardiner C, Van Egeren LA, & Lumeng JC (2017). Effectiveness of differing levels of support for family meals on obesity prevention among head start preschoolers: The simply dinner study. BMC Public Health, 17(1), 184. 10.1186/s12889-017-4074-5 [DOI] [PMC free article] [PubMed] [Google Scholar]
- Byrd-Bredbenner C, Abbot JM, & Cussler E (2011). Relationship of social cognitive theory concepts to mothers’ dietary intake and BMI. Maternal & Child Nutrition, 7(3), 241–252. 10.1111/j.1740-8709.2009.00232.x [DOI] [PMC free article] [PubMed] [Google Scholar]
- Castillo EG, Ijadi-Maghsoodi R, Shadravan S, Moore E, Mensah MO, Docherty M, … & Wells KB (2019). Community interventions to promote mental health and social equity. Current psychiatry reports, 21(5), 1–14. [DOI] [PMC free article] [PubMed] [Google Scholar]
- Cohen J (1988). Statistical Power Analysis for the Behavioral Sciences (2nd ed.). Lawrence Erlbaum Associates. [Google Scholar]
- Collins LM, Murphy SA, & Strecher V (2007). The multiphase optimization strategy (MOST) and the sequential multiple assignment randomized trial (SMART): New methods for more potent eHealth interventions. American Journal of Preventive Medicine, 32(5 Suppl), S112–118. 10.1016/j.amepre.2007.01.022 [DOI] [PMC free article] [PubMed] [Google Scholar]
- Collins LM. Optimization of behavioral, biobehavioral, and biomedical interventions: the multiphase optimization strategy (MOST). Switzerland: Springer International; 2018. [Google Scholar]
- Dwyer J, Needham L, Simpson JR, & Heeney ES (2008). Parents report intrapersonal, interpersonal, and environmental barriers to supporting healthy eating and physical activity among their preschoolers. Applied Physiology, Nutrition, and Metabolism = Physiologie Appliquee, Nutrition Et Metabolisme, 33(2), 338–346. 10.1139/H07-195 [DOI] [PubMed] [Google Scholar]
- Epstein NB, Baldwin LM, & Bishop DS (1983). THE McMASTER FAMILY ASSESSMENT DEVICE*. Journal of Marital and Family Therapy, 9(2), 171–180. 10.1111/j.1752-0606.1983.tb01497.x [DOI] [Google Scholar]
- Fraser K, Love P, Campbell KJ, Ball K, & Opie RS (2022). Meal kits in the family setting: Impacts on family dynamics, nutrition, social and mental health. Appetite, 105816. [DOI] [PubMed]
- Fulkerson JA, Neumark-Sztainer D, Story M, Gurvich O, Kubik MY, Garwick A, & Dudovitz B (2014). The Healthy Home Offerings via the Mealtime Environment (HOME) Plus study: Design and methods. Contemporary Clinical Trials, 38(1), 59–68. 10.1016/j.cct.2014.01.006 [DOI] [PMC free article] [PubMed] [Google Scholar]
- Gandy K, King K, Streeter Hurle P, Bustin C, & Glazebrook K (2016). Poverty and decision-making. How behavioral science can improve opportunity in the UK. London: Behavioural Insights Team. Microsoft Word - JRF FINAL VERSION 19.10.16 - with new graph (behaviouralinsights.co.uk) [Google Scholar]
- Grummer-Strawn LM, Reinold C, Krebs NF, & Centers for Disease Control and Prevention (CDC). (2010). Use of World Health Organization and CDC growth charts for children aged 0–59 months in the United States. MMWR. Recommendations and Reports: Morbidity and Mortality Weekly Report. Recommendations and Reports, 59(RR-9), 1–15. [PubMed] [Google Scholar]
- Hammons AJ, & Fiese BH (2011). Is frequency of shared family meals related to the nutritional health of children and adolescents? Pediatrics, 127(6), e1565–1574. 10.1542/peds.2010-1440 [DOI] [PMC free article] [PubMed] [Google Scholar]
- Horning ML, Hill T, Martin CL, Hassan A, Petrovskis A, & Bohen L (2021). The East Side Table Make-at-Home Meal-Kit Program is feasible and acceptable: A pilot study. Appetite, 160, 105087. [DOI] [PMC free article] [PubMed] [Google Scholar]
- Hunsberger M, O’Malley J, Block T, & Norris JC (2015). Relative validation of Block Kids Food Screener for dietary assessment in children and adolescents. Maternal & Child Nutrition, 11(2), 260–270. 10.1111/j.1740-8709.2012.00446.x [DOI] [PMC free article] [PubMed] [Google Scholar]
- Kasper N, Mandell C, Ball S, Miller AL, Lumeng J, & Peterson KE (2016). The Healthy Meal Index: A tool for measuring the healthfulness of meals served to children. Appetite, 103, 54–63. 10.1016/j.appet.2016.02.160 [DOI] [PMC free article] [PubMed] [Google Scholar]
- Martin-Biggers J, Spaccarotella K, Berhaupt-Glickstein A, Hongu N, Worobey J, & Byrd-Bredbenner C (2014). Come and get it! A discussion of family mealtime literature and factors affecting obesity risk. Advances in Nutrition (Bethesda, Md.), 5(3), 235–247. 10.3945/an.113.005116 [DOI] [PMC free article] [PubMed] [Google Scholar]
- Mazzeo SE, Kelly NR, Stern M, Gow RW, Serdar K, Evans RK, Jones RM, & Bulik CM (2012). Nourishing Our Understanding of Role Modeling to Improve Support and Health (NOURISH): Design and methods. Contemporary Clinical Trials, 33(3), 515–522. 10.1016/j.cct.2012.01.003 [DOI] [PMC free article] [PubMed] [Google Scholar]
- McCullough MB, Robson SM, & Stark LJ (2016). A Review of the Structural Characteristics of Family Meals with Children in the United States. Advances in Nutrition (Bethesda, Md.), 7(4), 627–640. 10.3945/an.115.010439 [DOI] [PMC free article] [PubMed] [Google Scholar]
- Moss DR, Ploof DL, & Reis EC (2014). Parent-Informed Anticipatory Guidance to Promote Family Meals. ICAN: Infant, Child, & Adolescent Nutrition, 6(3), 181–190. 10.1177/1941406414522509 [DOI] [Google Scholar]
- Neumark-Sztainer D, Story M, Hannan PJ, Perry CL, & Irving LM (2002). Weight-related concerns and behaviors among overweight and nonoverweight adolescents: Implications for preventing weight-related disorders. Archives of Pediatrics & Adolescent Medicine, 156(2), 171–178. 10.1001/archpedi.156.2.171 [DOI] [PubMed] [Google Scholar]
- Nicklas TA, & O’Neil CE (2015). Development of the SoFAS (solid fats and added sugars) concept: The 2010 Dietary Guidelines for Americans. Advances in Nutrition (Bethesda, Md.), 6(3), 368S–75S. 10.3945/an.114.007021 [DOI] [PMC free article] [PubMed] [Google Scholar]
- Oberle MM, Loth KA, Schendel A, Fox CK, & Gross AC (2020). Acceptance of a meal kit programme in an outpatient paediatric weight management clinic: A qualitative pilot study. Clinical obesity, 10(5), e12371. [DOI] [PubMed] [Google Scholar]
- Palakshappa D, Tam M, Montez K, Dezern K, Moore K, Best S, & Skelton JA (2021). Engaging Food Insecure Families on the Weekend to Improve Nutrition and Health. Progress in Community Health Partnerships: Research, Education, and Action, 15(4), 489–500. 10.1353/cpr.2021.0061 [DOI] [PMC free article] [PubMed] [Google Scholar]
- Quick BL, Fiese BH, Anderson B, Koester BD, & Marlin DW (2011). A formative evaluation of shared family mealtime for parents of toddlers and young children. Health Communication, 26(7), 656–666. 10.1080/10410236.2011.561920 [DOI] [PubMed] [Google Scholar]
- Storfer-Isser A (2013). Association of Maternal Employment with Attitudes, Subjective Norms, and Perceived Behavioral Control Regarding Meal Preparation Among Mothers of 4–5 Year Old Children. Bowling Green State University. [Google Scholar]
- Storfer-Isser A, & Musher-Eizenman D (2013). Measuring parent time scarcity and fatigue as barriers to meal planning and preparation: Quantitative scale development. Journal of Nutrition Education and Behavior, 45(2), 176–182. 10.1016/j.jneb.2012.08.007 [DOI] [PubMed] [Google Scholar]