Abstract
pH-responsive adsorbents are promising tools in water remediation as they possess selective adsorption towards cationic and anionic dyes, which can be controlled by varying the pH of the medium. In this study, a pH-responsive nanocomposite of polyaniline–sodium alginate (PANI/SA) was synthesized. The composite was found to be an efficient adsorbent for the removal of both cationic and anionic dyes from water at different pH values. The extent of adsorption was evaluated as a function of initial dye concentration, solution pH, temperature, contact time, dose of adsorbent and coexisting ions. The detailed investigation of kinetics and adsorption isotherm showed that the dyes adsorbed in accordance with pseudo-second order kinetic and Langmuir adsorption isotherms. The maximum adsorption capacities of the nanocomposite for Methylene blue (MB), Rhodamine B (RB), Orange-II (O-II), and Methyl orange (MO) dyes were found to be 555.5 mg g−1, 434.78 mg g−1, 476.19 mg g−1, and 416.66 mg g−1, respectively, which is higher compared to other reported adsorbents. The feasibility of the adsorption process was ascertained from thermodynamic parameters.
Polyaniline and sodium alginate nanocomposite was synthesized and it was used for selective removal of both cationic and anionic dyes from water at different pH.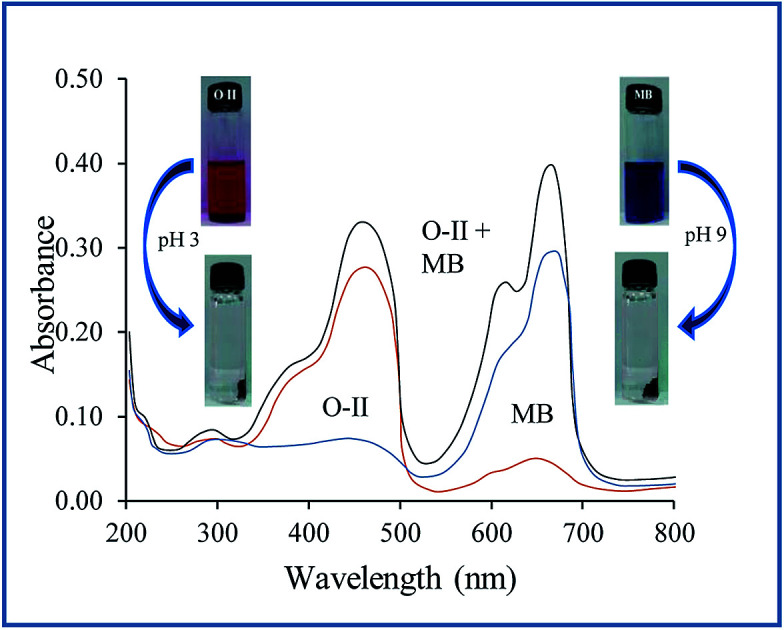
Introduction
The discharge of untreated industrial effluents from textile, paper, cosmetics, and leather industries causes damage to the aesthetic nature of the environment.1 The major constituent of these industrial wastes is dye, which is very difficult to degrade by natural processes.2 The non-degradable nature of dyes and their stability toward light and oxidizing agents make them very enduring pollutants that can have a highly toxic and carcinogenic effect on human health and the ecosystem.3 Therefore, it is pertinent to remove these dyes from the waste effluents to meet stringent environmental quality standards.4 Despite the fact that many emerging treatment methodologies like membrane separation, chemical oxidation, coagulation and electrochemical processes, have been employed to remove the dyes from waste-water, adsorption has gained much attention and is considered the most effective technique for the removal of pollutants due to its cost effectiveness and efficiency.5,6
Although activated carbon is most widely used as an adsorbent for the removal of dyes, there are some heeded drawbacks associated with it. For instance, the high cost of regeneration and non-selective nature make it economically not suitable for many applications. To circumvent these problems, polymeric materials are possible alternatives used as adsorbents due to their reusability, low cost, stability and comparatively quick processability.7–11
One of the fascinating properties possessed by adsorbents in wastewater treatment is selectivity towards only one dye. Although considerable effort has been given to develop polymeric adsorbents for the selective removal of one type of dye (either cationic or anionic), materials able to adsorb both cationic and anionic dyes selectively by changing the adsorption parameter (pH) are in continuous demand and rarely reported.12–16
Polyaniline (PANI), prepared from inexpensive monomer aniline, has attracted great interest from researchers because of their chemical and physical properties such as environmental stability, high electrical conductivity, easy synthesis and its numerous applications in plastic batteries, display devices and optical storage lithography.17 Composites of polyaniline and its copolymers have been used as potential adsorbents for the removal of dyes and toxic metal from water.18–21 Although the application of PANI for selective dye removal is well documented, the acidic conditions required for the preparation of doped PANI make it a less ecofriendly material.22
Sodium alginate (NaAlg) is an anionic natural macromolecule that is composed of poly-β-1,4 D-mannuronic acid (M units) and α-1,4 l-glucuronic acid (G units) in varying proportions through 1–4 linkages. Sodium alginate can be extracted from marine algae or produced by bacteria. In addition, it is abundant, non-toxic, renewable, water-soluble, biodegradable and biocompatible.23,24 Alginates are used in a range of biomedical applications, food, and pharmaceutical additives as a gelling agent. It accomplishes high mechanical as well as natural strength and possesses good stability in extreme functioning conditions.25
By incorporating sodium alginate into polyaniline, the cost as well as biodegradability and environmental issues can be addressed. Furthermore, different functional groups present in the polymeric nanocomposites can be tuned at different pH values, which makes it suitable for the selective adsorption of different dyes.
In this study, a polyaniline and sodium alginate composite is synthesized and employed for the selective removal of both cationic and anionic dyes from wastewater. The effect of various parameters such as pH, temperature, initial dye concentration and contact time on the adsorption process are analyzed. The effect of adsorption doses, kinetics of adsorption, and thermodynamic parameters were studied as well. To our delight, this material showed pH-responsive selectivity in dye removal from wastewater.
Experimental section
Materials
Sodium alginate (Lobachemie, India) and ammonium persulfate (APS) [(NH4)2S2O8] (Merck) were used as received. Aniline (Merck India) was distilled under vacuum before use. Methylene blue (MB) (Nice Chemicals, India), Rhodamine-B (RB) (Lobachemie, India), Methyl orange (MO) and Orange-II (O-II) (Acros Organic) were used as received.
Synthesis and characterization of PANI/SA nanocomposite
The PANI/SA nanocomposite was synthesized by a chemical oxidative polymerization method using APS as the oxidant with minor modification of the procedure reported elsewhere.26 In a typical method, 0.1 g of SA was dissolved in 200 mL of 0.1 M NaOH at 60 °C for 6 h. Then, 0.5 mL of aniline was added to the above solution at 35 °C with stirring for 1 h and the resulting solution was cooled to 0 °C. The pH value was adjusted to 7 by adding 0.1 M HCl, and then aqueous solution of APS (0.9 g of APS) along with 2 mL of 0.1 M HCl was added to the solution mixture at 0 °C, and stirred for 24 h. The resulting product was collected by centrifugation and washed with deionized water several times and finally, PANI/SA was dried at 50 °C in a vacuum desiccator. The nanocomposite was characterized by TGA, FTIR, X-ray diffraction (XRD), TEM and Scanning Electron microscopy (SEM). FTIR spectra were obtained by using a PerkinElmer Spectrum-2000 (FTIR) spectrophotometer between 400 and 4000 cm−1. The SEM measurements were carried out using the Zeiss EVO50 scanning electron microscope. The X-ray diffraction patterns were recorded on a Rigaku Miniflex II X-ray diffractometer using CuKα as the source. TEM images were observed on a Jeol JEM F-200 transmission electron microscope.
Adsorption & desorption experiment
1000 mg L−1 of stock solutions for MB, RB, O-II, and MO dyes were prepared and further diluted to different experimental concentrations. The experiments were performed with varying amounts of adsorbent, contact time, initial dye concentration, pH and temperature in the thermodynamics, adsorption isotherm and adsorption kinetics studies. In a distinctive experiment, 0.1 g of PANI/SA nanocomposite was added to 100 mL of different dye solutions of different initial concentrations (100–1000 mg L−1) and stirred. Samples were collected at different time intervals and the dye concentration of each experimental solution before and after adsorption was evaluated using a calibration curve plotted with UV-vis spectroscopy. The % removal of dye was determined using the equation (C0 − Ce)/C0 × 100 and at equilibrium the amount of dye adsorbed was evaluated by (C0 − Ce) × V/M, where C0 (mg L−1) and Ce (mg L−1) are the initial and final concentration of dye solutions, respectively. V (mL) and W (g) are the volume of the dye solution and the weight of the PANI/SA nanocomposite, respectively.
Selective adsorption of cationic and anionic dyes
The selective separation of cationic and anionic dyes from a mixture of dyes is very essential from an industrial point of view.27 The selective removal of individual dyes from a mixture of dye solution was carried out under optimum conditions. Individual stock solutions of MB (500 mg L−1), RB (500 mg L−1), MO (500 mg L−1), and O-II (500 mg L−1) were prepared in 500 mL volumetric flasks. These solutions were used for preparation of two different mixtures of dye solutions. The dye solutions were used in mixture 1 (MB and O-II) and mixture 2 (MO and RB), respectively. From the 100 mL dye mixture, 50 mL of each individual dye was taken for analysis. The selective removal was performed for mixture 1 and mixture 2 at their corresponding optimized condition. After centrifugation, the sample solutions were analysed using UV-vis spectroscopy.
Regeneration study via desorption
The desorption experiments were conducted with dye-loaded PANI/SA nanocomposite, in which the PANI/SA nanocomposite was treated with dye for 4 h. After adsorption of dye, the PANI/SA samples were removed by centrifugation and washed with distilled water several times and finally dried under vacuum. Adsorbed dye was desorbed by maintaining the pH of the respective dye solutions. The solution pH was adjusted by adding 0.1 M NaOH and 0.1 M HCl. For pH adjustment, a stock solution of 0.1 M NaOH and 0.1 M HCl was prepared, which were further diluted 10–20 times (as required) before adding them in the system. For the desorption study, optimized dye concentrations of cationic (MB, RB) and anionic (MO, O-II) dyes were used. The weighed amount of adsorbent was added into the dye solutions. The desorption study was continued until the dyes were stripped out in the solution phase at different pH values.
Results and discussion
Characterization of polyaniline–sodium alginate (PANI/SA) nanocomposite
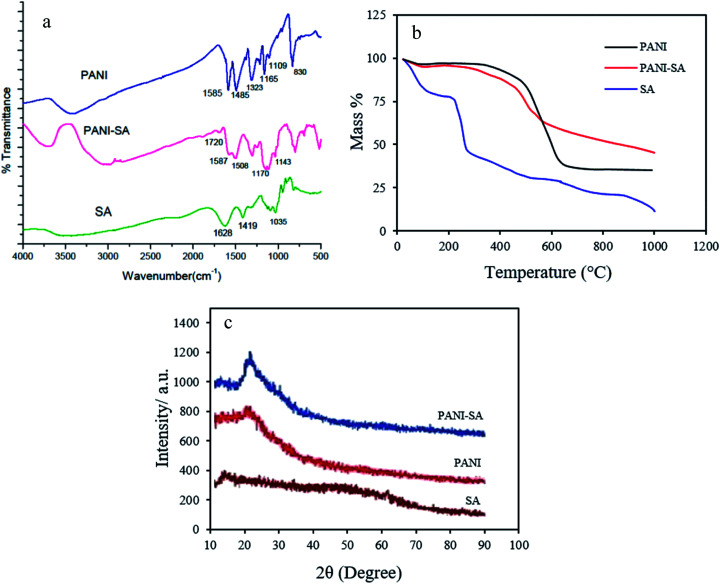
The FTIR spectra for pure PANI, SA and PANI/SA are given in Fig. 1a. The characteristic peaks of SA appearing at 1628, 1419, and 1035 cm−1 are attributed to the stretching of –COO– (asymmetric), –COO– (symmetric), and C–O–C, respectively.28 For PANI, the band at 1585 cm−1 and 1485 cm−1, arises from both C C stretching of the quinoid and benzenoid unit, respectively. C–N and C N stretching vibrations correspond to the peaks at 1323 and 1109 cm−1. The FTIR spectrum of PANI/SA is similar to that of pure PANI. The spectrum of the PANI/SA nanocomposite exhibits a band at 1720 cm−1 due to the asymmetric stretching of –COO– groups present in SA.29 This –COO– stretch peak exhibits a large shift to higher wavenumbers, as well as a decrease in intensity. The results confirm that the conducting polymer is successfully introduced onto the SA surface.
Fig. 1. (a) FTIR spectra (b) TGA curve (c) XRD of pure PANI, SA and PANI/SA.
The thermal properties of polymers and the polymeric composite were evaluated by thermo gravimetric analysis under N2 atmosphere at the heating rate of 10 °C min−1 up to 1000 °C. The thermograph is depicted in Fig. 1b. It is obvious that there is a significant change in the thermal stability of SA when unified with PANI. The PANI shows an initial weight loss around 100 °C, which is caused by the loss of absorbed water. The PANI is stable up to ∼420 °C, above which temperature the polymer begins to decompose.30 The thermograph of SA shows two stages of mass% loss. SA shows a mass loss beginning at 95 °C that is attributed to the loss of absorbed water. The peak at 238 °C corresponds to the thermal degradation of the intermolecular chain.31 In the PANI/SA nanocomposite, an additional important weight loss of about 10–15% between 200 and 300 °C can be observed. A larger mass loss of the PANI/SA nanocomposite begins at 400 °C. As shown in Fig. 1b, it is understood that the thermal stability and the temperature for maximum weight loss of the PANI/SA nanocomposite is between those of SA and PANI.
The XRD patterns of pure PANI, SA, and PANI/SA are shown in Fig. 1c. One typical peak at 2Θ = 25° is observed for pure PANI. This peak may be ascribed to the periodicity parallel to the polymer chain.32 The diffraction of SA shows typical peaks around 14°.33 The spectrum for the PANI/SA nanocomposite clearly reveals two new diffractions (namely, at 2Θ = 14° and 23°). The new additional ordered structure is introduced by SA. Furthermore, the diffraction intensities of new peaks at around 2Θ = 14° and 23° increase considerably in the PANI/SA nanocomposite and become the dominant feature in the composites.
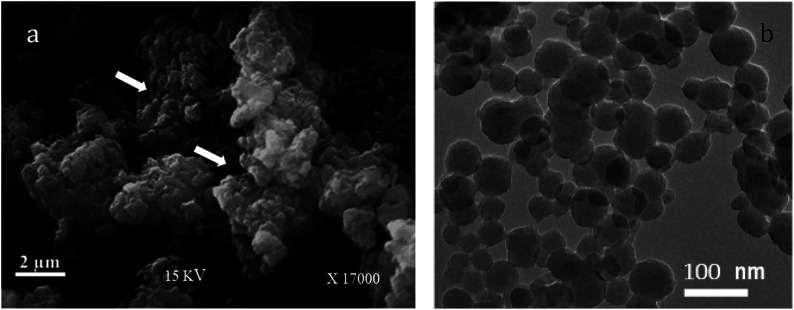
Fig. 2a shows the surface morphology of the PANI/SA nanocomposite. From the existing micrographs, it can be seen that both bigger and smaller spherical particles are formed, which are agglomerated during the process of washing and drying. The pores present in the structure are shown in Fig. 2a (marked by arrow) are desired for adsorption.34 The TEM image (Fig. 2b) of PANI/SA nanocomposites shows a uniform distribution of smaller and bigger spherical paricles with diameters ranging from 50 to 90 nm. A histogram based on the TEM measurement was plotted and is shown in Fig. S1(ESI).† It is speculated that the nanoscale size of PANI/SA can make it a promising candidate for the adsorption of dyes.
Fig. 2. (a) SEM image (b) TEM image of PANI/SA composite.
Adsorption optimizations
The removal of dyes from water using adsorbents depends on temperature, solution pH, added salt, contact time, temperature, adsorbent dosage and initial dye concentration. The extents of dye adsorption from aqueous solution were studied by using different kind of dyes like cationic (Methylene blue, Rhodamine-B) and anionic (Orange-II, Methyl orange) dyes with variation of pH, contact time, temperature, adsorbent dosage and dye concentration. All the parameters were optimized to have the best adsorption conditions.
Effect of pH
Since pH is an important factor for determining the adsorption of dyes, adsorption experiments were performed in the entire range of pH from 2 (acidic) to 11 (basic) adjusted by adding 0.1 M HCl and 0.1 M NaOH, respectively.
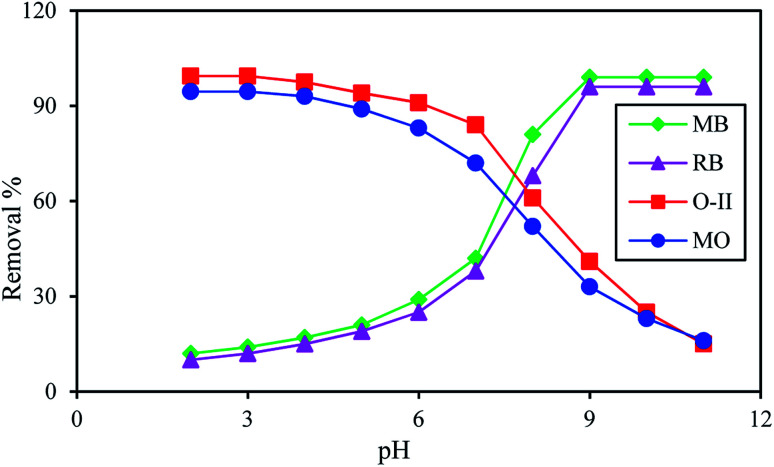
Fig. 3 reveals that a maximum dye removal was observed for O-II (99.4%), MO (94.5%) at pH 3 and for MB (99.1%), RB (96%) at pH 9. Beyond pH 9 and pH 3 the removal of dye is constant. In an acidic environment, the composite was protonated and the surface of the adsorbent is positively charged, leading to the maximum adsorption of anionic dyes. Under alkaline conditions, because of the deprotonation of carboxylic acid groups of the composite, the numbers of negatively charged sites increases, resulting in a higher percentage of adsorption of cationic dye molecules. The formation of an ionic complex between cationic or anionic dyes with the negatively or positively charged surface of PANI/SA, respectively, under different environment is responsible for the high adsorption efficacy. The surface charge was evaluated by measuring the zeta potential (Fig. S2, ESI†). The result indicated that the point of zero charge of the composite (pHpzc) is 7.3. Thus, the composite carries a positive surface charge at pH < 7.3 and negative surface charge at pH > 7.3. Therefore, the electrostatic force of attraction is responsible for the removal of anionic dyes in an acidic medium and cationic dyes in a basic medium.
Fig. 3. % removal of dyes as a function of pH in presence of 0.1 g L−1 of adsorbent at 35 °C; dye concentration 500 mg L−1; contact time 4 h.
The dye removal efficiency of the synthesized PANI/SA nanocomposite was compared with PANI in the presence of both cationic (MB, RB) and anionic dyes (O-II, MO) at pH 9 and pH 3, respectively, by using 500 mg L−1 dye solution at 35 °C. It was observed that at this experimental condition, there is no significant adsorption of dyes O-II (13%), MO (11%) and MB (11%), RB (10%) when PANI is used as the adsorbent. This result confirms the superiority of PANI/SA over PANI.
Effect of contact time
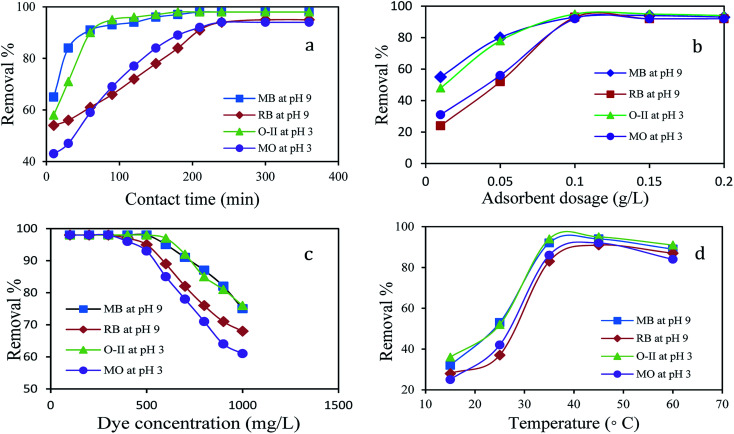
The adsorption study was performed with variable contact times for MB, RB, O-II, and MO dyes. As shown in Fig. 4a, the initial rate of dye uptake for both cationic and anionic dye increased sharply and within 90 min, 93% of MB and 95% of O-II are removed at their respective pH and after that, the percentage of removal slowly increased and reached a maximum within 210 min. Likewise, there was a sharp uptake of RB (93%) and MO (92%) dyes within 210 min and then slow adsorption of dyes occurs to reach the maximum within 240 min. Thus, the efficient and rapid adsorption for MB and O-II revealed that a quick monolayer formation occurred on the external surface of adsorbent. After the initial rapid adsorption, the dye adsorption rate was controlled by mass transport in the nanocomposite. It is observed that the adsorption of O-II and MB are faster than MO and RB in their respective pH and the reason for this observation is discussed in detail in the plausible mechanism section.
Fig. 4. Effect of (a) contact time (dye: 500 mg L−1; adsorbent: 0.1 g L−1; temp: 35 °C) (b) adsorbent dosage (dye: 500 mg L−1; time: 4 h; temp: 35 °C) (c) initial dye concentration (time: 4 h; adsorbent: 0.1 g L−1; temp: 35 °C) (d) temperature (dye: 500 mg L−1; adsorbent: 0.1 g L−1; time: 4 h) on removal% of dyes.
Effect of adsorbent dosage
The effect of the adsorbent mass usually determines the solid adsorbent's capacity for a given initial concentration of adsorbate in a solution. The amount of adsorbent dosage played a crucial role in the dye removal process. A plot of dye removal (%) against adsorbent dosage (g L−1) is shown in Fig. 4b. The extent of adsorption increased consequently with the increase of dosage. The adsorption efficiency showed no obvious change when the dosage exceeded 0.1 g L−1 for O-II, MB, MO and RB and the dosage of 0.1 g L−1 was found to be the optimal dose for the adsorption at their respective pH.
Effect of initial dye concentration
The effect of the initial concentration of dye on the adsorption capacity was investigated in a range from 100 to 1000 mg L−1 at the respective optimal pH of dyes for 4 h as it is an important driving force to overcome the mass transfer resistance of the dye from the aqueous to the solid phase. Fig. 4c shows the effect of initial dye concentration on the percentage of removal of dyes using 0.1 g L−1 of PANI/SA nanocomposite. With an increase in the initial dye concentration, the percentage of dye removal decreased for a particular time. At lower concentrations, the maximum number of dye molecules was easily adsorbed on the available surface of the PANI/SA nanocomposite. This phenomenon is responsible for higher adsorption efficacy. At higher dye concentrations, the saturation of the surface active sites was responsible for the lower percentage of dye adsorption. The removal efficiency of all dyes was nearly 98% at the low initial concentration, however at higher concentration, removal of MB and O-II is much higher than those with RB and MO dyes, which is probably due to the molecular structure of MB and O-II that facilitate the easier approach of these dyes to the adsorption sites of the PANI/SA nanocomposite.
Effect of temperature
Fig. 4d explains the effect of temperature on the removal of dyes. The removal efficiency of the MB dye increases from 32% to 94% with an increase of temperature from 15 to 35 °C. With the increase in temperature, the mobility of respective dyes was enhanced and it also provided sufficient energy to the dye molecules to interact with the available active sites of adsorbent molecule. This results in an increase of the dye adsorption. However, at higher temperature, desorption may predominate during the adsorption process due to violent molecular motion that resulted in decreased adsorption capacity. Thus, the temperature was kept at 35 °C for other investigations in this work.
Selective adsorption
For selective adsorption, mixture 1 (MB and O-II) was taken for analysis. After 90 min of contact of mixture 1 with the PANI/SA nanocomposite, the residual concentration of both the dyes was measured using UV-vis spectroscopy (Fig. 5a). Before adsorption, two absorption peaks are observed for O-II and MB at 485 nm and 663 nm, respectively. The peak for O-II vanishes at pH 3, indicating that almost 99.4% of O-II is removed. At this condition, only ∼14% of MB dye was adsorbed, which is reflected in the UV-vis spectrum. It was noticed that (Fig. 5b) when mixture 2 (MO and RB) was taken for selective adsorption, 96% of RB is removed and only 20% of MO is removed at pH 9. All of the above experimental findings indicate that the pH value triggered selective cationic or anionic adsorption properties of the synthesized nanocomposite. The selective adsorption of MO at pH 3 and RB at pH 9 from a mixed solution of MO and RB as well as the selective removal of O-II at pH 3 and MB at pH 9 from a mixed solution of O-II and MB confirmed that the synthesized nanocomposite is able to adsorb one dye selectively from a mixture.
Fig. 5. pH-dependent selective removal of dyes from mixture of (a) MB/O-II (b) RB/MO (dye: 500 mg L−1; adsorbent: 0.1 g L−1; time: 4 h; temp: 35 °C).
Effect of coexisting ions
The effect of ionic strength on the removal efficiency of MB and O-II was investigated using mono and divalent salts like sodium chloride (NaCl), magnesium chloride (MgCl2), magnesium sulphate (MgSO4), and sodium sulphate (Na2SO4), as shown in Fig. S3a and b (ESI).† The removal efficiencies of dyes decreased with the increase of ion concentrations from 1 to 10 mmol L−1 in the dye solutions. This result could be explained by a competitive effect between salt cations and cationic dyes with the negatively charged surface of adsorbent at pH 9. Similar results were reported for the removal of MB and MV (methyl violet) using a nanocomposite of hydrolyzed polyacrylamide grafted xanthan gum and incorporated nanosilica.35 With increasing salt contents, the ionic atmosphere around the cationic dye helps in enhancing the shielding of the charge of the cationic dye molecule, which reduces the adsorption rate.36,37 This result indicated that the adsorption might result from the electrostatic interactions between the adsorbents and the dye molecules.35,37,38 Similarly, removal of anionic dyes decreases with increasing concentrations of ions.
Desorption and reuse of PANI/SA
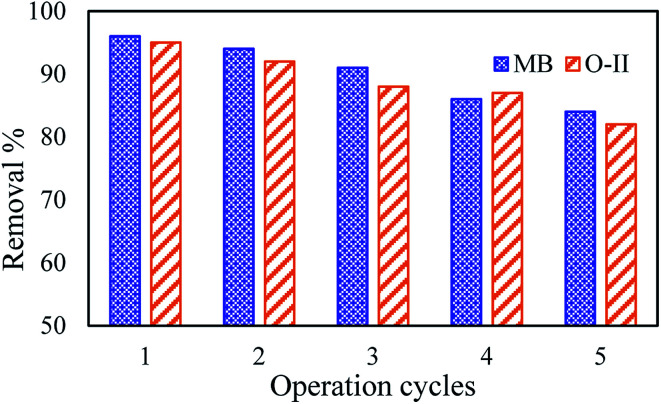
An adsorbent with good regeneration capacity can reduce pre-treatment costs and improve the reusability of an adsorbent, which is of critical significance in practical applications for dye removal from wastewaters. Therefore, the adsorption capacity of dyes onto the PANI/SA composite at their respective pH was determined by repeated adsorption–desorption cycles (Fig. 6). Consecutive adsorption–desorption cycles were repeated five times using the same adsorbent. On the basis of the data obtained from the present investigation, the removal efficiency of dyes gradually decreases after two successive adsorption–desorption cycles.
Fig. 6. Concentration profile of MB and O-II at different consecutive cycles at pH 9 and pH 3, respectively.
Kinetics of adsorption
In order to design a fast and effective model, investigation of the adsorption kinetics is important. Several kinetics model (Fig. S4, ESI†) such as pseudo-first order, pseudo-second order and intraparticle diffusion models were used to examine the controlling mechanism of the adsorption process.39,40
The kinetics data were analyzed by pseudo-first order, pseudo-second order, and intraparticle diffusion models by using eqn (1)–(3), respectively.
| ln(qe − qt) = ln qe − k1t | 1 |
| t/qt = 1/k2qe2 + 1/qet | 2 |
| qt = kit1/2 + C | 3 |
where k1, k2, ki are the pseudo-first order rate constant (min−1), pseudo-second order rate constant (g mg−1 min−1), intraparticle diffusion rate constant (mg g−1 min−1/2) for the adsorption process, respectively. qe and qt are the adsorption capacity of dye molecules onto the PANI/SA composite at equilibrium (mg g−1) and at time t, respectively. C (mg g−1) is the constant and t is the time (min).
The intraparticle diffusion model explains the boundary layer effect on adsorption. The value of the intercept is related to the thickness of the boundary layer, i.e., larger intercepts result in a greater boundary layer effect.
The R2 values demonstrate that the pseudo-first order and intraparticle diffusion kinetic models do not play a significant role in the uptake of the dye by PANI/SA. The linear fit between the t/qtversus contact time (t) and the calculated R2 value for the pseudo-second order kinetic model shows that dye removal kinetics can be approximated as pseudo-second-order kinetics. In addition, the experimental qe (qe, exp) values agree with the calculated ones (qe, cal), obtained from the linear plots of the pseudo-second order model (Table 1).36
Modelling of the adsorption kinetics of RB, MB, O-II and MO at 35 °C.
| Dye | Co (mg L−1) | q e, exp (mg g−1) | Pseudo-first order kinetics | Pseudo-second order kinetics | Intra-particle diffusion | ||||||
|---|---|---|---|---|---|---|---|---|---|---|---|
| K 1 × 10² (min−1) | q e, cal (mg g−1) | R 2 | K 2 × 10⁴ (g mg−1 min−1) | q e, cal (mg g−1) | R 2 | K i (mg g−1 min−1/2) | C | R 2 | |||
| MB | 100 | 49.49 | 2.54 | 50 | 0.9584 | 42.30 | 50 | 0.9995 | 3.32 | 19.96 | 0.6709 |
| 500 | 231.47 | 3.95 | 238 | 0.9842 | 0.94 | 137 | 0.9840 | 12.85 | 8.24 | 0.9672 | |
| 1000 | 481.01 | 0.65 | 474 | 0.9944 | 0.32 | 556 | 0.9995 | 49.05 | 93.53 | 0.9756 | |
| RB | 100 | 48.42 | 2.66 | 55 | 0.9655 | 49.42 | 49 | 0.9995 | 3.14 | 20.78 | 0.6357 |
| 500 | 219.91 | 1.45 | 318 | 0.8244 | 0.38 | 217 | 0.9903 | 12.85 | 8.24 | 0.9672 | |
| 1000 | 430.45 | 0.81 | 441 | 0.9964 | 0.52 | 435 | 0.9965 | 36.81 | 27.01 | 0.9359 | |
| O-II | 100 | 49.49 | 2.67 | 38 | 0.9541 | 58.82 | 50 | 0.9998 | 2.61 | 25.99 | 0.7126 |
| 500 | 228.30 | 1.43 | 302 | 0.8186 | 0.37 | 227 | 0.9954 | 12.51 | 27.54 | 0.8969 | |
| 1000 | 452.01 | 0.77 | 454 | 0.9924 | 0.47 | 455 | 0.9973 | 36.11 | 15.723 | 0.9362 | |
| MO | 100 | 46.5 | 2.59 | 65 | 0.9195 | 25.22 | 48 | 0.9991 | 3.72 | 11.943 | 0.8131 |
| 500 | 211.53 | 1.26 | 282 | 0.8953 | 0.36 | 213 | 0.9732 | 13.18 | 2.2569 | 0.9332 | |
| 1000 | 411.33 | 0.78 | 440 | 0.9922 | 0.45 | 417 | 0.9962 | 35.27 | 41.398 | 0.9426 | |
Adsorption isotherm
The adsorption isotherm provides evidence in support of the mass of the solute adsorbed per unit mass of adsorbent from the liquid phase at equilibrium. It provides information on the efficiency of a given adsorbent with respect to the competing solute in the solution. Three important isotherms, the Langmuir, Freundlich and Temkin adsorption model, were used to fit the experimental data shown in eqn (4)–(6), respectively.36,41
 |
4 |
| qe = KFCe1/n | 5 |
| qe = RT/b ln(KTCe) | 6 |
where KL (L mg−1) is the Langmuir constant and Qmax (mg g−1) corresponds to the maximum Langmuir monolayer adsorption capacity. qe is the quantity of dye per mass of adsorbate at equilibrium (mg g−1), Ce is the concentration at equilibrium, KF is the Freundlich constant that is indicative of adsorption capacity and n is the Freundlich constant (index of adsorption intensity or surface heterogeneity). KT is the equilibrium binding constant (L mg−1) corresponding to the maximum binding energy and constant B1 = RT/b is related to the heat of adsorption (J mol−1). The R and T are the gas constant (8.314 J mol−1 K−1) and the absolute temperature (in Kelvin), respectively.
The essential feature of the Langmuir isotherm can be expressed in terms of a dimensionless constant called the separation factor (RL also known as equilibrium parameter), which is defined by eqn (7).42
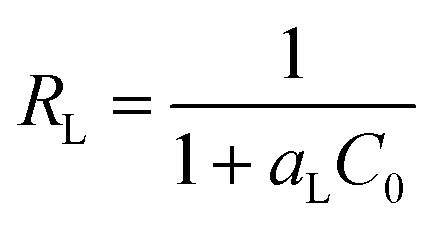 |
7 |
where Co is the initial concentration (mg L−1) and aL is the Langmuir constant related to the energy of adsorption (L mg−1) calculated from the slope of the Langmuir isotherm. The value of RL corresponds to the shape of the Langmuir isotherm, which can be either unfavourable (RL > 1), linear (RL = 1), favourable (RL < 1), or irreversible (R = 0).43 The Langmuir, Freundlich and Temkin isotherms fitting of the experimental data for the dyes are shown in Fig. S5 (ESI†) and the corresponding parameters Qmax, KL, RL,KF, n and R2 are given in Table 2. It can be seen that the R2 value for the Langmuir model is closer to one, indicating that the Langmuir adsorption model is the best model among the three models to explain the adsorption process of both the dyes. These results indicate that the adsorption of dyes take place at specific homogeneous sites and a single layer adsorption on the composite surface. Since the value of 1/n is less than 1, the adsorption of dyes on the composite surface is favourable. Finally, the Qmax for all the dyes at 308 K were calculated and found to be 555.5 mg g−1 for MB, 434.78 mg g−1 for RB, 476.19 mg g−1 for O-II and 416.66 mg g−1 for MO. To better understand the versatility of the adsorbent, it is compared with a few pH sensitive adsorbents reported in the literature (Table-S1, ESI†). It was observed that the adsorption capacity of the composite was found to be relatively higher than the other reported materials.14–16 While the adsorption capacity of the composite is slightly lower in comparison to the material reported by Sarkar et al., it is more suitable as it is a green and low cost adsorbent.13 This result indicates that the composite is a versatile adsorbent for the removal of both cationic and anionic dyes.
Parameters of the Langmuir, Freundlich and Temkin isotherm models at 35 °C.
| Dye | Langmuir adsorption isotherm | Freundlich adsorption isotherm | Temkin adsorption isotherm | |||||||
|---|---|---|---|---|---|---|---|---|---|---|
| Q max (mg g−1) | K L (L mg−1) | R L | R 2 | n | K F (L mg−1) | R 2 | K T (L mg−1) | B 1 (J mol−1) | R 2 | |
| MB | 555.55 | 0.22 | 0.0046 | 0.9985 | 3.99 | 174.38 | 0.9516 | 54.97 | 79.89 | 0.9705 |
| RB | 434.78 | 0.17 | 0.0081 | 0.9936 | 3.98 | 148.79 | 0.9866 | 16.68 | 77.64 | 0.9764 |
| O-II | 476.19 | 0.14 | 0.0095 | 0.9928 | 3.35 | 119.06 | 0.9516 | 2.09 | 91.30 | 0.9233 |
| MO | 416.66 | 0.02 | 0.0506 | 0.9899 | 1.54 | 14.49 | 0.9476 | 63.36 | 112.85 | 0.9105 |
Thermodynamic parameters
The value of enthalpy change (ΔH0) and entropy change (ΔS0) were calculated from the van't Hoff eqn (8).
 |
8 |
| Kd = qe/Ce | 9 |
where, Kd (eqn (9)) is the equilibrium constant, qe is the amount of dye adsorbed at equilibrium (mg g−1), Ce is the concentration at equilibrium (mg L−1), R is the ideal gas constant (8.314 J mol−1 K−1) and T is the temperature in Kelvin. Values of ΔH0 and ΔS0 (Table 3) were calculated from the slope and intercept of van't Hoff plots of ln Kdversus 1/T (Fig. 7a).
Thermodynamic parameters for the adsorption of dyes onto PANI/SA nanocomposite.
| Dye | T | ΔG0 (kJ mol−1) | ΔH0 (kJ mol−1) | ΔS0 (kJ mol−1 K−1) | Dye | T | ΔG0 (kJ mol−1) | ΔH0 (kJ mol−1) | ΔS0 (kJ mol−1 K−1) |
|---|---|---|---|---|---|---|---|---|---|
| MB | 288 | −1.25 | 57.36 | 0.21 | O-II | 288 | −2.35 | 71.17 | 0.25 |
| 298 | −2.35 | 298 | −6.85 | ||||||
| 308 | −6.75 | 308 | −8.06 | ||||||
| 318 | −9.82 | 318 | −9.87 | ||||||
| RB | 288 | −2.35 | 77.77 | 0.28 | MO | 288 | −1.21 | 68.02 | 0.24 |
| 298 | −6.85 | 298 | −3.72 | ||||||
| 308 | −9.81 | 308 | −6.53 | ||||||
| 318 | −16.24 | 318 | −8.27 |
Fig. 7. (a) Plots ln Kdvs. 1/T (b) ln k vs. 1/T for the adsorption of dyes onto PANI/SA.
The values of Gibb's free energy (ΔG0) at different temperatures were calculated according to eqn (10).
| ΔG0 = −RT ln Kd | 10 |
The negative value of ΔG0 indicates the spontaneous nature of the adsorption process. The values of ΔG0 lie in the range of −1 to −16 kJ mol−1, which suggests that the adsorption process is physisorption.44–48 Generally, in the case of physisorption, the ΔG0 value lies in the range of −20 to 0 kJ mol−1 while the ΔG0 value ranges from −400 to −80 kJ mol−1 in the case of chemisorptions.45,46 It is also observed that the ΔG0 value increases with increasing temperature of the adsorption, suggesting that the adsorption of MB is enhanced at high temperature.
The calculated ΔH0 values from van't Hoff plots were found to be 57–78 kJ mol−1, indicating that the adsorption is an endothermic process. The adsorption process is governed by a physical process as the ΔH0 is within the range of 1–93 kJ mol−1.48 The positive value of ΔS0 (0.21–0.28 kJ mol−1) reveals the increased randomness at the dye and PANI/SA interface during the adsorption process.49
The magnitude of activation energy gives information about the adsorption mechanism. The physisorption processes usually have energies in the range of 5–40 kJ mol−1, while higher activation energies (40–800 kJ mol−1) suggest chemisorption.50 The activation energy, Ea, is calculated from the slope of plots of ln k versus 1/T, (Fig. 7b) using the Arrhenius equation (eqn (11)).
| ln k = ln A − Ea/RT | 11 |
where A is the Arrhenius pre-exponential factor, R is the universal gas constant, and T is the temperature in Kelvin.
The activation energy for MB, RB, O-II, and MO were calculated from the slope and were found to be 20.2, 15.1, 11.9, and 15.7 kJ mol−1, respectively, indicating that the adsorption process is governed by physical adsorption.
Plausible mechanism of adsorption
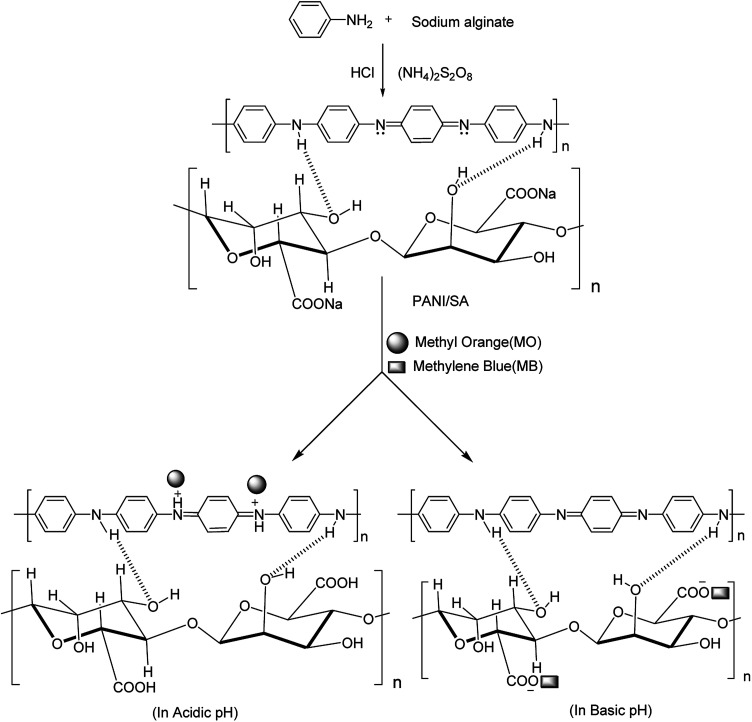
From the above results it is proposed that electrostatic force of attraction is responsible for the adsorption of dyes on the composite. The proposed mechanism of formation of composite and adsorption of dyes is shown in Fig. 8. Zare et al. proposed a similar kind of mechanism for the formation of a polypyrrole and dextrin nanocomposite.51 In acidic medium, positive charge is developed on the nitrogen atom of the composite, thus, the removal of anionic dyes occurs. Similarly, in basic medium, the carboxylate group present in the composite is responsible for the removal of cationic dyes. However, interaction forces other than electrostatic force of attraction could also contribute to the dye adsorption. In this work, all the four dyes are planar molecules and can be easily adsorbed by π–π stacking interactions. It is observed that the adsorption of O-II and MB are faster than MO and RB in their respective pH (Fig. 4a–d). This can be attributed to the presence of more aromatic backbone components present in the O-II molecule than MO, which is responsible for π–π stacking interaction. On the other hand, this type of π–π stacking interactions is not effective in RB due to the steric hindrance of the molecule, which resulted in slower adsorption than that of MB.52
Fig. 8. Mechanism of adsorption of dyes in acidic and basic medium.
Conclusion
In conclusion, a green and regenerable composite adsorbent synthesized by a simple and effective method was used for the selective removal of both cationic and anionic dyes from water. The synthesized composite showed the selective adsorption of a dye from mixed MB/O-II and RB/MO solutions at different pH values. The adsorption process followed pseudo-second order kinetics and the Langmuir adsorption isotherm. The synthesized adsorbent composite is efficiently regenerated by desorption and is reusable five times without a significant reduction in its adsorption efficiency. The PANI/SA nanocomposite proved to be an eco-friendly, low cost, and highly efficient adsorbent for the removal of both cationic and anionic dyes from waste water.
Conflicts of interest
There are no conflicts to declare.
Supplementary Material
Acknowledgments
The authors acknowledge DST Govt. of Odisha (ST-SCST-MISC-0015-2019) for funding and DST Govt. of India, UGC New Delhi, India, for providing instrumental facility under the FIST and DRS programs, respectively. Deola Majhi would like to extend her appreciation to the UGC for RGNF fellowship.
Electronic supplementary information (ESI) available. See DOI: 10.1039/d0ra08125f
References
- Yagub M. T. Sen T. K. Afroze S. H. Ang M. Adv. Colloid Interface Sci. 2014;209:172–184. doi: 10.1016/j.cis.2014.04.002. [DOI] [PubMed] [Google Scholar]
- Yaseen D. A. Scholz M. Int. J. Environ. Sci. Technol. 2019;16:1193–1226. [Google Scholar]
- Rajabi M. Mahanpoora K. Moradi O. RSC Adv. 2017;7:47083–47090. [Google Scholar]
- Ahmad A. Mohd-Setapar S. H. Chuong C. S. Khatoon A. Wani W. A. Kumar R. Rafatullah M. RSC Adv. 2015;5:30801–30818. [Google Scholar]
- Crini G. Badot P. M. Prog. Polym. Sci. 2008;33:399–447. [Google Scholar]
- Liu P. Borrell P. F. Bozič M. Kokol V. Oksman K. Mathew A. P. J. Hazard. Mater. 2015;294:177–185. doi: 10.1016/j.jhazmat.2015.04.001. [DOI] [PubMed] [Google Scholar]
- Rehman T. U. Shah L. A. Khan M. Irfan M. Khattak N. S. RSC Adv. 2019;9:18565–18577. doi: 10.1039/c9ra02488c. [DOI] [PMC free article] [PubMed] [Google Scholar]
- Srivastava V. Zare E. N. Makvandi P. Zheng X. Iftekhar S. Wu A. Padil V. V. T. Mokhtari B. Varma R. S. Tay F. R. Sillanpaa M. Chemosphere. 2020;258:127324. doi: 10.1016/j.chemosphere.2020.127324. [DOI] [PubMed] [Google Scholar]
- Zarea E. N. Lakouraj M. M. Masoumib M. Desalin. Water Treat. 2018;106:209–219. [Google Scholar]
- Majhi D. Patra B. N. J. Chem. Eng. Data. 2018;63:3427–3437. [Google Scholar]
- Patra B. N. Majhi D. J. Phys. Chem. B. 2015;119(25):8154–8164. doi: 10.1021/acs.jpcb.5b00535. [DOI] [PubMed] [Google Scholar]
- Liu W. Hu R. Li Y. Huang Y. Wang Y. Wei Z. Yu E. Guo X. RSC Adv. 2020;10:4232–4242. doi: 10.1039/c9ra09391e. [DOI] [PMC free article] [PubMed] [Google Scholar]
- Sarkar A. K. Saha A. Panda A. B. Pal S. Chem. Commun. 2015;51:16057–16060. doi: 10.1039/c5cc06214d. [DOI] [PubMed] [Google Scholar]
- Upadhyay A. Rao C. P. ACS Appl. Mater. Interfaces. 2019;11:7965–7973. doi: 10.1021/acsami.8b20027. [DOI] [PubMed] [Google Scholar]
- Yao G. Li S. Xu J. Liu H. J. Chem. Eng. Data. 2019;64:4054–4065. [Google Scholar]
- Wei R. Song W. Yang F. Zhou J. Zhang M. Zhang X. Zhao W. Zhao C. Ind. Eng. Chem. Res. 2018;57:8209–8219. [Google Scholar]
- Jaymand M. Prog. Polym. Sci. 2013;38:1287–1306. [Google Scholar]
- Zarea E. N. Motaharib A. Sillanpaa M. Environ. Res. 2018;162:173–195. doi: 10.1016/j.envres.2017.12.025. [DOI] [PubMed] [Google Scholar]
- Zare E. N. Lakouraj M. M. Ramezani A. New J. Chem. 2016;40:2521–2529. [Google Scholar]
- Zare E. N. Lakouraj M. M. Kasirian N. Carbohydr. Polym. 2018;201:539–548. doi: 10.1016/j.carbpol.2018.08.091. [DOI] [PubMed] [Google Scholar]
- Hosseini J. Zare E. N. Ajloo D. J. Mol. Liq. 2019;296:111789. [Google Scholar]
- Mahanta D. Madras G. Radhakrishnan S. Patil S. J. Phys. Chem. B. 2009;113:2293–2299. doi: 10.1021/jp809796e. [DOI] [PubMed] [Google Scholar]
- Gombotz W. R. Wee S. F. Adv. Drug Delivery Rev. 1998;31:267–285. doi: 10.1016/s0169-409x(97)00124-5. [DOI] [PubMed] [Google Scholar]
- Lattner D. Flemming H. C. Mayer C. Int. J. Biol. Macromol. 2003;33:81–88. doi: 10.1016/s0141-8130(03)00070-9. [DOI] [PubMed] [Google Scholar]
- Finotelli P. V. Morales M. A. Rocha-Leao M. H. Baggio-Saitovitch E. M. Rossi A. M. Mater. Sci. Eng., C. 2004;24:625–629. [Google Scholar]
- Li Y. Zhao X. Xu Q. Zhang Q. Chen D. Langmuir. 2011;27:6458–6463. doi: 10.1021/la2003063. [DOI] [PubMed] [Google Scholar]
- Wang Y. Chen J. Lu L. Lin Z. ACS Appl. Mater. Interfaces. 2013;5:7698–7703. doi: 10.1021/am402374e. [DOI] [PubMed] [Google Scholar]
- Sartori C. Finch D. S. Ralph B. Gilding K. Polymer. 1997;38:43–51. [Google Scholar]
- Yu Y. Zhihuai S. Chen S. Bian C. Chen W. Xue G. Langmuir. 2006;22:3899–3905. doi: 10.1021/la051911v. [DOI] [PubMed] [Google Scholar]
- Conklin J. A. Huang S. C. Huang S. M. Wen T. Kaner R. B. Macromolecules. 1995;28:6522–6527. [Google Scholar]
- Gad Y. H. Aly R. O. Abdel-Aal S. E. J. Appl. Polym. Sci. 2011;120:1899–1906. [Google Scholar]
- Moon Y. B. Cao Y. Smith P. Heeger A. J. Polym. Commun. 1989;30:196–200. [Google Scholar]
- Zhou J. Zhang L. J. Polym. Sci., Part B: Polym. Phys. 2001;39:451–458. [Google Scholar]
- Sun M. H. Huang S. Z. Chen L. H. Li Y. Yang X. Y. Yuan Z. Y. Su B. Chem. Soc. Rev. 2016;45:3479–3563. doi: 10.1039/c6cs00135a. [DOI] [PubMed] [Google Scholar]
- Ghorai S. Sarkar A. Raoufi M. Panda A. B. Schonherr H. Pal S. ACS Appl. Mater. Interfaces. 2014;6:4766–4777. doi: 10.1021/am4055657. [DOI] [PubMed] [Google Scholar]
- Mahmoodi N. M. J. Chem. Eng. Data. 2011;56:2802–2811. [Google Scholar]
- Metin A. U. Ciftci H. Alver E. Ind. Eng. Chem. Res. 2013;52:10569–10581. [Google Scholar]
- Zhou Y. Zhang M. Wang X. Huang Q. Min Y. Ma T. Niu J. Ind. Eng. Chem. Res. 2014;53:5498–5506. [Google Scholar]
- Zhuang X. Wan Y. Feng C. Shen Y. Zhao D. Chem. Mater. 2009;21:706–716. [Google Scholar]
- Ho Y. S. Chiang C. C. Adsorption. 2001;7:139–147. [Google Scholar]
- Constantin M. Asmarandei I. Harabagiu V. Ghimici L. Fundueanua G. Ascenzi P. Carbohydr. Polym. 2013;91:74–84. doi: 10.1016/j.carbpol.2012.08.005. [DOI] [PubMed] [Google Scholar]
- Hall K. R. Eagleton L. C. Acrivos A. Vermeulen T. Ind. Eng. Chem. Fundam. 1966;5:212–223. [Google Scholar]
- Webi T. W. Chakravort R. K. AIChE J. 1974;20:228–238. [Google Scholar]
- Liu T. Li Y. Du Q. Sun J. Jiao Y. Yang G. Wang Z. Xia Y. Zhang W. Wang K. Zhu H. Wu D. Colloids Surf., B. 2012;90:197–203. doi: 10.1016/j.colsurfb.2011.10.019. [DOI] [PubMed] [Google Scholar]
- Sibel T. Ozcan A. S. Ozcan A. Gedikbey T. J. Hazard. Mater. 2006;135:141–148. doi: 10.1016/j.jhazmat.2005.11.033. [DOI] [PubMed] [Google Scholar]
- Fernandes A. N. Almedia C. A. P. Debacher N. A. Sierra M. D. S. J. Mol. Struct. 2010;982:62–65. [Google Scholar]
- Weng C. H. Lin Y. T. Tzeng T. W. J. Hazard. Mater. 2009;170:417–424. doi: 10.1016/j.jhazmat.2009.04.080. [DOI] [PubMed] [Google Scholar]
- Hema M. Arivoli S. Indian J. Chem. Technol. 2009;16:38–45. [Google Scholar]
- Ai L. Li M. Li M. J. Chem. Eng. Data. 2011;56:3475–3483. [Google Scholar]
- Özcan S. Erdem B. Özcan A. J. Colloid Interface Sci. 2004;280:44–54. doi: 10.1016/j.jcis.2004.07.035. [DOI] [PubMed] [Google Scholar]
- Zarea E. N. Lakouraja M. M. Mohsenib M. Synth. Met. 2014;187:9–16. [Google Scholar]
- Fang Y. Zhoul A. Yang W. Araya T. Huang Y. Zhao P. Johnson D. Wang J. Ren Z. J. Sci. Rep. 2018;8:229. doi: 10.1038/s41598-017-18057-8. [DOI] [PMC free article] [PubMed] [Google Scholar]
Associated Data
This section collects any data citations, data availability statements, or supplementary materials included in this article.


