Abstract
Adenosine monophosphate activated protein kinase (AMPK) is a master regulator of cell metabolism and is involved in cancer as both a tumor suppressor and a source of resistance to metabolic stress. The role of AMPK in response to chemotherapy has been examined in solid tumor models but remains unclear in acute myeloid leukemia (AML). To determine the role of AMPK in chemotherapy response, AML cell lines were generated lacking AMPK activity. AMPK knock out cells demonstrated significant resistance to cytarabine and doxorubicin both in vitro and in vivo. Mitochondrial mass and function were unchanged in AMPK knockout cells. Mechanistically, AMPK knock out cells demonstrated a diminished DNA damage response with significantly lower γH2AX foci, p53 and p21 induction as well as decreased apoptosis following chemotherapy exposure. Most importantly, TCGA datasets revealed that patients expressing low levels of the PRKAA1 subunit of AMPK had significantly shorter survival. Finally, AML cells were sensitized to chemotherapy with the addition of the AMPK activator AICAR. These data demonstrate that AMPK sensitizes AML cells to chemotherapy and suggests a contribution of the cellular metabolic state to cell fate decisions ultimately affecting therapy response.
1. Introduction:
Acute myeloid leukemia (AML) is characterized by poor outcomes and resistance to therapy. AML is an aggressive malignancy leading to the accumulation of immature myeloid precursors, progressive marrow failure and death1. It affects more than 20,000 people per year in the United States; despite decades of research, the overall 5-year survival remains less than 30%2. Older age, typically defined as 60 years of age or older, is a poor prognostic factor for AML. Clinical trials show an estimated 5-year survival of less than 10% in these patients3. Ten-year survival is even worse with one study estimating only 2.4% of patients over 60 years of age alive when treated with chemotherapy4. Likewise, frailty and poor performance status is linked to high treatment related mortality and poor outcomes5,6. Outcomes outside of clinical trials are similar; a SEER database study reported patients 65 years of age or older had a 5-year survival rate of under 5%7. This poor outcome of older patients is the result of disease that is resistant to therapy8. Resistance to therapy is a central clinical issue in AML, especially in the elderly and those with TP53 disruptions9, however; the molecular mechanisms remain largely unclear. There is a desperate need to increase our understanding of the molecular mechanisms of resistance.
AMPK is a master regulator of cell metabolism10. When the energy charge of the cell is low resulting in a high AMP/ATP ratio, AMPK is activated by phosphorylation of threonine 172. This results in activated AMPK phosphorylating a number of downstream substrates that decrease anabolic processes and increase energy generating ones (review by Jeon11). AMPK is a heterotrimeric complex that contains a catalytic α subunit and two regulatory β and ϒ subunits (reviewed by Herzig and Shaw10). There are two isoforms of the α subunit encoded by the PRKAA1 and PRKAA2 genes. Previously, AMPK was identified as a source of resistance to AML cell metabolic stress12. How the energy status of an AML cell is altered by exposure to chemotherapy and how AMPK contributes to cellular response is not well understood. Previous studies have shown that AMPK is destabilized by chemotherapy in some AML cell lines but not others13. Studies in solid tumors have shown that AMPK is activated by chemotherapy and influences the DNA damage response (reviewed by Sanli14) however; the role of AMPK in AML response to chemotherapy remains unclear. The present study utilizes genetically defined Prkaa1 knockout murine AML cells to assess the role of AMPK in chemotherapy response. AML cells without functional AMPK were more resistant to therapy, had a diminished DNA damage response and normal AML cells could be made more sensitive to chemotherapy with the AMPK activating small molecule AICAR.
2. Materials and Methods:
2.1. Cas9/CRISPR Gene Deletion:
MFL2 cells were infected with the Cas9 expressing vector, MSCV_Cas9_puro (gift from Christopher Vakoc) (Addgene plasmid # 65655) and infected cells selected with puromycin. Resistant cells were then transfected with sgRNA expressing vector LRG (Lenti_sgRNA_EFS_GFP) also a gift from Christopher Vakoc (Addgene plasmid # 65656) tagged with GFP targeting the indicated genes, Prkaa1 and the safe harbor locus, Rosa26. Gene deletion was confirmed by western blot. Clonal populations of deleted cells were obtained by serial dilution.
2.2. Cell Culture:
All MFL2 cell lines were grown in stem cell media, 45% DMEM, 45% IMDM, 10% FBS, supplemented with 1% penicillin, 1% streptomycin, 0.11% IL-6, 0.02% IL-3, and 0.11% SCF, at 37° C with 5% CO2.
2.3. Competition Assay:
Mixed GFP+/− cell population were plated at a density of ~50,000 cells/mL in 24-well plates. Mixed populations were exposed to the indicated therapy for 72 hours and GFP-positive percentage was quantified in the live cell population by using a BD Accuri C6 Analyzer flow cytometer (BD Bioscience, San Jose, CA).
2.4. Cell Viability:
MFL2 cell lines were plated at a density of ~50,000 cells/mL in 24-well plates. Cell lines were exposed to the indicated therapy for 72 hours. Viability assays were done using the EZQuant assay (ALSTEM, Richmond, CA) according to the manufacturer’s protocol.
2.5. TMRM/Mitotracker Deep Red Assay:
MFL2 cell lines were pelleted at a density of 1×10⁶ cells. Pellets were resuspended in 1mL of PBS. Mitrotracker deep red dye was added to the cell suspension (ThermoFisher Scientific, #M22426, 5μL of 5mM stock) and incubated at 37° C with 5% CO2 for fifteen minutes. TMRM dye was added to cell suspension (ThermoFisher Scientific, #T668, 5μL of 40mM stock) and incubated at 37° C with 5% CO2 for thirty minutes. Cell suspension was centrifuged, supernatant was aspirated, and pellet was washed with 1mL of PBS. After centrifugation, pellet was resuspended in 500μL of PBS. Samples were analyzed by flow cytometry.
2.6. Annexin V/ Propidium Iodide Assay:
MFL2 cell lines were plated at a density of ~50,000 cells/mL in 24-well plates. Cell lines were exposed to the indicated therapy for 72 hours. Annexin V assay was done using APC Annexin V, 5μL per sample, (BD Pharmingen, #550474) according to the manufacturer’s protocol. A counterstain, PI, 1 μL per sample, (BD Pharmingen, #556463), was used. Samples were analyzed by flow cytometry.
2.7. Western Blots:
Cultured and treated cells were pelleted and washed in cold PBS. Pellets were lysed in Laemmli buffer, separated by SDS-PAGE, and transferred to an Immobilon PVDF membrane (Millipore). Antibodies against AMPK α1 subunit (Abcam, #Y365, 1: 1,000), AMPK (Cell Signaling, #2532, 1:1000), phosphorylated AMPK (Cell Signaling, #2531, 1:1000), p53 (Cell Signaling, #9282, 1:1,000), p21(Abcam, #EPR3993, 1:1,000), ACC (Cell signaling, #3662, 1:1,000), phosphorylated ACC (Cell signaling, #3661, 1:1,000), and actin (Abcam #AC-15, 1:5000 or Abcam #Ab8227, 1:5,000) were used. Relative protein expressions were acquired by ImageJ software and the protein expression of each sample was normalized based on the corresponding α-actin levels.
2.8. Ɣ-H2AX Assay:
MFL2 cell lines were plated at a density of ~3×10⁶ cells/mL in 6-well plates. Cell lines were exposed to the indicated therapy for four, six, or eight hours. Ɣ-H2AX assay was done using phosphorylated Ɣ-H2AX (Cell signaling, #9720, 1:50) according to manufacturer’s protocol. Rabbit IgG was used as an isotype control (Cell signaling, #3452, 1:50). Samples were analyzed by flow cytometry.
2.9. Mitochondrial Respiration Assays:
All oxygen consumption rate assays were performed using the XF24 Extracellular Flux Analyzer (Seahorse Bioscience) as per the manufacturer’s instructions. Cells were plated at a density of 400,000 viable cells per well for oxygen consumption assays. Data was normalized to viable cell number and viability was routinely between 96% and 99% as determined by trypan blue exclusion assay (Countess automated cell counter, ThermoFisher). The media used for oxygen consumption assays was the mitochondrial stress test media, specifically: DMEM with 5.5mM glucose, 2.0mM Sodium Pyruvate, and 2mM L-glutamine – warmed to 37oC and pH 7.35. Cells were placed in assay media and incubated for 2 hours prior to being placed in the assay. For the oxygen consumption experiments oligomycin at a final concentration of 1 μM, FCCP at 0.5 μM, and Antimycin A and Rotenone each at 1 μM were used. Assay was done in triplicate (3 wells per condition each measured in triplicate) and repeated in three independent experiments.
2.9. Mouse Studies:
The Wake Forest University Institutional Animal Care and Use Committee approved all mouse experiments. 1×10⁶ luciferase-tagged leukemia cells were transplanted into 10 to 11 week old sub-lethally irradiated (4Gy) female recipient mice, C57BL/6 (Taconic Laboratories), by tail-vein injection. Mice were monitored by bioluminescent imaging performed using an IVIS100 imaging system (Caliper LifeSciences, Hopkinton, MA). Mice were injected with 150 mg/kg D-Luciferin (Gold Biotechnology, St. Louis, MO), anesthetized with isoflurane, and imaged for 2 min. Chemotherapy was initiated upon detection of clear signals. Mice were treated with 100 mg/kg ARA-C for 5 days and 3 mg/kg DOX for the first three days (both from Bedford Laboratories, Bedford, OH) by IP injection. Control animals were injected with PBS. Toxicity was measured by weighing the mice daily during treatment, if mouse had lost more than ten percent of body weight treatment was withheld. Following completion of therapy mice were followed for survival.
2.10. Statistical Analysis:
All means were compared by two-tailed student’s T test or Two-way ANOVA. Survival curves were estimated by the Kaplan-Meier method and p values were determined by the log rank test. P values below 0.05 were considered significant. Analysis was performed using Graph Pad Prism version 7 (Graph Pad Software Inc). Significance is indicated by asterisks, p-values, * = p < 0.05, ** = p < 0.01, *** = p< 0.001, **** = p < 0.0001.
3. Results:
3.1. Chemotherapy activates AMPK leading to increased sensitivity.
Murine AML cell line (MFL2), driven by the MLL-ENL and FLT3-ITD oncogenes, was exposed to cytarabine for 16 hours and AMPK phosphorylation at Thr172 was assessed by Western blot. There was a dose dependent increase in the phosphorylation of AMPK at Thr172 with a 6-fold increase at 200nM (Figure 1A+B). To determine the role of AMPK in chemotherapy response, Cas9 expressing MFL2 cells were partially infected with a GFP tagged vector expressing an sgRNA targeting Prkaa1. Importantly, MFL2 cells do not express Prkaa2 determined by microarray (data not shown). The partially infected pool of cells was exposed to cytarabine or doxorubicin for 72 hours, and the percentage of GFP+ cells in the viable fraction was assessed by flow cytometry. The GFP+, sgRNA-containing population increased in the presence of either cytarabine or doxorubicin. These results are consistent with Prkaa1 deleted cells being more resistant to chemotherapy (Figure 1C+D). These data suggest that AMPK is activated following chemotherapy treatment and is a source of sensitivity.
Figure 1. AMPK is activated following chemotherapy and is a source of sensitivity.
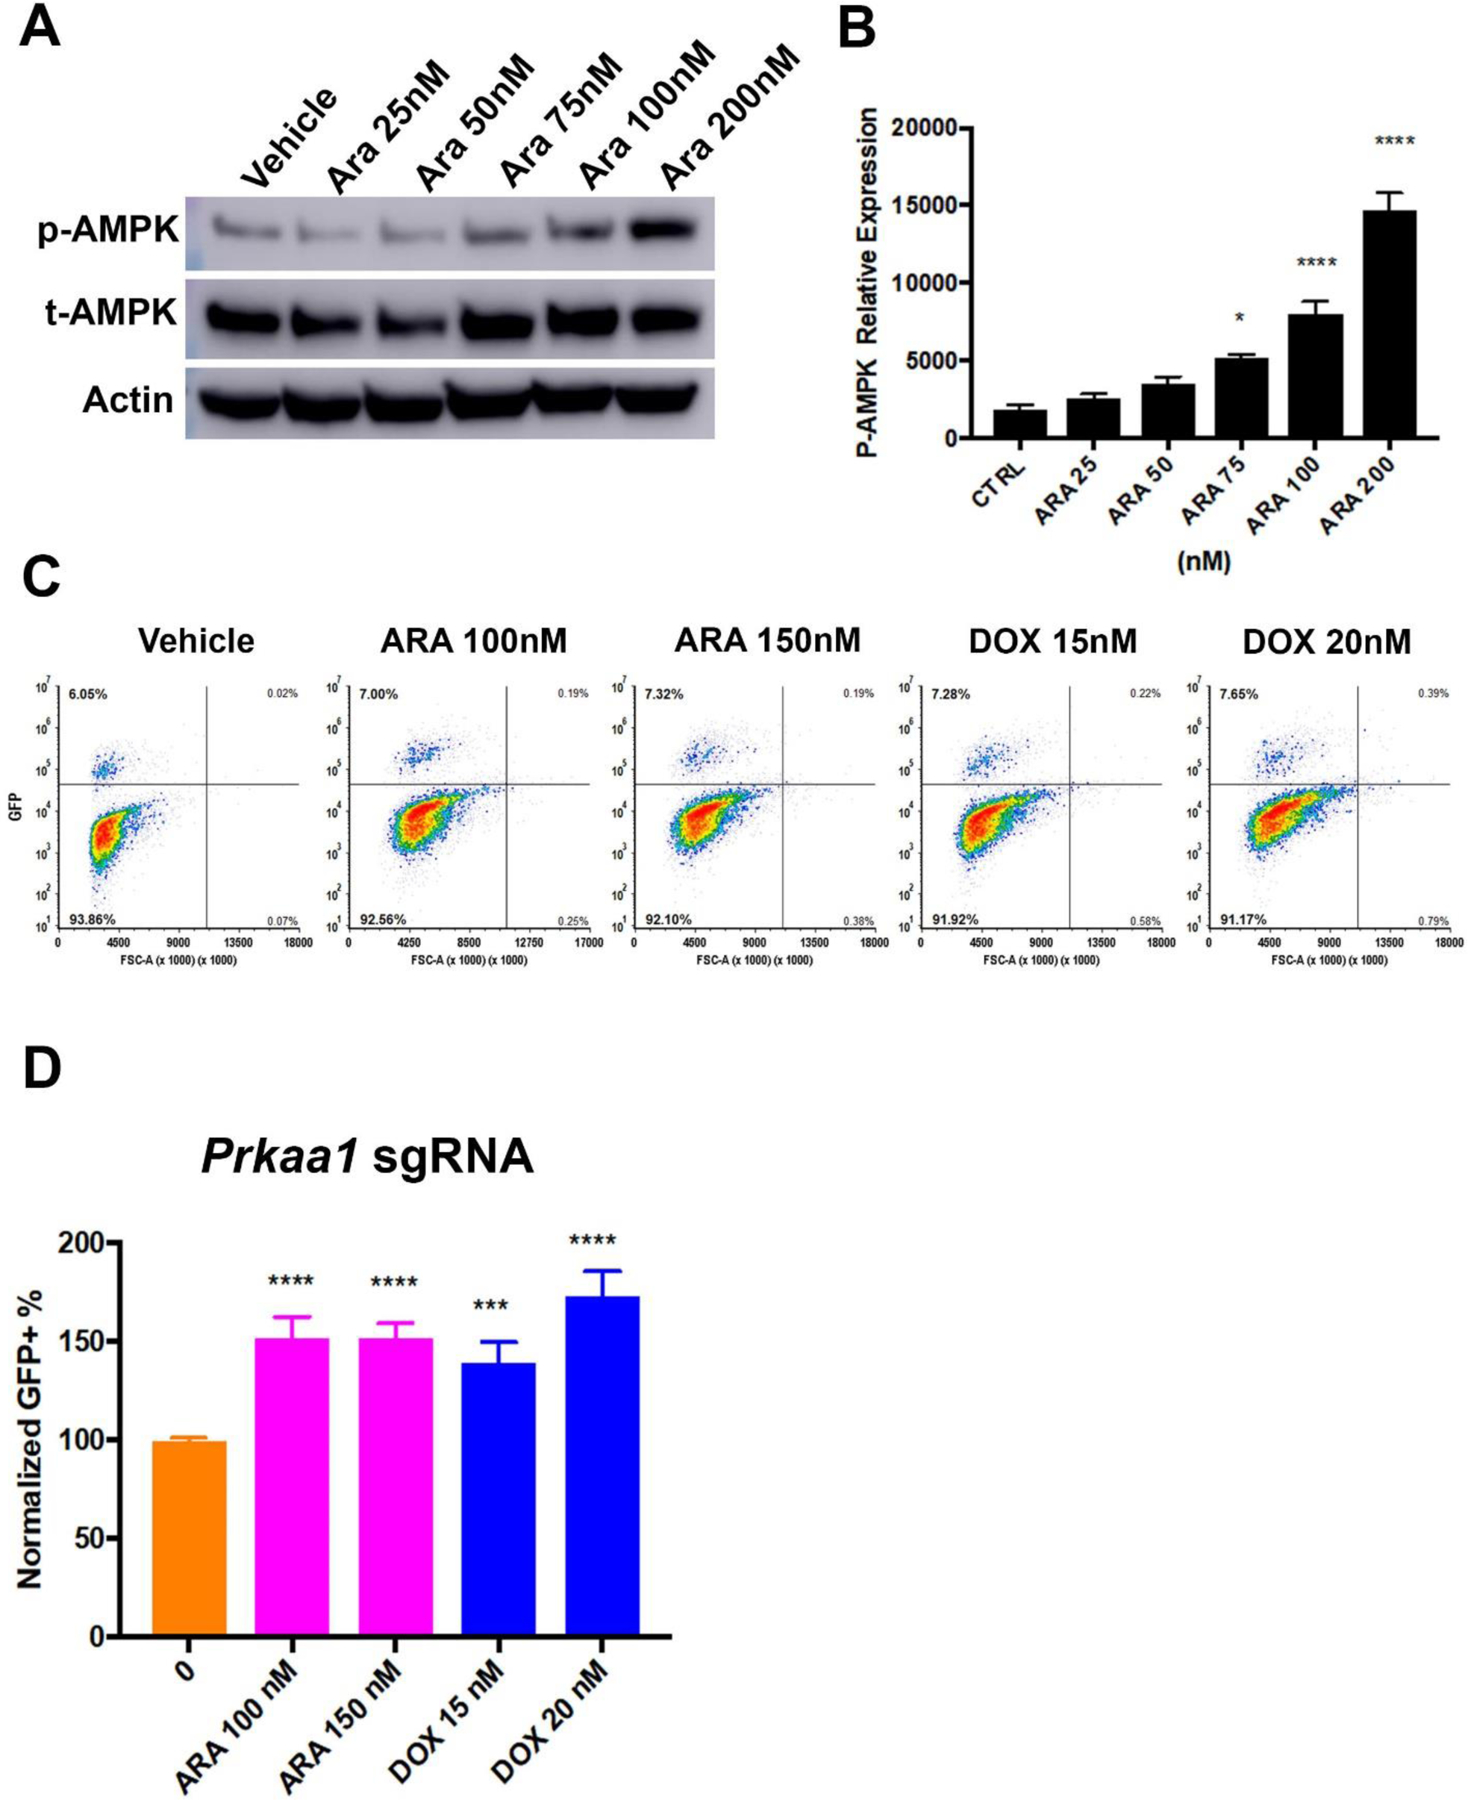
A) Western blot for phosphorylated (p-AMPK) or total (t-AMPK) AMPK alpha subunit. Murine AML cells (MFL2) were treated with the indicated amount of cytarabine (Ara) for 16 hours and lysates blotted as indicated. Actin served as a loading control. B) Densitometry of triplicate Western blots as done in (A) normalized to actin. C) Competition assay. Cas9 expressing Murine AML cells were partially infected with an sgRNA targeting Prkaa1 with a GFP reporter. Cells were treated as indicated for 72 hours and viable fraction analyzed for GFP expression by flow cytometry. Representative contour plots are shown for each treatment tested. D) Competition assay. Normalized GFP+ percentages for each conditioned tested. Shown are the mean values of three independent experiments each done in triplicate. *=p value <0.05, ***=p value <0.005, ****=p value <0.001.
3.2. Prkaa1 deleted MFL2 cells have no AMPK activity.
To better understand the role of AMPK activity in response to chemotherapy, clonal isolates of MFL2 cells with sgRNA targeting either Prkaa1 (AMPK KO) or the safe harbor locus Rosa26 (Rosa26) were obtained. An α1-subunit specific antibody was used to confirm Prkaa1 deletion (Figure 2A). To determine if there was any detectable Prkaa2 protein expression, a Western blot using a pan-specific antibody that recognizes both α1-and-α2-subunits was performed. There was no detectable expression of either subunit in the isolated Prkaa1 knock out clone (Figure 2B). To confirm loss of AMPK activity, Rosa26 and AMPK KO cells were stressed with nutrient poor conditions by exposure to Hank’s balanced salt solution for 4 hours and the downstream target of AMPK, acetyl-CoA carboxylase (ACC1), was assessed for phosphorylation. To further confirm that ACC1 phosphorylation was due to AMPK activity in ROSA26 cells the AMPK inhibitor compound C was used to treat cells. Rosa26 but not AMPK KO cells had phospho-ACC1 that was attenuated by the presence of compound C consistent with a lack of AMPK activity in KO cells (Figure 2C). As AMPK induces p53 and cell cycle arrest at low glucose conditions15 growth in the presence of the glycolysis inhibitor 2-deoxy-glucose was determined. Consistent with a lack of AMPK activity, AMPK KO cells were significantly more proliferative in the presence of 2-DG compared to Rosa26 cells (Figure 2D). These data demonstrate that Prkaa1 deleted MFL2 cells do not express either Prkaa1 or 2 and have no detectable AMPK activity.
Figure 2. Prkaa1 deleted cells have no AMPK activity.
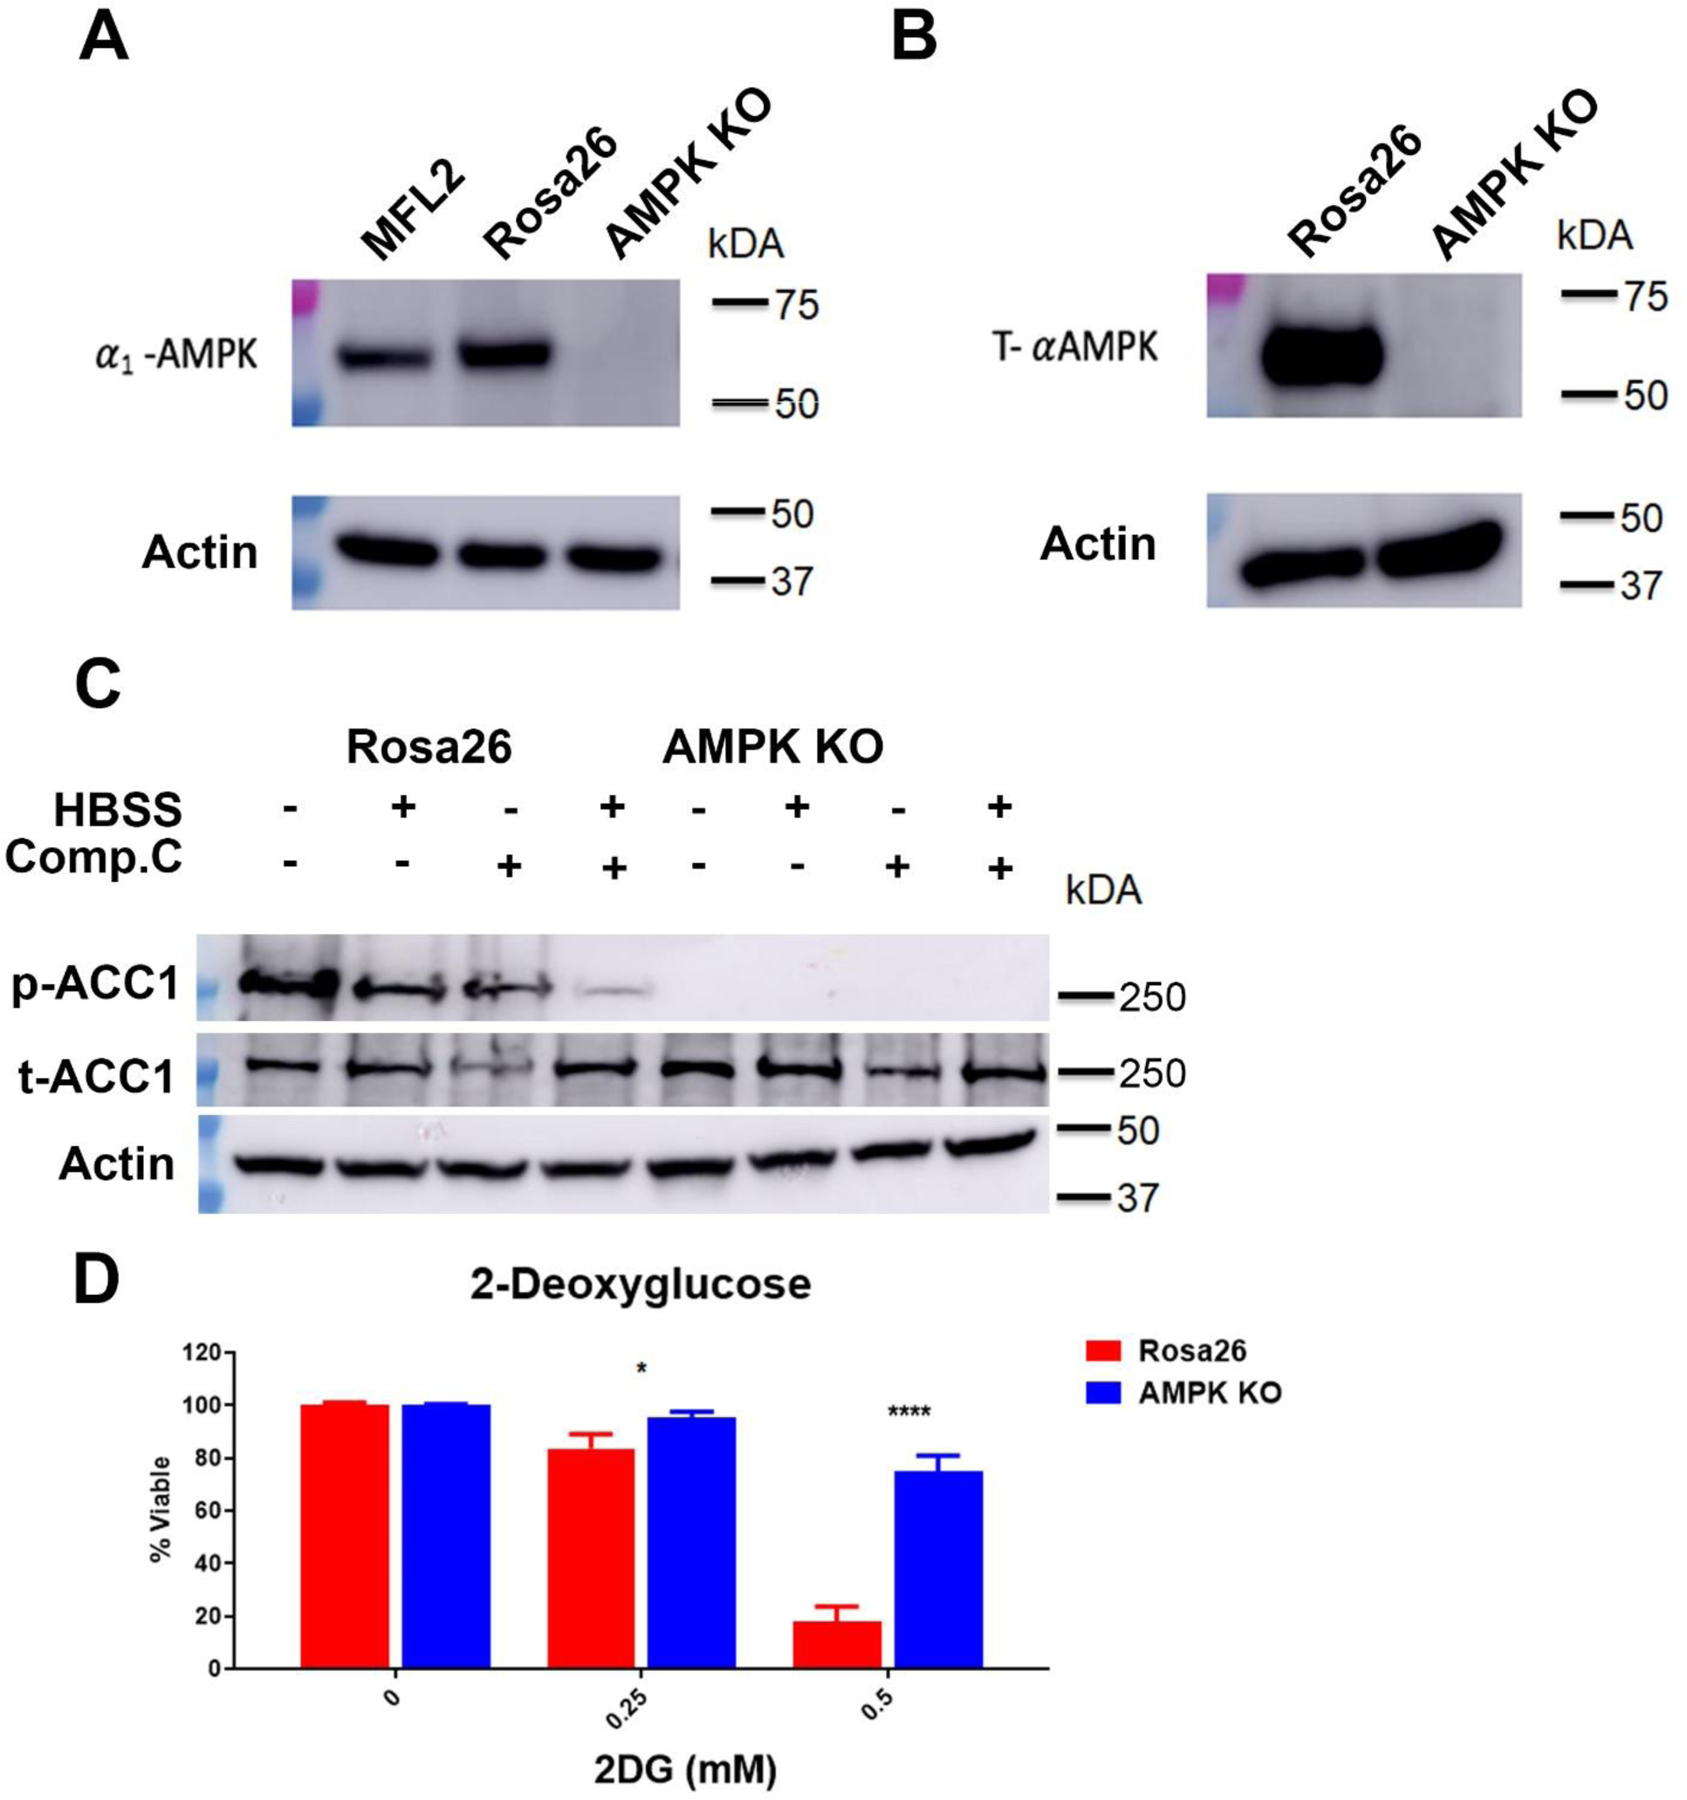
A) Western blot for Prkaa1 (α1-AMPK) from the parental line (MFL2), control Rosa26 targeted control cells or Prkaa1 deleted cells (AMPK KO). Actin served as a loading control. B) Western blot for Prkaa1 and Prkaa2 (T-αAMPK). Actin served as a loading control. C) Western blot for phosphorylated ACC1 (p-ACC1) and total ACC1 (t-ACC1) in Hank’s balanced salt solution (HBSS) with and without compound C (Comp.C). Actin served as a loading control. D) Viability assays. Rosa26 control or AMPK KO cells were treated with the indicated amount of the glycolysis inhibitor 2-deoxyglucose (2DG) for 72 hours and viability assessed. *=p value <0.05, ****=p value <0.001.
3.3. AMPK KO cells are resistant to chemotherapy.
AMPK KO and Rosa26 cells were exposed to either cytarabine or doxorubicin for 72 hours and viability was assessed. These agents were chosen as cytarabine and an anthracycline are the main chemotherapeutics used clinically for the treatment of AML. Consistent with the competition assay results, AMPK KO cells were significantly more resistant to both cytarabine and doxorubin (Figure 3A). To confirm these results and rule out a clonal artifact, a pooled population of eight independently generated Prkaa1 deleted clones were treated with cytarabine and doxorubicin. Pooled isolates also demonstrated a significant increase in resistance to chemotherapy (Figure 3B). To determine if the differences in viability were a result of decreased apoptotic response, AMPK KO and Rosa26 cells were assessed by Annexin V/Propidium iodide staining following chemotherapy exposure. AMPK KO cells had a higher basal apoptotic level but a clearly blunted apoptotic response following exposure to chemotherapy (Figure 3C and Supplemental Figure 1). These data demonstrate a cell autonomous effect of AMPK on chemotherapy response but AML cells are affected by their microenvironment and in vitro experiments are unable to account for these micro-environmental influences. To assess the role of AMPK in chemotherapy response in vivo, C57Bl/6 mice were sub-lethally irradiated and injected with 1×10⁶ AMPK KO or Rosa26 cells. These cells express firefly luciferase to allow for in vivo imaging. Upon engraftment, 8 days for Rosa26 and 11 days for AMPK KO cells, as determined by bioluminescence imaging, treatment was initiated. The regimen consisted of cytarabine 100 mg/kg I.P. for 5 days and doxorubicin 3mg/kg I.P. for the first 3 days; this combination mimics the treatment received by AML patients in clinic16. Pre-treatment luciferase signals were quantified to ensure that the disease burden was comparable between cohorts. No significant difference was noted between cohorts pre-treatment (Figure 3D). Mice were treated with vehicle or chemotherapy and followed for survival. Vehicle treated mice injected with AMPK KO cells survived significantly longer than Rosa26 injected mice consistent with previous reports that AMPK is required for efficient AML engraftment12 (median survival of 8 versus 5.5 days, Figure 3E). However, in chemotherapy treated animals AMPK KO injected mice had a shorter survival when compared to those injected with Rosa26 (median survival of 11 versus 12 days, Figure 3E). This was further illustrated by the smaller survival benefit from chemotherapy seen in the AMPK KO injected animals where median survival increased by only three days compared to over seven days improvement in survival for ROSA injected animals (Figure 3E). This data is consistent with the chemotherapy resistance phenotype observed in vitro.
Figure 3. AMPK is a source of sensitivity to chemotherapy in AML.
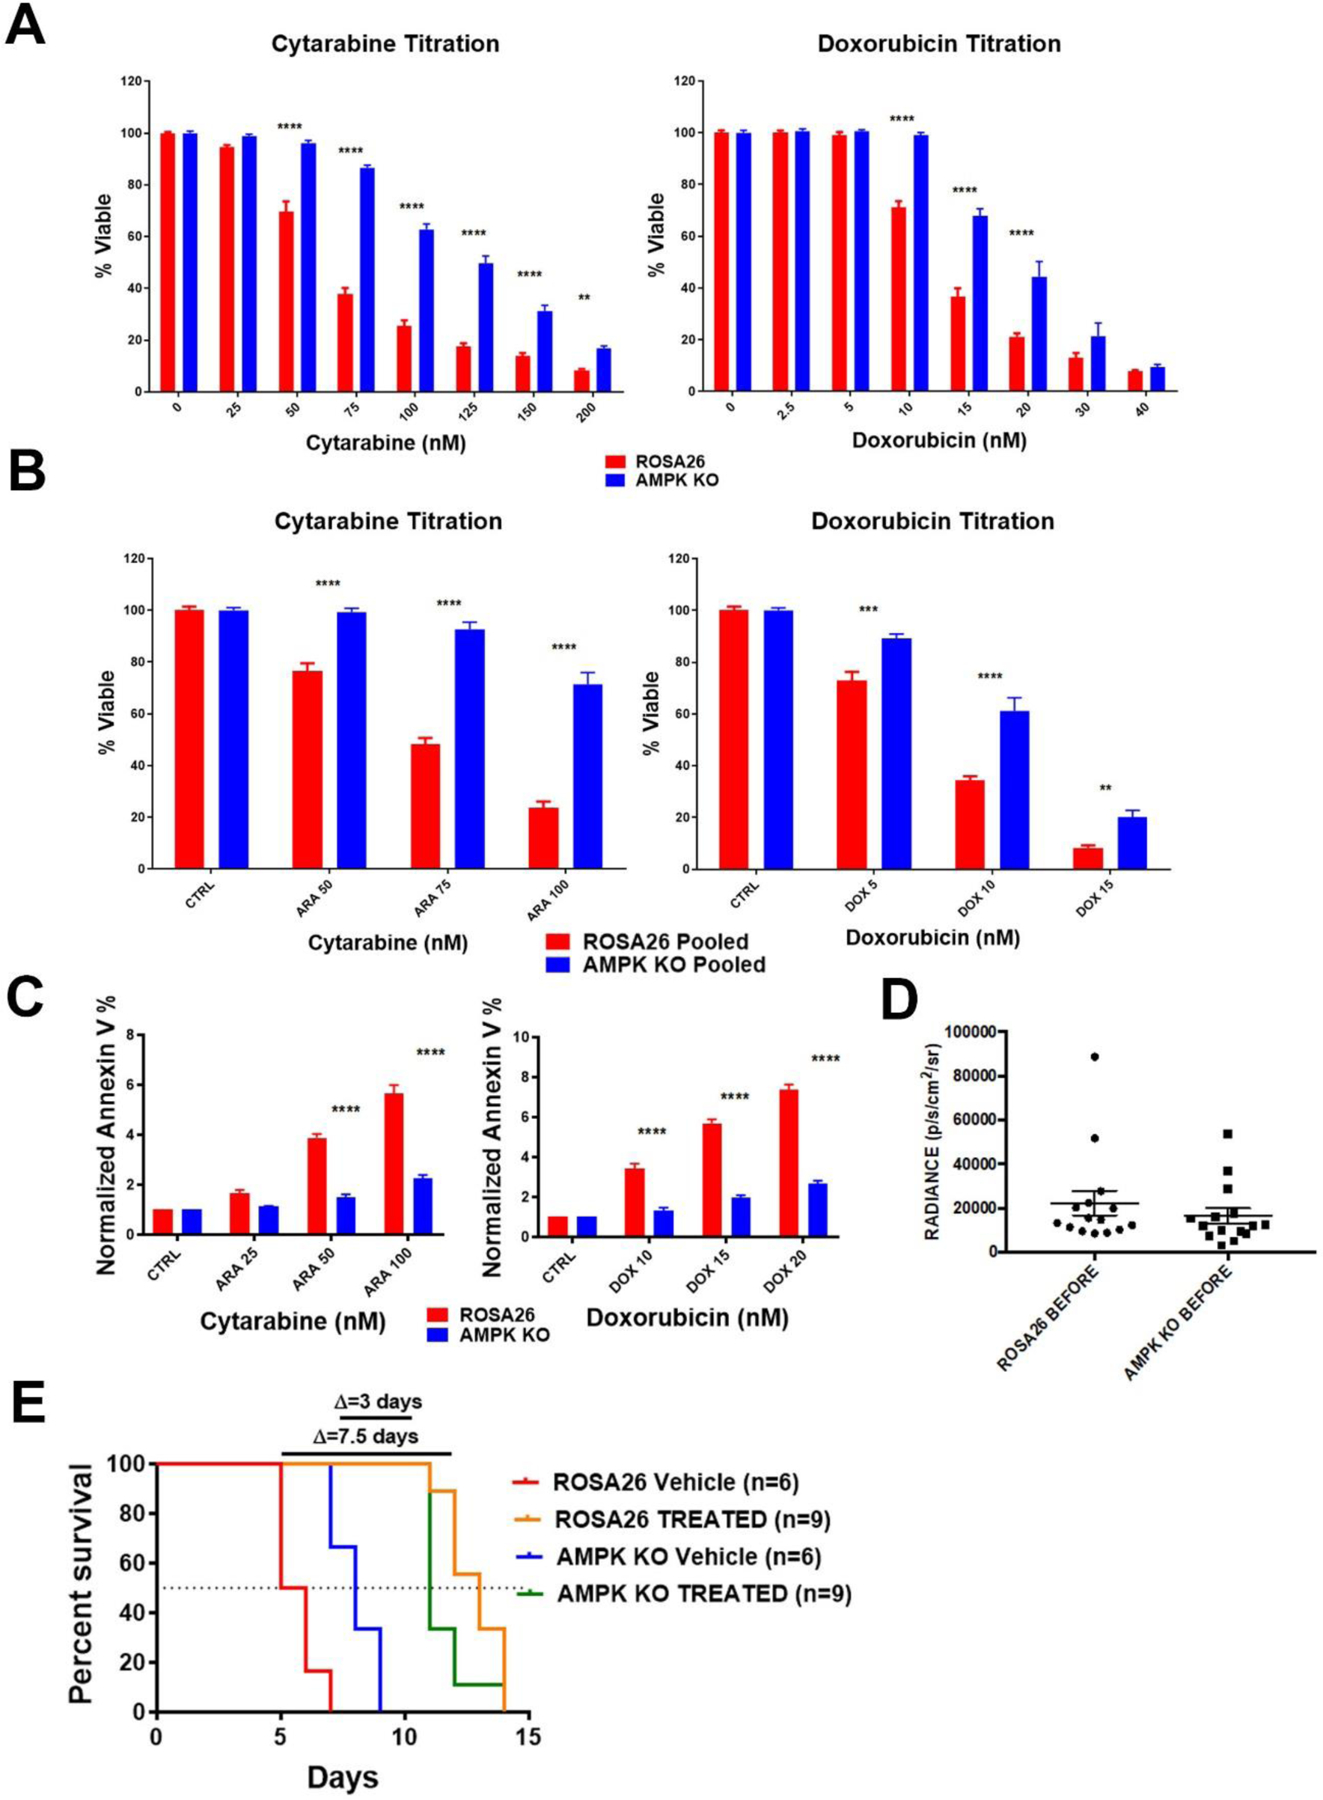
A) Viability assays. AMPK KO and Rosa26 clonal isolates were exposed to the indicated chemotherapy for 72 hours and viability assessed. B) Pooled clones of AMPK KO or control Rosa26 cells were exposed to the indicated chemotherapy for 72 hours and viability assessed. C) AnnexinV assays. AMPK KO and Rosa26 cells were exposed to the indicated chemotherapy for 72 hours, stained with annexin V and analyzed by flow cytometry. Shown are the means of three independent experiments with the data normalized to each vehicle. D) Quantified bioluminescence. Mice were injected with either AMPK KO or control Rosa26 cells and subjected to bioluminescence imaging. Engraftment at time of treatment initiation is shown. E) Kaplan-Meier curves for vehicle or chemotherapy treated mice. Change in median survival in days is shown above the graph. *=p value <0.05, **=p value <0.01, ***=p value <0.005, ****=p value <0.001.
3.4. AMPK KO cells have normal mitochondria.
As AMPK is known to have a role in mitochondrial biogenesis and turnover17 the mitochondrial effects of AMPK deletion were evaluated. To assess mitochondrial content, AMPK KO and Rosa26 cells were stained with the mitochondrial dye, mitotracker red, and analyzed by flow cytometry. Mitochondrial content did not differ in AMPK KO and Rosa26 cells (Figure 4A). Mitochondrial membrane potential (MMP) is the driver of ATP synthesis and a key indicator of mitochondrial health. To determine if MMP was affected by AMPK, cells were stained with the MMP dependent dye TMRM. There was no significant difference in TMRM uptake between AMPK KO and Rosa26 cells (Figure 4B). A known source of AML cell resistance is increased mitochondrial oxygen consumption in response to chemotherapy18. To determine if AMPK plays a role in this response, AMPK KO and Rosa26 cells were treated with cytarabine and mitochondrial oxygen consumption rates (OCR) determined. There was no significant difference in induced mitochondrial OCR following chemotherapy exposure (Figure 4C). These data suggest no significant changes in mitochondria in AMPK KO cells.
Figure 4. AMPK KO AML cells have intact mitochondria.
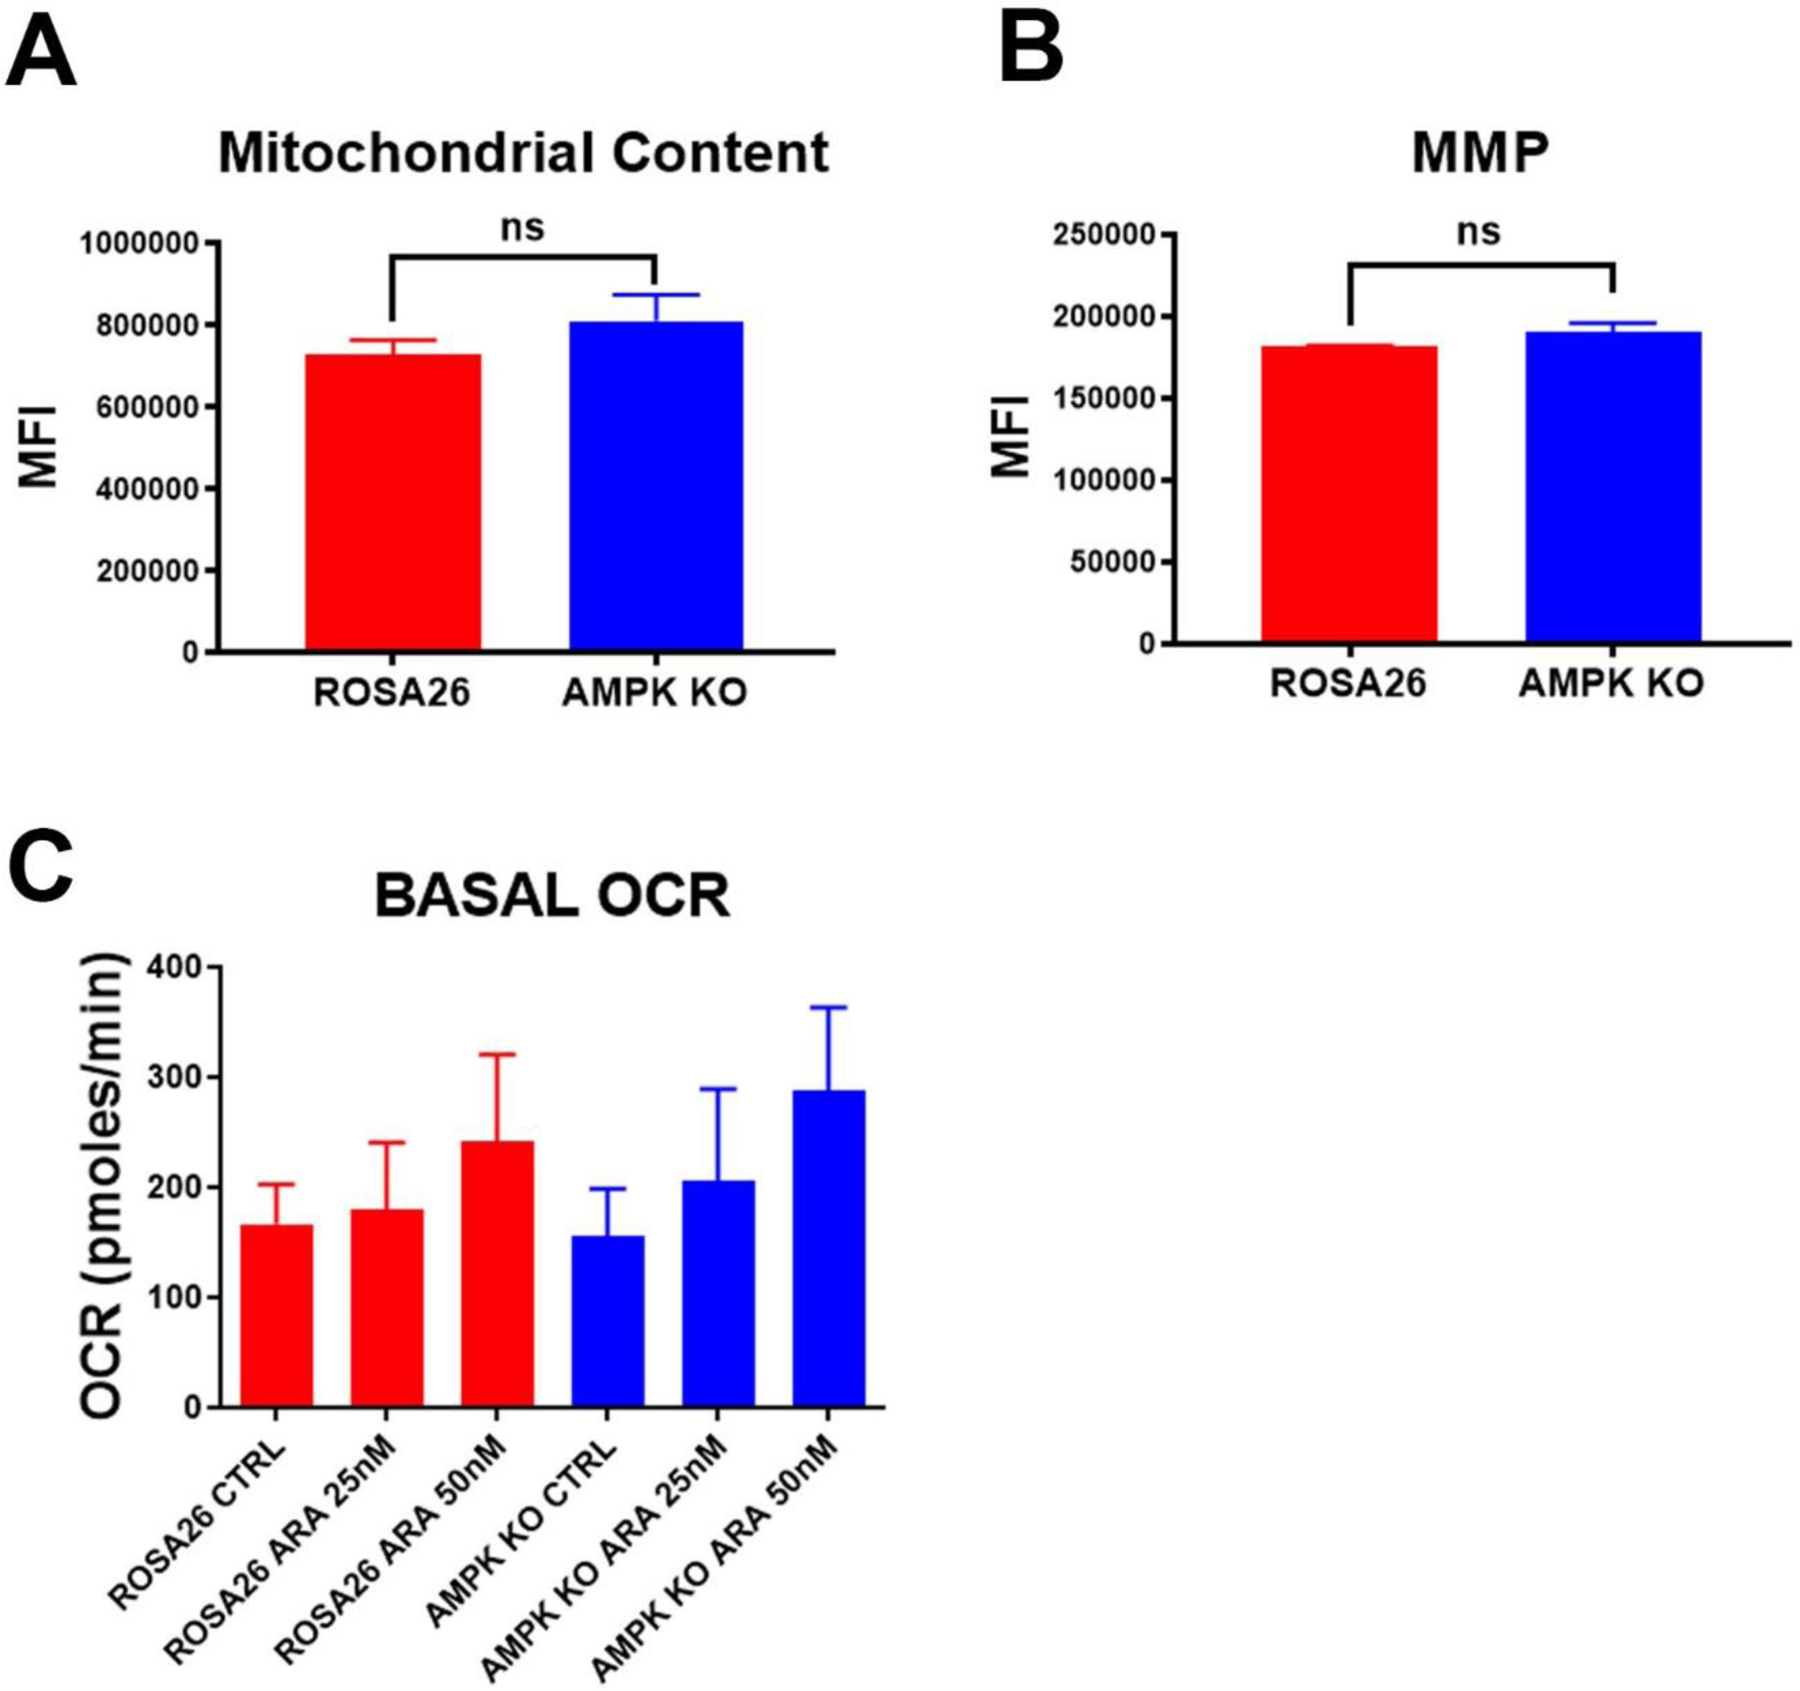
A) Mitotracker staining. AMPK KO and Rosa26 control cells were stained with the mitochondrial dye, mitotracker red. Shown are the mean values of the median florescence intensity (MFI) of three independent experiments. B) TMRM staining. AMPK KO and Rosa26 control cells were stained with the mitochondrial membrane dependent dye, TMRM. Shown are the mean values of the median florescence intensity (MFI) of three independent experiments. C) Basal oxygen consumption rates. AMPK KO and Rosa26 control cells were treated with the indicated amounts of cytarabine (ARA) for 16 hours and basal oxygen consumption rates (OCR) determined. Shown are means of three independent experiments each done in triplicate. There was no significant difference of OCR for any chemotherapy concentration.
3.5. AMPK KO cells have a blunted DNA damage response.
Previous work has implicated AMPK in the DNA damage response, with AMPK KO mouse embryonic fibroblasts having diminished ATM activity, including decreased γ-H2AX formation following ionizing radiation exposure19. To assess if AMPK played a similar role in chemotherapy induced DNA damage in AML, AMPK KO or Rosa26 cells were exposed to 50 nM doxorubicin for increasing amounts of time, stained for H2AX formation and analyzed by flow cytometry. AMPK KO cells demonstrated significantly lower levels of γ-H2AX staining following chemotherapy exposure (Figure 5A and Supplemental Figure 2). We next measured p53 induction in response to DNA damage caused by doxorubicin. As with γ-H2AX, AMPK KO cells displayed a reduced induction of p53 in response to doxorubicin when compared to Rosa26 control cells (Figure 5B+C). To confirm and extend this result the canonical p53 target, p21, was also assessed following doxorubicin exposure. Consistent with a reduction in p53 activity, AMPK KO cells demonstrated diminished induction of p21 following exposure to doxorubicin (Figure 5D+E). These findings suggest that AML patients with higher AMPK activity, would have better responses to chemotherapy. Expression levels of PRKAA1 were assessed in the TCGA database of AML patients20 and survival compared. Patients in the lowest expressing quintile had a significantly worse median overall survival of 243 days compared to 647 days in the high expressing patients (p=0.0369, Figure 5F). Finally, to directly test if higher AMPK activity increased the response to chemotherapy, the small molecule 5-Aminoimidazole-4-carboxamide riboside (AICAR) that mimics AMP and activates AMPK was tested in the parental AMPK WT cell line MFL2. Consistent with the hypothesis AICAR sensitizes MFL2 cells to doxorubicin (Figure 5G). To determine the effect of AICAR on p53 and p21 induction, MFL2 cells were exposed to AICAR with and without doxorubicin for 4 hours, harvested and lysates blotted for p53 and p21. Consistent with AMPK increasing induction of p53 there was an increase in p53 and p21 induction in the presence of both doxorubicin and AICAR over either agent alone (Supplemental Figure 3). These data suggest that AMPK activity is required for efficient DNA damage response and induction of apoptosis.
Figure 5. AMPK KO cells have an impaired DNA damage response.
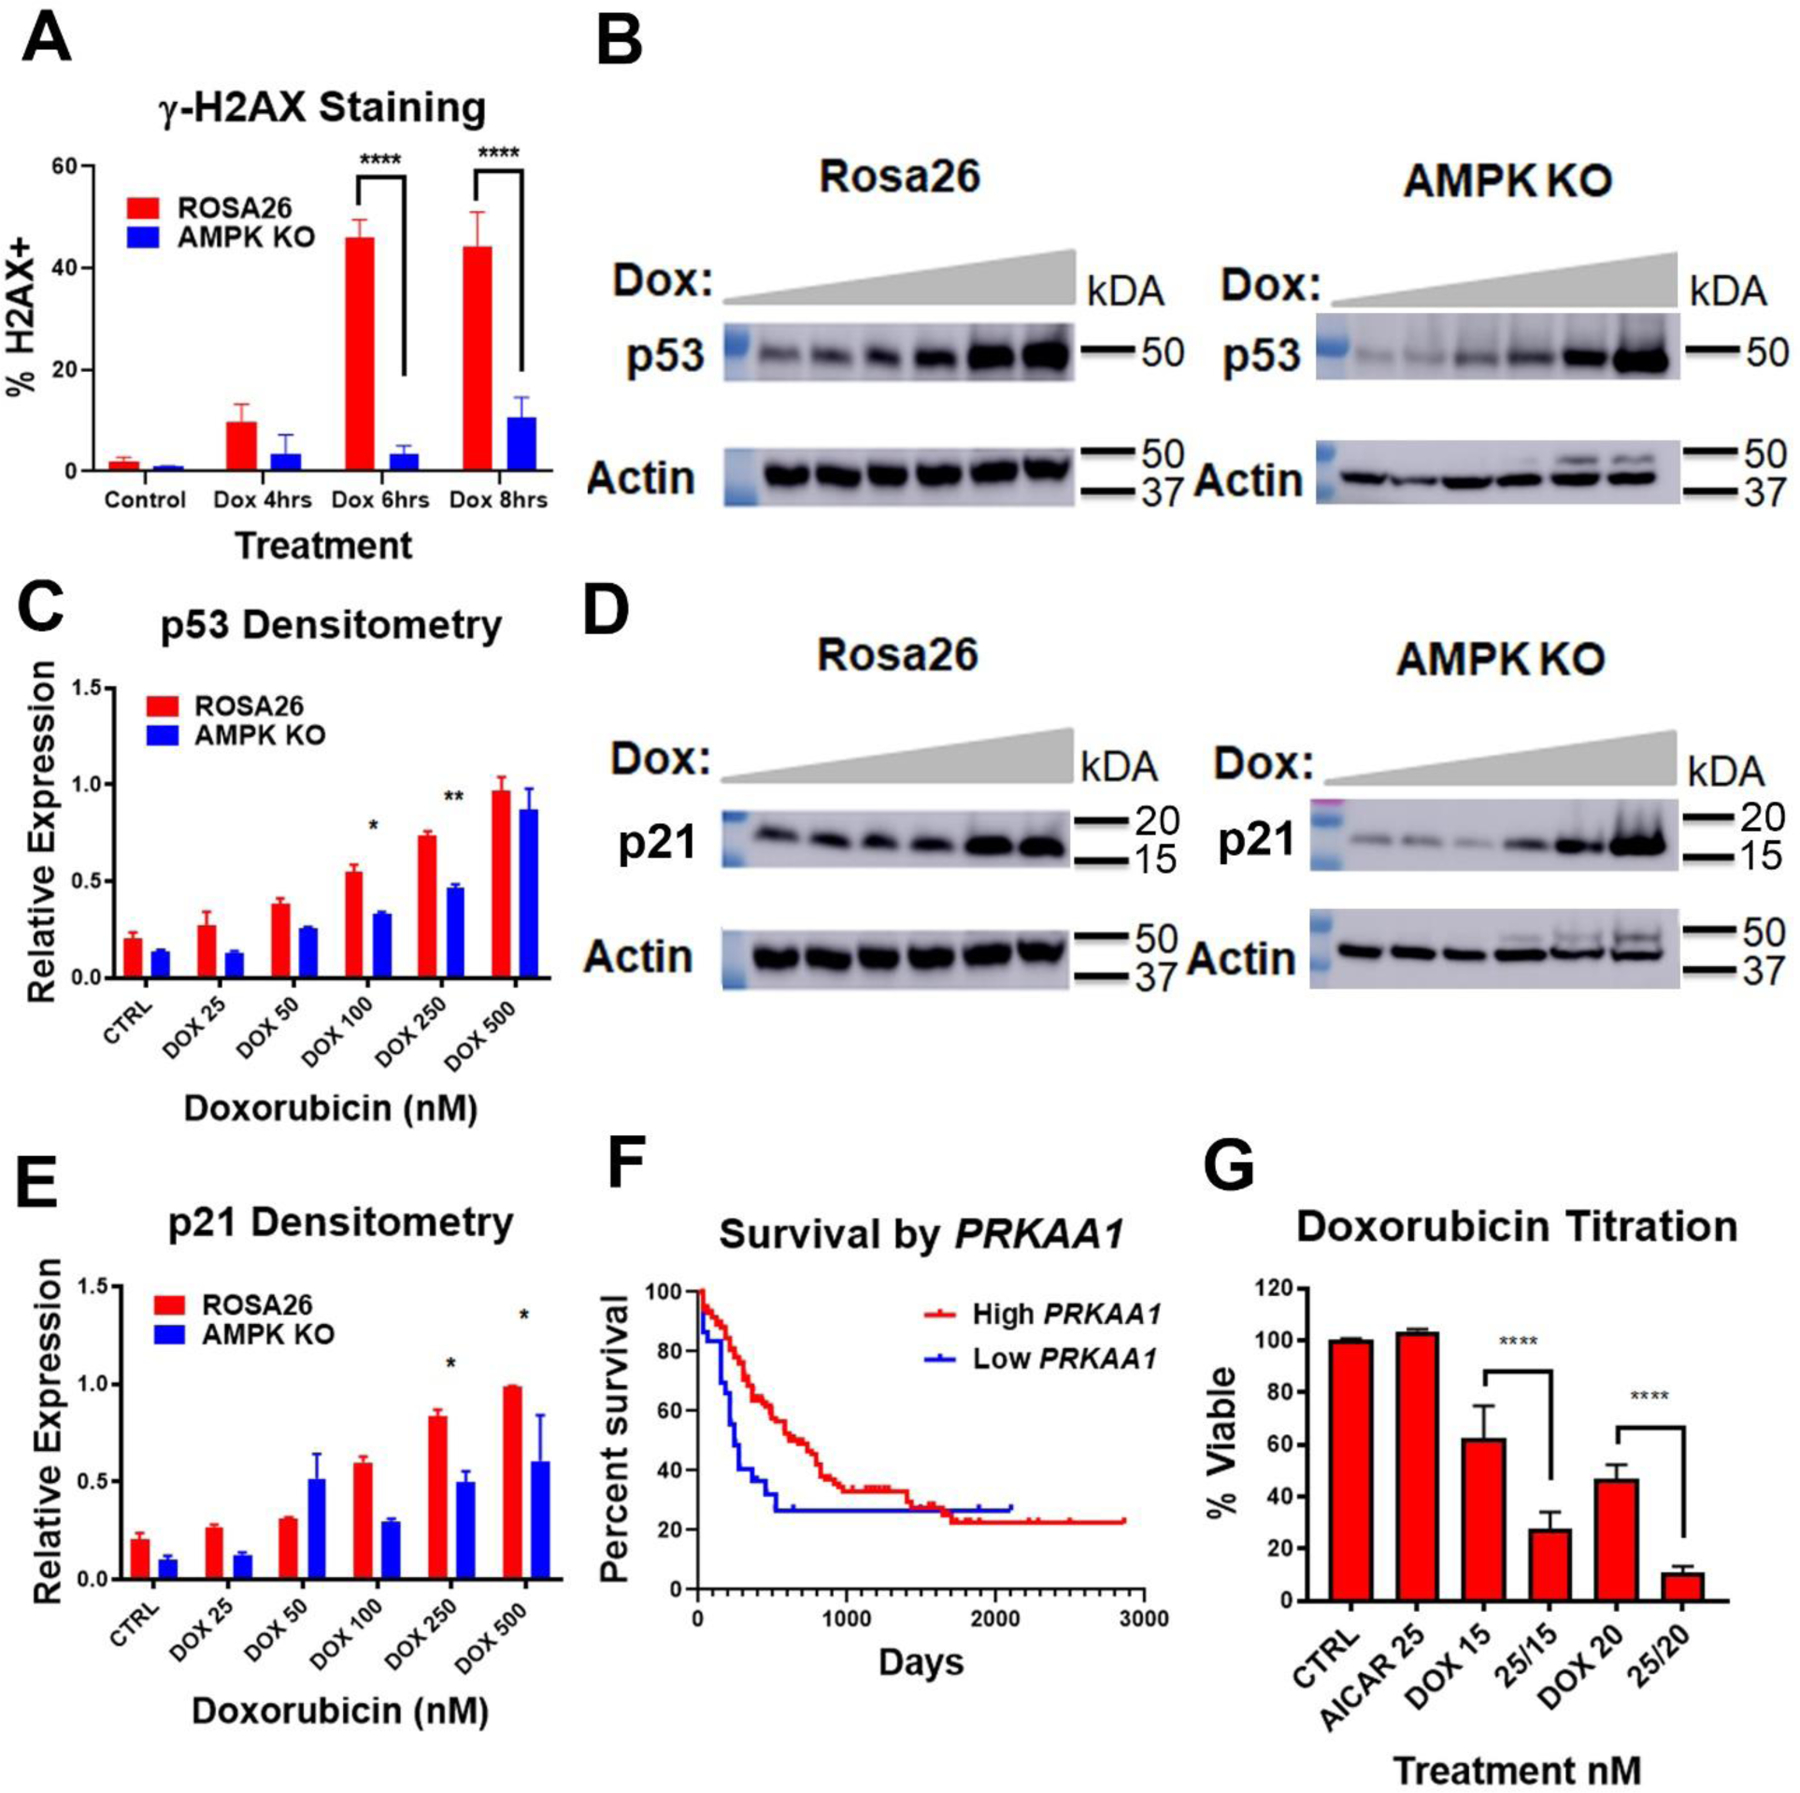
A) γH2AX staining. AMPK KO and Rosa26 control cells were treated with 50 nM doxorubicin for the indicated amount of time and stained for γH2AX. Following staining cells were analyzed by flow cytometry. B) Western blots. AMPK KO and Rosa26 control cells were treated with increasing amounts of doxorubicin for 4 hours and lysates blotted for p53. Actin was used as a loading control. C) Densitometry of triplicate Western blots as done in (B) normalized to actin. D) Western blots. AMPK KO and Rosa26 control cells were treated with increasing amounts of doxorubicin for 4 hours and lysates blotted for p21. Actin was used as a loading control. E) Densitometry of triplicate Western blots as done in (D) normalized to actin. F) Overall survival of AML patients by PRKAA1 expression. AML patients from the TCGA database were analyzed for survival by expression level of PRKAA1. Low PRKAA1 (bottom tertile, blue line), High PRKAA1 (Top 4 tertiles, red line). G) Viability assays. Parental MFL2 cells were treated with the nM amounts of AICAR or doxorubicin (DOX) or both as indicated for 72 hours and viability assessed. *=p value <0.05, **=p value <0.01, ***=p value <0.005, ****=p value <0.001.
4. Discussion:
Chemotherapy resistance is a critical factor in the treatment of various cancers including AML. Emerging evidence has indicated that chemotherapy resistance is a complex process influenced by stress response proteins21. Multiple studies have shown the direct role of metabolism in AML resistance to chemotherapy. Our group has previously published that mitochondrial metabolism is a source of resistance to therapy22. This finding was independently confirmed in an elegant in vivo study showing that AML cells resistant to cytarabine are enriched in mitochondrial mass and oxidative capacity23. The role of mitochondria in resistance to therapy is not limited to chemotherapy as sensitivity to the BCL-2 inhibitor, venetoclax, was increased with inhibition of mitochondrial function24,25. AMPK is the main cellular energy sensor known to coordinate metabolic shifts under stressful conditions26. As such, it is a prime candidate to influence the cellular response to chemotherapy. Treatment of AML cells with metabolic inhibitors causes the cells to become metabolically stressed leading to the activation of AMPK12 and once activated AMPK promotes a shift towards catabolic processes27 along with the inhibition of anabolic processes28 for restoration of cellular energy homeostasis. AMPK activation suppress cell growth and proliferation suggesting that AMPK may function as part of a tumor suppressor pathway29,30. However, the role of AMPK in response to chemotherapy, particularly in AML, is not known. Our data show that AMPK deleted AML cells are more resistant to chemotherapy in comparison to control cells; observed by competition (Figure 1) and viability assays (Figure 3). It is also important to note that the same chemotherapeutic resistance phenotype was observed both in vivo (Figure 3) and in the clinical setting with low PRKAA1 expressers (Figure 5).
Recent studies have demonstrated that AMPK activation in cancer cells following exposure to chemotherapy leads to the activation of p53 and p2114. p53 is important for the regulation of the cell cycle, DNA damage response and is an important tumor suppressor31. It has three main functions including growth arrest, DNA repair and apoptosis. These three primary functions work synergistically to prevent the proliferation of cells with critically damaged DNA32. AMPK directly phosphorylates p53 on serine1519 which in turn leads to the transcriptional regulation of primary target genes such as p21, which mediate G1/S or G2/M phase cell cycle arrest. Additionally, γH2AX becomes phosphorylated on serine139 as a reaction to double strand breaks where it is primarily responsible for the recruitment of repair complexes at the specific site of the DNA damage33. Induction of p53, p21, and γH2AX were attenuated in AMPK deleted cells following exposure to DNA damaging agents (Figure 5). AMPK activation has also been associated with apoptosis regulation following exposure to metabolic stressors34. The loss of AMPK in our system leads to decreased induction of apoptosis (Figure 3). Taken together this data suggests that AMPK establishes an additional metabolic input into cell fate decisions. When AMPK is functional, cells that are without the appropriate metabolic resources to repair their DNA damage end up becoming more apoptotic. In this model, AMPK adds an additional input to the cell’s DNA damage response; allowing cell fate decisions to take into account not only the degree of damage but also the metabolic reserves of the cell (Figure 6). This allows a more nuanced cell fate decision allowing earlier commitment to apoptosis for AML cells without the resources to complete the repair process. This provides additional insights into the mechanism of chemotherapy response and suggests a strategy whereby an AMPK activating agent added to a chemotherapy regimen could improve responses for patients suffering from this devastating disease.
Figure 6. Model of AMPK role in metabolic stress and DNA damage response.
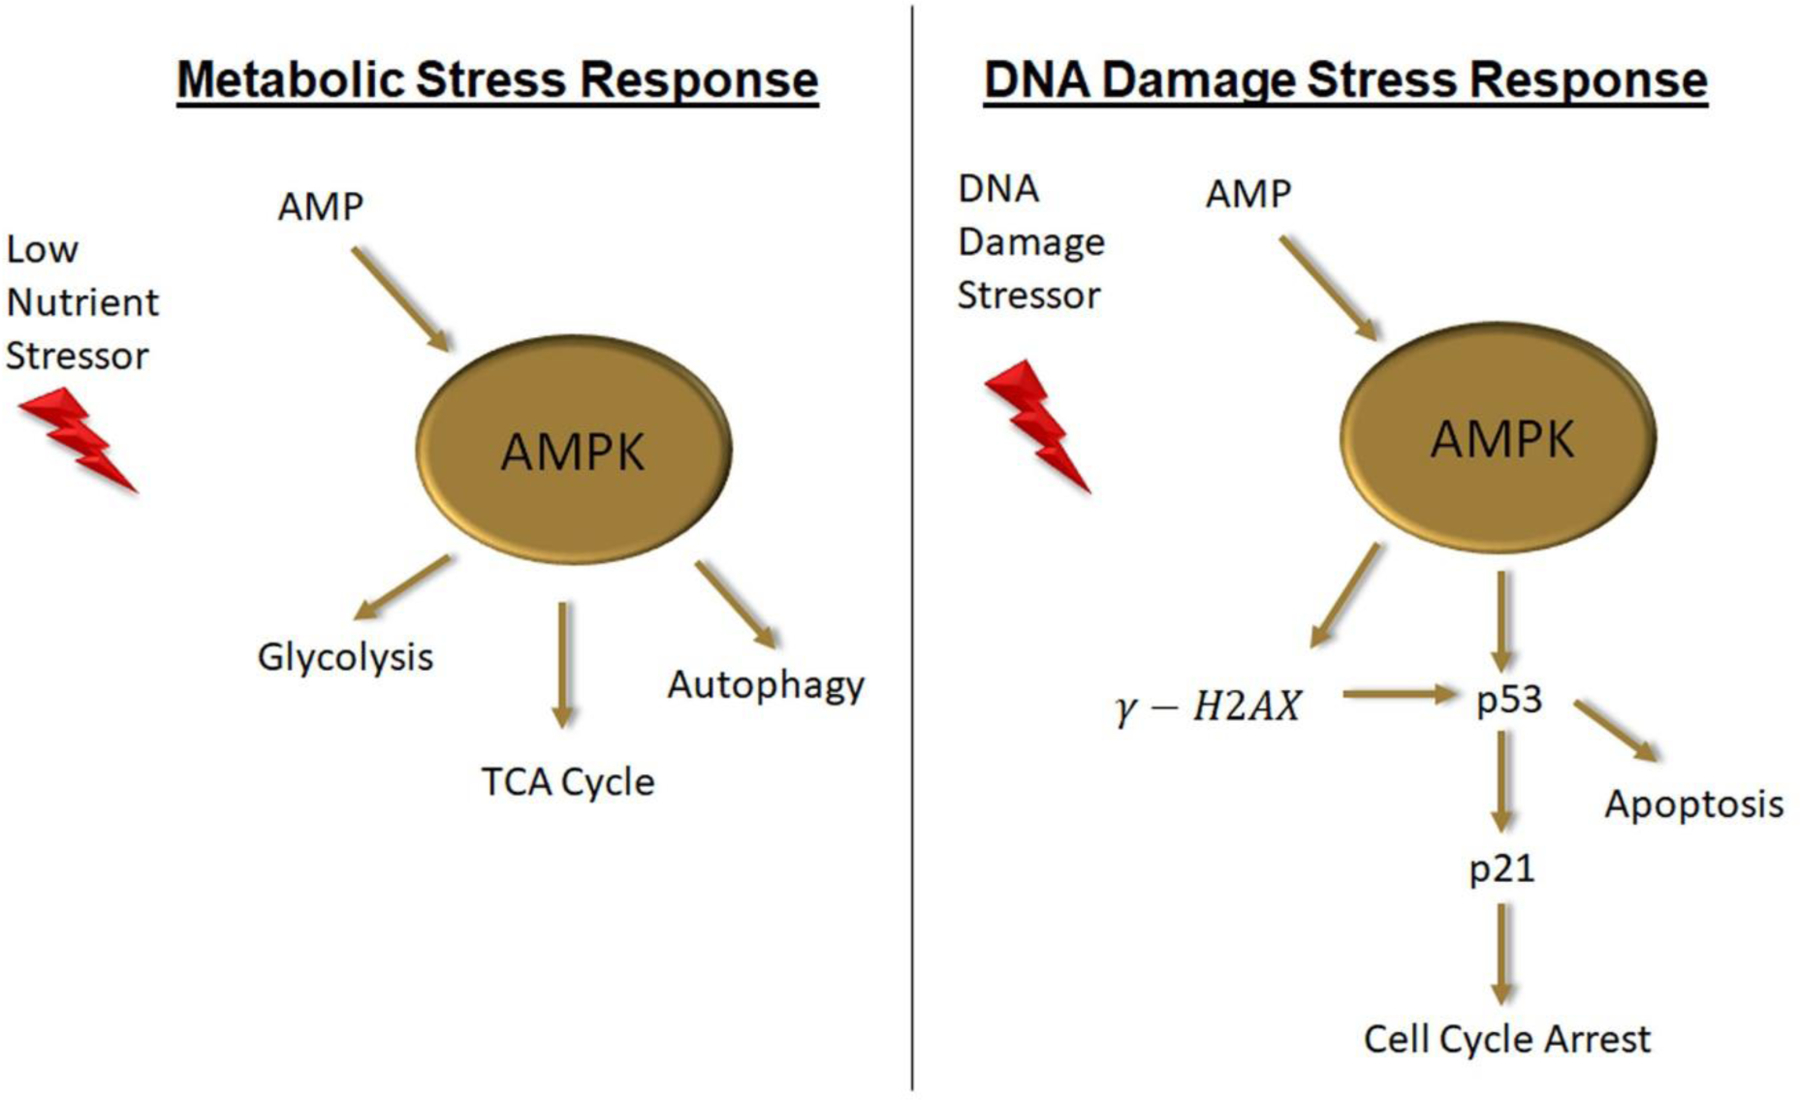
When nutritional stores are low AMP levels raise activating AMPK which in turn activates the energy producing pathways of glycolysis, TCA cycle and autophagy. When DNA damage occurs AMPK integrates nutritional reserve data by stimulating H2AX foci formation and p53 induction leading to increased apoptosis when nutritional reserve is insufficient to repair the damage.
Supplementary Material
Highlights.
AMPK activity can protect AML cells from metabolic stress
DNA damage response was impaired in AML cells without AMPK activity leading to reduced induction of p53 and apoptosis following chemotherapy
Lower expression of AMPK led to decreased survival in AML patients
AMPK activating small molecule AICAR increased AML cell response to chemotherapy
AMPK provides additional metabolic input into AML cell fate decisions following chemotherapy treatment
Acknowledgements
We would like to acknowledge the following funding: TSP, RGA, LPG and KMP are supported by 1R01CA197991-01A1. The Flow Cytometry Shared Resource contributed to this work and is supported by P30CA012197.
Footnotes
Publisher's Disclaimer: This is a PDF file of an unedited manuscript that has been accepted for publication. As a service to our customers we are providing this early version of the manuscript. The manuscript will undergo copyediting, typesetting, and review of the resulting proof before it is published in its final form. Please note that during the production process errors may be discovered which could affect the content, and all legal disclaimers that apply to the journal pertain.
Declaration of interests
The authors declare that they have no known competing financial interests or personal relationships that could have appeared to influence the work reported in this paper.
Declaration of Competing Interest
The authors whose names are listed in this manuscript declare no conflict of interest.
References
- [1].Dohner H, et al. , Diagnosis and management of AML in adults: 2017 ELN recommendations from an international expert panel, Blood 129 (2017) 424–447, 10.1182/blood-2016-08-733196. [DOI] [PMC free article] [PubMed] [Google Scholar]
- [2].SEER Cancer Statistics Review, 1975–2018, National Cancer Institute, Bethesda, MD, April 2021. https://seer.cancer.gov/csr/1975_2018/. based on November 2020 SEER data submission, posted to the SEER web site, April 2021. [Google Scholar]
- [3].Rollig C, et al. , A novel prognostic model in elderly patients with acute myeloid leukemia: results of 909 patients entered into the prospective AML96 trial, Blood 116 (2010) 971–978, 10.1182/blood-2010-01-267302. [DOI] [PubMed] [Google Scholar]
- [4].Vasu S, et al. , Ten-year outcome of patients with acute myeloid leukemia not treated with allogeneic transplantation in first complete remission, Blood Adv 2 (2018) 1645–1650, 10.1182/bloodadvances.2017015222. [DOI] [PMC free article] [PubMed] [Google Scholar]
- [5].Klepin HD, et al. , Geriatric assessment predicts survival for older adults receiving induction chemotherapy for acute myelogenous leukemia, Blood 121 (2013) 4287–4294, 10.1182/blood-2012-12-471680. [DOI] [PMC free article] [PubMed] [Google Scholar]
- [6].Appelbaum FR, et al. , Age and acute myeloid leukemia, Blood 107 (2006) 3481–3485, 10.1182/blood-2005-09-3724. [DOI] [PMC free article] [PubMed] [Google Scholar]
- [7].Thein MS, Ershler WB, Jemal A, Yates JW, Baer MR, Outcome of older patients with acute myeloid leukemia: an analysis of SEER data over 3 decades, Cancer 119 (2013) 2720–2727, 10.1002/cncr.28129. [DOI] [PMC free article] [PubMed] [Google Scholar]
- [8].Klepin HD, Rao AV, Pardee TS, Acute myeloid leukemia and myelodysplastic syndromes in older adults, J. Clin. Oncol.: Off.J. Am. Soc. Clin. Oncol (2014), 10.1200/JCO.2014.55.1564. [DOI] [PMC free article] [PubMed] [Google Scholar]
- [9].Patel SA, et al. , Clinico-genomic profiling and clonal dynamic modeling of TP53-aberrant myelodysplastic syndrome and acute myeloid leukemia, Leuk. Lymphoma 62 (2021) 3348–3360, 10.1080/10428194.2021.1957869. [DOI] [PubMed] [Google Scholar]
- 10.Herzig S, Shaw RJ, AMPK, Guardian of metabolism and mitochondrial homeostasis, Nat. Rev. Mol. Cell Biol 19 (2018) 121–135, 10.1038/nrm.2017.95. [DOI] [PMC free article] [PubMed] [Google Scholar]
- [11].Jeon SM, Regulation and function of AMPK in physiology and diseases, Exp. Mol. Med 48 (2016) e245, 10.1038/emm.2016.81. [DOI] [PMC free article] [PubMed] [Google Scholar]
- [12].Saito Y, Chapple RH, Lin A, Kitano A, Nakada D, AMPK protects leukemiainitiating cells in myeloid leukemias from metabolic stress in the bone marrow, Cell Stem Cell 17 (2015) 585–596, 10.1016/j.stem.2015.08.019. [DOI] [PMC free article] [PubMed] [Google Scholar]
- [13].Fernandes A, et al. , Proteolytic systems and AMP-activated protein kinase are critical targets of acute myeloid leukemia therapeutic approaches, Oncotarget 6 (2015) 31428–31440, 10.18632/oncotarget.2947. [DOI] [PMC free article] [PubMed] [Google Scholar]
- [14].Sanli T, Steinberg GR, Singh G, Tsakiridis T, AMP-activated protein kinase (AMPK) beyond metabolism: a novel genomic stress sensor participating in the DNA damage response pathway, Cancer Biol. Ther 15 (2014) 156–169, 10.4161/cbt.26726. [DOI] [PMC free article] [PubMed] [Google Scholar]
- [15].Jones RG, et al. , AMP-activated protein kinase induces a p53-dependent metabolic checkpoint, Mol. Cell 18 (2005) 283–293, 10.1016/j.molcel.2005.03.027. [DOI] [PubMed] [Google Scholar]
- [16].Zuber J, et al. , Mouse models of human AML accurately predict chemotherapy response, Genes Develop. 23 (2009) 877–889, 10.1101/Gad.1771409. [DOI] [PMC free article] [PubMed] [Google Scholar]
- [17].Burkewitz K, Zhang Y, Mair WB, AMPK at the nexus of energetics and aging, Cell Metabol. 20 (2014) 10–25, 10.1016/j.cmet.2014.03.002. [DOI] [PMC free article] [PubMed] [Google Scholar]
- [18].Pardee TS, et al. , A phase I study of CPI-613 in combination with high-dose cytarabine and mitoxantrone for relapsed or refractory acute myeloid leukemia, Clin. Cancer Res.: Off. J. Am. Ass. Cancer Res 24 (2018) 2060–2073, 10.1158/1078-0432.CCR-17-2282. [DOI] [PMC free article] [PubMed] [Google Scholar]
- [19].Sanli T, et al. , Ionizing radiation regulates the expression of AMP-activated protein kinase (AMPK) in epithelial cancer cells: modulation of cellular signals regulating cell cycle and survival, Radiother. Oncol 102 (2012) 459–465, 10.1016/j.radonc.2011.11.014. [DOI] [PubMed] [Google Scholar]
- [20].Anaya J, OncoLnc: linking TCGA survival data to mRNAs, miRNAs, and lncRNAs, Peerj Comput Sci (2016) doi: ARTN e67, 10.7717/peerj-cs.67. [DOI] [Google Scholar]
- [21].Wang Z, et al. , Targeting AMPK signaling pathway to overcome drug resistance for cancer therapy, Curr. Drug Targets 17 (2016) 853–864, 10.2174/1389450116666150316223655. [DOI] [PubMed] [Google Scholar]
- [22].Pardee TS, et al. , A phase I study of CPI-613 in combination with high dose cytarabine and mitoxantrone for relapsed or refractory acute myeloid leukemia, Clin. Cancer Res.: Off. J. Am. Ass. Cancer Res (2018), 10.1158/1078-0432.CCR-17-2282. [DOI] [PMC free article] [PubMed] [Google Scholar]
- [23].Farge T, et al. , Chemotherapy resistant human acute myeloid leukemia cells are not enriched for leukemic stem cells but require oxidative metabolism, Cancer Discov. (2017), 10.1158/2159-8290.CD-16-0441. [DOI] [PMC free article] [PubMed] [Google Scholar]
- [24].Ravà M, et al. , Therapeutic synergy between tigecycline and venetoclax in a preclinical model of MYC/BCL2 double-hit B cell lymphoma, Sci. Transl. Med 10 (2018), 10.1126/scitranslmed.aan8723. [DOI] [PubMed] [Google Scholar]
- [25].Chen X, et al. , Targeting mitochondrial structure sensitizes acute myeloid leukemia to venetoclax treatment, Cancer Discov. 9 (2019) 890–909, 10.1158/2159-8290.CD-19-0117. [DOI] [PMC free article] [PubMed] [Google Scholar]
- [26].Faubert B, et al. , AMPK is a negative regulator of the Warburg effect and suppresses tumor growth in vivo, Cell Metabol. 17 (2013) 113–124, 10.1016/j.cmet.2012.12.001. [DOI] [PMC free article] [PubMed] [Google Scholar]
- [27].Wen S, Zhu D, Huang P, Targeting cancer cell mitochondria as a therapeutic approach, Future Med. Chem 5 (2013) 53–67, 10.4155/fmc.12.190. [DOI] [PMC free article] [PubMed] [Google Scholar]
- [28].Bhanot H, et al. , Pathological glycogenesis through glycogen synthase 1 and suppression of excessive AMP kinase activity in myeloid leukemia cells, Leukemia 29 (2015) 1555–1563, 10.1038/leu.2015.46. [DOI] [PMC free article] [PubMed] [Google Scholar]
- [29].Hardie DG, AMP-activated protein kinase: an energy sensor that regulates all aspects of cell function, Genes Develop. 25 (2011) 1895–1908, 10.1101/gad.17420111. [DOI] [PMC free article] [PubMed] [Google Scholar]
- [30].Shackelford DB, et al. , mTOR and HIF-1alpha-mediated tumor metabolism in an LKB1 mouse model of Peutz-Jeghers syndrome, in: Proceedings of the National Academy of Sciences of the United States of America vol. 106, 2009, pp. 11137–11142, 10.1073/pnas.0900465106. [DOI] [PMC free article] [PubMed] [Google Scholar]
- [31].Joerger AC, Fersht AR, The tumor suppressor p53: from structures to drug discovery, Cold Spring Harbor Perspect. Biol 2 (2010) a000919, 10.1101/cshperspect.a000919. [DOI] [PMC free article] [PubMed] [Google Scholar]
- [32].Sur S, et al. , A panel of isogenic human cancer cells suggests a therapeutic approach for cancers with inactivated p53, in: Proceedings of the National Academy of Sciences of the United States of America, vol. 106, 2009, pp. 3964–3969, 10.1073/pnas.0813333106. [DOI] [PMC free article] [PubMed] [Google Scholar]
- [33].Georgoulis A, Vorgias CE, Chrousos GP, Rogakou EP, Genome instability and gammaH2AX, Int. J. Mol. Sci 18 (2017), 10.3390/ijms18091979. [DOI] [PMC free article] [PubMed] [Google Scholar]
- [34].Villanueva-Paz M, et al. , AMPK regulation of cell growth, apoptosis, autophagy, and bioenergetics, Exper. Suppl. (Basel) 107 (2016) 45–71, 10.1007/978-3-319-43589-3_3. [DOI] [PubMed] [Google Scholar]
Associated Data
This section collects any data citations, data availability statements, or supplementary materials included in this article.


