

SUMMARY
Peripheral T cell lymphoma not otherwise specified (PTCL-NOS) comprises heterogeneous lymphoid malignancies characterized by pleomorphic lymphocytes and variable inflammatory cell-rich tumor microenvironment. Genetic drivers in PTCL-NOS include genomic alterations affecting the VAV1 oncogene; however, their specific role and mechanisms in PTCL-NOS remain incompletely understood. Here we show that expression of Vav1-Myo1f, a recurrent PTCL-associated VAV1 fusion, induces oncogenic transformation of CD4+ T cells. Notably, mouse Vav1-Myo1f lymphomas show T helper type 2 features analogous to high-risk GATA3+ human PTCL. Single-cell transcriptome analysis reveals that Vav1-Myo1f alters T cell differentiation and leads to accumulation of tumor-associated macrophages (TAMs) in the tumor microenvironment, a feature linked with aggressiveness in human PTCL. Importantly, therapeutic targeting of TAMs induces strong anti-lymphoma effects, highlighting the lymphoma cells’ dependency on the microenvironment. These results demonstrate an oncogenic role for Vav1-Myo1f in the pathogenesis of PTCL, involving deregulation in T cell polarization, and identify the lymphoma-associated macrophage-tumor microenvironment as a therapeutic target in PTCL.
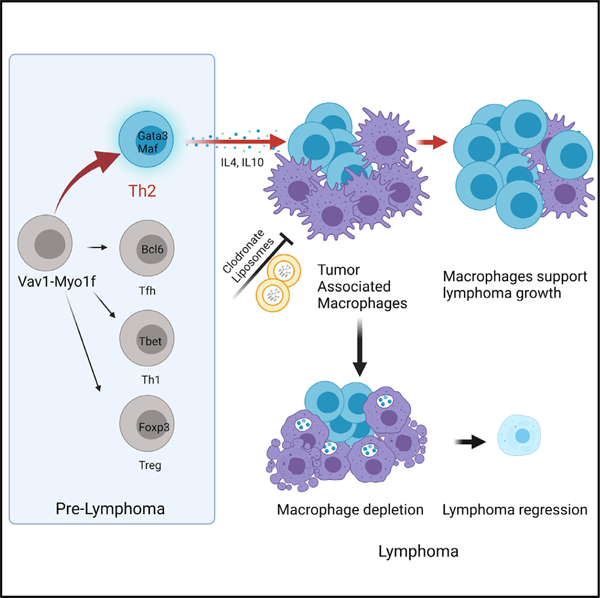
Graphical Abstract
In brief
Cortes et al. show that expression of Vav1-Myo1f, a recurrent peripheral T cell lymphoma (PTCL)-associated VAV1 fusion, induces CD4+ T cell lymphoma with features analogous to high-risk GATA3+ human PTCL. Expression of Vav1-Myo1f induces recruitment of tumor-associated macrophages to the tumor microenvironment that can be targeted for therapeutic intervention in PTCL.
INTRODUCTION
Peripheral T cell lymphoma not otherwise specified (PTCL-NOS) encompasses a heterogeneous group of mature T cell malignancies that lack specific histopathological features that lend assignment to particular diagnostic entities. PTCL-NOS represents almost 20% of PTCL cases and is associated with poor outcomes. Cell-of-origin classifications have subdivided PTCL-NOS cases based on expression levels of TBX21 and GATA3 (Iqbal et al., 2014; Wang et al., 2014), master transcription factors for T helper 1 (Th1) and Th2 development, respectively (Kanhere et al., 2012). Importantly, high levels of GATA3 in tumor cells have been associated with poor prognosis (Amador et al., 2019). Clonal, neoplastic T cells frequently account for only a small fraction of the tumor cellularity in PTCL-NOS biopsies, which also include a rich and polymorphic tumor microenvironment primarily composed of reactive T and B lymphocytes, follicular dendritic cells, macrophages, and endothelial cells (Pizzi et al., 2018). Interestingly, gene expression signatures derived from tumor-infiltrating immune cells have been associated with disease prognosis (Sugio et al., 2018), suggesting that functional interactions between lymphoma cells and tumor microenvironment are of pathogenic and clinical relevance.
Genomic studies have uncovered specific genetic drivers of PTCL-NOS. These include recurrent lesions in genes encoding epigenetic regulators (TET2, DNMT3A, IDH2), a highly prevalent RHOA G17V mutation characteristically associated with tumors bearing T-follicular helper (Tfh) characteristics, loss-of-function mutations in TP53, and genetic alterations resulting in enhanced signaling downstream of T cell receptor activation (Cortes and Palomero, 2020). Prominent among them are those resulting in increased VAV1 signaling (Abate et al., 2017; Watatani et al., 2019). VAV1 alterations in PTCL encompass point mutations, focal intragenic deletions resulting in expression of a mis-spliced transcript variant, and gene fusions in which the autoinhibitory C-terminal SH3 domain of VAV1 is replaced by an unrelated protein sequence from the fusion partner (Abate et al., 2017; Boddicker et al., 2016; Fujisawa et al., 2018; Fukumoto et al., 2020; Watatani et al., 2019). VAV1-MYO1F is a recurrent example of a PTCL-associated VAV1 fusion oncogene in which the C-terminal SH3 domain of VAV1 is replaced by that of MYO1F (Abate et al., 2017; Boddicker et al., 2016). An oncogenic role for PTCL-associated VAV1 fusions is supported by cellular models in which VAV1 fusion expression results in strong activation of VAV1-dependent signaling cascades, including mitogen-activated protein kinase (ERK1/2), c-Jun N-terminal kinase (JNK), and nuclear factor of activated T cells (NFAT) pathways (Abate et al., 2017; Fujisawa et al., 2018; Fukumoto et al., 2020).
Here, we leverage a conditional inducible knockin mouse with selective expression of Vav1-Myo1f in CD4+ T cells to demonstrate an oncogenic driver role of this gene fusion in PTCL-NOS. Importantly, Vav1-Myo1f-induced tumor T cells express GATA3 and show Th2 features related to high-risk PTCL-NOS. In addition, Vav1-Myo1f-induced lymphomas show increased macrophage-associated gene expression signatures associated with prominent macrophage infiltration, features that in human tumors correlate with poor clinical outcomes. Therapeutic ablation of macrophage populations in this model induced strong anti-lymphoma effects, in support of an active role of the tumor microenvironment in promoting lymphoma cell proliferation and survival.
RESULTS
Expression of Vav1-Myo1f in CD4+ T cells alters T cell specification, leading to Th2 polarization
To investigate the role of the Vav1-Myo1f fusion in T cell development and lymphoma, we engineered a Vav1-Myo1f conditional knockin mouse model (Vav1co-Vav1-Myo1f). Vav1co-Vav1-Myo1f mice were crossed with a CD4CreERT2 inducible deleter line (Aghajani et al., 2012) to enable tamoxifen (TMX)-inducible specific expression of Vav1-Myo1f in CD4+ T cells (Figures S1A and S1B).
In vivo TMX treatment of CD4CreERT2 Vav1co-Vav1-Myo1f/wt mice resulted in effective Cre-mediated recombination at the engineered Vav1co-Vav1-Myo1f locus with specific expression of Vav1-Myo1f in CD4+ T cells (Figure S1C). Immunophenotypic analysis of CD4+ T cells following Vav1-Myo1f expression revealed increased frequency of activated T cell populations as demonstrated by increased CD4+ CD69+ cells and inducible co-stimulator (ICOS) upregulation (Figures 1A–1C). Analysis of T helper cell populations identified an increase in CXCR5+ PD1+ Tfh cells (Figure 1D) and increased FOXP3+ regulatory T cells (Treg) (Figure 1E). In addition, we specifically observed an increase in CD62Llow CD44high effector/memory CD4+ T cells and expansion of CXCR3+ CD4+ Th1 cells (Figures 1F and 1G). These results are in contrast to CD4-specific expression of Rhoa G17V, which shows increased Tfh and, to a lesser extent, Treg populations (Cortes et al., 2018) and an absence of Th1 expansion (Figures S1D–S1G). These results demonstrate distinct and complex effects of Vav1-Myo1f expression in the differentiation of mature CD4+ T cell populations.
Figure 1. Vav1-Myo1f expression alters immune homeostasis and preferentially induces Th2 differentiation upon MAF upregulation.
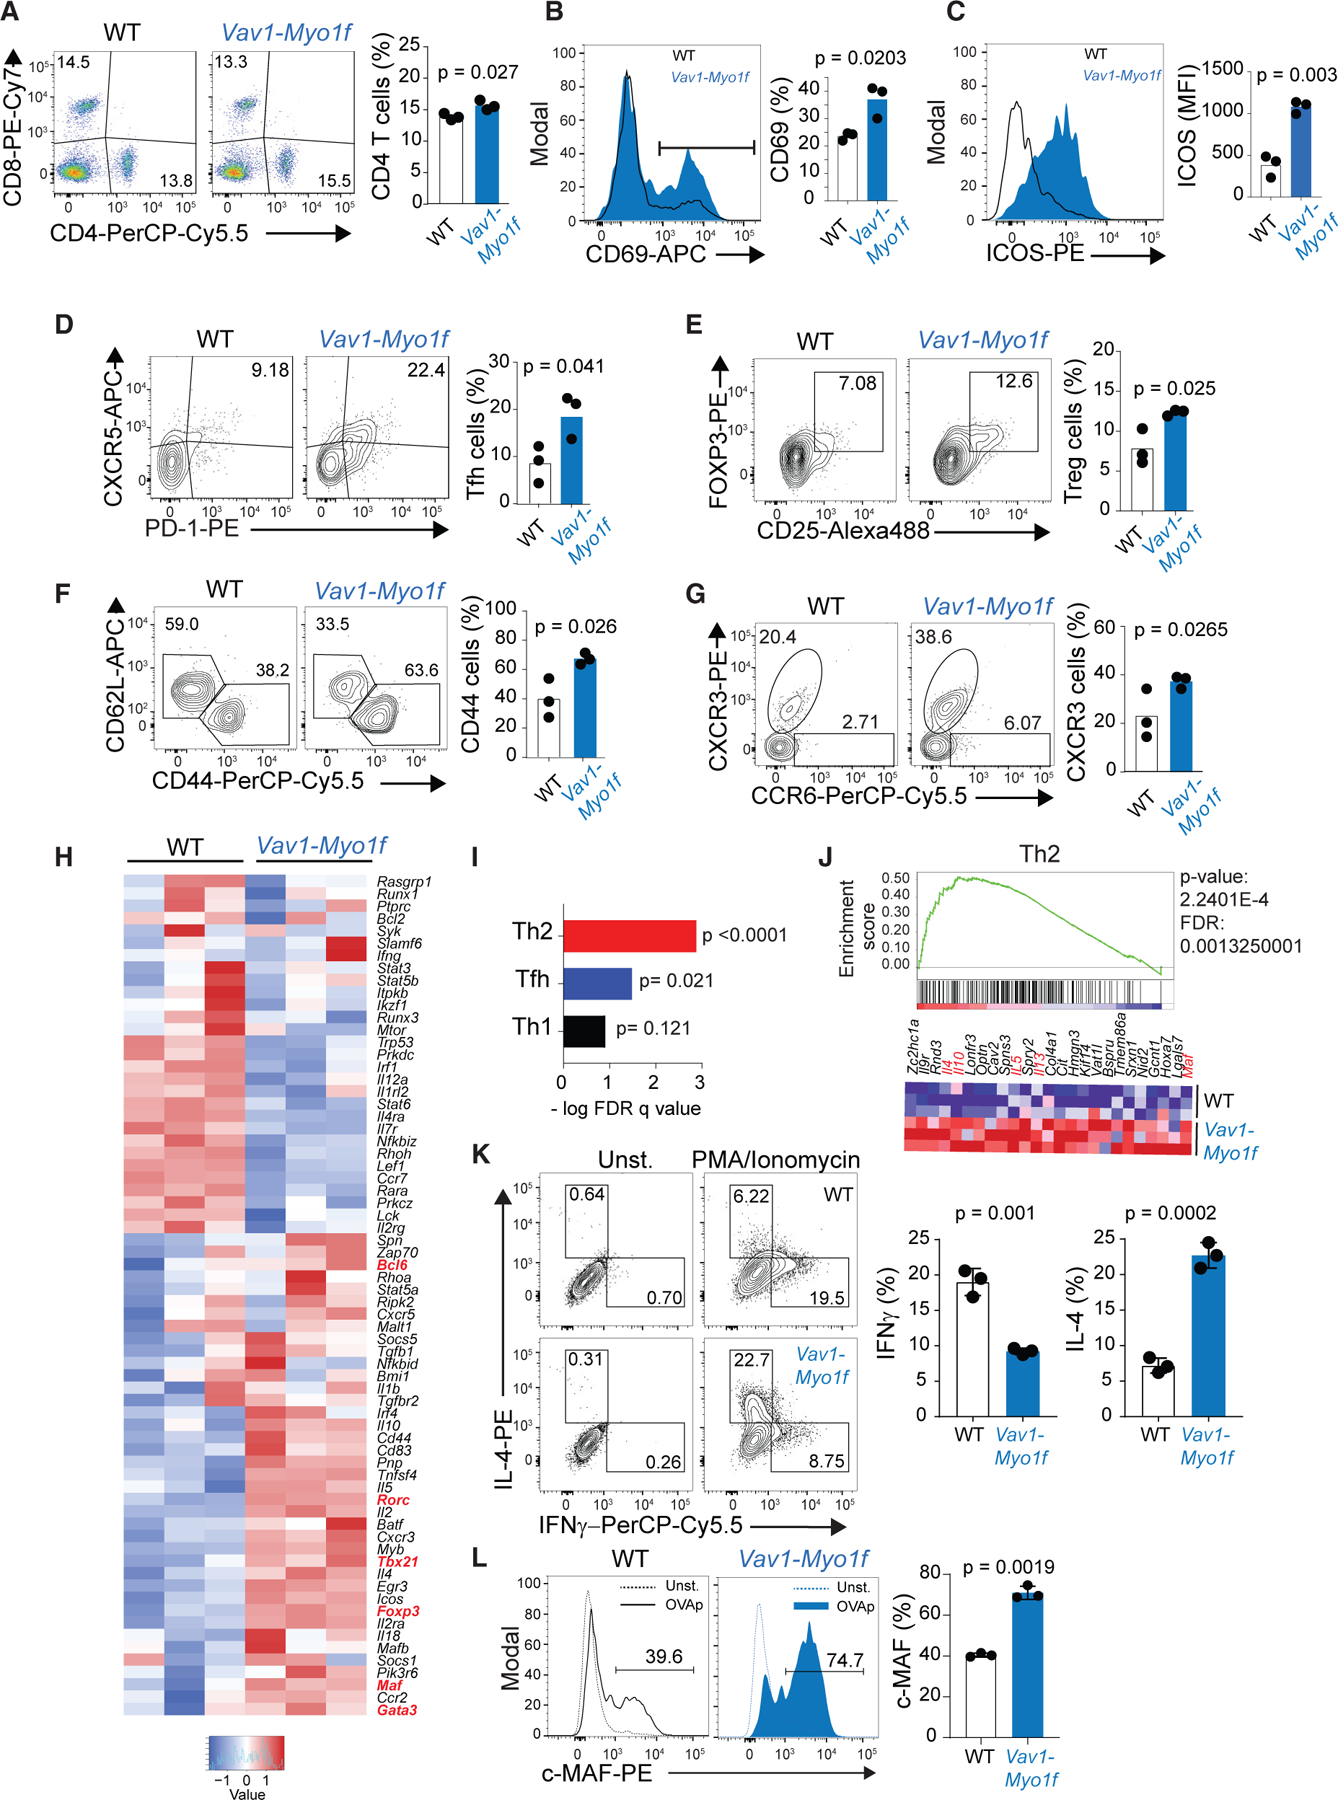
(A) Representative fluorescence-activated cell sorting (FACS) plot showing CD4/CD8 staining and associated quantification of CD4+ T cells in spleen samples from Vav1WT/co-Vav1-Myo1f;CD4CreERT2 mice treated with vehicle (WT) or tamoxifen (TMX) (Vav1-Myo1f).
(B and C) Representative histograms and associated quantification of CD69 (B) and ICOS (C) in splenic CD4+ T cells from Vav1WT/co-Vav1-Myo1f;CD4CreERT2 mice treated in vivo with vehicle (WT) or TMX (Vav1-Myo1f).
(D–G) Representative FACS plots of lineage marker staining and associated quantification of PD1+CXCR5+ Tfh cells (D), CD25+FOXP3 Treg cells (E), CD44 and CD62L (F), and CXCR3 and CCR6 T helper markers (G) in splenic CD4+ T cells isolated from Vav1WT/co-Vav1-Myo1f;CD4CreERT2 mice treated in vivo with vehicle (WT) or TMX (Vav1-Myo1f).
(H) Heatmap representation showing differential expression of genes associated with T helper cell differentiation in CD4+ T cells from Vav1WT/co-Vav1-Myo1f;CD4-T2 CreER mice treated in vivo with vehicle (WT) or TMX (Vav-Myo1f). Transcription factors implicated in T helper cell fate are marked in red. Gene list was curated from public transcriptome and gene ontology datasets.
(I) Graph representation of GSEA –log FDR q values for Th2, Tfh, and Th1 signatures.
(J) GSEA showing the enrichment of a Th2 signature associated with the presence of the Vav1-Myo1f fusion, and heatmap representation of the top-ranking genes in the leading edge.
(K) Analysis of IL-4 and IFNG secretion by wild-type (WT) or Vav1-Myo1f-expressing CD4+ T cells isolated from Vav1WT/co-Vav1-Myo1f;CD4CreERT2 mice and treated in vitro with vehicle (WT) or 4-hydroxytamoxifen (Vav1-Myo1f).
(L) Representative histograms and associated quantification of the transcription factor MAF in CD4+ T cells isolated from Vav1WT/co-Vav1-Myo1f;CD4CreERT2 mice and treated as described in (K).
For gene expression analysis, three independent replicates per genotype were analyzed. For in vivo experiments (A–G), the data correspond to two independent experiments (n = 3 animals/group). p values were calculated using a two-tailed Student’s t test. Error bars denote mean ± SD. See also Figure S1.
To further explore the effects of Vav1-Myo1f in T cell differentiation and homeostasis, we performed RNA-sequencing (RNA-seq) profiling of sorted CD4+ T cells from Vav1co-Vav1-Myo1f/wt CD4CreERT2 mice after TMX treatment and the corresponding vehicle-treated controls. These analyses revealed upregulation of master transcription factor regulators of CD4+ T cell lineage differentiation associated with Tfh (Bcl6), Th1 (Tbx21), Th2 (Gata3, Maf), Treg (Foxp3), and Th17 (Rorc) (Figure 1H). Despite this apparently heterogeneous transcriptional circuitry, gene set enrichment analysis (GSEA) of lineage-associated transcriptional signatures demonstrated selective significant enrichment of a Th2-associated transcriptional program in CD4+ T cells following expression of Vav1-Myo1f (Figures 1I and 1J) and enrichment of processes involved in the regulation of the immune system and cell activation (Figure S1H).
Accordingly, phorbol myristate acetate (PMA)/ionomycin restimulation of wild-type CD4+ T cells cultured in vitro in the absence of cytokines, produced preferentially interferon-γ (IFNG). In contrast, PMA/ionomycin restimulation of Vav1-Myo1f-expressing CD4+ T cells induced preferential secretion of interleukin-4 (IL-4) (Figure 1K), indicating activation of a Th2 differentiation program. In addition, anti-CD3/CD28 stimulation of Vav1-Myo1f-expressing CD4+ T cells induced a prominent increase in the expression of MAF, a master regulator of Th2 polarization (Figure 1L). Consistent with the role of MAF as regulator of IL-10 cytokine production in Th2 cells (Gabrysova et al., 2018; Rutz and Ouyang, 2016), Vav1-Myo1f-expressing CD4+ T cells also secreted increased levels of IL-10 upon restimulation (Figure S1I). More broadly, GSEA demonstrated significant enrichment of genes upregulated by MAF in Th2 cells (Gabrysova et al., 2018) in CD4+ T cells following Vav1-Myo1f expression (Figure S1J). Altogether, these results support an instructive role for Vav1-Myo1f in CD4+ T cell MAF-controlled Th2 differentiation.
Vav1-Myo1f expression increases cell proliferation and survival of CD4+ T cells
Next, and given the proposed role for T cell receptor (TCR) signaling as an oncogenic driver in the pathogenesis of PTCL (Cortes and Palomero, 2020; Warner et al., 2013), we analyzed the effect of Vav1-Myo1f expression on TCR signaling. Analysis of VAV1 phosphorylation showed a marked increase in VAV1 phospho-Tyr174 in Vav1-Myo1f-expressing CD4+ T cells compared with wild-type controls (Figure 2A). Consistently, TCR engagement also led to an increase in ERK1/2 phosphorylation (Figure 2B), cytokine secretion (Figure 2C), increased T cell proliferation, and upregulation of the activation markers CD69 and CD25 in Vav1-Myo1f-expressing CD4+ T cells following TCR activation (Figures 2D and 2E). Finally, we evaluated the effects of Vav1-Myo1f-expression in cell survival. In vitro withdrawal of IL-2, a major contributor in support of mature T cell viability (Malek, 2008), demonstrated increased resistance to cytokine-depletion-induced cell death in Vav1-Myo1f-expressing CD4+ T cells compared with controls (Figure 2F).
Figure 2. Vav1-Myo1f expression enhances TCR signaling and proliferation of CD4+ T cells.
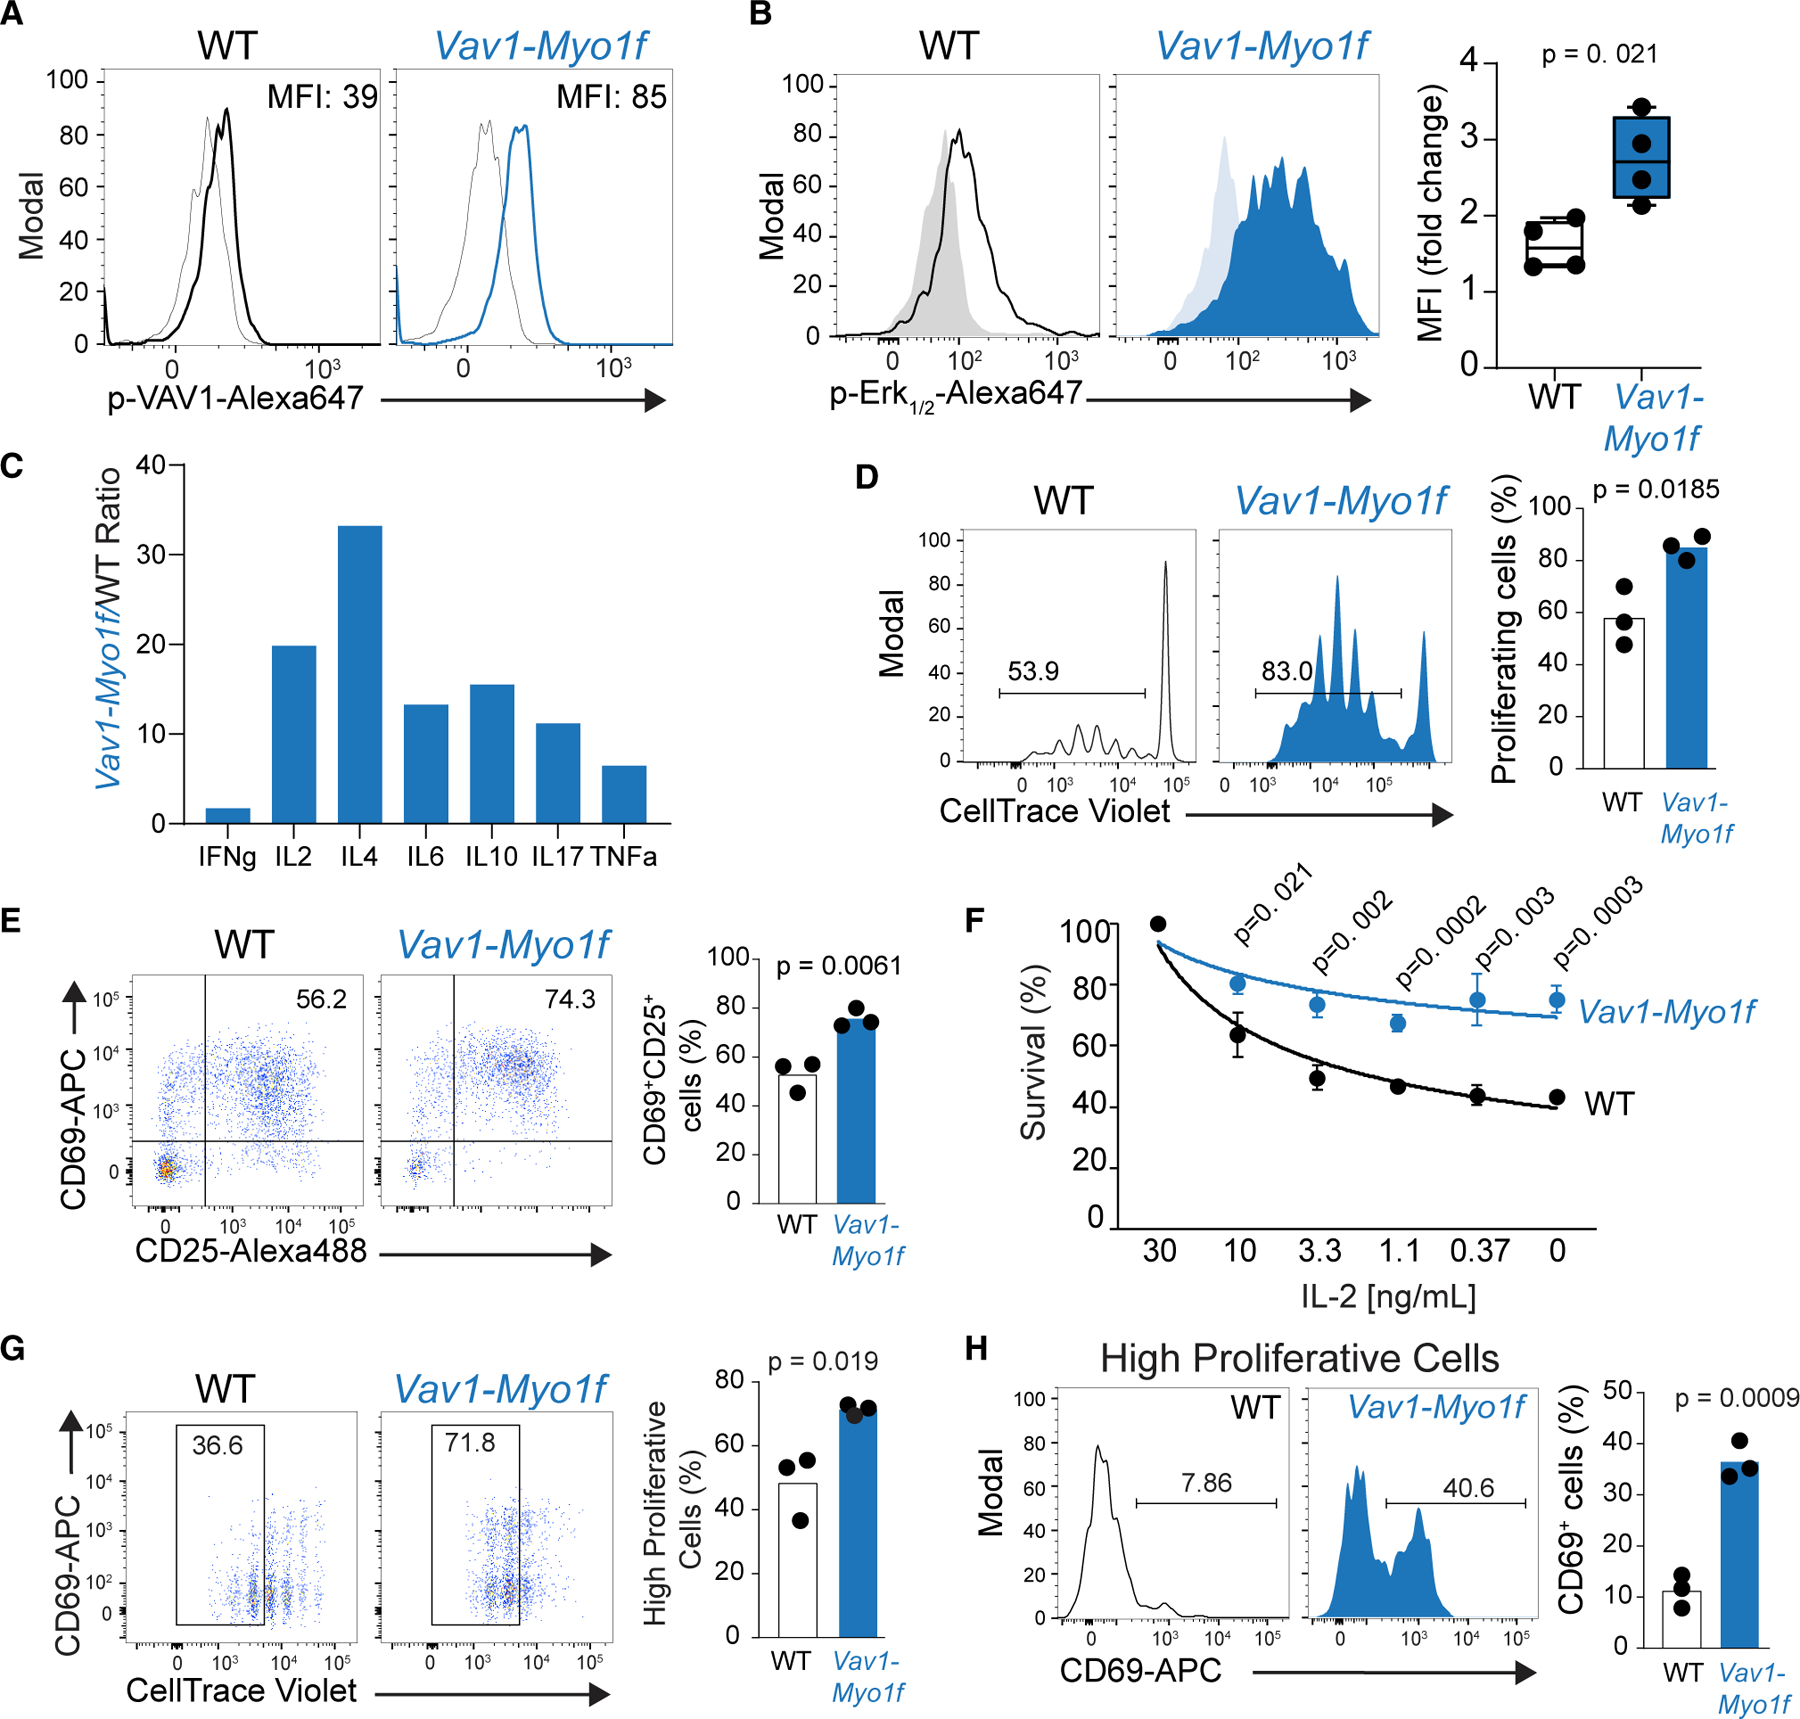
(A) Flow-cytometry analysis of VAV1 phosphorylation in Vav1WT/co-Vav1-Myo1f;CD4CreERT2 CD4+ T cells treated in vitro with vehicle (WT) or 4-hydroxytamoxifen (Vav1-Myo1f) upon TCR stimulation.
(B) Representative FACS plot and associated quantification of phosphorylation of ERK1/2 in CD4+ T cells obtained and treated as in (A).
(C) Quantification of Th1, Th2, and Th17 cytokines from media collected from cells obtained and stimulated as in (A). Cytokine quantification is represented as expression ratio in Vav1-Myo1f-expressing versus control WT cells.
(D) In vitro cell trace violet (CTV) proliferation assay of CD4+ T cells isolated from Vav1WT/co-Vav1-Myo1f;CD4CreERT2 mice, treated with vehicle (WT) or TMX (Vav1-Myo1f) and stimulated with anti-CD3/anti-CD28.
(E) Representative FACS plot and associated quantification of the upregulation of the activation markers CD69 and CD25 in WT or Vav1-Myo1f CD4+ T cells after in vitro stimulation with anti-CD3/anti-CD28.
(F) Analysis of cell viability in CD4+ T cells isolated from Vav1WT/co-Vav1-Myo1f;CD4CreERT2 and treated with vehicle (WT) or 4-hydroxytamoxifen in absence or decreasing concentrations of IL-2. Mean fluorescence intensity values in (B) were calculated as fold change in activated versus non-activated cells from four independent experiments. p values in (C)–(F) were calculated using a two-tailed Student’s test in triplicate samples.
(G) In vivo CTV proliferation assay of WT and Vav1-Myo1f-expressing CD4+ T cells obtained from OT-II;Vav1WT/co-Vav1-Myo1f;CD4CreERT2 mice, treated with vehicle (WT) or 4-hydroxytamoxifen (Vav1-Myo1f) and transferred to Ly5.1+ C57BL/6 mice. Data were obtained 3 days after immunization of recipients with OVA/Alum.
(H) Analysis of the activation marker CD69 in highly proliferative cells obtained from (G).
p values in (G) and (H) were calculated using a two-tailed Student’s t test with n = 3 animals/group. Error bars denote mean ± SD.
Following on from these results, we aimed to evaluate the effects of Vav1-Myo1f expression in antigen-specific TCR activation in vivo inVav1co-Vav1-Myo1f/wt CD4CreERT2 OT-II transgenic mice. Immunization with NP-OVA induced higher proliferation and increased CD69 expression within the highly proliferative cell compartment in Vav1-Myo1f lymphocytes compared with controls (Figures 2G and 2H). Overall, these assays demonstrate increased TCR-mediated proliferation, activation, and increased resistance to cytokine withdrawal-induced apoptosis in Vav1-Myo1f-expressing T cells consistent with an oncogenic role in T cell transformation.
Expression of Vav1-Myo1f in CD4+ T cells induces peripheral T cell lymphoma
The identification of recurrent VAV1 genetic alterations suggests a driver pathogenic role for deregulated VAV1 signaling in PTCL (Abate et al., 2017; Boddicker et al., 2016; Fujisawa et al., 2018; Fukumoto et al., 2020; Watatani et al., 2019). To assess the role of Vav1-Myo1f in T cell transformation, we generated T cell-specific Vav1-Myo1f-expressing animals by crossing our Vav1co-Vav1-Myo1f/wt knockin model with CD4Cre mice, a T cell-specific Cre recombinase-expressing mouse line (Lee et al., 2001), and monitored them for signs of disease. In this cohort, 63% (7/11) of animals expressing Vav1-Myo1f in the T cell compartment developed lymphomas with a median latency of 370 days (Figure S2A). Mice harboring Vav1-Myo1f-induced lymphomas developed splenomegaly and generalized lymphadenopathy compared with age-matched wild-type controls (Figure S2B). Histopathologic examination of lymphoid tissues from diseased animals showed variable white pulp expansion by small- to medium- and occasionally large-sized pleomorphic lymphocytes in 75% of the mice examined and paracortical infiltrates of similar atypical lymphocytes in the lymph nodes of two out of two mice examined. Additionally, a moderate infiltrate of histiocytes was seen to be admixed. Immunohistochemical analyses confirmed the atypical lymphoid cells to be CD3+ and CD4+ (Figure S2C). RT-PCR analysis of CD4+ T cells from the spleens of diseased mice confirmed the expression of Vav1-Myo1f in tumor cells (Figure S2D). Further immunophenotypic characterization of the tumor population in mouse Vav1-Myo1f-induced lymphomas revealed accumulation of activated CD69+ CD4+ T cells (Figure S2E) with a specific CD62LlowCD44high memory-like immunophenotype (Figure S2F). Analysis of the TCR repertoire by flow cytometry demonstrated the clonal expansion of distinct CD4+ T cell subsets (Figure S2G). Notably, theVav1-Myo1f-induced lymphomas showed increased expression of the Th2 master regulator transcription factors GATA3 and MAF (Figure S2H) and displayed prominent Stat6 phosphorylation, a feature required for the induction of Th2 cell fate (Kaplan et al., 1996) (Figure S2I). Moreover, stimulation of Vav1-Myo1f-expressing lymphoma cells with PMA/ionomycin induced increased secretion of the Th2 cytokines IL-4 and IL-10 when compared with non-stimulated lymphoma cells (Figure S2J).
Transcriptome profiling of whole spleen from normal and diseased mice and sorted normal CD4+ lymphocytes and Vav1-Myo1f-induced lymphoma CD4+ T cells showed broad differences in gene expression (Figures S3A–S3F). Functional annotation of differentially expressed genes in Vav1-Myo1f-induced CD4+ tumor T cells compared with normal CD4+ T cell controls revealed a significant enrichment in Th2-associated signatures (Wei et al., 2009) but not in Tfh, Treg, Th1, or Th17 gene sets (Figure S3G) (Chtanova et al., 2004; Miyara et al., 2009; Wei et al., 2009). Prominent Th2-associated genes upregulated in Vav1-Myo1f-induced lymphoma CD4+ T cells included Gata3, Maf, Il4, Il10, Il5, and Il13 (Figure S3H). In all, these results demonstrate an oncogenic role of Vav1-Myo1f in the development of PTCL-NOS with Th2-like characteristics.
TET2 mutations are early genetic events in PTCL (Couronne et al., 2012) and have been shown to cooperate with secondary genetic lesions in the pathogenesis of this disease (Cortes et al., 2018; Moon et al., 2021; Ng et al., 2018). To address the significance of co-occurring Tet2 loss and Vav1 alterations, we generated Vav1co-Vav1-Myo1f/wt,Tet2fl/fl, CD4CreERT2 mice, in which TMX treatment induces simultaneously loss of Tet2 and expression of Vav1-Myo1f in CD4+ T cells. We used vehicle-treated Vav1co-Vav1-Myo1f/wt,Tet2fl/fl, CD4CreERT2 as control, as previous results from our group have consistently shown the lack of lymphoma development in the inducible CD4CreERT2 or CD4CreERT2 Tet2f/f models (Cortes et al., 2018; Moon et al., 2021). Control (vehicle-treated) and experimental (Vav1co-Vav1-Myo1f/wt,Tet2fl/fl, CD4CreERT2 TMX-treated) mice were immunized with sheep red blood cells for antigenic stimulation and monitored for development of disease. In this setting, 100% (10/10) of mice in the experimental cohort developed lymphomas, with a median survival of 365 days. In contrast, all mice in the control group remained lymphoma free at the end of follow-up (427 days) (p < 0.0001) (Figure 3A). Histopathologic examination of lymphoid tissues from diseased mice revealed moderate (50%) or mild (12%) white pulp expansion of the spleen by pleomorphic medium- to large-sized lymphocytes, while the splenic architecture was relatively preserved in the remainder. The atypical lymphocytic infiltrate was also identified in the lymph nodes (2/2), liver (3/8), lung (3/8), and kidney (2/8). Similar to the Vav1-Myo1f-induced lymphomas developing in Tet2 wild-type mice, increased numbers of histiocytes were also noted. Immunohistochemical analyses confirmed the atypical lymphoid cells to be CD3+ and CD4+ (Figure 3B). Flow-cytometric analysis of T cell populations revealed marked expansion of activated CD69+ CD4+ T cells (Figure 3C), while analysis of the distribution of TCR beta (TCRB) repertoires showed evidence of clonal expansions, consistent with lymphoma development (Figure 3D). Analogous to the Vav1co-Vav1-Myo1f/wt CD4Cre model, Tet2−/−Vav1-Myo1f-expressing lymphoma cells also showed increased expression of MAF and GATA3 (Figure 3E) and increased secretion of IL-4 and IL-10, compared with normal CD4+ T cell controls (Figure 3F).
Figure 3. Expression of Vav1-Myo1f and loss of Tet2 in CD4+ T cells induces lymphoma with GATA3+ PTCL-NOS features.
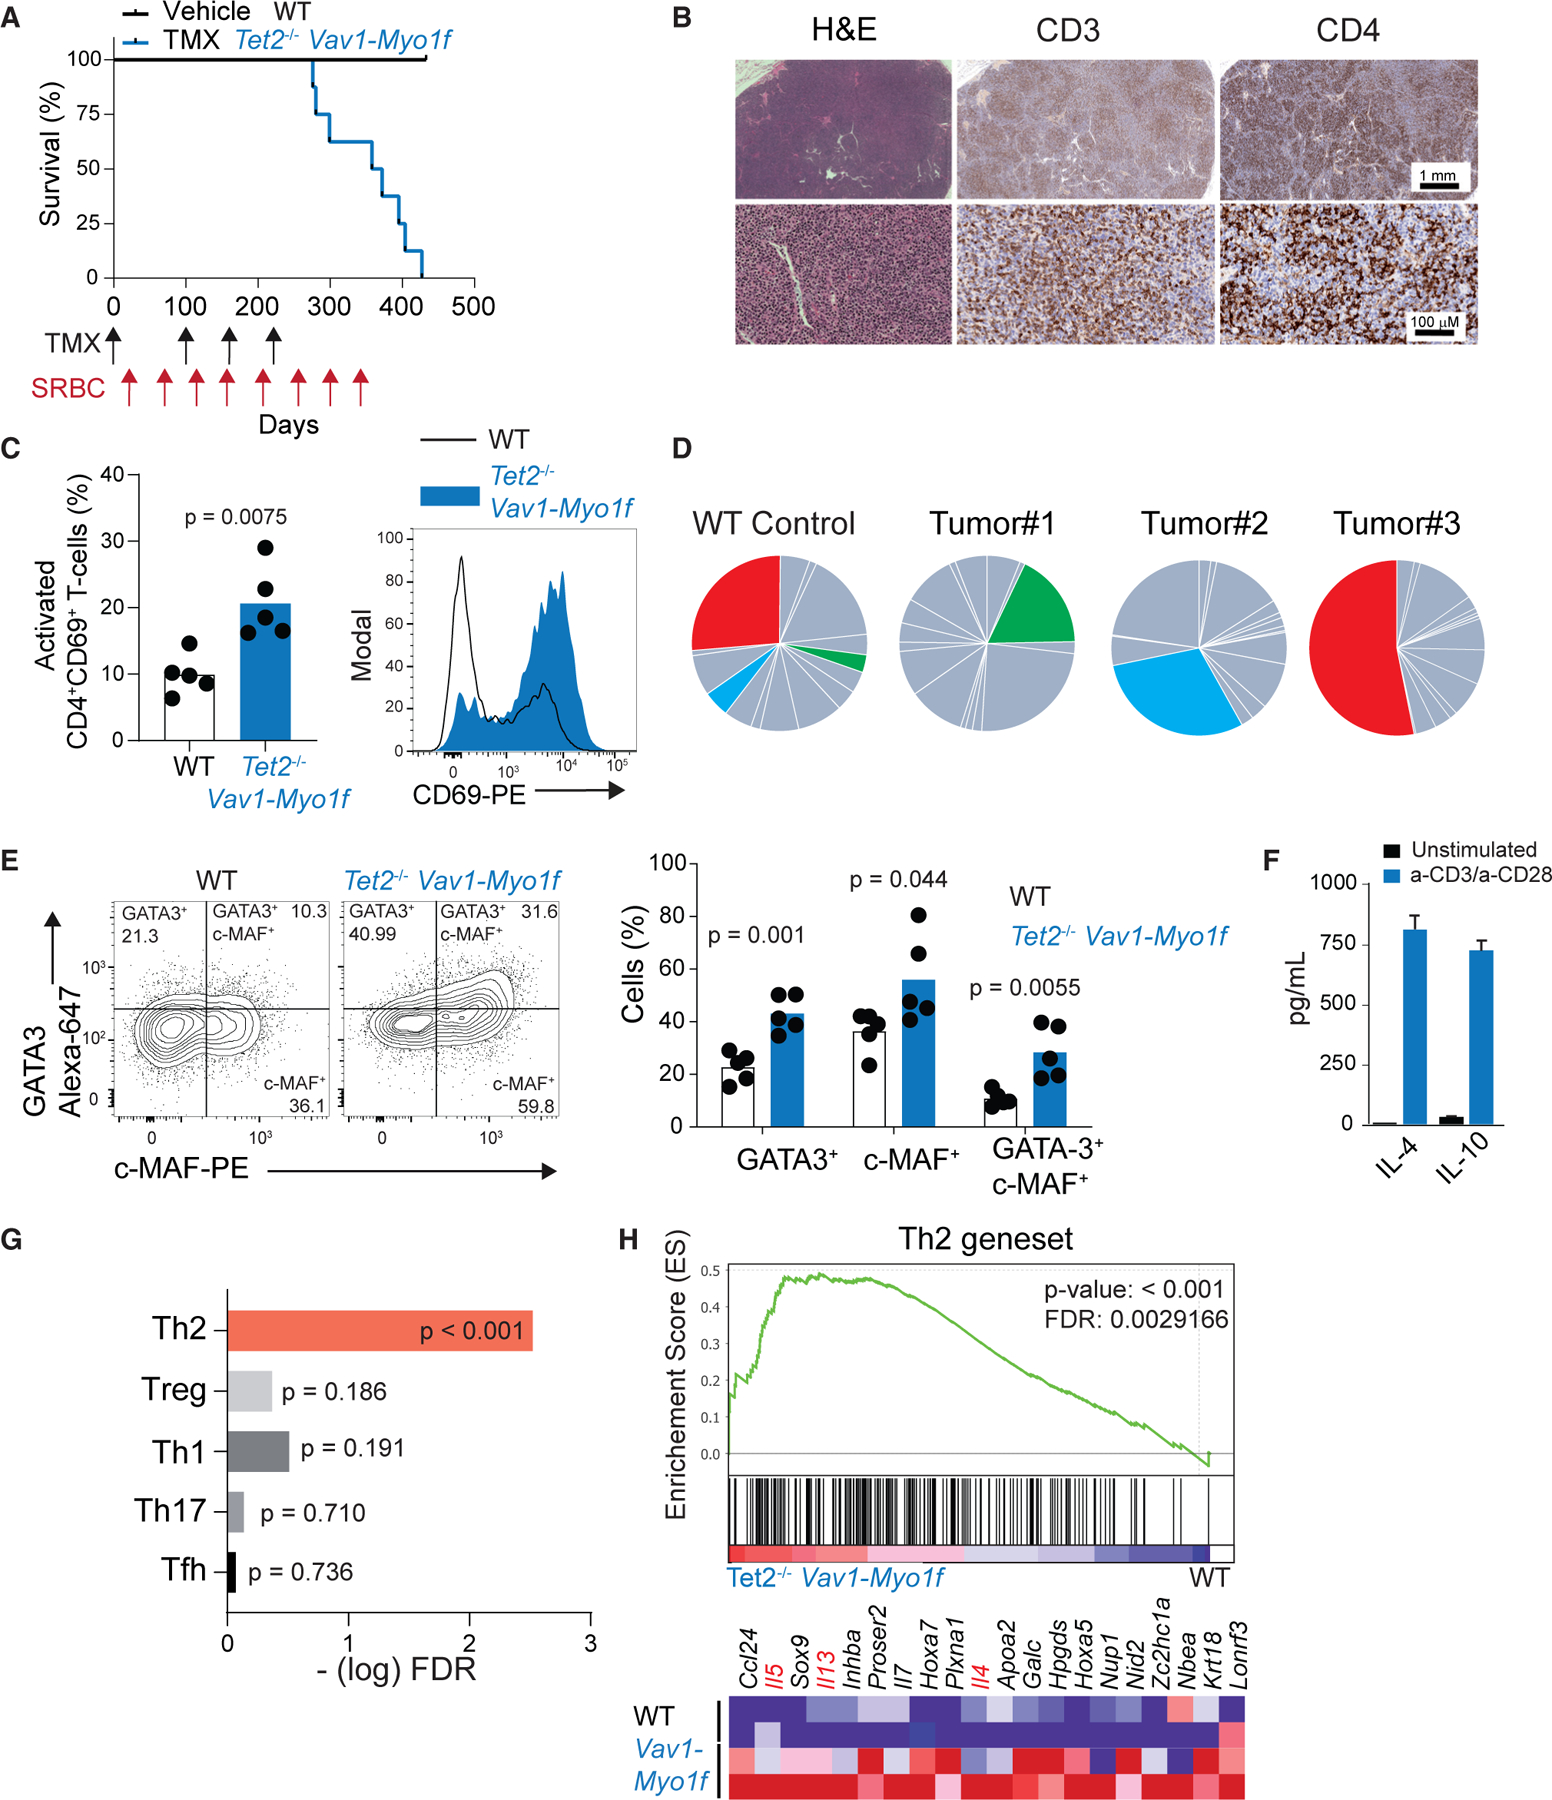
(A) Kaplan-Meier survival curve of Vav1WT/co-Vav1-Myo1f;Tet2fl/fl;CD4CreERT2 animals treated with vehicle (WT) or tamoxifen (TMX) (Tet2−/−Vav1-Myo1f) (n = 10 mice/group). TMX administration and sheep red blood cells (SRBC) immunizations are indicated by arrows in the timeline (black, TMX; red, SRBC).
(B) Histological hematoxylin-eosin (H&E) staining and immunohistochemical analysis of the expression of CD3 and CD4 in representative lymph node tissues obtained from Vav1-Myo1f lymphoma-bearing mice. Image magnifications are indicated by scale bars.
(C) Flow-cytometry analysis and quantification of activated CD4+CD69+ T cells in the spleen of Tet2−/−Vav1-Myo1f lymphoma-bearing mice and WT control littermates.
(D) Pie-chart representation of TCRB Vβ clonality analysis by flow cytometry on spleen samples from diseased animals. Colored segments indicate specific TCRB rearrangements that show significant expansion in each of the lymphoma samples compared with the reference TCR repertoire in WT mice. Data from three representative tumors are shown.
(E) Flow-cytometry analysis of GATA3 and MAF expression in Tet2−/−Vav1-Myo1f CD4+ lymphoma cells and WT controls.
(F) Quantification of IL-4 and IL-10 from media collected from Tet2−/−Vav1-Myo1f tumor cells upon stimulation with anti-CD3/anti-CD28.
(G) GSEA —log FDR q values of Th1, Th2, Th17, Treg, and Tfh signatures in sorted CD4+ T cells from Tet2−/−Vav1-Myo1f-induced lymphoma.
(H) GSEA plot showing enrichment in a Th2 signature in sorted CD4+ T cells isolated from Tet2−/−Vav1-Myo1f lymphoma-bearing mice and control WT CD4+ T cells. The heatmap represents the top-ranking 20 genes in the leading edge. Lineage marker genes associated with Th2 cell differentiation are shown in red. p value in (C) and (E) was calculated with two-tailed Student’s t test using n = 5 animals/group. Error bars denote mean ± SD. See also Figures S2–S5.
Gene expression profiling revealed significant enrichment of Th2-associated gene expression signatures (Chtanova et al., 2004; Miyara et al., 2009; Wei et al., 2009) in Vav1-Myo1f-induced lymphoma samples compared with vehicle-treated controls (Figures S3I–S3N, 3G, and 3H). Meanwhile, analysis of the Tfh compartment showed no expansion of CXCR5+ PD1+ Tfh cells (Figures S4A and S4B) and GSEA revealed no significant enrichment of a gene signature associated with human angioimmunoblastic T cell lymphoma (AITL) (de Leval et al., 2007) in Vav1-Myo1f and Tet2−/−Vav1-Myo1f lymphomas (Figures S4C and S4D). These results, together with the presence of GATA3 expression in Vav1-Myo1f-expressing lymphoma cells detected by immunohistochemistry (Figure S4E), indicate that Vav1-Myo1f-induced lymphomas closely resemble a GATA3+ Th2 PTCL-NOS.
Transcriptional analysis of lymphoma cells from the two models revealed slight enrichment in the Tfh signature in Vav1-Myo1f lymphoma cases (false discovery rate [FDR] 0.116) (Figures S4F and S4J), whereas tumor cells from lymphomas originating in the Tet2−/−Vav1-Myo1f genetic background showed enrichment in genes associated with human hematopoietic stem cells (Eppert et al., 2011), supporting a stemness-like phenotype in Tet2−/−Vav1-Myo1f lymphomas. This is consistent with the known role of Tet2 loss in promoting stem cell-like self-renewal (Moran-Crusio et al., 2011) (Figures S4K–S4M).
Transplant of sorted CD4+ T cells isolated from Tet2−/−Vav1-Myo1f diseased mice demonstrated spontaneous proliferation of the CD4+ population in transplanted recipients (Figure S5A) and accelerated development of secondary lymphomas (Figure S5B) that retain Th2-associated features, including GATA3 expression (Figure S5C). Analysis of two serial transplants and a Tet2−/−Vav1-Myo1f-derived lymphoma cell line showed progressive expansion of the original malignant clone, as identified by analysis of TCRB rearrangements, and continuous decrease of the CXCR5+ Tfh population, with concomitant increased expression of PD1 and CD69 activation markers and GATA3 (Figures S5D–S5K). Remarkably, GATA3 expression is increased in the CD4+CD69+ T cell fraction compared with CD4+CD69− T cells (Figure S5L), suggesting that this CD4+CD69+GATA3+ Th2-like population is enriched in malignant cells. To validate this hypothesis, we sorted the CD4+CD69+ (GATA3high) and CD4+CD69− (GATA3low) cells and transplanted them into secondary recipients. In this setting, only the mice transplanted with CD4+CD69+GATA3high T cells developed lymphoma (Figures S5M–S5O). Secondary tumors retained high CD69 expression and, more importantly, expressed increased levels of GATA3 compared with the non-malignant CD4+CD69−GATA3low cells (Figures S5P and S5Q). This result demonstrates that the tumor-initiating cell of Vav1-Myo1f-induced PTCL lies within the Th2 CD4+CD69+GATA3high fraction.
Finally, genomic analysis of Vav1-Myo1f and Tet2−/−Vav1-Myo1f CD4+ lymphoma cells by whole-exome sequencing identified somatic mutations that could potentially cooperate with expression of the Vav1-Myo1f fusion to promote transformation (Table S1). Interestingly, these included two mutations (2/10 cases; 20%) in Gna13, the gene that encodes the G alpha sub-unit 13 protein. GNA13 mutations are frequent in diffuse large B cell lymphoma (DLBCL) and Burkitt lymphoma (Lohr et al., 2012; Love et al., 2012; O’Hayre et al., 2016), albeit present at low frequency in human PTCL cohorts (3/293) (Abate et al., 2017; Palomero et al., 2014; Watatani et al., 2019).
Single-cell RNA-seq mapping of changes in CD4+ T cell populations during Vav1-Myo1f-induced transformation
To characterize the pre-malignant and lymphoma states induced by Vav1-Myo1f expression in CD4+ T cells, we analyzed single-cell transcriptomes of 44,262 cells from 12 whole-spleen cell preparations, including Vav1-Myo1f-induced lymphomas (Vav1-Myo1f, Tet2−/−Vav1-Myo1f), Vav1-Myo1f pre-lymphoma, and normal healthy wild-type isogenic control samples (n = 3) (Table S2). We defined pre-lymphoma as an early time point 2 weeks after induction of Vav1-Myo1f expression in CD4+ T cells before clonal expansion. We identified 16 different expression-based cell clusters (Figures S6A and 4A; Table S3), which segregated independently of cell proliferation signatures (Figure S6B). Transcription-based cluster annotation based on gene expression programs selectively associated with sorted mouse immune cells (ImmunCC) (Chen et al., 2017, 2018) identified ten different immune cell types with prominent representation of B cells, included in cluster 0 (naive B cells expressing Cd79a and Ighd), cluster 1 (mature B cells expressing Cr2 and Ebf1), cluster 4 (marginal zone B cells expressing Mzb1), and cluster 9 (plasma cells expressing Mk167); T cells, dendritic cells, and monocyte-macrophage populations (Figures 4B and S6C; Table S4; STAR Methods). Further analysis segregated the CD4+ T cell population into eight subclusters (Figure 4C) with distinct representation in normal, pre-lymphoma, and tumor states (Figure 4D). Lineage and functional annotation of CD4+ T cell populations based on the expression of selective marker genes and signatures (Figures 4E and S6D; Table S5) defined groups corresponding to activated (cluster 0, expressing Cxcr3 and Cd44), naive (cluster 1, expressing Cd62l and Klf2), Treg (cluster 2, expressing Foxp3, Ctla4, and Il2ra), memory CD4+ T (cluster 3, expressing Npm1, Eif5a and Eif4a1), Th2 (cluster 4, expressing Il1rl1, Gata3, and Pprag), and Tfh cells (cluster 5, expressing Cxcr5, Bcl6, and Pdcd1). Cluster 6, expressing Il21 and Zap70, could potentially represent a transitional or mixed phenotype state closer to Tfh cells. Finally, cells in cluster 7 lacked a clear set of differentially expressed genes, potentially indicative of cells of mixed phenotype (Table S6). Across samples, naive cells (cluster 1) were prominent in normal control and Vav1-Myo1f pre-lymphoma samples and were less frequent in Vav1-Myo1f-induced lymphomas. In contrast, activated T cells (cluster 0), Th2 cells (cluster 4), and the mixed phenotype population characterized by T cell activation markers (cluster 3) were characteristically more abundant in Vav1-Myo1f-induced lymphomas compared with normal and pre-malignant states, including the expression of Th2-associated markers Gata3 and Maf (Figure 4F), consistent with our previous data showing increased GATA3 and MAF expression in Vav1-Myo1f lymphomas (Figures S2H and 3E).
Figure 4. Immune cell analysis of Vav1-Myo1f-driven lymphomas at single-cell resolution identifies Th2-like tumor cells.
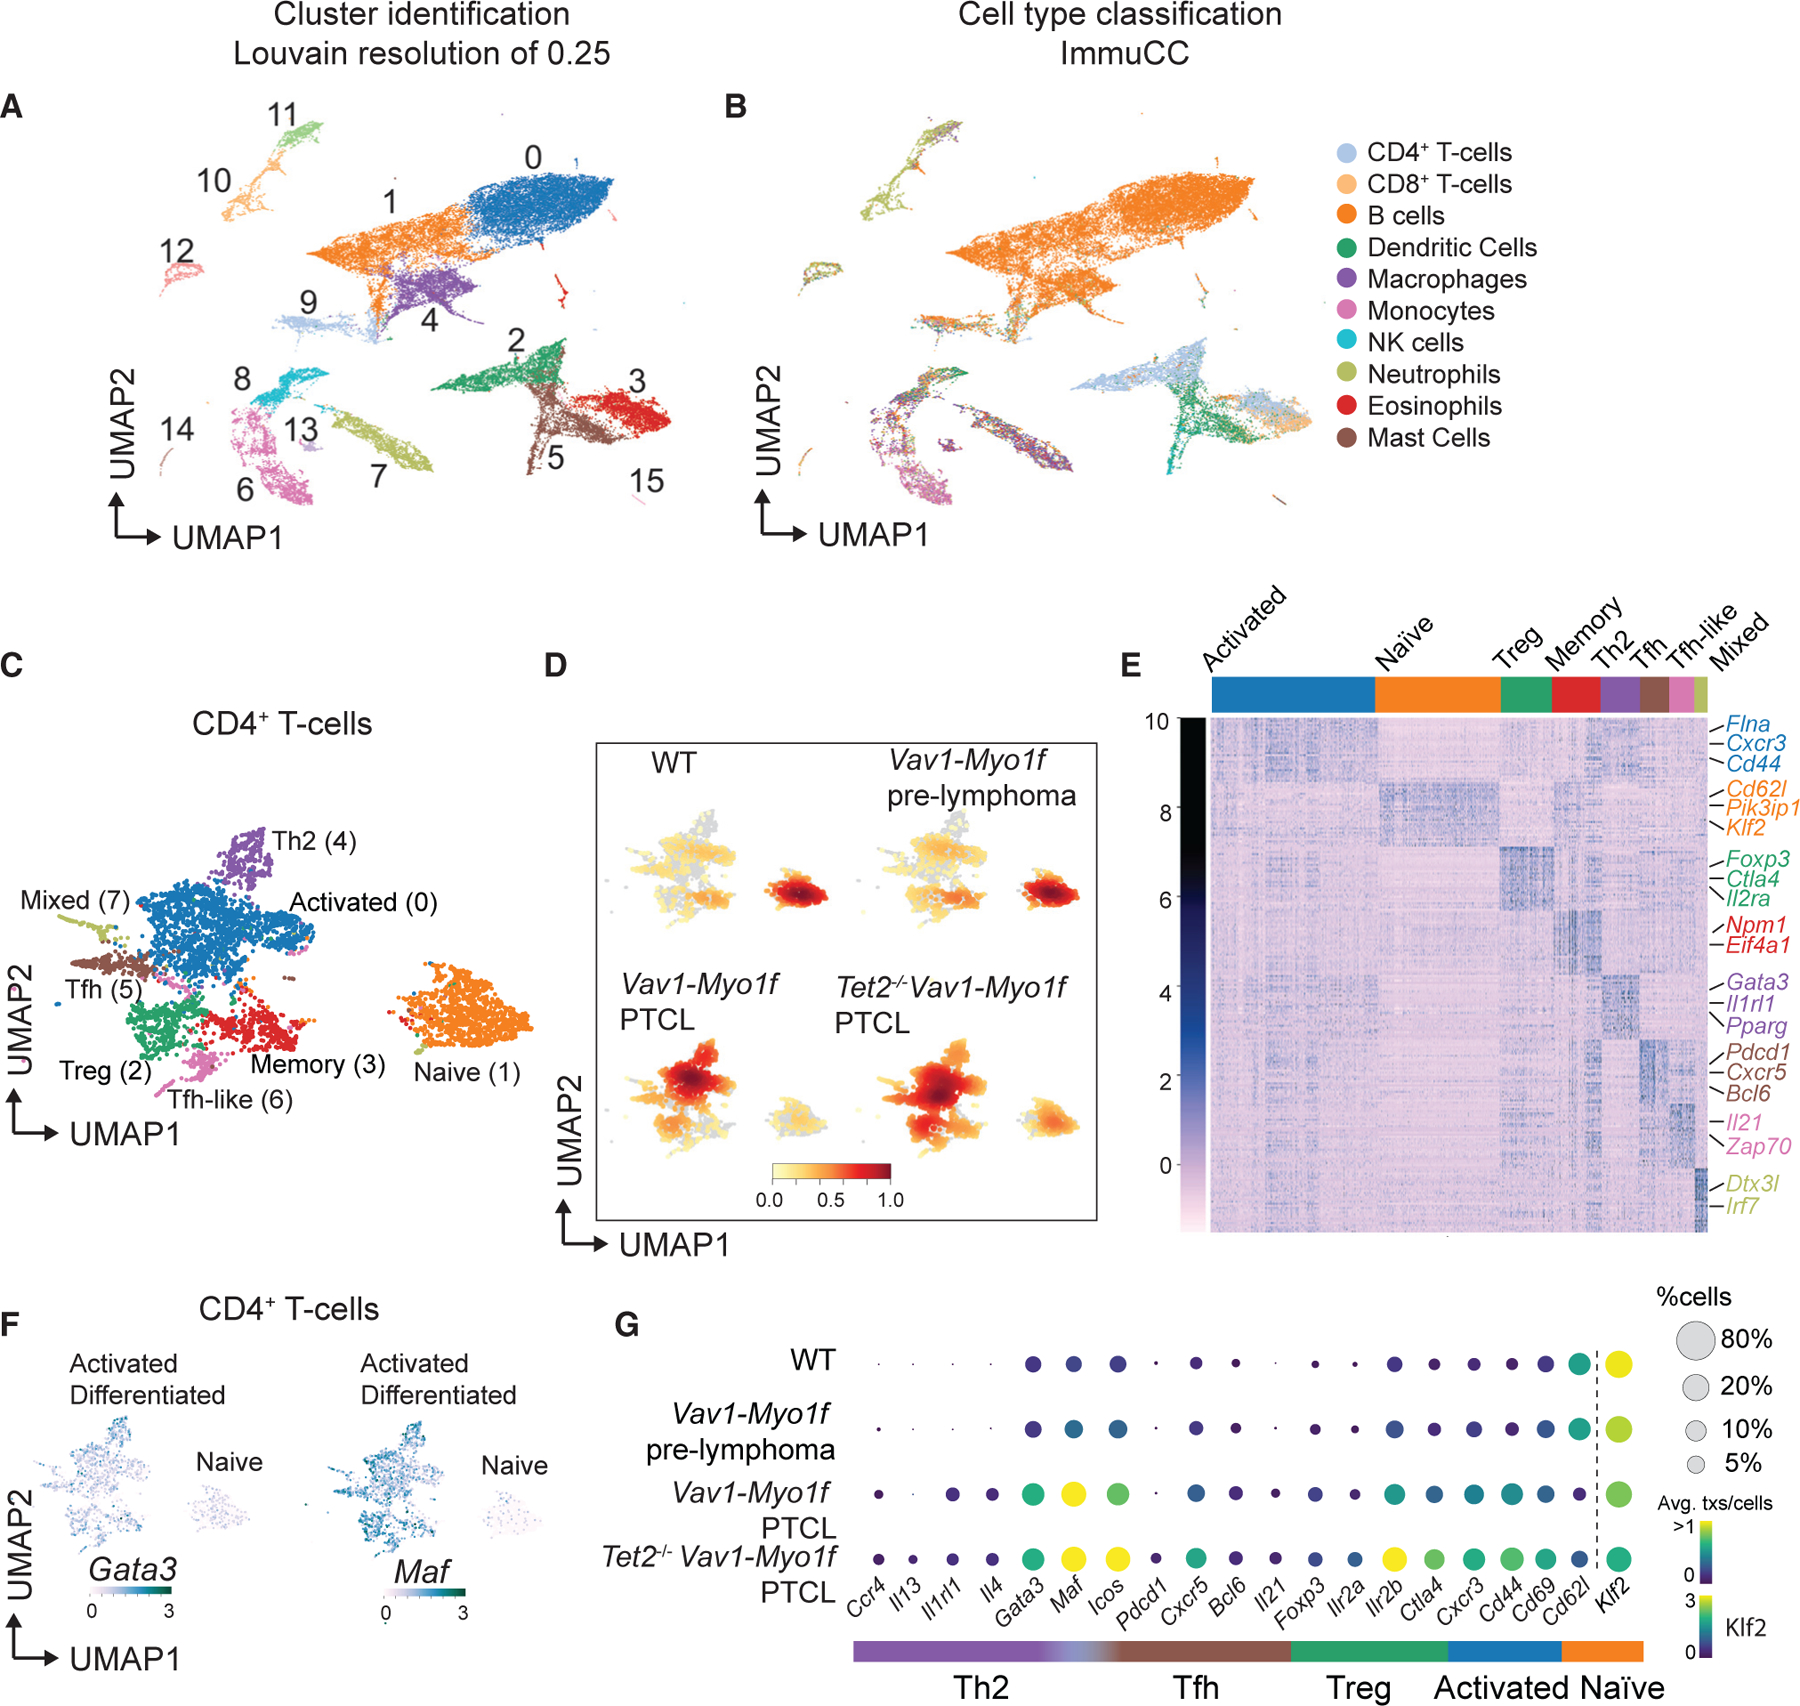
(A) Uniform manifold approximation and projection (UMAP) representation of 44,262 single-cell transcriptional profiles corresponding to 12 whole-spleen samples. Cluster identification was performed using an optimal Louvain resolution of 0.25.
(B) Cell type classification using the ImmuCC algorithm.
(C) UMAP representation of the 4,808 cells classified as CD4+ T cells and belonging to clusters 2 and 3 from (A). T cell lineages are indicated.
(D) Density plots of CD4+ T cell clusters across the different experimental conditions: WT, Vav1-Myo1f pre-lymphoma, Vav1-Myo1f lymphoma, and Tet2−/−Vav1-Myo1f lymphoma. Color intensity is augmented with increasing cell number.
(E) Heatmap (Z scores) of top 30 differentially expressed genes in each cluster obtained in (C).
(F) UMAP feature plots, indicating expression (log scale) of the Th2-associated transcription factors Gata3 and Maf. Color intensity is augmented with increasing expression.
(G) Bubble plot representation of the expression of selected CD4+ T cell lineage marker genes in WT, Vav1-Myo1f pre-lymphoma, Vav1-Myo1f lymphoma, and Tet2−/−Vav1-Myo1f lymphoma samples. Bubble radius shows the percentage of cells within each condition, and color scale represents mean expression. Expression of Klf2 uses a different color legend for visualization purposes.
Consistently, analysis of lineage marker genes demonstrated predominance of naive CD4+ T cells in control and Vav1-Myo1f pre-malignant samples and upregulation of markers corresponding to activated T cell (Cd44 and Cd69) and Th2 helper (Cxcr4, Il4, Gata3, and Maf) subsets during lymphomagenesis (Figure 4G).
Single-cell RNA-seq defines a tumor-associated macrophage population in the microenvironment of Vav1-Myo1f-induced lymphomas
RNA-seq analysis of spleens from Vav1-Myo1f-lymphoma diseased mice identified a significant enrichment in genes associated with macrophages (Figures S7A–S7C). Interestingly, Vav1-Myo1f-expressing CD4+ T cells also promoted increased macrophage activation in vitro compared with wild-type CD4+ T cells (Figures S7D and S7E). To explore the potential role of macrophages in mouse Vav1-Myo1f-induced lymphomas, we analyzed the integrated monocyte/macrophage population identified in our single-cell RNA-seq cohort (Figures 5A and S6A). This analysis revealed the presence of two macrophage clusters (1 and 5) strongly associated with lymphoma development (Figure 5B and Table S7). Lineage and functional annotation of macrophage populations based on the expression of selective marker genes and signatures (Figure 5C and Table S8) defined clusters corresponding to Ly6C+ monocytes, predominantly found in non-diseased mice (cluster 0, expressing Ly6c, Ccr2, and Irf5), tumor-associated macrophages (TAMs) (cluster 1, expressing Vcam1, Hmox1, Axl, Cd163, and Mrc1 and Klf2), monocyte-macrophage dendritic cell progenitors (MDP) (clusters 2 and 3, expressing Bcl2, Flt3, Bcl11a, Runx3, and Bmyc), and Ly6C− monocytes (cluster 4, expressing Itgax and Pprag). In these analyses, cluster 5, expressing Maf and Ccr3, shares many expressed genes with cluster 1 and potentially represents a transitional state, while clusters 6 and 7 express genes related to common monocyte progenitors (cMoP), including S100a9 and Mif (Mildner et al., 2017).
Figure 5. Immune cell analysis of Vav1-Myo1f-driven lymphomas at single-cell resolution reveals involvement of TAMs during lymphomagenesis.
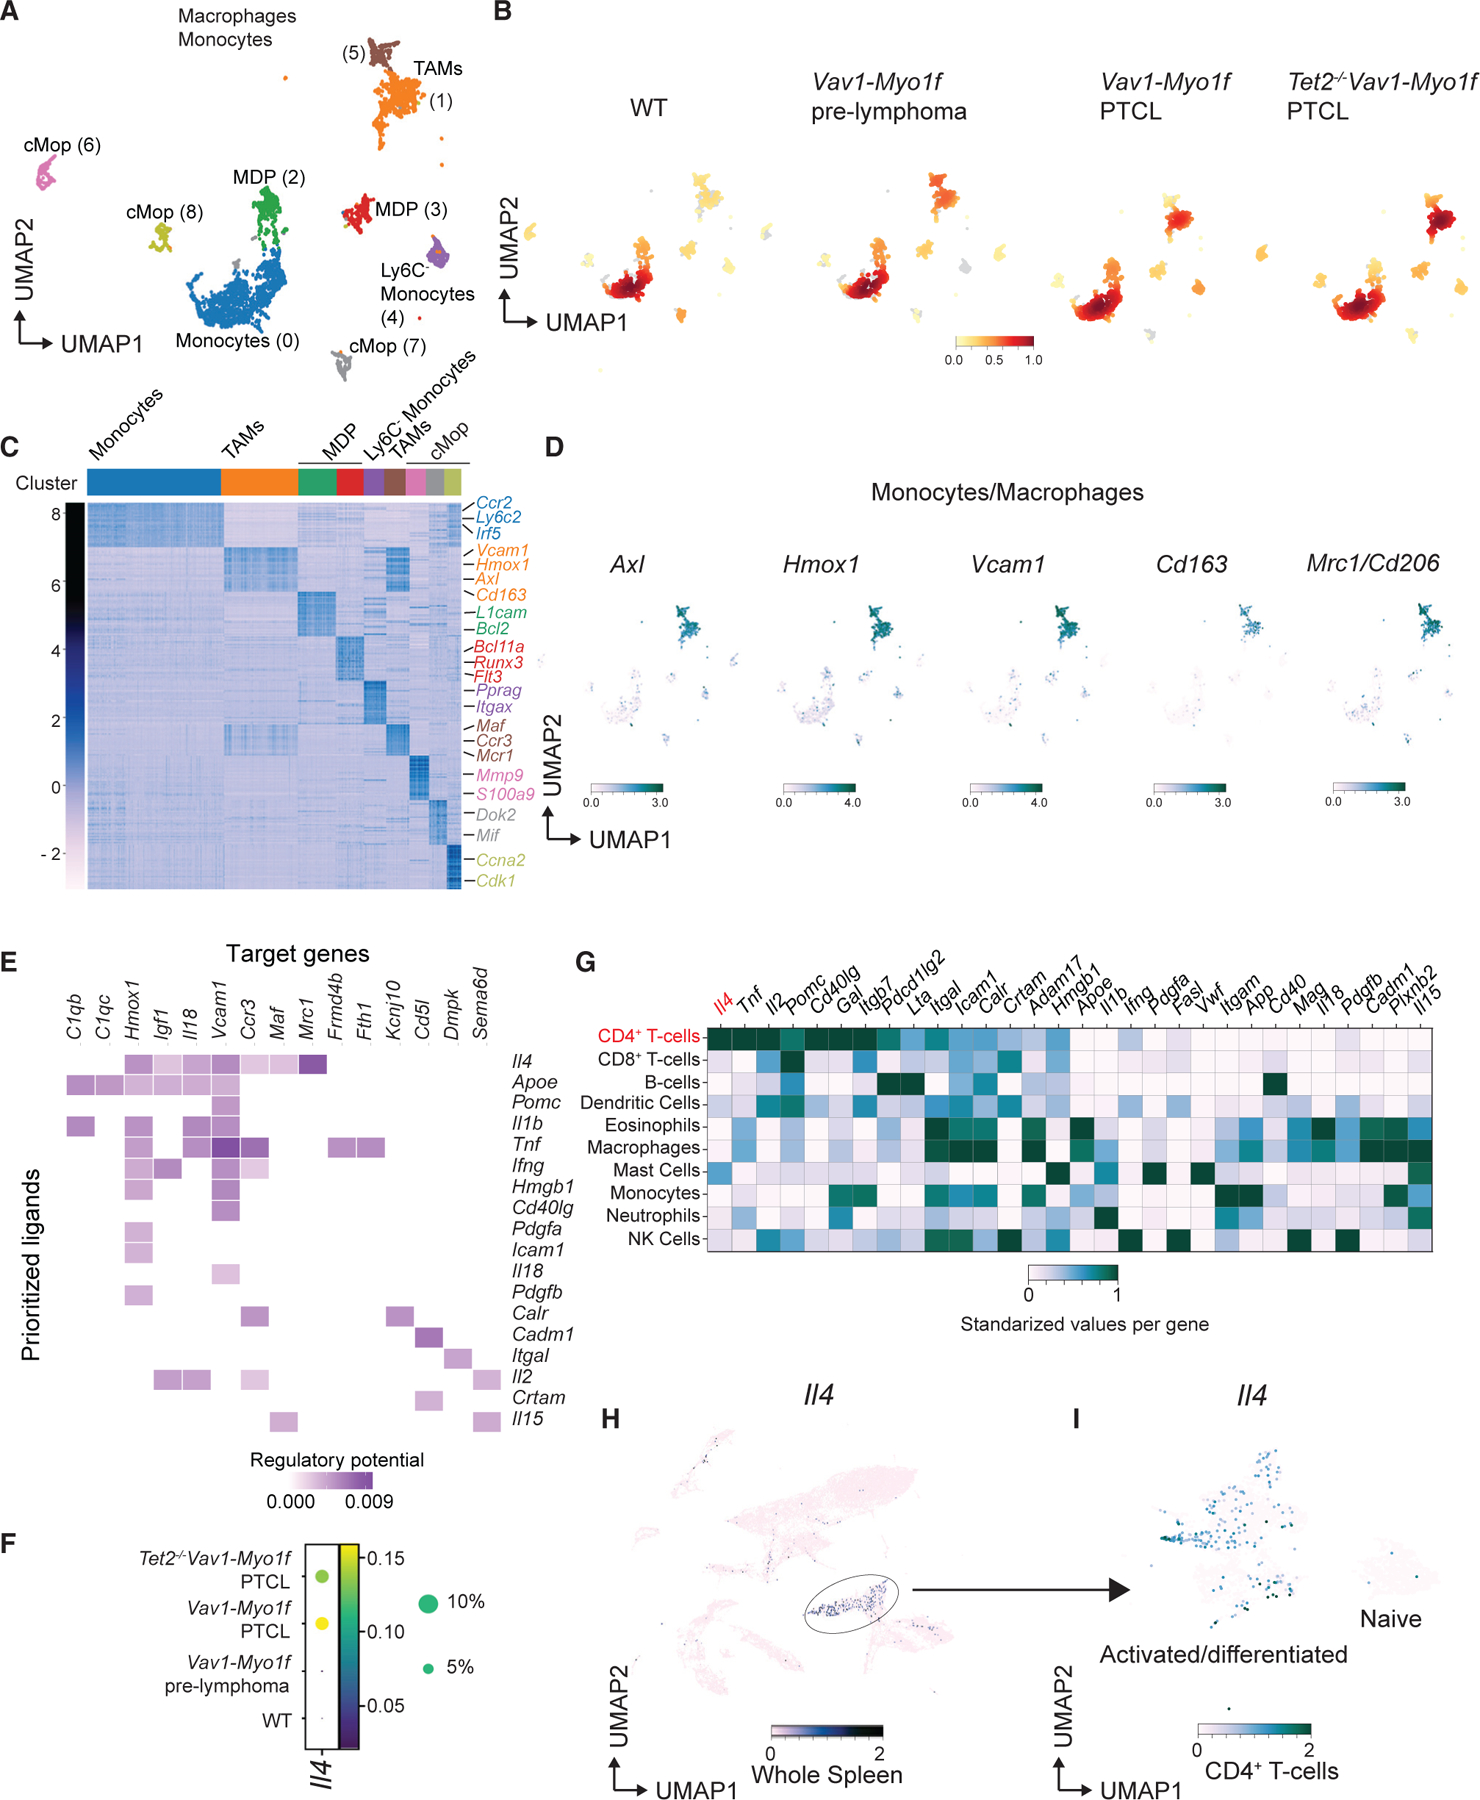
(A) UMAP representation of 4,417 cells classified as monocytes and macrophages included in clusters 6, 7, 8, 11, and 13 from Figure 4A. Macrophage/monocyte lineages are indicated.
(B) Density plots of monocyte/macrophage populations across the different experimental conditions: WT, Vav1-Myo1f pre-lymphoma, Vav1-Myo1f lymphoma, and Tet2−/−Vav1-Myo1f lymphoma. Color intensity is augmented with increasing cell number.
(C) Heatmap (Z scores) of top 30 differentially expressed genes in each cluster obtained in (A).
(D) UMAP feature plots, indicating expression (log scale) of representative TAM genes.
(E) Receptors of prioritized ligands expressed by TAMs. Color intensity is augmented with increasing regulatory potential.
(F) Bubble plot representation of the expression of Il4 in WT, Vav1-Myo1f pre-lymphoma, Vav1-Myo1f lymphoma, and Tet2−/−Vav1-Myo1f lymphoma samples. Bubble radius shows the percentage of cells within each condition, and color scale represents mean expression.
(G) Standardized gene expression of the prioritized ligands by the different immune cell types present in lymphoma samples.
(H and I) UMAP feature plots, indicating expression (log scale) of Il4 in the whole spleen (H) or restricted to CD4+ T cells (I).
Color intensity in (D), (H), and (I) is augmented with increasing expression. See also Figures S7 and S8; Tables S4, S5, and S6.
These analyses demonstrated an enrichment in TAMs in Vav1-Myo1f pre-malignant samples, which was further increased in Vav1-Myo1f-induced lymphomas (Figure 5B and Table S5). This supports an early role for Vav1-Myo1f-expressing CD4+ T cells in the remodeling of the splenic microenvironment. In agreement, immunohistochemical analysis with the pan-macrophage marker F4/80 and M2 macrophage-specific markers CD163 and MRC1/CD206 confirmed enrichment in M2 macrophages in Vav1-Myo1f-induced lymphomas (Figure S7F). Moreover, analysis of lineage marker genes demonstrated a predominance of monocytes in control and Vav1-Myo1f pre-malignant samples and upregulation of markers corresponding to activated TAMs during malignant transformation (Figures 5D and S8A). To further address whether TAM expansion is driven by lymphoma progression, we used NicheNet to predict ligand-to-target interactions (Browaeys et al., 2020). Ligand activity prediction identified the proteins most likely to explain the TAM transcriptomic profile observed in Vav1-Myo1f lymphomas (Figure S8B). Interestingly, IL-4, a cytokine secreted by Th2 and Tfh cells that drives M2-macrophage polarization (Shapouri-Moghaddam et al., 2018), was identified as one of the top-ranked ligands involved in the regulation of the TAM transcriptional program in these analyses (Figure S8B). We then inferred specific regulatory interactions between the lymphoma-derived ligands (‘‘prioritized ligands’’) and the TAMs’ most differentially expressed genes (‘‘target genes’’) in our Vav1-Myof lymphoma model (Figure 5E). This analysis also identified IL-4 as the ligand with the strongest impact on the transcriptional program associated with TAMs. Consistently, IL-4 is enriched in Vav1-Myo1f lymphoma samples (Figure 5F) and, more importantly, among prioritized ligands IL-4 is the only one whose expression is mostly restricted to activated CD4+ lymphoma cells (Figures 5G–5I and S8C). To explore the potential driver role of Vav1-Myo1f-induced IL-4 expression in macrophage differentiation in our lymphoma models, we neutralized IL-4 in vivo in Vav1-Myo1f-expressing mice and analyzed its effect on M2 macrophage populations. In these experiments, we treated CD4CreERT2 Vav1co-Vav1-Myo1f/wt mice with vehicle (control) or TMX to induce expression of Vav1-Myo1f and then injected them with an anti-IL-4 antibody or immunoglobulin G isotype control (n = 5 mice/group), and macrophages were analyzed by flow cytometry. These analyses revealed an increase in the CD206+CD163+ cell population in response to expression of Vav1-Myo1f, which is abolished by treatment with anti-IL-4 (Figures S8D–S8F).
In all, these analyses demonstrate profound and early effects of Vav1-Myo1f in the differentiation and activation of CD4+ T cells, in line with increased activation and Th2 polarization, and secretion of IL-4 by activated malignant CD4+ T cells, which results in a marked increase in TAMs in the lymphoma microenvironment.
Vav1-Myo1f-induced PTCL tumors are related to human macrophage-rich high-risk PTCL-NOS
The identification of a Th2 signature and a macrophage-rich tumor microenvironment in mouse lymphomas induced by Vav1-Myo1f suggests that these lymphomas could be phenotypically and mechanistically related to high-risk GATA3+ macrophage-rich PTCL tumors in humans. To explore this hypothesis, we performed RNA-seq profiling in cohort of 42 human PTCL-NOS cases including an index sample harboring the VAV1-MYO1F oncogenic fusion (Abate et al., 2017). Unsupervised consensus clustering analysis of this series revealed the presence of six stable gene expression groups (Figure 6A). Among these, GSEA revealed significant enrichment of upregulated genes associated with Tet2−/−Vav1-Myo1f mouse tumors in cluster 1, which accounts for 14% (6/42) of the samples analyzed, including the VAV1-MYO1F positive index case (Figure 6B). Reciprocally, genes associated with human PTCL-NOS samples in cluster 1 showed significant enrichment in Tet2−/−Vav1-Myo1f mouse lymphomas (Figure 6C). Given the prominent reactive tumor infiltrate found in most PTCL-NOS samples and the association of immune cell microenvironment composition signatures with prognosis (Sugio et al., 2018), we evaluated the relationship of the Vav1-Myo1f-like cluster 1 gene expression signature with that of B cells, dendritic cells, and macrophages. In these analyses, GSEA demonstrated a significant positive enrichment in macrophage-associated genes and negative enrichment of B cell and dendritic cell signatures in cluster 1 human PTCL-NOS cases, including the index VAV1-MYO1F sample (Figure 6D). Moreover, the mouse Vav1-Myo1f lymphoma-associated macrophage gene set was significantly enriched in cluster 1 human PTCL-NOS cases (Figures 6E and 6F). We also observed increased expression of the TAM markers AXL, HMOX1, and VCAM1 (Figure 6G) associated with our mouse lymphomas (Figure 5D) in cluster 1 PTCL-NOS cases. Consistent with transcriptomic changes, immunohistochemistry analysis in representative cases for clusters 1 and 2–6, including the index case carrying the VAV1-MYO1F fusion, showed marked enrichment in CD163+ macrophage populations in samples from cluster 1, whereas samples from clusters 2–6 were characterized by prevalence of B cells, as determined by positivity for the CD20 B cell marker (Figure 6H). This result validates our transcriptional classification of human PTCL cases and further supports the similarity in the macrophage-rich microenvironment between mice and human lymphoma.
Figure 6. Vav1-Myo1f mouse lymphomas resemble a human PTCL-NOS subgroup characterized by a macrophage signature.
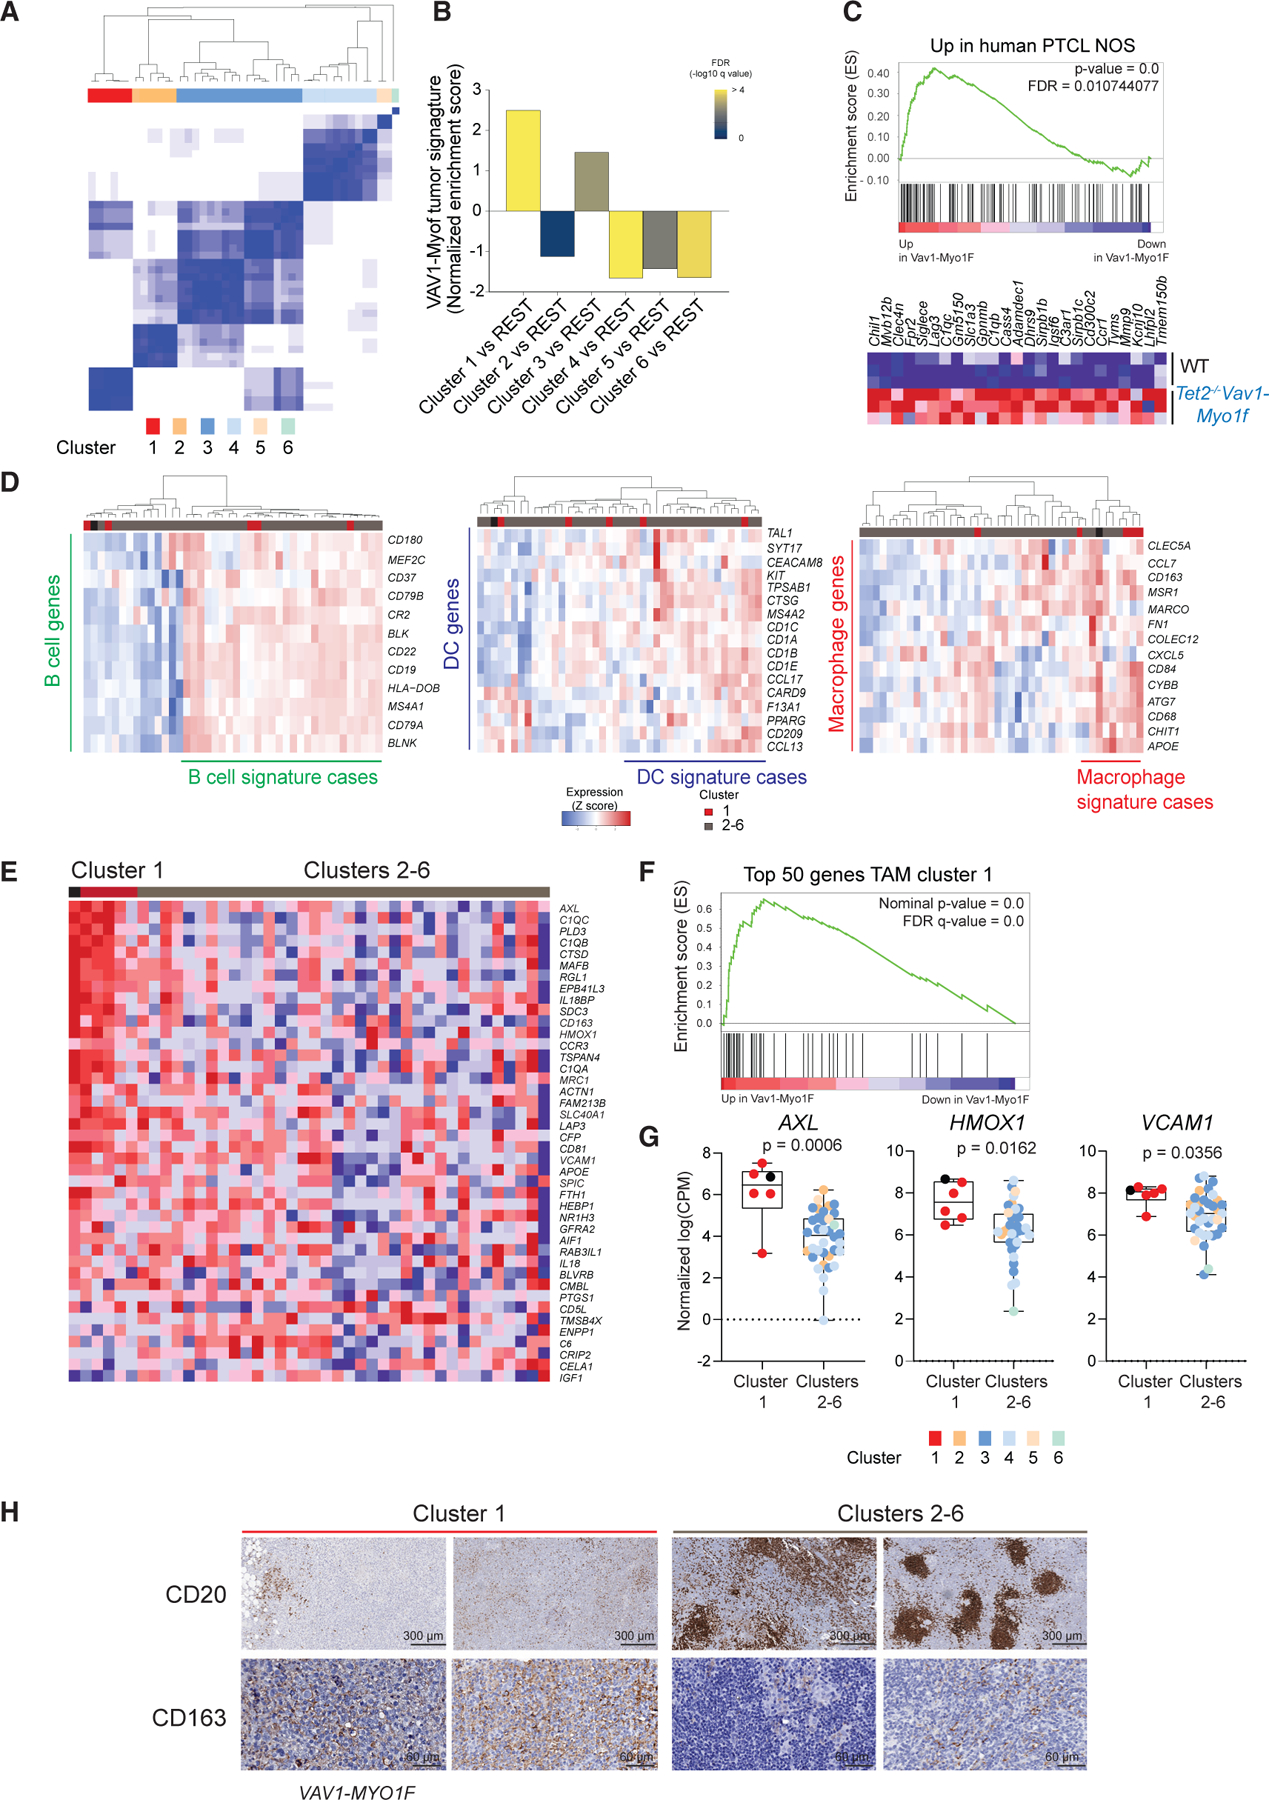
(A) Unsupervised consensus clustering of 42 cases of PTCL-NOS (K = 6).
(B) Normalized enrichment scores by GSEA of murine Tet2−/−Vav1-Myo1f signature comparing the different clusters of human PTCL-NOS in (A).
(C) GSEA analysis revealed an enrichment of the PTCL-NOS cluster 1 upregulated genes in Tet2−/−Vav1-Myo1f mouse tumors versus normal spleen samples (NES = 1.81, FDR = 0.01). The heatmap represents the top-ranking genes in the leading edge.
(D) Hierarchical clustering of 42 PTCL-NOS according to specific microenvironment signatures (from left to right: B cell, dendritic cell [DC], and macrophage signatures).
(E) Hierarchical clustering of PTCL-NOS samples according to TAM signature containing the top 50 upregulated genes identified by single-cell analysis as mouse TAMs enriched in Vav1-Myo1f-induced lymphomas. Cluster 1 samples shown in red; clusters 2–6 samples shown in gray. The sample with the VAV1-MYO1F fusion is represented by a black square.
(F) GSEA analysis of top 50 upregulated genes in TAMs in human PTCL-NOS cluster 1.
(G) Comparison of gene expression levels (normalized log(CPM)) of characteristic TAM markers in human PTCL-NOS unsupervised clusters from (A). Cluster 1 samples are shown by red circles. The human index case containing the VAV1-MYO1F gene fusion is indicated by a black circle. Clusters 2–6 are color coded as indicated.
(H) Representative immunohistochemical micrographs of formalin-fixed sections from human PTCL-NOS biopsies stained with the B cell marker CD20 and CD163 M2 macrophage marker. Cluster 1 samples are shown in red; clusters 2–6 samples in gray. The index sample harboring the VAV1-MYO1F oncogenic fusion is labeled as VAV1-MYO1F. Scale bar values are indicated.
p values were calculated using a two-tailed Student’s t test. Error bars denote mean ± SD.
Targeting the tumor microenvironment has anti-lymphoma effects in a Vav1-Myo1f-induced lymphoma model
Tumor-driving microenvironment mechanisms result from complex interplay between different cellular populations that are relevant in promoting tumor growth, local invasion, metastasis, and resistance to therapy (Li and Dalton, 2006). The association of a macrophage-rich tumor microenvironment with Vav1-Myo1f-induced mouse lymphomas and the prominent macrophage-associated signature of VAV1-MYO1F-like cluster 1 human PTCL-NOS cases supports a pathogenic role for VAV1-driven mechanisms in promoting macrophage infiltration. However, the significance of this finding, beyond the association of a macrophage-rich histology with poor prognosis, remains to be elucidated. To test the potential pathogenic role of TAMs in Vav1-Myo1f lymphomas, we evaluated the effect of ablating macrophages using liposome-encapsulated clodronate, which induces apoptosis in macrophages following endocytosis (van Rooijen et al., 1996). In vitro, M2 macrophages exhibited up to an 80% decrease in viability when cultured with clodronate-containing liposomes (Figure S9A). Meanwhile, survival of Vav1-Myo1f CD4+ tumor cells was unaffected (Figure S9B), demonstrating that encapsulated clodronate has no activity against tumor T cells. To test the therapeutic effect of macrophage ablation in lymphoma progression, we transplanted Vav1-Myo1f lymphoma cells into recipient mice and allowed the tumor to engraft (Figure S9C). We then treated lymphoma-bearing mice with clodronate- or PBS-loaded liposomes every 3 days for 3 weeks. Endpoint flow-cytometry analysis of spleen cell suspensions from mice allografted with Vav1-Myo1f-induced lymphomas demonstrated effective depletion of macrophage populations following liposome-clodronate treatment (Figure S9D). Most notably, macrophage depletion in this model resulted in a marked anti-tumor effect as shown by reduced spleen size and weight (Figures 7A and 7B), and decreased lymphoma burden, measured by the number of CD4+ lymphoma cells (Figure 7C). Immunohistochemical analysis of tumor cell proliferation and content in spleen sections from clodronate- and vehicle-treated mice verified these results, showing marked reduction in CD4+ lymphoma cells and decreased proliferation as determined by Ki67 staining (Figure 7D). Interestingly, phenotypic analysis of residual tumor cell populations in clodronate-treated animals revealed decreased Vav1-Myo1f CD4+ lymphoma cell activation, as documented by downregulation of the CD69 marker (Figure 7E), with the remaining cells corresponding to the normal CD4+CD69−GATA3low lymphocytes. Moreover, clodronate liposome-induced depletion of macrophages in recipient mice prior to lymphoma transplant (Figure S9E) also resulted in profoundly impaired tumor progression when compared with PBS-treated mice (Figures S9F and S9G). Together, these results demonstrate a critical role for TAMs in supporting activation, proliferation, and survival of Vav1-Myo1f-expressing PTCL-NOS tumor cells at every stage in tumor development.
Figure 7. Effect of macrophage depletion on Vav1-Myof-induced lymphoma cell proliferation.
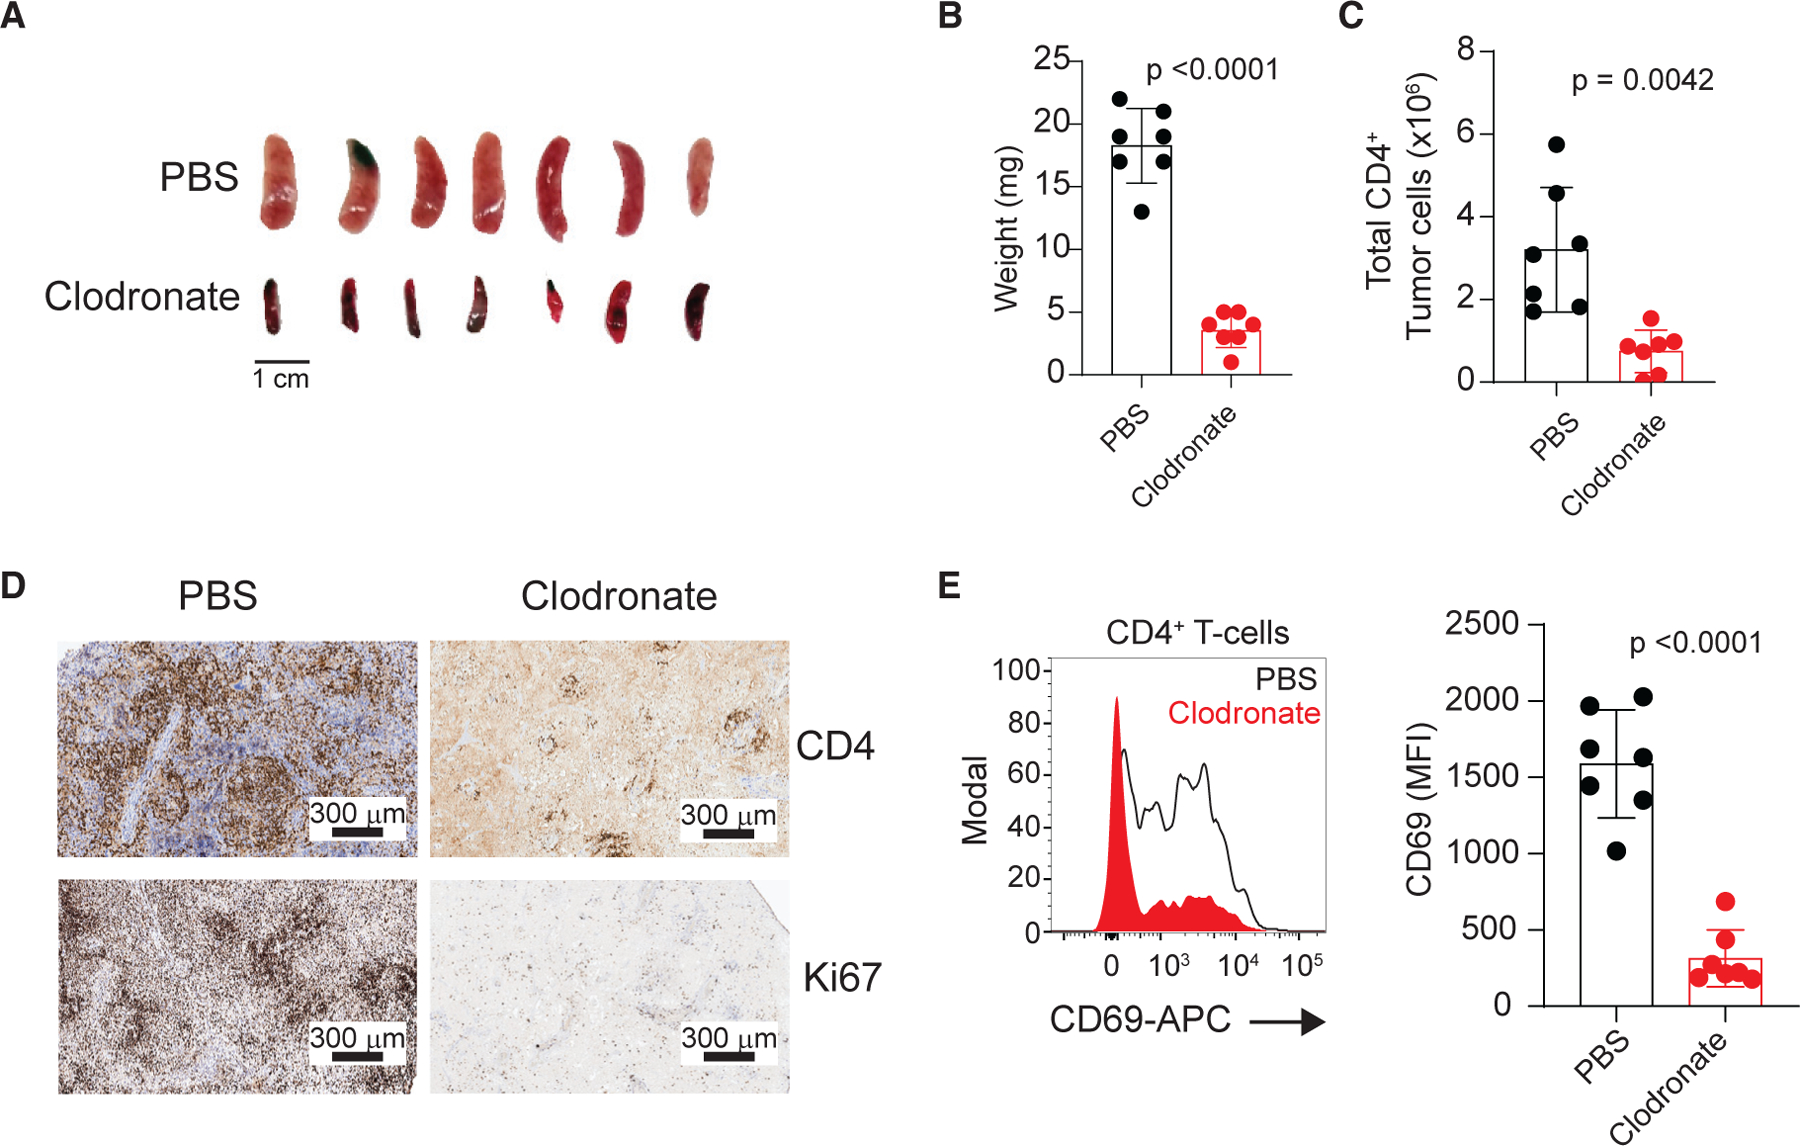
(A) Spleens from mice bearing Tet2−/−Vav1-Myo1f-induced lymphoma treated with control PBS- or clodronate-containing liposomes. Scale bar values are indicated.
(B and C) Quantification of spleen weight (B) and CD4+ tumor load (C) at endpoint in a cohort of mice transplanted with Tet2−/−Vav1-Myo1f-expressing tumors and treated with control PBS or clodronate-containing liposomes (n = 7).
(D) Representative micrographs showing expression of CD4 and Ki67 markers by immunohistochemistry staining of spleen sections from Tet2−/−Vav1-Myo1f-expressing tumor-bearing mice treated with PBS- or clodronate-containing liposomes. Scale bar values are indicated.
(E) Representative histogram and associated quantification of CD69 expression in Tet2−/−Vav1-Myo1f lymphoma cells isolated from lymphoma-bearing mice treated with clodronate (red) or control (black line) liposomes.
In (B), (C), and (E), circles represent individual mice and bar height indicates mean values. p values were calculated using a two-tailed Student’s t test. Error bars denote mean ± SD. See also Figure S9.
DISCUSSION
PTCL comprises a highly diverse group of hematologic malignancies (Swerdlow et al., 2016). Among these, AITL and PTCL-NOS are the most common subtypes of PTCLs in Europe and North America (Vose et al., 2008). Much of the histopathological heterogeneity of PTCLs is related to their correspondence to different functionally specialized mature lymphoid populations, which are considered the probable cell of origin of these tumors. In this context, AITL tumor cells are related to CD4+ Tfh lymphocytes (Cortes and Palomero, 2016; de Leval et al., 2007; Lunning and Vose, 2017), while different PTCL-NOS subsets may arise from Th1 or Th2 cells (Iqbal et al., 2014; Wang et al., 2014). This observation suggests that the transcriptional, signaling circuitries responsible for CD4+ T helper differentiation and plasticity could be of particular relevance in the pathogenesis of these diseases (Timmins et al., 2020). Moreover, functional characterization of recurrent genomic alterations in PTCL has also demonstrated a driver role for PTCL-associated mutations in controlling T cell differentiation (Cortes and Palomero, 2020).
Here, we demonstrate that expression in CD4+ T cells of Vav1-Myo1f, a recurrent gene fusion in PTCL-NOS, alters TCR-activation-induced transcriptional programs, resulting in simultaneous expression of generally mutually exclusive master regulators of CD4+ T cell differentiation, including Tfh (Bcl6), Th1 (Tbx21), Th2 (Gata3, Maf), Treg (Foxp3), and Th17 (Rorc) cells. Despite this ambiguity, expression of Vav1-Myo1f drives specific differentiation of CD4+ T cells toward a Th2 cell fate, likely as a result of Vav1-induced Maf expression (Capitani et al., 2010; Tanaka et al., 2005). Consistently, expression of Vav1-Myo1f specifically results in the development of CD4+ T cell lymphomas that closely resemble human PTCL-NOS with Th2 features. The spontaneous development of PTCL-NOS in Vav1-Myo1f knockin mice strongly supports a driving oncogenic role for this oncogene fusion, which is further supported by Vav1-Myo1f-induced CD4+ T cell survival following cytokine withdrawal in vitro and increased proliferation following TCR activation in vivo. This is in contrast with the reported failure of Vav1-Stap2 and Vav1 p.165–174del transgenic mice to develop lymphomas without concomitant loss of Tp53 (Fukumoto et al., 2020), suggesting differences in the temporal control and oncogene expression levels between the different models or a specific oncogenic potential of VAV1-MYO1F. A specific finding of the model presented here is the characterization of pre-lymphoma (early induction) phenotypes, which points to a direct driver role of deregulated Vav1 signaling in increasing TCR-signaling-induced proliferation, T cell activation, and Th2 specification. Interestingly, pre-lymphoma samples of Vav1-Myo1f knockin mice reveal an early expansion of Th2, Tfh, and Treg populations, which are predominantly replaced by CD4+ Th2-like cells as lymphomas develop. These results could be related to our observation of upregulated expression of multiple transcription factors implicated in T cell lineage fate specification and speak of a dynamic interplay between TCR stimulation and Vav1-Myo1f expression in favoring Th2 T cell polarization and transformation.
An important finding from the characterization of our Vav1-Myo1f-induced lymphoma model is the identification of profound and specific changes in the composition of the tumor microenvironment associated with T cell transformation. Tumor initiation and, most prominently, disease progression, dissemination, escape from immunosurveillance, and resistance to therapy in human cancers have been shown to be largely dependent on the tumor microenvironment (Pizzi et al., 2018). In-depth single-cell RNA-seq characterization of Vav1-Myof-driven mouse pre-lymphoma and lymphoma spleen samples identified a distinctive macrophage population with expression of M2 macrophage and TAM markers, an important finding when considering the association of human PTCL-NOS Th2-GATA3 lymphomas with poor outcomes (Ham et al., 2017; Wang et al., 2014; Zhang et al., 2016). The identification of macrophage expansions at the earliest stages of disease development following induction of Vav1-Myo1f expression in CD4+ T cells supports an instructive role of pre-lymphoma and lymphoma T cell populations in reshaping the structure and composition of the splenic microenvironment. Of note, convergent gene expression signatures, including the presence of a macrophage-rich gene expression program, between Vav1-Myo1f mouse lymphomas and a subset of human PTCL-NOS cases supports the relevance of these mechanisms in the pathogenesis of human disease.
In this context, it did not escape our attention that mouse Vav1-Myo1f pre-lymphoma samples were specifically enriched in a TAM-associated signature, supporting an early crosstalk between Vav1-Myo1f-expressing CD4+ T cells and the tumor microenvironment implicated in tumor initiation. In human PTCL, the presence of tumor-infiltrating myeloid cells, including TAMs, has been associated with poor prognosis, suppression of anti-tumor responses, and limited response to initial therapy (Allavena et al., 2021; Skytthe et al., 2020; Wang et al., 2021). Here we show that in vivo depletion of macrophages inhibits Vav1-Myo1f CD4+ lymphoma cell proliferation and survival, demonstrating a close interdependency between lymphoma cells and TAM and supporting a role for TAM-directed targeted therapies for the treatment of this disease.
Limitations of the study
In this study we demonstrate that the Vav1-Myo1f oncogenic fusion protein induces oncogenic transformation in T cells, leading to the development of aggressive T cell lymphomas with Th2 features, a phenotype driven by constitutively active VAV1 signaling. However, it also is possible that the MYO1F moiety in the VAV1-MYO1F fusion oncoprotein results in specific neomorphic functions not shared with other oncogenic forms of VAV1, or that weaker levels of VAV1 activation such as those observed in the case of VAV1 mutations may favor a different phenotype. Conversely, while the Vav1-Myo1f model most closely recapitulates high-risk GATA3+ human PTCL, VAV1 genetic alterations are present only in a fraction of tumors with these characteristics. Thus, yet to be identified, convergent mechanisms of PTCL transformation may be at play in GATA3+ VAV1 wild-type PTCL cases. Finally, although in vitro studies do not show any cytotoxic effect of clodronate against malignant T cells, supporting that the therapeutic activity of this agent in vivo is mediated primarily by macrophage depletion, a direct anti-tumor effect of clodronate against the malignant clone in vivo cannot be completely ruled out.
STAR★METHODS
RESOURCE AVAILABILITY
Lead contact
Further information and requests for resources and reagents should be directed to and will be fulfilled by the lead contact, Teresa Palomero (tp2151@columbia.edu).
Materials availability
The isogenic Vav1-myo1f models generated in this study are available from the lead contact with a completed Material Transfer Agreement.
Data and code availability
Mouse RNAseq and single cell RNAseq data have been deposited at Gene Expression Omnibus (GEO) and are publicly available as of the date of publication. Accession number is listed in the Key resources table.
Mouse whole exome sequencing data have been deposited at the Sequence Read Archive (SRA) repository and are publicly available as of the date of publication. Accession number is listed in the Key resources table.
This paper analyzes existing, publicly available data. The accession numbers and links for the datasets used are listed in the Key resources table.
This paper does not report original code.
Any additional information required to reanalyze the data reported in this paper is available from the lead contact upon request
KEY RESOURCES TABLE
| REAGENT or RESOURCE | SOURCE | IDENTIFIER |
|---|---|---|
| Antibodies | ||
| Hamster anti-Mouse CD3e (145–2C11) | BD Biosciences | Cat#550275; RRID: AB_393572 |
| Hamster anti-Mouse CD28 (37.51) | BD Biosciences | Cat#557393; RRID: AB_396676 |
| Goat anti–Armenian Hamster IgG F(ab’)2 | Jackson ImmunoResearch | Cat#127–005-099; RRID: AB_2338971 |
| anti-CD4 - PerCP-Cyanine5.5 (RM4–5) | eBioscience | Cat#45–0042; RRID: AB_1107001 |
| anti-CD8a - PE-Cy7 (53–6.7) | eBioscience | Cat#25–0081; RRID: AB_469583 |
| anti-CD69 - APC (H1.2F3) | eBioscience | Cat#17–0691; RRID: AB_1210796 |
| Biotin anti-mouse ICOS (7E.17G9) | Biolegend | Cat#117403; RRID: AB_961239 |
| anti-PD1 – PE (J43) | eBioscience | Cat#12–9985; RRID: AB_466296 |
| anti-CXCR5 (2G8) | eBioscience | Cat#551961; RRID: AB_394302 |
| Biotin Goat Anti-Rat IgG | Jackson ImmunoResearch | Cat#112–065-062; RRID: AB_2338173 |
| APC Streptavidin | BD Biosciences | Cat#554067; RRID: AB_10050396 |
| PE Streptavidin | BD Biosciences | Cat#554061; RRID: AB_10053328 |
| anti-FOXP3 - PE (150D/E4) | eBioscience | Cat#1050043; RRID: AB_529581 |
| anti-CD25 - Alexa Fluor 488 (7D4) | eBioscience | Cat#53–0252; RRID: AB_763470 |
| anti-CD62L-APC (MEL-14) | BD Biosciences | Cat#553152; RRID: AB_398533 |
| anti-CD44 - PerCP-Cyanine5.5 (IM7) | eBioscience | Cat#45–0441-82; RRID: AB_925746 |
| anti-CD183 (CXCR3)-PE (CXCR3–173) | Biolegend | Cat#126505; RRID: AB_1027656 |
| anti-CD196 (CCR6) - PerCP-Cyanine5.5 (29–2L17) | Biolegend | Cat#129809; RRID: AB_2072797 |
| anti-IL4-PE (11B11) | eBioscience | Cat#12–7041-71; RRID: AB_466154 |
| anti-IL10-APC (JES5–16 × 103) | eBioscience | Cat#17–7101-81; RRID: AB_469501 |
| anti-IFNG- PerCP-Cyanine5.5 (XMG1.2) | BD Biosciences | Cat#560660; RRID: AB_1727533 |
| anti-cMAF - PE (sym0F1) | eBioscience | Cat#12–9855-42; RRID: AB_2572747 |
| Phospho-p44/42 MAPK (Erk1/2) (Thr202/Tyr204) Rabbit mAb (197G2) | Cell Signaling | Cat#4377; RRID: AB_331775 |
| Anti-rabbit IgG (H+L), F(ab’)2 Fragment (Alexa Fluor® 647 Conjugate) | Cell Signaling | Cat#4414; RRID: AB_10693544 |
| anti-VAV1 (phospho Y174) (EP510Y) | Abcam | Cat#ab76225; RRID: AB_1524546 |
| GATA-3 XP Rabbit mAb antibody (D13C9) | Cell Signaling | Cat#5852; RRID: AB_10835690 |
| anti-Phospho-Stat6 (Tyr641) Antibody | Cell Signaling | Cat#9361; RRID: AB_331595 |
| anti-CD163 (EPR19518) | Abcam | Cat#ab182422; RRID: AB_2753196 |
| anti-MMR/CD206 | R and D Systems | Cat#AF2535; RRID: AB_2063012 |
| Alexa Fluor® 647 Rat Anti-Mouse CD106 (MVCAM.A) | BD Biosciences | Cat#561612; RRID: AB_10896662 |
| anti-CD3 (SP7) | Abcam | Cat#ab16669; RRID: AB_443425 |
| anti-CD4 (EPR19514) | Abcam | Cat#ab183685; RRID: AB_2686917 |
| anti-F4/80 (BM8) | eBioscience | Cat#14–4801-82; RRID: AB_467558 |
| InVivoMAb anti-mouse IL-4 (11B11) | BioXCell | Cat#BE0045; RRID: AB_1107707 |
| InVivoMAb rat IgG1 isotype control, anti-HRP (HRPN) | BioXCell | Cat#BE0088; RRID: AB_1107775 |
|
Chemicals, peptides, and recombinant proteins | ||
| 4-Hydroxy-3-nitrophenylacetyl Ovalbumin | Biosearch Technologies | Cat#N-5051 |
| Imject™ Alum Adjuvant | Thermo Scientific | Cat#77161 |
| Tamoxifen | Sigma-Aldrich | Cat#T5648 |
| Corn oil | Sigma-Aldrich | Cat#C8267 |
| (Z)-4-OHT; 4-Monohydroxytamoxifen | Santa Cruz Biotechnology | Cat#sc-3542 |
| Guanidinium thiocyanatephenol-chloroform extraction (TRIzol®) | Thermo Scientific | Cat#15596018 |
| CellTrace™ Violet Cell Proliferation Kit | Thermo Scientific | Cat#C34557 |
| XenoLight D-Luciferin - K+ Salt Bioluminescent Substrate | PerkinElmer | Cat#122799 |
| Sheep red blood in Alsevers | Cocalico Biological | Cat#20–1334A |
| Clodronate liposomes and control liposomes (PBS) | LIPOSOMA research liposomes | Cat#CP-005–005 |
| Recombinant Human IL-2 | Peprotech | Cat#200–02 |
| Phorbol 12-myristate 13-acetate | Sigma-Aldrich | Cat#P1585 |
| Ionomycin | EMD Millipore | Cat#407952 |
| BD GolgiPlug™ Protein Transport Inhibitor (Containing Brefeldin A) | BD Biosciences | Cat#555029 |
| Histo-Clear II | National Diagnostics | Cat#HS-202 |
| Antigen Unmasking Solution, Citrate-Based | Vector Laboratories | Cat#H-3300 |
| Hydrogen peroxide solution 30% (w/w) in H2O, contains stabilizer | Sigma-Aldrich | Cat#H1009 |
| VECTASTAIN® Elite ABC-HRP Kit (Peroxidase, Universal) | Vector Laboratories | Cat#PK-6200 |
| DAB Substrate Kit, Peroxidase (HRP), with Nickel, (3,3′-diaminobenzidine) | Vector Laboratories | Cat#SK-4100 |
|
Critical commercial assays | ||
| Mouse naive CD4+ T cell Isolation Kit | Milteny | 130–104-453 |
| RNeasy mini kit | Qiagen | 74106 |
| RNase-Free DNase Set | Qiagen | 79254 |
| DNeasy Blood & Tissue Kit | Qiagen | 69506 |
| BD™ Cytometric Bead Array (CBA) Mouse Th1/Th2/Th17 Cytokine Kit | BD Biosciences | 560485 |
| Mouse V β TCR Screening Panel | BD Pharmigen | 557004 |
| Chromium Single Cell 3ʹ v2 Reagent Kit | 10x Genomics | CG00052 |
| Cell Titer-Glo® Luminescent Cell Viability Assay | Promega | G7571 |
| SuperScript™ IV Reverse Transcriptase | Thermofisher | 18090010 |
| Q5® High-Fidelity 2X Master Mix | NEB | M0492S |
|
Deposited data | ||
| RNA-Seq and Single Cell RNA-Seq sequencing data | This manuscript | GEO: GSE166673 |
| Human PTCL RNA-Seq sequencing data | Abate et al., 2017 and Moon et al., 2021 | dbGaP: phs001962.v1.p1 andphs000689.v1.p1s. |
| Whole Exome Sequencing data | This manuscript | SRA: PRJNA800774 |
| TH2_VS_NAIVE_CD4_TCELL_UP | Immunity. 2009 Jan 16; 30(1):155–67 | GEO: GSE14308 |
| TH1_VS_NAIVE_CD4_TCELL_UP | Immunity. 2009 Jan 16; 30(1):155–67 | GEO: GSE14308 |
| TREG_VS_TCONV_UP | Immunity. 2009 Jun 19; 30(6):899–911. | GEO: GSE15659 |
| TH17_VS_NAIVE_CD4_TCELL_UP | Immunity. 2009 Jan 16; 30(1):155–67 | GEO: GSE14308 |
| TFH_CHTANOVA | J Immunol. 2004; 173:68–78. | N/A |
| AITL_VS_PTCL_NOS | Blood. 2007; 109:4952–4963 | N/A |
| EPPERT_HSC_R | Nat Med. 2011, 17(9):1086–93. | N/A |
| EPPERT_CE_HSC_LSC | Nat Med. 2011, 17(9):1086–93. | N/A |
|
Experimental models: Organisms/strains | ||
| Mouse: Vav1WT/co–Vav1-myo1f | This manuscript | N/A |
| Mouse: Rhoaco–G17V/+ | Cancer Cell, 2018, 33(2):259–273.e7 | N/A |
| Mouse: Tg(Cd4-cre/ERT2)11Gnri | Jackson Labs | Stock No: 022,356 |
| Mouse: B6.Cg-Tg(Cd4-cre)1Cwi/BfluJ | Jackson Labs | Stock No: 017,336 |
| Mouse: B6.Cg-Tg(TcraTcrb)425Cbn/J | Jackson Labs | Stock No: 004,194 |
| Mouse: Ly5.1+ (CD45.1) C57BL/6 | Jackson Labs | Stock No: 002,014 |
| Mouse: Tet2fl/fl | Cancer Cell. 2011; 20:25–38 | N/A |
| Mouse: B6.Cg-Rag2tm1.1Cgn/J | Jackson Labs | Stock No: 008,449 |
| Mouse: Vav1WT/co–Vav1-myo1f | This manuscript | N/A |
|
Oligonucleotides | ||
| Vav1_Fw CCGGATCACAGAGAAGAAGG | This manuscript | N/A |
| Vav1_Rv ATGGCTCTCCTCTCAGGTTC | This manuscript | N/A |
| Vav1-Myo1F_Rv ATTCAAACCTCTGGGAGGCC | This manuscript | N/A |
|
Software and algorithms | ||
| FlowJo software | https://www.flowjo.com/solutions/flowjo | N/A |
| Cuffquant | http://cole-trapnell-lab.github.io/cufflinks/ | N/A |
| JavaGSEA | http://software.broadinstitute.org/gsea/index.jsp | N/A |
| R | https://www.r-project.org/ | N/A |
| Aperio ImageScope Software | Leica Biosystems | N/A |
| Prism software v6.0 | https://www.graphpad.com/scientific-software/prism/ | N/A |
EXPERIMENTAL MODELS
Mice
We maintained all mouse lines in specific pathogen-free facilities at the Irving Cancer Research Center (ICRC) at Columbia University Irving Medical Center (CUIMC) campus. All animal procedures were approved by the Institutional Animal Care and Use Committee (IACUC) at CUIMC. The Vav1WT/co–Vav1-myo1f conditional knock-in mouse line was generated at Cyagen Biosciences (Santa Clara, CA). In this model, we introduced a floxed Vav1 exon 25–27 minigene in intron 24 and replaced the downstream exons 25 and 26 with Vav1 exon 25 fused to the cDNA sequence corresponding to exons 25–28 of Myo1f (Figure S1A). In basal conditions, the exon 24 of Vav1 is spliced into the exon 25–27 minigene resulting in expression of a wild type Vav1 mRNA. Expression of Cre recombinase removes the floxed exon 25–27 minigene leading to exon 24 being spliced into the Vav1 exon25-Myo1f exons 25–28 minigene, resulting in the expression of the Vav1-Myo1f oncogenic fusion. The Tet2f/f mouse line was generously provided by Dr. Ross Levine at Memorial Sloan Kennedy Cancer Center (MSKCC) (New York, NY) (Moran-Crusio et al., 2011). The CD4Cre line (B6.Cg-Tg(Cd4-cre)1Cwi/BfluJ) used to specifically express Cre recombinase in CD4+ T-cells Lee (Lee et al., 2001); the CD4CreERT2 line (Tg(Cd4-cre/ERT2)11Gnri) mice, which expresses a tamoxifen-inducible form of the Cre recombinase under the control of the mouse Cd4 promoter (Aghajani et al., 2012); the Rag2 immunodeficient knockout mice (B6(Cg)-Rag2tm1.1Cgn/J) used as recipients for lymphoma transplants; OT-II (B6.Cg-Tg(TcraTcrb)425Cbn/J) and Ly5.1+ (CD45.1) C57BL/6 mice were all purchased from Jackson Laboratories (Bar Harbor, ME). We bred Vav1-Myo1ff/WT conditional knock-in mice with CD4Cre to generate Vav1-Myo1ff/WT; CD4Cre mice that constitutively expressed the Vav1-Myo1f fusion in CD4+ T-cells (Vav1-Myo1f WT/co-Vav1-myo1f;CD4Cre). We bred Vav1-Myo1ff/WT conditional knock-in mice with CD4CreERT2 line to generate conditional inducible CD4 specific Vav1-Myo1f mice (Vav1-Myo1fWT/co-Vav1-myo1f; CD4CreERT2) that express Vav1-Myo1f in CD4+ T-cells upon treatment with tamoxifen in vivo. Vav1-Myo1f WT/co-Vav1-myo1f;CD4CreERT2 mice were bred with OT-II mice to generate OT-II; Vav1-Myo1f WT/co-Vav1-myo1f;CD4CreERT2 or with Tet2fl/fl;CD4CreERT2 to generate Vav1-Myo1f WT/co-Vav1-myo1f;Tet2fl/fl;CD4CreERT2). 8–12 week old age- and sex-matched male and female mice of each genotype were used in experiments in which different genotypes were compared. For drug treatment and tumor transplant studies, 6–8 week old age-matched female mice were randomly assigned to different treatment groups.
METHOD DETAILS
Drugs
(Z)-4-hydroxytamoxifen (Santa Cruz Biotechnology, SC-3542) was dissolved in ethanol and added to the cell culture media at a final concentration of 1 μmol/L. Tamoxifen (Sigma T5648) was dissolved in corn oil to a final concentration of 30 g/mL. Phorbol 12-myristate 13-acetate (PMA) (P1585), ionomycin (I3909) and Brefeldin A (B7651) were purchased from Sigma.
CD4+ T cell isolation, primary culture, and activation
Single-cell suspensions were prepared from spleen and/or lymph nodes from male and female animals (6–8 weeks old) using standard procedures. CD4+ T-cells were harvested by negative selection using the mouse naive CD4+ T-cells Isolation Kit (Milteny, Cat. No. 130–104-453) according to the manufacturer’s protocol. Purified CD4+ T-cells were cultured in RPMI-1640 media containing 10% FBS, glutamine, 100 U ml−1 penicillin G, 100 μg ml−1 streptomycin, 100 μM 2-mercaptoethanol and 10 ng ml−1 IL2 (Peprotech, 200–02). We maintained all cell cultures at 37◦C in a humidified atmosphere under 5% CO2.
For isolation of CD4+CD69+ and CD4+CD69- lymphoma cell fractions, we first isolated an enriched CD4+ T cell population from the spleen of lymphoma diseased mice using negative selection as indicated above. The resulting population was stained with a fluorochrome-conjugated anti-CD69 antibody and CD69+ and CD69- fractions were selected using an SH800 cell sorter (SONY Biotechnologies).
To induce the expression of the Vav1-Myo1f mutant allele in CD4+ T-cells in vitro, naive CD4+ T-cells isolated from Vav1-Myo1f WT/co-Vav1-myo1f; CD4CreERT2 mice were treated with vehicle or 4-hydroxytamoxifen (Santa Cruz Biotechnology, sc-3542) for 48 h. To assess cell proliferation, vehicle and 4-hydroxytamoxifen treated cells were washed in PBS and activated on plates coated with anti-CD3 (clone 145–2C11, BD Biosciences) and media supplemented with soluble anti-CD28 (clone 37.5B, BD Biosciences) antibodies. T cell proliferation was measured by flow cytometry on cells stained with Cell Trace Violet (CTV) (Life Technologies, C34557) following standard procedures. For cell survival analysis, we cultured isolated CD4+ T-cells as indicated above in absence or presence of increasing concentration of IL2; viability was assessed with Cell Titer-Glo® Luminescent Cell Viability Assay (Promega) following manufacturer’s protocol.
To study the role of Vav1-Myo1f on TCR signaling, we stimulated vehicle- or 4-hydroxytamoxifen-treated naive CD4+ T-cells with soluble anti-CD3 (1 μg/mL) and anti-CD28 (1 μg/mL); together with anti–Armenian Hamster IgG F(ab′)2 (20 μg/mL) crosslinking antibody (Jackson ImmunoResearch). Cell activation was arrested by fixation with 4% formaldehyde and cells were permeabilized with 90% ice-cold methanol for immunostaining analysis by flow cytometry. To analyze cytokine secretion, cultured T helper cells were extensively washed and then restimulated for 4 h with 50 ng/mL phorbol myristate acetate (PMA) and 750 ng/mL ionomycin (P + I) plus brefeldin A (1 μg/mL).
Detection of Vav1-Myo1f fusion transcript
RNA was isolated from CD4+ T-cells using the RNAeasy kit (Qiagen) and cDNA was generated using random hexamers and the SuperScript™ IV Reverse Transcriptase (Thermofisher) following the manufacturer’s instructions. To detect the expression of WT Vav1 and Vav1-Myo1f fusion, we performed polymerase chain reaction (PCR) amplification using the following primers: Vav1_Fw CCGGATCACAGAGAAGAAGG, Vav1_Rv ATGGCTCTCCTCTCAGGTTC and Vav1-Myo1F_Rv ATTCAAACCTCTGGGAGGCC and the Q5® High-Fidelity 2X Master Mix (NEB).
In vivo induction of Vav1-Myo1f expression
For in vivo induction of Vav1-Myo1f expression in CD4+ T-cells, Vav1-Myo1f WT/co-Vav1-myo1f; CD4CreERT2 male and female animals (6–8 weeks old) were treated with tamoxifen (3 mg) (Sigma, T5648) dissolved in corn oil and administered via intraperitoneal injection. Analysis of the distribution and characteristics of T cell populations in response to the expression of the Vav1-Myo1f mutant allele was performed 14 days after tamoxifen treatment. Samples obtained in these conditions are defined as a pre-lymphoma throughout the text.
Generation of bone-marrow-derived macrophages
Bone marrow cells were isolated form from 6 to 8 week old wild-type female mice and cultured (2 × 10⁶ cells/mL) in Dulbecco’s Modified Eagle Medium (DMEM) + 10% FBS +10 ng/ml M-CSF. Growth medium was changed on day 3 and on day 7 it was replaced by fresh stimulation medium containing 10% FBS with 10 ng/mL IL4 and/or 10 ng/mL IL10. Macrophage polarization was detected by flow cytometry using CD11b, CD206, CD69 and Arg1 antibodies using standard procedures.
In vitro clodronate treatment
Clodronate (dichloromethylene bisphosphonate (Cl2MBP) containing liposomes were purchased from LIPOSOMA research liposomes; Amsterdam, The Netherlands (van Rooijen et al., 1996). To determine the direct effects of clodronate on cells in vitro, cultured M2 macrophages and Tet2−/−Vav1-Myo1f CD4+ tumor cells were exposed to clodronate- or PBS-containing liposomes at a concentration of 0.5–1%. After three days of incubation, cell viability was analyzed with Cell Titer-Glo® Luminescent Cell Viability Assay (Promega) following manufacturer’s protocol.
In vivo macrophage depletion
To test the contribution of macrophages to lymphoma development, we depleted macrophages using clodronate-containing liposomes (van Rooijen et al., 1996), (LIPOSOMA research liposomes; Amsterdam, The Netherlands). Following manufacturer’s directions, we intravenously injected 100 µL of liposome suspension per 10 grams of animal body weight every 3 days during three weeks.
Adoptive transfer
CD4+ T-cells were isolated from OT-II;Vav1-Myo1f WT/co-Vav1-myo1f;CD4CreERT2 mice and 5×10⁵ cells were transferred into each 6 to 8 week-old Ly5.1 + C57BL/6 female recipients by retro-orbital injection. We immunized the recipient mice by standard foot pad immunization using 50 μg NP14-OVA (Biosearch Technologies) precipitated in alum adjuvant (Pierce).
Lymphoma development
For analysis of lymphoma development, Vav1-Myo1f WT/co-Vav1-myo1f;Tet2fl/fl;CD4CreERT2 male and female mice (6–8 weeks old) were treated with a single dose of 3 mg of tamoxifen to induce Vav1-Myo1f expression and Tet2 deletion in CD4+ T-cells. To generate germinal center responses and T cell activation, mice were immunized with 1×10⁹ sheep red blood cells (SRBC; Cocalico Biologicals, Inc.) delivered by intraperitoneal injection every 3 weeks.
Tumor transplantation
We injected cell suspensions containing 2×10⁶ million cells isolated from tumor containing spleen from diseased mice into immunodeficient 6 to 8 week-old female Rag2 knockout mice using retroorbital injection.
In vivo IL-4 blocking
To assess the role of IL4 in macrophage differentiation in vivo, CD4CreERT2 Vav1WT/co–Vav1-Myo1f mice were treated with 1.5 mg of anti-IL4 (11B11, BioXCell) or anti-HRP control (BE0088, BioXCell) in 200 μL of PBS injected intraperitoneal. The first dose was administered the day before the treatment with tamoxifen to induce Vav1-Myo1f expression or with vehicle for the control mice. Mice were treated with anti-IL4 or anti-HRP control every other day for 3 weeks. Endpoint analysis of macrophage population in mouse spleens was performed by flow cytometry using anti CD163, CD206 and VCAM1as described (Rose et al., 2012). We used 6–8 weeks old male and female mice.
Antibody staining and flow cytometry analysis
We stained single cell suspensions following standard procedures using fluorochrome-conjugated antibodies supplied by eBiosciences and directed against CD4 (RM4–5), CD8a (53–6.7), PD1 (J43), ICOS (C398.4A), CD25 (7D4), CD69 (H1.2F3), CD44 (IM7), F4/80 (BM8), c-MAF (sym0F1), FOXP3 (150D/E4), IL10 (JES5–16 × 103) and IL4 (8D4–8). Anti-CD183 (CXCR3–173) and were obtained from Biolegend. The anti-IFNG (XMG1.2) and anti-CD106 (429 (MVCAM.A) antibodies were purchased from BD Biosciences. The anti-CD163 (EPR19518) was supplied by Abcam and anti-MMR/CD206 by R and D Systems. For detection of CXCR5, we used purified anti-CXCR5 antibody (2G8) from BD Biosciences and followed a three-step staining protocol as previously described (Johnston et al., 2009). Intracellular detection of GATA3 (D13C9) (Cell Signaling), c-MAF (sym0F1) and FOXP3 (150D/E4) (eBiosciences) was performed under standard conditions using the FOXP3 transcription factor staining buffer (eBiosciences) as directed by the manufacturer’s protocol. Intracellular detection of IL4, IL10 and IFNG cytokines were performed using the Intracellular Fixation & Permeabilization Buffer Set (eBiosciences). For flow cytometry detection of phosphorylated intracellular proteins, cells were fixed with 4% formaldehyde and permeabilized with 90% ice-cold methanol and then incubated with phosphor-VAV1 (EP510Y, Abcam), phosphor-ERK (197G2) or phosphor-STAT6 (D8S9Y) rabbit antibodies followed by secondary antibody staining using an anti-rabbit Alexa 647 antibody (all by Cell Signaling). We acquired flow cytometry data using a FACS Canto cytometer (BD Biosciences) and analyzed them using FlowJo software (TreeStar).
We analyzed the repertoire of cytokines present in the supernatants of T cell primary cultures by flow cytometry using the BD™ Cytometric Bead Array (CBA) (BD Biosciences, Cat. No. 560485) according to the manufacturer’s directions.
T cell receptor variable beta chain (TCR Vβ) repertoire analysis
TCR Vβ repertoire analysis of the CD4+ T cell population was analyzed by flow cytometry using a panel of 15 monoclonal antibodies directed against the variable (V) region of the TCRβ chain from the Mouse Vβ TCR Screening Panel (BD Pharmigen) as previously described (Salameire et al., 2012). Clonal expansion was determined by comparing the TCR Vβ repertoire distribution of Vav1-Myo1f CD4+ T-cells obtained from diseased mice with naive CD4+ T-cells obtained from age-matched WT healthy mice as a reference.
Histopathology and immunohistochemistry
Mouse tissues were dissected and fixed on 10% buffered formalin and paraffin-embedded at the Molecular Pathology Shared Resource of the Herbert Irving Comprehensive Cancer Center (HICCC) at Columbia University Medical Center. Tissue sections were subjected to hematoxylin-eosin staining using standard procedures. Immunostaining for CD3, CD4, F4/80 and GATA3 was performed at HistoWiz, Inc. (Brooklyn, NY). To perform CD163 and MRC1/CD206 immunohistochemistry, tissue sections were de-paraffinized using Histoclear followed by antigen-retrieval in citrate buffer at pH 6.4. Endogenous peroxidase (HRP) activity was blocked by treating the sections with 3% hydrogen peroxide. Immunohistochemistry was performed with antibodies targeting CD163 (EPR19518) obtained from Abcam and MRC1/CD206 (R&D Systems) followed by species-specific biotinylated secondary antibodies in the presence of by avidin–horseradish peroxidase and DAB color substrate (Vector Laboratories). After immunohistochemistry, tissue sections were counterstained with hematoxylin. Immunohistochemistry staining for CD20 (clone MJ1, Leica) and CD163 (clone 10D6, Leica) was performed on formalin-fixed paraffin-embedded human PTCL-NOS lymph node samples according to standard protocols on a Bond III autostainer (Leica) after on-line automated heat-induced epitope retrieval. The Bond Polymer Refine detection kit (Leica) was used for visualization. Slides were scanned using a Leica SCN 400 scanner and photomicrographs were examined with Aperio ImageScope Software (Leica Biosystems).
RNA and DNA isolation
Total RNA was extracted from sorted mouse CD4+ T-cells or whole-spleen samples using guanidinium thiocyanate phenol-chloroform extraction (TriZol) and purified using RNeasy Mini kit (QIAGEN, Cat. No. 74106) following the manufacturer’s protocol with some modifications. Briefly, 100% ethanol was added to TriZol lysates, vortexed and applied to QIAGEN RNeasy Mini spin column. The column was washed with QIAGEN buffer RW1 and on-column DNase treatment was performed (RNase-Free DNase Set, QIAGEN Cat. No. 79254). The filter was subsequently washed with QIAGEN buffers RW1 and RPE and 80% ethanol and the RNA was eluted with RNase-free water.
We extracted genomic DNA using the DNeasy Blood and Tissue kit (QIAGEN) following standard procedures.
RNAseq and analysis of gene expression profiling
RNAseq libraries prepared from mouse samples were using the SMARTer Universal Low Input RNA Kit—cDNA Synthesis for NGS (Clontech) and sequenced on an Illumina HiSeq instrument. We mapped reads to mm10 mouse reference genome using HISAT2 (v 2.1.0) with default parameters. Count matrix were generated with Htseq (v 0.5.4) with genecode mouse transcript reference annotation vM24. Data normalization and differential analysis were carried out using limma-voom algorithms in R (v3.6.1) using edgeR (v2.4.2) and Limma (v3.28.14) packages. Gene Set Enrichment Analysis (GSEA) (v4.0.3) (Subramanian et al., 2005) was used to test the enrichment of signatures associated with T helper (Wei et al., 2009), Treg (Miyara et al., 2009), and Tfh (Chtanova et al., 2004) cell differentiation; and human AITL (de Leval et al., 2007).
For the analysis of the transcriptional profile of human PTCL-NOS, we used a previously-published cohort of 42 PTCL,NOS samples (Abate et al., 2017). RNAseq reads were mapped with STAR version 2.4.0 to the human reference genome GRCh37 and the count matrix was generated with featureCounts v1.4.6-p5. Downstream analyses were performed in R (v3.6.1). Matrix normalization was conducted using limma-Voom method with limma package. Consensus clustering was performed using the 5% genes with higher coefficient of variation using the Bioconductor package ConsenclusClusterPlus with default parameters and clusterAlg = km. GSEA analysis (v4.0.3) on human PTCL-NOS samples was performed with indicated tissue microenvironment signatures (Sugio et al., 2018) and default parameters.
Whole-exome sequencing and analysis of mutational profile
For the analysis of the mutational profile of mouse Vav1-Myo1f-induced lymphomas Genomic DNA was isolated from CD4+ T-cells from lymphoma-infiltrated spleens. Paired normal DNA was isolated from the non-T cell fraction or tail clips from the same animals. Exome capture and sequencing were performed at GENEWIZ (South Plainfield, NJ) using the Agilent SureSelectXT Mouse All Exon capture kit (Agilent) and paired-end sequencing (2 × 150 bp) in a HiSeq2000 sequencing instrument (Illumina). We obtained between 26.6M and 80.4M paired-end reads per sample, with an average of 53.7M reads. Data pre-processing for variant discovery was performed using the Genome Analysis Toolkit (GATK) version 4.2.0.0 and Picard tools version 2.26.10 following best practices as outlined in GATK documentation. Reads are aligned to GRCm38 using Burrows-Wheeler Aligner’s maximal exact matches (BWA-MEM) algorithm version 0.7.1. We identified candidate somatic variants as those absent in normal and present in tumor using the Mutect2 algorithm.
Single cell RNA sequencing (scRNA-seq) procedures and data analysis
Cell suspensions were prepared by disaggregating whole-spleen tissue isolated from control (WT and Vav1-myo1f-expressing mice at premalignant stage) and diseased mice (harboring Vav1-myo1f- and Tet2−/− Vav1-Myo1f-induced lymphomas) and eliminating red blood cells using lysis buffer. After testing cell viability, cells were resuspended in PBS plus 10% FBS at a concentration of 1,000 cells/mL and loaded onto a Chromium Controller (10x Genomics) targeting 5,000 cells. Single-cell RNAseq libraries were prepared using the Chromium Single Cell 3′ v2 Reagent Kit (10x Genomics CG00052) and sequenced on an Illumina HiSeq 4000 instrument (Illumina) as 150-bp paired-end reads at a sequencing depth of at least 20,000 reads pairs per cell at Genomics and High Throughput Screening Shared Resource at the HICCC/JP Sulzberger Columbia Genome Center.
sc-RNAseq data from 12 samples (3 biological replicates per condition; Table S2) was subjected to the Cell Ranger pipeline (Zheng et al., 2017) with default parameters, generating the filtered feature-barcode matrixes used in the subsequent single-cell computational analyses. The 12 raw expression matrixes were individually processed with the python package SCANPY (Wolf et al., 2018). The initial preprocessing consisted in the filtering of (i) rRNA transcripts (ii) cells with >20% mitochondrial RNA transcripts; (iii) cells expressing less than 200 genes; and (iv) cells with over 25,000 transcripts. Filtered expression matrixes were then analyzed with the R packages Liger (Welch et al., 2019) and Seurat (Butler et al., 2018) in order to integrate the 12 samples (n = 44,262 total cells) and reduce batch effect. Transcript counts were normalized, and highly variable genes across all datasets were identified for use in the downstream batch integration process. Then, normalized gene expression data was scaled before performing the integrative non-negative matrix factorization to obtain the batch-integrated gene expression data. All these steps were performed with the default parameters.
Following data integration, a shared factor neighborhood graph was built to jointly cluster cells from the 12 samples and the corresponding clusters were quantile normalized. Finally, the Louvain algorithm was run with resolution values ranging from 0.05 to 1.0. A sensitivity analysis using ‘‘silhouette_score’’ from the Python package Sklearn yielded an optimal Louvain resolution of 0.25 resulting in the separation of 16 clusters. Differentially expressed genes (DEG) were determined for each cluster using t-tests (Table S3).
To assign cells to specific immune cell types, we correlated the normalized counts for each cell with 10 mouse-specific expression profiles (Liu et al., 2017) representing different immune cell types: B-cells, CD4+ T-cells, CD8+ T-cells, dendritic cells, eosinophils, monocytes, macrophages, mast cells, neutrophils and natural killer cells. The expression signatures were based on 149 marker genes. We then classified every cell as the type with highest correlation value among the 10 possible categories (Table S4).
According to our cell type classification, the CD4+ T cell population was highly concentrated in Louvain clusters 2 and 3. Aiming for an in-depth specific analysis of the CD4+ T cell population, we subsequently restricted our analysis to the CD4+ T-cells from those clusters (n = 5,086 cells).
To obtain a high resolution map of the different CD4+ T cell subtypes, we subjected the in silico sorted CD4+ T cell cells to a new round of batch integration from raw transcript quantification, followed by CD4+ T-cell-specific Louvain clustering using Liger with default parameters, obtaining 13 clusters at the optimal 0.4 resolution. Small cell clusters (with fewer than 100 cells) displaying a non-CD4 gene expression profile likely due to noise or erroneous labeling, were filtered out. Differentially expressed genes (DEG) were determined for each of the remaining 8 clusters using t-tests (Table S5). The resulting 8 CD4+ T cell clusters (n = 4,808 cells) were assigned to specific CD4+ T cell subtypes based on published lineage-specific transcriptional signatures and known canonical markers identified within the DEGs. The distribution of the different CD4+ T cell clusters across the different experimental conditions was analyzed using Fisher Exact tests. The raw p values were adjusted using the Benjamini-Hochberg procedure (Table S6).
To characterize the macrophage/monocyte cell compartment (n = 4,417), we focused on Louvain clusters 6, 7, 8, 11 and 13 identified in the whole-spleen analysis, which are enriched in these specific populations. As described for the focused analysis of the CD4+ T cell compartment, a high-resolution map of monocytes/macrophages was obtained after performing a new round of batch integration. Louvain clustering of the final integrated monocyte/macrophage population with optimal resolution of 0.15 resulted in 9 clusters. A total of 56 cells were filtered out from the final monocyte/macrophage population (n = 4,361) as outliers in the UMAP projection. Differentially expressed genes (DEG) were determined for each of the 9 clusters using t-tests (Table S7) and the distribution of the different macrophage/monocyte clusters across the experimental conditions was calculated by means of Fisher Exact tests, and p values were corrected using the Benjamini-Hochberg procedure (Table S8).
To predict the potential ligands associated with cell-cell interactions between lymphoma cells and Tumor-Associated Macrophages, we used the NicheNet, an R package for cell-cell communication analyses. NicheNet predicts ligand-to-target interactions that drive gene expression changes in a group of cells of interest, under defined conditions (Browaeys et al., 2020). Using the normalized, batch-corrected expression matrix of our 12 samples, we considered as list of genes of interest the top 30 DEG in clusters 1 and 5 from the macrophage population.
QUANTIFICATION AND STATISTICAL ANALYSIS
Statistical analyses were conducted using Microsoft Excel 2013 and Prism software v6.0 (GraphPad Software, La Jolla, CA, USA). Results were reported as mean ± SD (standard deviation) as indicated in the figure legends unless otherwise stated. We performed analyses of significance using Student’s t-test assuming equal variance. Continuous biological variables were assumed to follow a normal distribution. A p value of <0.05 was considered to indicate statistical significance. Survival in mouse experiments was represented as a Kaplan-Meier curve and Log-rank test was used to determine the significance. All the experiments with representative images have been repeated at least twice and representative images were shown. For experiments with animals ‘‘n’’ represents number of animals.
Gene set enrichment analysis was performed as previously described (Subramanian et al., 2005) using the javaGSEA desktop software. The statistical significance of enrichment scores was estimated empirically using a null distribution generated by performing gene permutations on the gene expression data.
Information on the number of biological replicates for each experiment, mice age and sex, can be found in the Methods Details section and in the Figure Legends. Statistical analysis are also indicated in the Figure Legends.
Supplementary Material
Highlights.
Vav1-Myo1f induces development of GATA3+ Th2-like peripheral T cell lymphoma (PTCL)
Vav1-Myo1f induces accumulation of tumor-associated macrophages (TAMs)
Ablation of TAMs highlights the role of tumor microenvironment in lymphoma growth
Tumor-associated macrophages can be targeted for the treatment of high-risk PTCL
ACKNOWLEDGMENTS
This work was supported by the National Institutes of Health grants U01 CA243073–01 (R.R. and T.P.), R01 CA197945–01 (T.P.), P50CA192937 (T.P.), R01CA256341–01 (T.P.), R35 CA210065 (A.A.F.), and P30 CA013696 (in support of the Herbert Irving Comprehensive Cancer Center Genomics, Flow Cytometry, and Molecular Pathology Shared Resources) and Associazione Italiana per la Ricerca sul Cancro 5x1000 grant no. 21198 (S.P.). J.R.C. was supported by a Lady Tata Foundation fellowship. R.A. was supported by a fellowship from the Leukemia and Lymphoma Society. W.-H.W.L. is supported by the National Institutes of Health R38 CA231577 award. J.A.B. is the Candy and William Raveis Fellow of the Damon Runyon-Sohn Foundation Pediatric Cancer Fellowship Award (grant no. DRSG-31–19). A.P.L. is a recipient of a Lady Tata Foundation postdoctoral fellowship. B.B.S. is a recipient of an F31 CA261153–01 Ruth L. Kirschstein National Research Service Award. We would also like to thank Dr. Francesco G. Brundu for the helpful discussions on single-cell analyses.
Footnotes
SUPPLEMENTAL INFORMATION
Supplemental information can be found online at https://doi.org/10.1016/j.celrep.2022.110695.
DECLARATION OF INTERESTS
T.P. is the recipient of a research grant from Kura Oncology, Inc. R.R. is a member of the Scientific Advisory Board of AimenBio and founder of Genotwin. None of these activities are related to the work presented in this paper.
REFERENCES
- Abate F, da Silva-Almeida AC, Zairis S, Robles-Valero J, Couronne L, Khiabanian H, Quinn SA, Kim MY, Laginestra MA, Kim C, et al. (2017). Activating mutations and translocations in the guanine exchange factor VAV1 in peripheral T-cell lymphomas. Proc. Natl. Acad. Sci. U S A 114, 764–769. [DOI] [PMC free article] [PubMed] [Google Scholar]
- Aghajani K, Keerthivasan S, Yu Y, and Gounari F (2012). Generation of CD4CreER(T(2)) transgenic mice to study development of peripheral CD4-T-cells. Genesis 50, 908–913. [DOI] [PMC free article] [PubMed] [Google Scholar]
- Allavena P, Anfray C, Ummarino A, and Andon FT (2021). Therapeutic manipulation of tumor-associated macrophages: facts and hopes from a clinical and translational perspective. Clin. Cancer Res 27, 3291–3297. [DOI] [PubMed] [Google Scholar]
- Amador C, Greiner TC, Heavican TB, Smith LM, Galvis KT, Lone W, Bouska A, D’Amore F, Pedersen MB, Pileri S, et al. (2019). Reproducing the molecular subclassification of peripheral T-cell lymphoma-NOS by immunohistochemistry. Blood 134, 2159–2170. [DOI] [PMC free article] [PubMed] [Google Scholar]
- Boddicker RL, Razidlo GL, Dasari S, Zeng Y, Hu G, Knudson RA, Greipp PT, Davila JI, Johnson SH, Porcher JC, et al. (2016). Integrated mate-pair and RNA sequencing identifies novel, targetable gene fusions in peripheral T-cell lymphoma. Blood 128, 1234–1245. [DOI] [PMC free article] [PubMed] [Google Scholar]
- Browaeys R, Saelens W, and Saeys Y (2020). NicheNet: modeling intercellular communication by linking ligands to target genes. Nat. Methods 17, 159–162. [DOI] [PubMed] [Google Scholar]
- Butler A, Hoffman P, Smibert P, Papalexi E, and Satija R (2018). Integrating single-cell transcriptomic data across different conditions, technologies, and species. Nat. Biotechnol 36, 411–420. [DOI] [PMC free article] [PubMed] [Google Scholar]
- Capitani N, Amedei A, Paccani SR, Matucci A, Vultaggio A, Del Prete G, Baldari CT, and D’Elios MM (2010). Impaired TH2 response in patients with Vav1-deficient common variable immunodeficiency with T-cell defects. J. Allergy Clin. Immunol 126, 671–675. [DOI] [PubMed] [Google Scholar]
- Chen Z, Huang A, Sun J, Jiang T, Qin FX, and Wu A (2017). Inference of immune cell composition on the expression profiles of mouse tissue. Sci. Rep 7, 40508. [DOI] [PMC free article] [PubMed] [Google Scholar]
- Chen Z, Quan L, Huang A, Zhao Q, Yuan Y, Yuan X, Shen Q, Shang J, Ben Y, Qin FX, and Wu A (2018). Seq-ImmuCC: cell-centric view of tissue transcriptome measuring cellular compositions of immune microenvironment from mouse RNA-seq data. Front. Immunol 9, 1286. [DOI] [PMC free article] [PubMed] [Google Scholar]
- Chtanova T, Tangye SG, Newton R, Frank N, Hodge MR, Rolph MS, and Mackay CR (2004). T follicular helper cells express a distinctive transcriptional profile, reflecting their role as non-Th1/Th2 effector cells that provide help for B cells. J. Immunol 173, 68–78. [DOI] [PubMed] [Google Scholar]
- Cortes JR, Ambesi-Impiombato A, Couronne L, Quinn SA, Kim CS, da Silva Almeida AC, West Z, Belver L, Martin MS, Scourzic L, et al. (2018). RHOA G17V induces T follicular helper cell specification and promotes lymphomagenesis. Cancer Cell 33, 259–273.e7. [DOI] [PMC free article] [PubMed] [Google Scholar]
- Cortes JR, and Palomero T (2016). The curious origins of angioimmunoblastic T-cell lymphoma. Curr. Opin. Hematol 23, 434–443. [DOI] [PMC free article] [PubMed] [Google Scholar]
- Cortes JR, and Palomero T (2020). Biology and molecular pathogenesis of mature T-cell lymphomas. Cold Spring Harb. Perspect. Med 11, a035402. [DOI] [PMC free article] [PubMed] [Google Scholar]
- Couronne L, Bastard C, and Bernard OA (2012). TET2 and DNMT3A mutations in human T-cell lymphoma. N. Engl. J. Med 366, 95–96. [DOI] [PubMed] [Google Scholar]
- de Leval L, Rickman DS, Thielen C, Reynies A, Huang YL, Delsol G, Lamant L, Leroy K, Briere J, Molina T, et al. (2007). The gene expression profile of nodal peripheral T-cell lymphoma demonstrates a molecular link between angioimmunoblastic T-cell lymphoma (AITL) and follicular helper T (TFH) cells. Blood 109, 4952–4963. [DOI] [PubMed] [Google Scholar]
- Eppert K, Takenaka K, Lechman ER, Waldron L, Nilsson B, van Galen P, Metzeler KH, Poeppl A, Ling V, Beyene J, et al. (2011). Stem cell gene expression programs influence clinical outcome in human leukemia. Nat. Med 17, 1086–1093. [DOI] [PubMed] [Google Scholar]
- Fujisawa M, Sakata-Yanagimoto M, Nishizawa S, Komori D, Gershon P, Kiryu M, Tanzima S, Fukumoto K, Enami T, Muratani M, et al. (2018). Activation of RHOA-VAV1 signaling in angioimmunoblastic T-cell lymphoma. Leukemia 32, 694–702. [DOI] [PMC free article] [PubMed] [Google Scholar]
- Fukumoto K, Sakata-Yanagimoto M, Fujisawa M, Sakamoto T, Miyoshi H, Suehara Y, Nguyen TB, Suma S, Yanagimoto S, Shiraishi Y, et al. (2020). VAV1 mutations contribute to development of T-cell neoplasms in mice. Blood 136, 3018–3032. [DOI] [PMC free article] [PubMed] [Google Scholar]
- Gabrysova L, Alvarez-Martinez M, Luisier R, Cox LS, Sodenkamp J, Hosking C, Perez-Mazliah D, Whicher C, Kannan Y, Potempa K, et al. (2018). c-Maf controls immune responses by regulating disease-specific gene networks and repressing IL-2 in CD4(+) T cells. Nat. Immunol 19, 497–507. [DOI] [PMC free article] [PubMed] [Google Scholar]
- Ham JS, Park HY, Ryu KJ, Ko YH, Kim WS, and Kim SJ (2017). Elevated serum interleukin-10 level and M2 macrophage infiltration are associated with poor survival in angioimmunoblastic T-cell lymphoma. Oncotarget 8, 76231–76240. [DOI] [PMC free article] [PubMed] [Google Scholar]
- Iqbal J, Wright G, Wang C, Rosenwald A, Gascoyne RD, Weisenburger DD, Greiner TC, Smith L, Guo S, Wilcox RA, et al. (2014). Gene expression signatures delineate biological and prognostic subgroups in peripheral T-cell lymphoma. Blood 123, 2915–2923. [DOI] [PMC free article] [PubMed] [Google Scholar]
- Johnston RJ, Poholek AC, DiToro D, Yusuf I, Eto D, Barnett B, Dent AL, Craft J, and Crotty S (2009). Bcl6 and Blimp-1 are reciprocal and antagonistic regulators of T follicular helper cell differentiation. Science 325, 1006–1010. [DOI] [PMC free article] [PubMed] [Google Scholar]
- Kanhere A, Hertweck A, Bhatia U, Gokmen MR, Perucha E, Jackson I, Lord GM, and Jenner RG (2012). T-bet and GATA3 orchestrate Th1 and Th2 differentiation through lineage-specific targeting of distal regulatory elements. Nat. Commun 3, 1268. [DOI] [PMC free article] [PubMed] [Google Scholar]
- Kaplan MH, Schindler U, Smiley ST, and Grusby MJ (1996). Stat6 is required for mediating responses to IL-4 and for development of Th2 cells. Immunity 4, 313–319. [DOI] [PubMed] [Google Scholar]
- Lee PP, Fitzpatrick DR, Beard C, Jessup HK, Lehar S, Makar KW, Perez-Melgosa M, Sweetser MT, Schlissel MS, Nguyen S, et al. (2001). A critical role for Dnmt1 and DNA methylation in T cell development, function, and survival. Immunity 15, 763–774. [DOI] [PubMed] [Google Scholar]
- Li ZW, and Dalton WS (2006). Tumor microenvironment and drug resistance in hematologic malignancies. Blood Rev 20, 333–342. [DOI] [PubMed] [Google Scholar]
- Liu Y, Easton J, Shao Y, Maciaszek J, Wang Z, Wilkinson MR, McCastlain K, Edmonson M, Pounds SB, Shi L, et al. (2017). The genomic landscape of pediatric and young adult T-lineage acute lymphoblastic leukemia. Nat. Genet 49, 1211–1218. [DOI] [PMC free article] [PubMed] [Google Scholar]
- Lohr JG, Stojanov P, Lawrence MS, Auclair D, Chapuy B, Sougnez C, Cruz-Gordillo P, Knoechel B, Asmann YW, Slager SL, et al. (2012). Discovery and prioritization of somatic mutations in diffuse large B-cell lymphoma (DLBCL) by whole-exome sequencing. Proc. Natl. Acad. Sci. U S A 109, 3879–3884. [DOI] [PMC free article] [PubMed] [Google Scholar]
- Love C, Sun Z, Jima D, Li G, Zhang J, Miles R, Richards KL, Dunphy CH, Choi WW, Srivastava G, et al. (2012). The genetic landscape of mutations in Burkitt lymphoma. Nat. Genet 44, 1321–1325. [DOI] [PMC free article] [PubMed] [Google Scholar]
- Lunning MA, and Vose JM (2017). Angioimmunoblastic T-cell lymphoma: the many-faced lymphoma. Blood 129, 1095–1102. [DOI] [PubMed] [Google Scholar]
- Malek TR (2008). The biology of interleukin-2. Annu. Rev. Immunol 26, 453–479. [DOI] [PubMed] [Google Scholar]
- Mildner A, Schonheit J, Giladi A, David E, Lara-Astiaso D, Lorenzo-Vivas E, Paul F, Chappell-Maor L, Priller J, Leutz A, et al. (2017). Genomic characterization of murine monocytes reveals C/EBPbeta transcription factor dependence of Ly6C(-) cells. Immunity 46, 849–862.e7. [DOI] [PubMed] [Google Scholar]
- Miyara M, Yoshioka Y, Kitoh A, Shima T, Wing K, Niwa A, Parizot C, Taflin C, Heike T, Valeyre D, et al. (2009). Functional delineation and differentiation dynamics of human CD4+ T cells expressing the FoxP3 transcription factor. Immunity 30, 899–911. [DOI] [PubMed] [Google Scholar]
- Moon CS, Reglero C, Cortes JR, Quinn SA, Alvarez S, Zhao J, Lin WW, Cooke AJ, Abate F, Soderquist CR, et al. (2021). FYN-TRAF3IP2 induces NF-kappaB signaling-driven peripheral T cell lymphoma. Nat. Cancer 2, 98–113. [DOI] [PMC free article] [PubMed] [Google Scholar]
- Moran-Crusio K, Reavie L, Shih A, Abdel-Wahab O, Ndiaye-Lobry D, Lobry C, Figueroa ME, Vasanthakumar A, Patel J, Zhao X, et al. (2011). Tet2 loss leads to increased hematopoietic stem cell self-renewal and myeloid transformation. Cancer Cell 20, 11–24. [DOI] [PMC free article] [PubMed] [Google Scholar]
- Ng SY, Brown L, Stevenson K, deSouza T, Aster JC, Louissaint A, and Weinstock DM (2018). RhoA G17V is sufficient to induce autoimmunity and promotes T cell lymphomagenesis in mice. Blood 132, 935–947. [DOI] [PMC free article] [PubMed] [Google Scholar]
- O’Hayre M, Inoue A, Kufareva I, Wang Z, Mikelis CM, Drummond RA, Avino S, Finkel K, Kalim KW, DiPasquale G, et al. (2016). Inactivating mutations in GNA13 and RHOA in Burkitt’s lymphoma and diffuse large B-cell lymphoma: a tumor suppressor function for the Galpha13/RhoA axis in B cells. Oncogene 35, 3771–3780. [DOI] [PMC free article] [PubMed] [Google Scholar]
- Palomero T, Couronne L, Khiabanian H, Kim MY, Ambesi-Impiombato A, Perez-Garcia A, Carpenter Z, Abate F, Allegretta M, Haydu JE, et al. (2014). Recurrent mutations in epigenetic regulators, RHOA and FYN kinase in peripheral T cell lymphomas. Nat. Genet 46, 166–170. [DOI] [PMC free article] [PubMed] [Google Scholar]
- Pizzi M, Margolskee E, and Inghirami G (2018). Pathogenesis of peripheral T cell lymphoma. Annu. Rev. Pathol 13, 293–320. [DOI] [PubMed] [Google Scholar]
- Rose S, Misharin A, and Perlman H (2012). A novel Ly6C/Ly6G-based strategy to analyze the mouse splenic myeloid compartment. Cytometry A 81, 343–350. [DOI] [PMC free article] [PubMed] [Google Scholar]
- Rutz S, and Ouyang W (2016). Regulation of interleukin-10 expression. Adv. Exp. Med. Biol 941, 89–116. [DOI] [PubMed] [Google Scholar]
- Salameire D, Solly F, Fabre B, Lefebvre C, Chauvet M, Gressin R, Corront B, Ciapa A, Pernollet M, Plumas J, et al. (2012). Accurate detection of the tumor clone in peripheral T-cell lymphoma biopsies by flow cytometric analysis of TCR-Vbeta repertoire. Mod. Pathol 25, 1246–1257. [DOI] [PubMed] [Google Scholar]
- Shapouri-Moghaddam A, Mohammadian S, Vazini H, Taghadosi M, Esmaeili SA, Mardani F, Seifi B, Mohammadi A, Afshari JT, and Sahebkar A (2018). Macrophage plasticity, polarization, and function in health and disease. J. Cell Physiol 233, 6425–6440. [DOI] [PubMed] [Google Scholar]
- Skytthe MK, Graversen JH, and Moestrup SK (2020). Targeting of CD163(+) macrophages in inflammatory and malignant diseases. Int. J. Mol. Sci 21, 5497. [DOI] [PMC free article] [PubMed] [Google Scholar]
- Subramanian A, Tamayo P, Mootha VK, Mukherjee S, Ebert BL, Gillette MA, Paulovich A, Pomeroy SL, Golub TR, Lander ES, and Mesirov JP (2005). Gene set enrichment analysis: a knowledge-based approach for interpreting genome-wide expression profiles. Proc. Natl. Acad. Sci. U S A 102, 15545–15550. [DOI] [PMC free article] [PubMed] [Google Scholar]
- Sugio T, Miyawaki K, Kato K, Sasaki K, Yamada K, Iqbal J, Miyamoto T, Ohshima K, Maeda T, Miyoshi H, and Akashi K (2018). Microenvironmental immune cell signatures dictate clinical outcomes for PTCL-NOS. Blood Adv 2, 2242–2252. [DOI] [PMC free article] [PubMed] [Google Scholar]
- Swerdlow SH, Campo E, Pileri SA, Harris NL, Stein H, Siebert R, Advani R, Ghielmini M, Salles GA, Zelenetz AD, and Jaffe ES (2016). The 2016 revision of the World Health Organization classification of lymphoid neoplasms. Blood 127, 2375–2390. [DOI] [PMC free article] [PubMed] [Google Scholar]
- Tanaka Y, So T, Lebedeva S, Croft M, and Altman A (2005). Impaired IL-4 and c-Maf expression and enhanced Th1-cell development in Vav1-deficient mice. Blood 106, 1286–1295. [DOI] [PMC free article] [PubMed] [Google Scholar]
- Timmins MA, Wagner SD, and Ahearne MJ (2020). The new biology of PTCL-NOS and AITL: current status and future clinical impact. Br. J. Haematol 189, 54–66. [DOI] [PubMed] [Google Scholar]
- van Rooijen N, Sanders A, and van den Berg TK (1996). Apoptosis of macrophages induced by liposome-mediated intracellular delivery of clodronate and propamidine. J. Immunol. Methods 193, 93–99. [DOI] [PubMed] [Google Scholar]
- Vose J, Armitage J, Weisenburger D, and International TCLP (2008). International peripheral T-cell and natural killer/T-cell lymphoma study: pathology findings and clinical outcomes. J. Clin. Oncol 26, 4124–4130. [DOI] [PubMed] [Google Scholar]
- Wang T, Feldman AL, Wada DA, Lu Y, Polk A, Briski R, Ristow K, Habermann TM, Thomas D, Ziesmer SC, et al. (2014). GATA-3 expression identifies a high-risk subset of PTCL, NOS with distinct molecular and clinical features. Blood 123, 3007–3015. [DOI] [PMC free article] [PubMed] [Google Scholar]
- Wang Y, Yan K, Lin J, Li J, and Bi J (2021). Macrophage M2 Co-expression factors correlate with the immune microenvironment and predict outcome of renal clear cell carcinoma. Front. Genet 12, 615655. [DOI] [PMC free article] [PubMed] [Google Scholar]
- Warner K, Weit N, Crispatzu G, Admirand J, Jones D, and Herling M (2013). T-cell receptor signaling in peripheral T-cell lymphoma - a review of patterns of alterations in a central growth regulatory pathway. Curr. Hematol. Malig. Rep 8, 163–172. [DOI] [PubMed] [Google Scholar]
- Watatani Y, Sato Y, Miyoshi H, Sakamoto K, Nishida K, Gion Y, Nagata Y, Shiraishi Y, Chiba K, Tanaka H, et al. (2019). Molecular heterogeneity in peripheral T-cell lymphoma, not otherwise specified revealed by comprehensive genetic profiling. Leukemia 33, 2867–2883. [DOI] [PubMed] [Google Scholar]
- Wei G, Wei L, Zhu J, Zang C, Hu-Li J, Yao Z, Cui K, Kanno Y, Roh TY, Watford WT, et al. (2009). Global mapping of H3K4me3 and H3K27me3 reveals specificity and plasticity in lineage fate determination of differentiating CD4+ T cells. Immunity 30, 155–167. [DOI] [PMC free article] [PubMed] [Google Scholar]
- Welch JD, Kozareva V, Ferreira A, Vanderburg C, Martin C, and Macosko EZ (2019). Single-cell multi-omic integration compares and contrasts features of brain cell Identity. Cell 177, 1873–1887.e17. [DOI] [PMC free article] [PubMed] [Google Scholar]
- Wolf FA, Angerer P, and Theis FJ (2018). SCANPY: large-scale single-cell gene expression data analysis. Genome Biol 19, 15. [DOI] [PMC free article] [PubMed] [Google Scholar]
- Zhang W, Wang Z, Luo Y, Zhong D, Luo Y, and Zhou D (2016). GATA3 expression correlates with poor prognosis and tumor-associated macrophage infiltration in peripheral T cell lymphoma. Oncotarget 7, 65284–65294. [DOI] [PMC free article] [PubMed] [Google Scholar]
- Zheng GX, Terry JM, Belgrader P, Ryvkin P, Bent ZW, Wilson R, Ziraldo SB, Wheeler TD, McDermott GP, Zhu J, et al. (2017). Massively parallel digital transcriptional profiling of single cells. Nat. Commun 8, 14049. [DOI] [PMC free article] [PubMed] [Google Scholar]
Associated Data
This section collects any data citations, data availability statements, or supplementary materials included in this article.
Supplementary Materials
Data Availability Statement
Mouse RNAseq and single cell RNAseq data have been deposited at Gene Expression Omnibus (GEO) and are publicly available as of the date of publication. Accession number is listed in the Key resources table.
Mouse whole exome sequencing data have been deposited at the Sequence Read Archive (SRA) repository and are publicly available as of the date of publication. Accession number is listed in the Key resources table.
This paper analyzes existing, publicly available data. The accession numbers and links for the datasets used are listed in the Key resources table.
This paper does not report original code.
Any additional information required to reanalyze the data reported in this paper is available from the lead contact upon request
KEY RESOURCES TABLE
| REAGENT or RESOURCE | SOURCE | IDENTIFIER |
|---|---|---|
| Antibodies | ||
| Hamster anti-Mouse CD3e (145–2C11) | BD Biosciences | Cat#550275; RRID: AB_393572 |
| Hamster anti-Mouse CD28 (37.51) | BD Biosciences | Cat#557393; RRID: AB_396676 |
| Goat anti–Armenian Hamster IgG F(ab’)2 | Jackson ImmunoResearch | Cat#127–005-099; RRID: AB_2338971 |
| anti-CD4 - PerCP-Cyanine5.5 (RM4–5) | eBioscience | Cat#45–0042; RRID: AB_1107001 |
| anti-CD8a - PE-Cy7 (53–6.7) | eBioscience | Cat#25–0081; RRID: AB_469583 |
| anti-CD69 - APC (H1.2F3) | eBioscience | Cat#17–0691; RRID: AB_1210796 |
| Biotin anti-mouse ICOS (7E.17G9) | Biolegend | Cat#117403; RRID: AB_961239 |
| anti-PD1 – PE (J43) | eBioscience | Cat#12–9985; RRID: AB_466296 |
| anti-CXCR5 (2G8) | eBioscience | Cat#551961; RRID: AB_394302 |
| Biotin Goat Anti-Rat IgG | Jackson ImmunoResearch | Cat#112–065-062; RRID: AB_2338173 |
| APC Streptavidin | BD Biosciences | Cat#554067; RRID: AB_10050396 |
| PE Streptavidin | BD Biosciences | Cat#554061; RRID: AB_10053328 |
| anti-FOXP3 - PE (150D/E4) | eBioscience | Cat#1050043; RRID: AB_529581 |
| anti-CD25 - Alexa Fluor 488 (7D4) | eBioscience | Cat#53–0252; RRID: AB_763470 |
| anti-CD62L-APC (MEL-14) | BD Biosciences | Cat#553152; RRID: AB_398533 |
| anti-CD44 - PerCP-Cyanine5.5 (IM7) | eBioscience | Cat#45–0441-82; RRID: AB_925746 |
| anti-CD183 (CXCR3)-PE (CXCR3–173) | Biolegend | Cat#126505; RRID: AB_1027656 |
| anti-CD196 (CCR6) - PerCP-Cyanine5.5 (29–2L17) | Biolegend | Cat#129809; RRID: AB_2072797 |
| anti-IL4-PE (11B11) | eBioscience | Cat#12–7041-71; RRID: AB_466154 |
| anti-IL10-APC (JES5–16 × 103) | eBioscience | Cat#17–7101-81; RRID: AB_469501 |
| anti-IFNG- PerCP-Cyanine5.5 (XMG1.2) | BD Biosciences | Cat#560660; RRID: AB_1727533 |
| anti-cMAF - PE (sym0F1) | eBioscience | Cat#12–9855-42; RRID: AB_2572747 |
| Phospho-p44/42 MAPK (Erk1/2) (Thr202/Tyr204) Rabbit mAb (197G2) | Cell Signaling | Cat#4377; RRID: AB_331775 |
| Anti-rabbit IgG (H+L), F(ab’)2 Fragment (Alexa Fluor® 647 Conjugate) | Cell Signaling | Cat#4414; RRID: AB_10693544 |
| anti-VAV1 (phospho Y174) (EP510Y) | Abcam | Cat#ab76225; RRID: AB_1524546 |
| GATA-3 XP Rabbit mAb antibody (D13C9) | Cell Signaling | Cat#5852; RRID: AB_10835690 |
| anti-Phospho-Stat6 (Tyr641) Antibody | Cell Signaling | Cat#9361; RRID: AB_331595 |
| anti-CD163 (EPR19518) | Abcam | Cat#ab182422; RRID: AB_2753196 |
| anti-MMR/CD206 | R and D Systems | Cat#AF2535; RRID: AB_2063012 |
| Alexa Fluor® 647 Rat Anti-Mouse CD106 (MVCAM.A) | BD Biosciences | Cat#561612; RRID: AB_10896662 |
| anti-CD3 (SP7) | Abcam | Cat#ab16669; RRID: AB_443425 |
| anti-CD4 (EPR19514) | Abcam | Cat#ab183685; RRID: AB_2686917 |
| anti-F4/80 (BM8) | eBioscience | Cat#14–4801-82; RRID: AB_467558 |
| InVivoMAb anti-mouse IL-4 (11B11) | BioXCell | Cat#BE0045; RRID: AB_1107707 |
| InVivoMAb rat IgG1 isotype control, anti-HRP (HRPN) | BioXCell | Cat#BE0088; RRID: AB_1107775 |
|
Chemicals, peptides, and recombinant proteins | ||
| 4-Hydroxy-3-nitrophenylacetyl Ovalbumin | Biosearch Technologies | Cat#N-5051 |
| Imject™ Alum Adjuvant | Thermo Scientific | Cat#77161 |
| Tamoxifen | Sigma-Aldrich | Cat#T5648 |
| Corn oil | Sigma-Aldrich | Cat#C8267 |
| (Z)-4-OHT; 4-Monohydroxytamoxifen | Santa Cruz Biotechnology | Cat#sc-3542 |
| Guanidinium thiocyanatephenol-chloroform extraction (TRIzol®) | Thermo Scientific | Cat#15596018 |
| CellTrace™ Violet Cell Proliferation Kit | Thermo Scientific | Cat#C34557 |
| XenoLight D-Luciferin - K+ Salt Bioluminescent Substrate | PerkinElmer | Cat#122799 |
| Sheep red blood in Alsevers | Cocalico Biological | Cat#20–1334A |
| Clodronate liposomes and control liposomes (PBS) | LIPOSOMA research liposomes | Cat#CP-005–005 |
| Recombinant Human IL-2 | Peprotech | Cat#200–02 |
| Phorbol 12-myristate 13-acetate | Sigma-Aldrich | Cat#P1585 |
| Ionomycin | EMD Millipore | Cat#407952 |
| BD GolgiPlug™ Protein Transport Inhibitor (Containing Brefeldin A) | BD Biosciences | Cat#555029 |
| Histo-Clear II | National Diagnostics | Cat#HS-202 |
| Antigen Unmasking Solution, Citrate-Based | Vector Laboratories | Cat#H-3300 |
| Hydrogen peroxide solution 30% (w/w) in H2O, contains stabilizer | Sigma-Aldrich | Cat#H1009 |
| VECTASTAIN® Elite ABC-HRP Kit (Peroxidase, Universal) | Vector Laboratories | Cat#PK-6200 |
| DAB Substrate Kit, Peroxidase (HRP), with Nickel, (3,3′-diaminobenzidine) | Vector Laboratories | Cat#SK-4100 |
|
Critical commercial assays | ||
| Mouse naive CD4+ T cell Isolation Kit | Milteny | 130–104-453 |
| RNeasy mini kit | Qiagen | 74106 |
| RNase-Free DNase Set | Qiagen | 79254 |
| DNeasy Blood & Tissue Kit | Qiagen | 69506 |
| BD™ Cytometric Bead Array (CBA) Mouse Th1/Th2/Th17 Cytokine Kit | BD Biosciences | 560485 |
| Mouse V β TCR Screening Panel | BD Pharmigen | 557004 |
| Chromium Single Cell 3ʹ v2 Reagent Kit | 10x Genomics | CG00052 |
| Cell Titer-Glo® Luminescent Cell Viability Assay | Promega | G7571 |
| SuperScript™ IV Reverse Transcriptase | Thermofisher | 18090010 |
| Q5® High-Fidelity 2X Master Mix | NEB | M0492S |
|
Deposited data | ||
| RNA-Seq and Single Cell RNA-Seq sequencing data | This manuscript | GEO: GSE166673 |
| Human PTCL RNA-Seq sequencing data | Abate et al., 2017 and Moon et al., 2021 | dbGaP: phs001962.v1.p1 andphs000689.v1.p1s. |
| Whole Exome Sequencing data | This manuscript | SRA: PRJNA800774 |
| TH2_VS_NAIVE_CD4_TCELL_UP | Immunity. 2009 Jan 16; 30(1):155–67 | GEO: GSE14308 |
| TH1_VS_NAIVE_CD4_TCELL_UP | Immunity. 2009 Jan 16; 30(1):155–67 | GEO: GSE14308 |
| TREG_VS_TCONV_UP | Immunity. 2009 Jun 19; 30(6):899–911. | GEO: GSE15659 |
| TH17_VS_NAIVE_CD4_TCELL_UP | Immunity. 2009 Jan 16; 30(1):155–67 | GEO: GSE14308 |
| TFH_CHTANOVA | J Immunol. 2004; 173:68–78. | N/A |
| AITL_VS_PTCL_NOS | Blood. 2007; 109:4952–4963 | N/A |
| EPPERT_HSC_R | Nat Med. 2011, 17(9):1086–93. | N/A |
| EPPERT_CE_HSC_LSC | Nat Med. 2011, 17(9):1086–93. | N/A |
|
Experimental models: Organisms/strains | ||
| Mouse: Vav1WT/co–Vav1-myo1f | This manuscript | N/A |
| Mouse: Rhoaco–G17V/+ | Cancer Cell, 2018, 33(2):259–273.e7 | N/A |
| Mouse: Tg(Cd4-cre/ERT2)11Gnri | Jackson Labs | Stock No: 022,356 |
| Mouse: B6.Cg-Tg(Cd4-cre)1Cwi/BfluJ | Jackson Labs | Stock No: 017,336 |
| Mouse: B6.Cg-Tg(TcraTcrb)425Cbn/J | Jackson Labs | Stock No: 004,194 |
| Mouse: Ly5.1+ (CD45.1) C57BL/6 | Jackson Labs | Stock No: 002,014 |
| Mouse: Tet2fl/fl | Cancer Cell. 2011; 20:25–38 | N/A |
| Mouse: B6.Cg-Rag2tm1.1Cgn/J | Jackson Labs | Stock No: 008,449 |
| Mouse: Vav1WT/co–Vav1-myo1f | This manuscript | N/A |
|
Oligonucleotides | ||
| Vav1_Fw CCGGATCACAGAGAAGAAGG | This manuscript | N/A |
| Vav1_Rv ATGGCTCTCCTCTCAGGTTC | This manuscript | N/A |
| Vav1-Myo1F_Rv ATTCAAACCTCTGGGAGGCC | This manuscript | N/A |
|
Software and algorithms | ||
| FlowJo software | https://www.flowjo.com/solutions/flowjo | N/A |
| Cuffquant | http://cole-trapnell-lab.github.io/cufflinks/ | N/A |
| JavaGSEA | http://software.broadinstitute.org/gsea/index.jsp | N/A |
| R | https://www.r-project.org/ | N/A |
| Aperio ImageScope Software | Leica Biosystems | N/A |
| Prism software v6.0 | https://www.graphpad.com/scientific-software/prism/ | N/A |