Abstract
For white light-emitting diode (LED) applications, semiconductor quantum dots (QDs) have been widely utilized as efficient down-converters to change the blue color of the light source into different emission colors. Because QDs offer spectral tunability over the entire visible light range, as well as improved color purity, they have rapidly replaced conventional phosphor-based white LEDs. However, for the sustainable growth of QD-mediated LEDs, the amount of QDs required must be reduced by enhancing the color-conversion efficiency. For this purpose, we prepared poly(lauryl methacrylate) (PLMA) composite films by the photo-crosslinking polymerization of lauryl methacrylate monomers in the presence of Au@Ag@SiO2 nanoparticles (NPs) and InP@ZnS QDs. In the PLMA composites, the Au@Ag NPs not only amplified the blue light source but also modified the relaxation of the excited QDs via localized surface plasmon resonance. This resulted in a maximum 12.9-fold enhancement in the QD fluorescence. Because the blue light source in this study can be easily replaced by blue LEDs, the enhanced efficiency of QD emissions via the plasmonic effect could potentially increase the performance of QDs for display applications.
Poly(lauryl methacrylate) films containing Au@Ag@SiO2 nanoparticles and InP@ZnS quantum dots were prepared to investigate metal-enhanced fluorescence in polymer composites.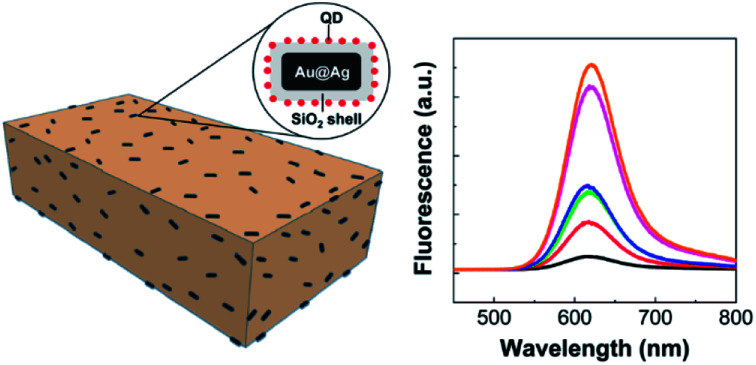
Introduction
Semiconductor quantum dots (QDs) have attracted a great deal of attention in optical, optoelectrical, imaging, and biological applications because they have fascinating materials properties.1–4 For instance, the fluorescence properties of given QDs can be precisely engineered, not only by changing the chemical composition but also by changing the size and shape of the QDs. Therefore, QDs of different sizes can be excited by a single excitation source to produce the whole range of visible light, making them promising materials for display applications.1,2,5–10 Many efforts have been undertaken to utilize QDs to prepare white light-emitting diodes (LEDs), particularly for use as liquid crystal display (LCD) backlights.5–10 Conventionally, white LED backlights have been fabricated based on down-conversion by coating yellow phosphors (cerium-doped yttrium aluminum garnet) on blue LEDs.5,7 However, the pale white color produced by the combination of the broad yellow and blue spectra typically has a narrow color gamut, which cannot be used to express high-quality and vivid colors. To expand the color gamut of white LEDs, one may introduce two different (such as green and red) phosphors, instead of a yellow phosphor, on blue LEDs.5,7,11,12 However, the color purity of these phosphors is typically low, and the direct excitation of red phosphors by blue LED light would be inefficient. Alternatively, each blue, green, and red light can be independently operated by discrete LED chips, although this increases circuit complexity, as well as manufacturing costs.5,7
Thus, QDs have been highlighted as efficient color converters for white LEDs owing to their high color purity, high quantum yield, and long-term stability.1,2,5–11 In addition, the device configuration for QD-assisted color conversion is simple. Briefly, one can produce high-quality white light by introducing a polymer composite with green- and red-emitting QDs onto blue LEDs. Despite these advantages, however, there are still several issues that must be addressed for the sustainable growth of QD-mediated white LEDs. (a) Because of the toxicity of group II–VI semiconductor materials, such as CdSe and CdTe, heavy metal-free QDs must be developed, (b) the QDs must be homogenously dispersed inside the polymer matrix without phase separation and agglomeration, and (c) the number of required QDs, which is especially high for large screen applications, should be minimized. In this regard, many research groups have studied the synthesis of heavy metal-free QDs with sufficient optical property to compete with Cd-based QDs.13–15 To obtain a homogenous QD dispersion, which is challenging because the direct blending of polymers and QDs often results in phase separation because of their incompatibility, polymerization in the presence of monomers and QDs can be carried out.8,16 To achieve a better dispersion, the surface of QDs has been modified with monomer-containing units for random polymerization with monomers.17,18 Unlike the above issues, however, the problem associated with the large quantity of QDs required has not yet been addressed. In principle, the number of required QDs can be reduced by enhancing the fluorescence efficiency (i.e., the number of photons emitted per number of photons absorbed). However, the quantum yield of QDs has already reached high values (>95% for Cd-based QDs, >80% for Cd-free QDs).13–15 Therefore, the development of new synthetic methods that can increase the quantum yield of QDs would only partially solve this problem.
In this regard, metal nanoparticles (NPs), which show localized surface plasmon resonance (LSPR), could be an interesting choice for the purpose. LSPR is a collective oscillation of free electrons in metal NPs and can be excited by incident light at the resonant condition.19–21 Owing to the LSPR, metal NPs can strongly absorb and scatter incident light at the resonant wavelength, which creates a strong and local electromagnetic field around the NP surface.19–26 Therefore, by placing QDs in the vicinity of metal NPs, the inherent excitation and relaxation processes of QDs could be significantly modified to enhance the fluorescence intensity.22–26 This process is relevant to the solution of the above problem. However, to engineer QD–NP interactions for enhanced fluorescence, several experimental parameters such as extinction properties of the metal NPs, QD–NP spectral overlap, and QD–NP distance must be carefully engineered.22–29
In this study, we prepared poly(lauryl methacrylate) (PLMA) composite films containing both metal NPs and QDs to demonstrate metal-enhanced QD emission by blue excitation. It needs to be noted that, even though metal NPs have been previously introduced to optoelectronic devices such as LEDs and solar cells to enhance device performance,30–32 the application of metal NPs in reducing the usage of environmentally unfavorable QDs has not yet been discussed as far as our knowledge concerned. In order to explore this opportunity, one needs to carefully examine the spectral properties and the mutual distance of QDs and NPs, which necessitates delicate experimental controls on the synthesis and surface modification of given NPs and QDs. Here, we selected heavy-metal-free InP@ZnS core–shell QDs as an alternative to the toxic Cd-based QDs, and the Au@Ag@SiO2 core–shell NPs for LSPR effect. While the synthesis and surface modification of Au@Ag@SiO2 core–shell NPs relied on numerous synthetic procedures, the fine structure of Au@Ag@SiO2 NPs with tunable extinction properties was suitable as model NPs in addressing QD–NP interaction. As will be discussed, the spectral property is important for the excitation and emission enhancement of QDs by metal NPs. Subsequently, polymer composite films were prepared by the photo-crosslinking polymerization of lauryl methacrylate monomers in the presence of Au@Ag@SiO2 NPs and InP@ZnS QDs. The films were optically transparent, indicative of the homogenous dispersion of the QDs and NPs in the PLMA matrix. By using the PLMA composite films, we explored the LSPR-enhanced QD emissions on blue-light excitation (442 nm).
Experimental section
Materials
Hydrogen tetrachloroaurate trihydrate (HAuCl4·3H2O), l-ascorbic acid (BioUltra, ≥99.5%), silver nitrate (AgNO3 ≥99%), sodium borohydride (NaBH4, 99%), hexadecyltrimethylammonium bromide (CTAB, ≥99%), hexadecyltrimethylammonium chloride (CTAC, ≥98%), (3-mercaptopropyl)trimethoxysilane (MPTMS, 95%), trimethoxy(octadecyl)silane (ODTMS, 90%), (3-aminopropyl)trimethoxysilane (APTMS, 97%), sodium silicate (Na2O(SiO2)x·xH2O), ammonium hydroxide solution (28% NH3 in H2O), lauryl methacrylate, ethylene glycol dimethacrylate (EGDM), diphenyl(2,4,6-trimethylbenzoyl)phosphine oxide, and hydrochloric acid (HCl, 37% in H2O) were purchased from Sigma-Aldrich. Sodium oleate (NaOL, >97%) was purchased from TCI. InP@ZnS quantum dots dispersed in chloroform were purchased from QD Solution Inc. All chemicals were used as received without further purification.
Synthesis of various metal nanoparticles
Au nanorods (NRs) were synthesized by seed-mediated growth methods with a minor modification to the literature procedure.33 First, Au seeds were prepared by injecting freshly prepared NaBH4 (0.01 M, 0.6 mL) into a solution of HAuCl4 (0.01 M, 0.25 mL) and CTAB (0.1 M, 9.75 mL). The seed solution with a brownish-yellow color was aged at room temperature for more than 4 h before use. To synthesize the Au NRs, a growth solution was first prepared by dissolving CTAB (0.56 g) and NaOL (0.09872 g) in 40 mL of deionized water. Then, 2 mL of HAuCl4 (0.01 M) and 0.6 mL of AgNO3 (0.01 M) were added to the mixture with mild stirring. While stirring, the solution became colorless, typically after 90 min. Next, 0.8 mL of HCl (0.1 M) was added to the mixture. After an additional 10 min stirring, 0.07 mL of ascorbic acid (0.1 M) was added to the mixture with vigorous stirring, and this mixture was used as the growth solution. Finally, different amounts of the seed solution (0.1–1.6 mL) were added to the above-prepared growth solution. The reaction mixture was briefly stirred for 30 s and then aged for 12 h in a water bath at 30 °C. The resulting solution was purified by centrifugation (7000 rpm, 30 min), and the precipitated Au NRs were re-dispersed in the CTAC solution (0.08 M, 40 mL). This centrifugation–redispersion process was repeated twice.
The synthesis of Au@Ag core–shell nanoparticles (NPs) was conducted according to the literature.34 Briefly, 0.5 mL of ascorbic acid (0.1 M) and 2.0 mL (or 4.0 mL) of AgNO3 (0.01 M) were added to 10 mL of Au NRs in the CTAC solution. The mixture was allowed to react for 3 h at 80 °C. The resulting solution was purified by centrifugation (7000 rpm, 30 min), and the precipitated Au@Ag core–shell NPs were re-dispersed in deionized H2O (40 mL).
To prepare the silica shell on the prepared Au@Ag NPs, 3 mL of ethanol and 12 μL of MPTMS were injected into the solution of Au@Ag NPs (40 mL) with stirring.35 After 30 min stirring, 5 μL of sodium silicate was additionally added to the solution, and the mixture was stirred for 24 h. The resulting solution was purified by centrifugation (6000 rpm, 10 min), and the precipitated Au@Ag@SiO2 NPs were re-dispersed into 40 mL of ethanol. For the surface modification, 0.1 mL of NH3 (28%) was added to the 10 mL of ethanol solution of Au@Ag@SiO2 NPs. After a short period of stirring, 0.025 mL of APTMS and 0.025 mL of ODTMS were added to the solution.35 The reaction mixture was stirred for 24 h and then centrifuged at 6000 rpm for 10 min. The precipitates of Au@Ag@SiO2 NPs with alkyl and –NH2 groups were re-dispersed in chloroform.
Preparation of PLMA composites with Au@Ag@SiO2 NPs and QDs
PLMA composites were prepared by the reported method with slight modifications.16 InP@ZnS QDs (20 mg mL−1, 0.1 mL) and Au@Ag@SiO2 NPs (0.1–0.5 mL) were added to different amounts of chloroform, and the solution was stirred for at least 2 h. In this step, the total volume of the mixtures was fixed at 3 mL by changing the volume of added chloroform. To the 3 mL chloroform solution, 2 mL of lauryl methacrylate (monomer) and 0.01 g of diphenyl(2,4,6-trimethylbenzoyl)phosphine oxide (photo-initiator) was added. The reaction mixture was briefly sonicated, stirred (for 30 min), and vacuum-evaporated at room temperature to remove the chloroform. Then, 0.35 g of ethylene glycol dimethacrylate (crosslinking agent) was added to the mixture. The reaction mixture was transferred between two glass slides (2.5 cm × 2.5 cm), which were then carefully sealed with adhesive tape. The glass slides with the reaction mixture was placed inside a UV chamber (UVACUBE 100, Hönle UV technology) and illuminated with UV light for 10 min for polymerization.
Characterization
UV-Vis spectra were measured using a Shimadzu (UV-2550) spectrometer. Steady-state fluorescence spectra were recorded using an Acton SpectraPro equipped with a He–Cd laser as an excitation source (excitation wavelength = 442 nm). Time-resolved fluorescence was measured using a time-correlated single photon counting (TSCPC) system from Horiba Jobin Yvon spectrometer (iHR320) coupled to a R928 Hamamatsu photomultiplier (FL-1073). The apparatus was equipped with a pulsed laser diode source (NanoLED) operating at 1 MHz and with excitation centered at 452 nm. Analysis of the fluorescence decay profiles was performed with the Horiba DAS6 software. Transmission electron microscopy (TEM) was carried out on a Hitachi 7600 TEM operating at 100 kV.
Results and discussion
Before preparing the PLMA composite films, we first focused on the synthesis and analysis of the InP@ZnS QDs and Au@Ag@SiO2 core–shell NPs. Because InP QDs are considered promising replacements for the toxic Cd-based QDs for display applications,5,14,15 ZnS shell-coated InP QDs, which show substantially enhanced stability and fluorescence compared to InP QDs, were chosen for use in this study. As shown in the TEM image (Fig. 1a), the InP@ZnS QDs have spherical shape. In addition, the distribution of QD diameters was obtained by analyzing more than 100 QDs in the TEM image (Fig. 1b). From the histogram, the average diameter of QDs was determined as ca. 3.5 nm after fitting the result with Gaussian function. The fluorescence wavelength of the QDs can be engineered by changing their size, and we selected QDs having fluorescence maximum at 630 nm (solid line, Fig. 1c). The absorption spectrum of the QDs showed the first excitonic peak at around 590 nm (dashed line, Fig. 1c).
Fig. 1. (a) TEM images of the QDs. (b) Histogram of the distribution of QD diameter. (c) UV-Vis (dashed line) and fluorescence (solid line) spectra of QDs. The excitation wavelength was 442 nm.
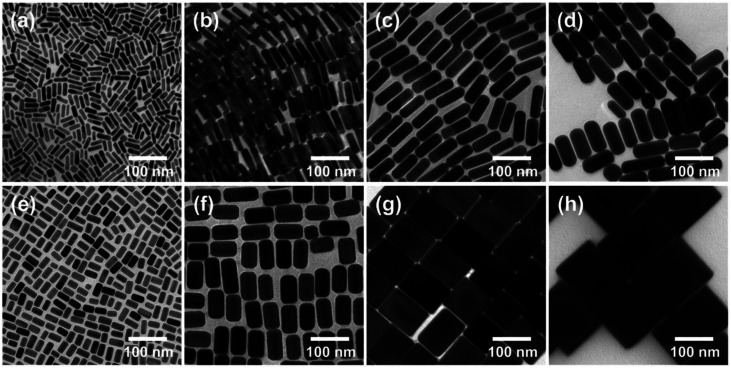
As a counterpart for the QDs, we synthesized Au@Ag core–shell NPs because the extinction spectra of the Au@Ag NPs cover most of the visible spectrum. This extinction property is very useful for LSPR-coupled QD fluorescence in terms of excitation and emission enhancements, which will be discussed later. First, we synthesized Au nanorods (NRs) by a seed-mediated growth method in the presence of binary surfactant mixtures (see Experimental for details). In this method, since the seeds act as nucleation sites for the growth of Au NRs, the aspect ratio of the Au NRs can be controlled by the amount of seed NPs. In particular, it has been reported that the decrease in the volume of seed solution resulted in an increase in both length and diameter of Au NRs.33 Therefore, we adjusted the volume of the seed solution in the reaction mixture without changing the other experimental parameters. As confirmed from the TEM images in Fig. 2a–d, the synthesized Au NRs were very uniform in size and shape. Noticeably, both the diameter and length of the Au NRs gradually increased with reducing volume of seed solution, as shown in Fig. 2a–d. More specifically, the diameter and length of each NR were determined to be 11 and 39 nm, respectively, from Fig. 2a (volume of seed solution = 1.6 mL), 18 and 58 nm, respectively, from Fig. 2b (seed solution = 0.8 mL), 29 and 80 nm, respectively, from Fig. 2c (seed solution = 0.4 mL), and 38 and 89 nm, respectively, from Fig. 2d (seed solution = 0.1 mL). Accordingly, the aspect ratios of the NRs gradually decreased in the order 3.5, 3.2, 2.8, and 2.3, respectively.
Fig. 2. TEM images of Au NRs (a–d) and Au@Ag core–shell NPs (e–h) having different physical dimensions. For the synthesis of the Au NRs, the volume of the seed solution was adjusted to 1.6 (a), 0.8 (b), 0.4 (c), and 0.1 mL (d). For the synthesis of the Au@Ag core–shell NPs, the volume of the AgNO3 solution was adjusted to 2.0 (e and f) and 4.0 mL (g and h), respectively.
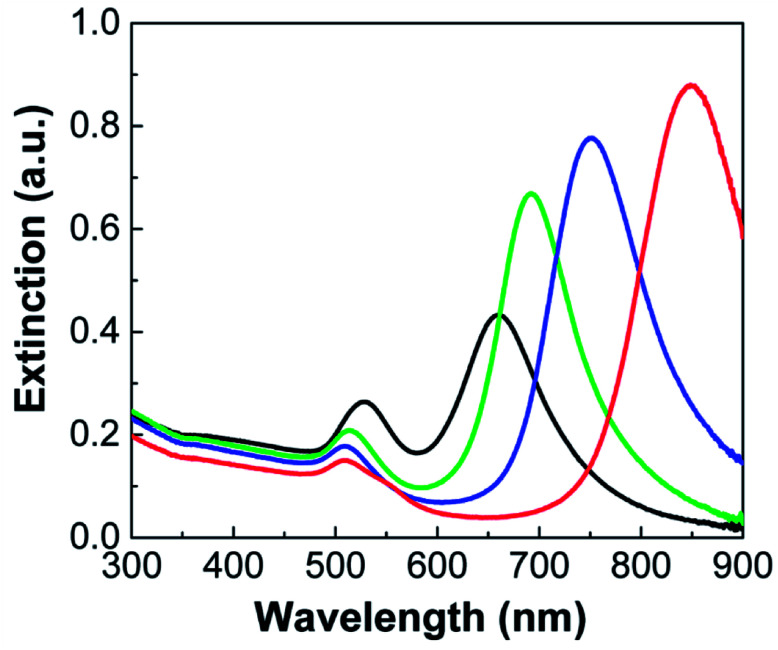
The extinction spectra of the Au NRs are shown in Fig. 3. All the NRs exhibited two LSPR peaks, each of which corresponds to the collective oscillation of free electrons in the transverse (width) and longitudinal (length) directions. For instance, Au NRs with an aspect ratio of 3.5 (Fig. 2a) exhibited transverse and longitudinal LSPR peaks at ca. 510 and 850 nm, respectively (red line in Fig. 3). As the aspect ratio of Au NRs decreased, the corresponding longitudinal peaks gradually shifted toward shorter wavelengths, having values of 750 (blue line), 692 (green line), and 660 nm (black line), each of which correspond to Au NRs with aspect ratios of 3.2, 2.8, and 2.3, respectively. On the other hand, the transverse peak more or less maintained its position, although there was a slight red-shift to 528 nm (black line) with increasing NR diameter.
Fig. 3. Extinction spectra of Au nanorods shown in Fig. 2a–d. Au NRs with different aspect ratios are depicted by different colors: 3.5 (red), 3.2 (blue), 2.8 (green), and 2.3 (black).
After confirming the synthesis of the Au NRs, we prepared the Ag shell on the Au NRs. Here, note that the resulting anisotropic Au@Ag core–shell NPs were expected to exhibit the LSPR properties of Ag without a contribution from Au.34,36 Nevertheless, the Au NRs are necessary for the synthesis of anisotropic Ag, acting as a support to ensure the size and shape uniformity of the anisotropic Ag NPs. The Au@Ag core–shell NPs were synthesized by adding ascorbic acid and AgNO3 to the Au NRs in CTAC solution (see Experimental). In our experiments, the volumes of the AgNO3 solution was adjusted to 4.0 and 2.0 mL to control the thickness of the Ag coating on the Au NRs. As shown in Fig. 2e–h, the synthesis of the Au@Ag core–shell NPs was confirmed by the presence of a relatively transparent Ag shell on the Au NR core. In addition, the growth of the Ag shell was not isotropic, and the Ag shells on the sides of the Au NRs were thicker than those at the end. Therefore, it can be expected that the addition of a greater quantity of AgNO3 solution increased the diameter of Au@Ag NPs rather than the length, resulting in the observed structural changes. For this reason, when the volume of AgNO3 solution was relatively small (i.e., 2.0 mL), the Au@Ag core–shell NPs had a rod-like structure (Fig. 2e and f). However, the increase in the volume of AgNO3 solution to 4.0 mL changed the structure of the Au@Ag core–shell NPs, and they became cube-like (Fig. 2g and h). The thicknesses of the Ag shells on the sides and ends of the Au NRs were approximately found to be 4.5 and 1.3 nm (Fig. 2e, will be denoted Au@Ag(1) NPs), 12.5 and 4.3 nm (Fig. 2f, denoted Au@Ag(2) NPs), 25.6 and 14.3 nm (Fig. 2g, denoted Au@Ag(3) NPs), and 36.0 and 26.5 nm (Fig. 2h, denoted Au@Ag(4) NPs), respectively.
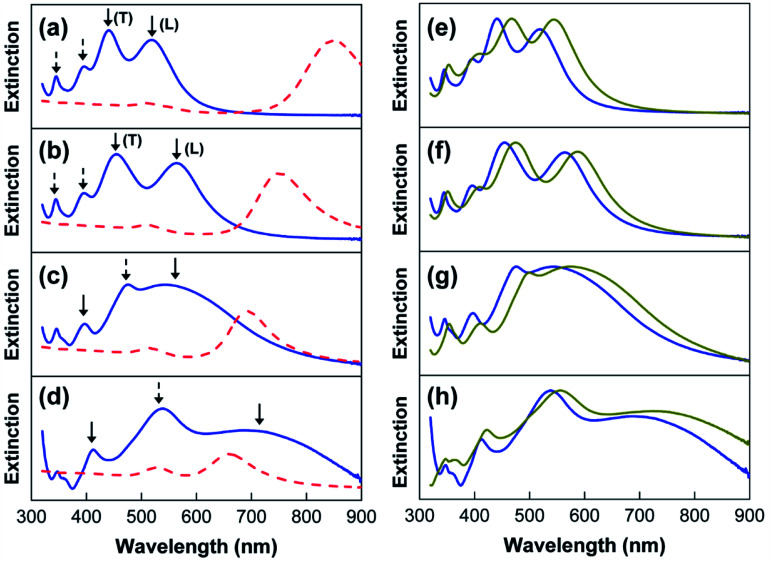
The extinction spectra of the Au@Ag core–shell NPs are shown in Fig. 4a–d. For the rod-like Au@Ag(1) NPs and Au@Ag(2) NPs, the extinction spectra contain four LSPR peaks in a shorter wavelength region (blue solid lines in Fig. 4a and b) than those in the spectrum of the Au NRs before Ag coating (red dashed line). It has been previous reported that the contribution of Au NRs to the plasmonic bands of Au@Ag NPs can be completely screened the presence of the Ag shell.36 Therefore, the four LSPR peaks in Fig. 4a and b can be mostly attributed to anisotropic silver. Based on the literature, the two peaks indicated by solid arrows can be assigned to transverse (T) and longitudinal (L) dipolar plasmon modes, whereas the other two peaks with dashed arrows can be assigned to multipolar modes.36 Similarly, cube-like Au@Ag(3) NPs and Au@Ag(4) NPs also exhibited multiple LSPR peaks of Ag (blue line in Fig. 4c and d), which would be assigned to dipolar (solid lines) and multipolar (dashed line) resonance modes.37 Here, it needs to be noted that the intensities of the LSPR peaks of Au NRs and Au@Ag core–shell NPs are not comparable. In Fig. 4, we normalized the extinction spectra of Au@Ag core–shell NPs because the intensity increased rapidly over the period of synthesis and exceeded the detection limit.
Fig. 4. (a–d) Extinction spectra of the Au@Ag core–shell NPs (blue solid line) and Au NRs (red dashed line) shown in Fig. 2. (e–h) Extinction spectra of Au@Ag@SiO2 NPs (dark yellow line) and Au@Ag NPs (blue solid line).
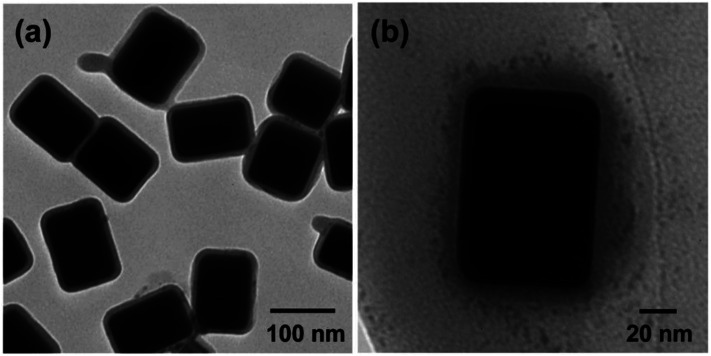
The presence of multiple LSPR peaks would be quite useful for fluorescence enhancement; the plasmonic peak in the blue region can be utilized to enhance the incident light (i.e., excitation enhancement), whereas the peaks in the red regions can increase the radiative decay rates of the QDs, thus inducing the emission enhancement. However, the direct application of Au@Ag core–shell NPs to enhance QD fluorescence is not possible in this state because the CTAC-stabilized Au@Ag NPs, which have a positive surface charge, cannot be introduced to the QD dispersion in chloroform. To increase the solubility of Au@Ag NPs in chloroform, as well as the interactions with the non-polar QDs, a two-step surface modification was conducted as follows. First, we deposited the silica shell on the Au@Ag NRs by the reaction with MPTMS. As shown in Fig. 4e–h, the multiple LSPR peaks of the different-sized Au@Ag NPs (blue colors) were red-shifted after silica-coating on their surface (dark yellow colors). Because the extinction wavelength of the metal NPs is proportional to the refractive index of the surrounding medium, the red-shifted LSPR peaks are indicative of the formation of a SiO2 shell on the Au@Ag NPs. The uniform coating of SiO2 was further confirmed by TEM analysis. For instance, a SiO2 shell with a thickness of ca. 8 nm is clearly discernible in the images of the Au@Ag(4) NPs, as shown by the contrast difference (Fig. 5a). For other Au@Ag NPs, the formation of similar SiO2 shells was verified by TEM (data not shown).
Fig. 5. TEM images of Au@Ag(4)@SiO2 NPs (a) and QD-Au@Ag@SiO2 NP assembly (b). For the assembly, 2.0 mg of InP@ZnS QDs was added to 0.5 mL of Au@Ag(4)@SiO2 NPs in total 3.0 mL of chloroform solution.
Next, the Au@Ag@SiO2 NPs were further reacted with a mixture of ODTMS and APTMS. Note, both ODTMS and APTMS are silane coupling agents, so they introduce alkyl and –NH2 groups onto the surface of the silica shell.35 This allows the dissolution of Au@Ag@SiO2 NPs in chloroform. In addition, –NH2 groups on the silica shell can induce binding interactions with the QDs.35 Therefore, on mixing the QDs and Au@Ag@SiO2 NPs in chloroform, the QDs assembled around the Au@Ag@SiO2 NPs, as shown in Fig. 5b, although unbound QDs were also observed in the background. Here, it needs to be noted that the plasmonic effect of metal NPs rapidly decays with distance from NP surface. In order to induce QD–NP interactions, QDs must to be placed in the vicinity of NP surface. In general, specific plasmon coupling would be expected when QD–NP distance is shorter than ∼30 nm.22,25,28,29 Therefore, the optical properties of the assembled QDs around Au@Ag@SiO2 NPs in Fig. 5b can be influenced by plasmonic effect. In addition, note that, because of the presence of silica shells, the QDs were separated from the surface of NPs by the thickness of the silica. In LSPR-coupled fluorescence, the excited energy of the QDs can be non-radiatively transferred to the metal NPs, thus quenching fluorescence if the QDs approach the surface of the metal NPs (typically below 5 nm).25–27 Therefore, the presence of the silica spacer can prevent this quenching effects and promote the fluorescence enhancement, as discussed later.
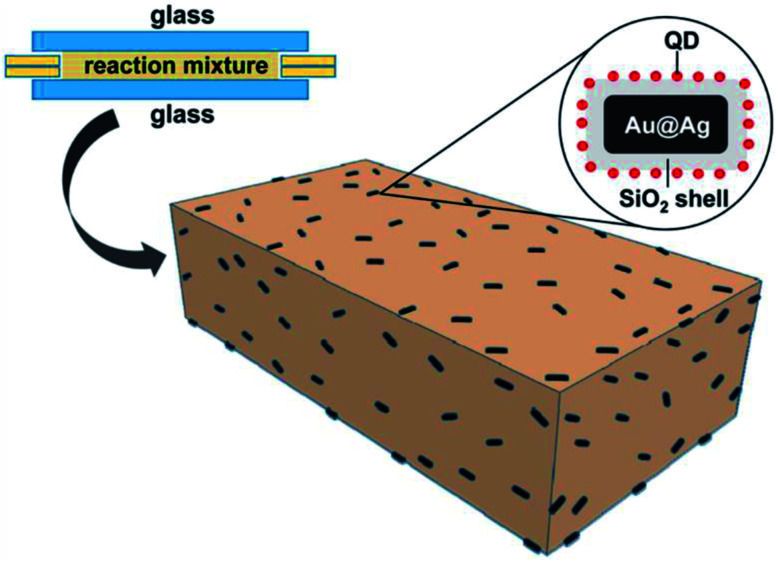
With the aforementioned information, we prepared PLMA composite films with QDs and Au@Ag@SiO2 NPs. To this end, different amounts of Au@Ag@SiO2 NPs (0.1–0.5 mL) were added to a reaction mixture composed of a fixed composition of InP@ZnS QDs, lauryl methacrylate (monomer), diphenyl(2,4,6-trimethylbenzoyl)phosphine oxide (photo-initiator), and ethylene glycol dimethacrylate (crosslinking agent). Then, the reaction mixture was placed between two glass slides with fixed dimensions. The glass slides were then illuminated with UV light for photo-crosslinking polymerization. After polymerization, the PLMA composite films containing QDs and Au@Ag@SiO2 NPs were removed from the glass slides and used for measurements (see Scheme 1).
Scheme 1. Schematic illustration of fabrication of the composite PLMA films consisting of QDs and Au@Ag@SiO2 NPs.
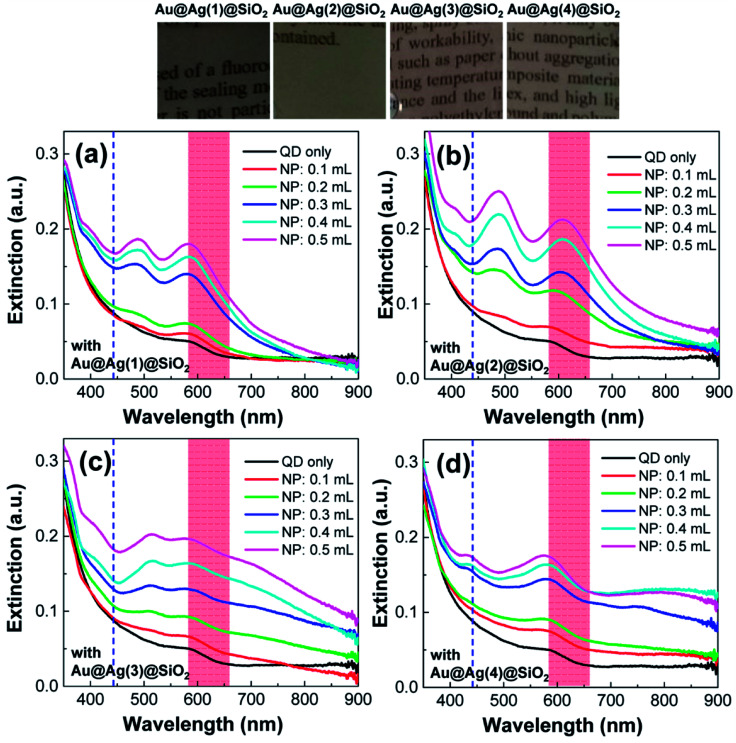
In the UV-Vis spectra, the PLMA films containing QDs but without NPs mainly exhibited the first excitonic peak of the QDs (black solid line in Fig. 6). After the addition of the Au@Ag@SiO2 NPs into the PLMA films, characteristic dipolar and multipolar LSPR peaks appeared and grew in a dose-dependent manner. The shapes of the LSPR peaks are comparable with those obtained in Fig. 4, but their positions are red-shifted after embedding in the polymer films. The baselines of the extinction spectra are more or less maintained in Fig. 6a and b, but they increased with increasing amount of Au@Ag@SiO2 NPs in Fig. 6c and d. This could be attributed to the stronger scattering properties of the larger Au@Ag@SiO2 NPs in the longer wavelength direction (Fig. 4). Also note, if there were strong interaction between lauryl methacrylate monomers and QDs (or NPs), noticeable agglomeration should occur with dramatic change in the extinction spectra. However, the prepared composite films were optically transparent with maintaining the spectral features of QDs and NPs, which indicated no specific monomer-QD (and NP) interaction. Hence, the arrangement of QDs and Au@Ag@SiO2 NPs in the composite films would be comparable with that in a solution state. Before measuring fluorescence spectra, to verify the spectral overlap in our system, we included the wavelength of the incident laser (442 nm, blue dashed line) and QD fluorescence (based on the full width at half maximum, red colored area) in Fig. 6. The wavelength of the incident laser was positioned in the valley of the LSPR peaks, and the QD fluorescence strongly overlaps with the LSPR peak of the Au@Ag@SiO2 NPs.
Fig. 6. Extinction spectra of the composite PLMA films consisting of QDs and Au@Ag@SiO2 NPs. The volume of Au@Ag@SiO2 NPs was adjusted to 0.1–0.5 mL. The photos correspond to the composite PLMA films prepared with 0.5 mL of Au@Ag@SiO2 NPs.
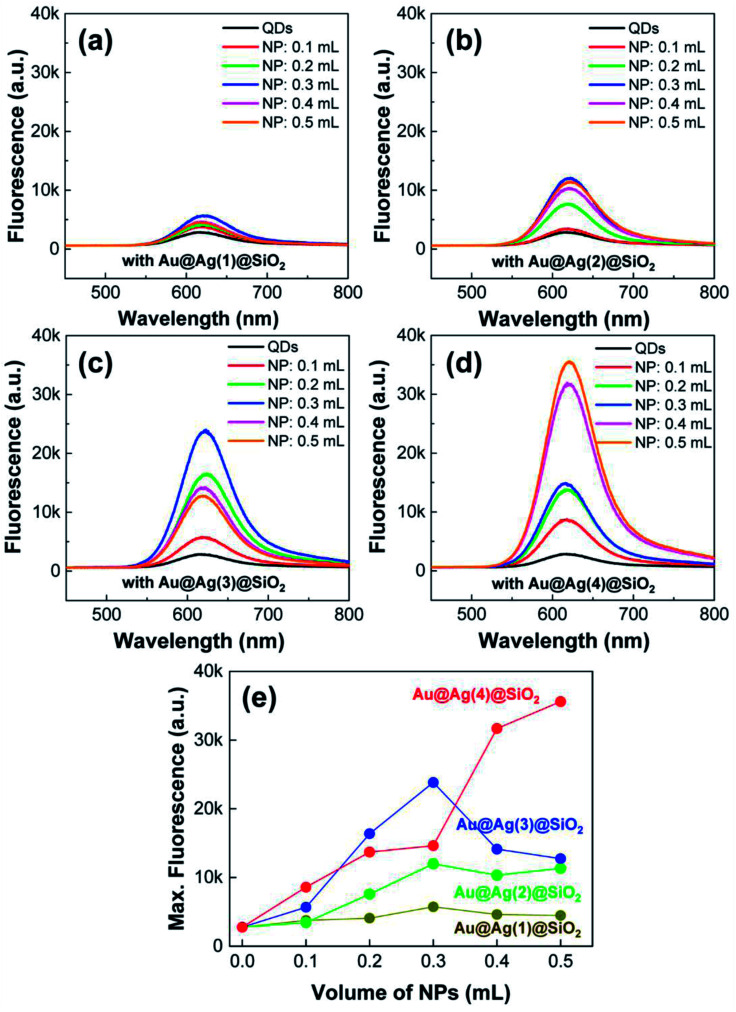
With the PLMA composites, we explored the LSPR-enhanced QD fluorescence. Here, it needs to be noted that the concentration QDs was fixed in the polymer composite, but the amount of Au@Ag@SiO2 NPs was adjusted (0.1–0.5 mL), as in the previous cases. The excitation wavelength was fixed as 442 nm for all measurements. As shown in Fig. 7, the fluorescence spectra of all the composites were strongly influenced by the introduction of metal NPs. In the absence of Au@Ag@SiO2 NPs, the PLMA composite film with only QDs exhibited very weak fluorescence (black solid lines in Fig. 7a–d). After the addition of Au@Ag@SiO2 NPs, the fluorescence intensities of all the composites strongly increased, becoming saturated at high-dose conditions. For a better comparison, we plotted the maximum fluorescence intensities from each composite film as a function of the volume of Au@Ag@SiO2 NPs (Fig. 7e). As the Au@Ag@SiO2 NPs increased in size, the QD fluorescence increased correspondingly. We observed maximum 2.1-, 4.3-, 8.6-, and 12.9-fold fluorescence enhancements in the PLMA composites with Au@Ag(1)@SiO2 NPs, Au@Ag(2)@SiO2 NPs, Au@Ag(3)@SiO2 NPs, and Au@Ag(4)@SiO2 NPs, respectively.
Fig. 7. (a–d) Fluorescence spectra of composite PLMA films consisting of QDs and Au@Ag@SiO2 NPs. The volume of the Au@Ag@SiO2 NPs was adjusted to 0.1–0.5 mL. (e) Maximum fluorescence intensities of the composite PLMA films with different amounts of Au@Ag@SiO2 NPs.
The enhanced fluorescence can be understood by the extinction properties of Au@Ag@SiO2 NPs and their spectral overlap with QD fluorescence. First, the incident laser (442 nm) can excite the LSPR of the Au@Ag@SiO2 NPs. Even though the wavelength of the incident laser was placed in the valley of the two LSPR peaks (Fig. 6), there is still substantial amount of extinction at 442 nm. Hence, the metal NPs can absorb and scatter the incident laser to create strong local electromagnetic field around the NP surface.21–25 At the same time, the QDs were found to have a strong binding affinity with –NH2 ligands on Au@Ag@SiO2 NPs in the solution state (Fig. 5b). Similarly, the QDs would tend to assemble with the Au@Ag@SiO2 NPs in the composite films. Therefore, the QDs close to metal NPs would experience the strong local field around the NP surface, which results in the LSPR-mediated excitation enhancement in the PLMA composites. In addition, even for the unbound QDs to Au@Ag@SiO2 NPs, the scattered light from Au@Ag@SiO2 NPs could be re-absorbed by the unbound QDs inside the composite, which could also increase the excitation process.
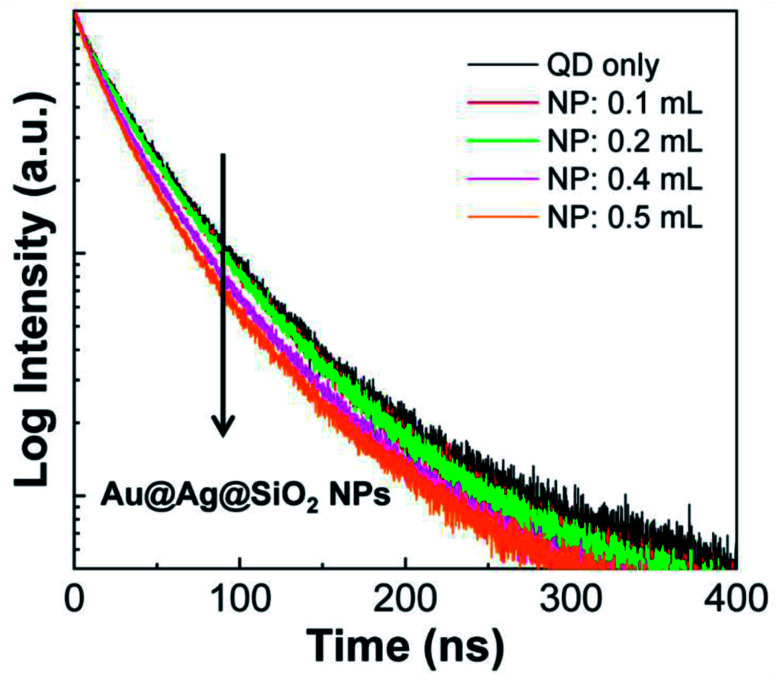
In addition, the QD fluorescence strongly overlaps with the LSPR peak of the metal NPs, so the decay process of the excited QDs can be modified by the plasmonic effect.22–25 To monitor the changes in the decay kinetics, time-resolved fluorescence (TRF) spectra of the PLMA composite films were collected. As a representative case, the composite films with Au@Ag(4)@SiO2 NPs were selected for the study because they showed the strongest QD fluorescence increase in Fig. 7. When being monitored at the peak position of QD fluorescence, the fluorescence decay became faster with the introduction of Au@Ag(4)@SiO2 NPs (Fig. 8). After fitting the TRF spectra to a multi-exponential equation, we found that the average lifetime of the QDs in the PLMA composites gradually shortened in a dose-dependent manner to 54.7 ns (for Au@Ag(4)@SiO2 NPs = 0.0 mL), 53.9 ns (for 0.1 mL), 54.0 ns (for 0.2 mL), 51.1 ns (for 0.4 mL), and 49.7 ns (for 0.5 mL). Note, the lifetime (τ) is the inverse of the sum of radiative decay rate (krad) and non-radiative decay rate (knr), i.e., τ = 1/(krad +knr). Therefore, the shortened lifetimes indicate that either krad or knr is increased by the plasmonic effect. In general, an increase in krad enhances fluorescence, whereas an increase in knr quenches the fluorescence.25 Thus, because we observed a strong fluorescence enhancement, as shown in Fig. 7, the shortened lifetime can be ascribed to the increase in krad. Because the quantum yield (Q) is defined as Q = krad/(krad + knr), the increase in krad indicates the enhanced quantum yield of the QDs induced by the plasmonic effect. This process is termed emission enhancement.
Fig. 8. Time-resolved fluorescence spectra of composite PLMA films consisting of QDs and Au@Ag(4)@SiO2 NPs.
Collectively, the enhanced QD fluorescence can be ascribed to both the excitation and emission enhancement processes. Nevertheless, the degree of lifetime shortening shown in Fig. 8 is not significant, which implies a relatively weak contribution of emission enhancement to the total fluorescence enhancement. Therefore, excitation enhancement can be considered the main source of the fluorescence enhancement. In this regard, it would be worthwhile to note that the extinction (that is, the sum of absorption and scattering) of the metal NPs increases significantly with increasing size of the NPs.21,22 Accordingly, the degree of excitation enhancement would be more substantial for Au@Ag@SiO2 NPs having larger sizes, which further explains the size-dependent fluorescence enhancement shown in Fig. 7. In addition, the saturation of the fluorescence intensity with increasing amount of NPs (Fig. 7e) can be ascribed to the re-absorption of QD-emitted photons by Au@Ag@SiO2 NPs, which is supported by the strong spectral overlap between the QD fluorescence and the LSPR peak.
Conclusions
In this study, we prepared PLMA composite films by the photo-crosslinking polymerization of lauryl methacrylate monomers in the presence of InP@ZnS QDs and Au@Ag@SiO2 NPs. The extinction spectra of the PLMA composites exhibited characteristic dipolar and multipolar plasmonic resonance, which showed spectral overlap with the blue excitation wavelength, as well as QD fluorescence. As a result, excitation and emission enhancement occurred in the PLMA composite to enhance the QD fluorescence to a maximum of 12.9 times the original intensity. Since the plasmonic coupling between QDs and Au@Ag@SiO2 NPs can be further engineered by their mutual distance, systematic control on the thickness of SiO2 shell could further enhance QD fluorescence from the PLMA composite films. It would be worthwhile to note that blue laser light enhanced the QD fluorescence in the red region with the aid of metal NPs. Because the blue light source in this study could be easily replaced by blue LEDs, these results suggest that metal NPs would provide an avenue to enhance the performance of QDs for display application with reduced usage of environmentally unfavorable QDs.
Conflicts of interest
There are no conflicts to declare.
Supplementary Material
Acknowledgments
This work was supported by the BB21+ Project in 2018. This work was supported by the Korea Institute of Energy Technology Evaluation and Planning (KETEP) and the Ministry of Trade, Industry & Energy (MOTIE) of the Republic of Korea (No. 20174010201460).
References
- Pietryga J. M. Park Y.-S. Lim J. Fidler A. F. Bae W. K. Brovelli S. Klimov V. I. Chem. Rev. 2016;116:10513. doi: 10.1021/acs.chemrev.6b00169. [DOI] [PubMed] [Google Scholar]
- Kim J. Y. Voznyy O. Zhitomirsky D. Sargent E. H. Adv. Mater. 2013;25:4986. doi: 10.1002/adma.201301947. [DOI] [PubMed] [Google Scholar]
- Petryayeva E. Algar W. R. Medintz I. L. Appl. Spectrosc. 2013;67:215. doi: 10.1366/12-06948. [DOI] [PubMed] [Google Scholar]
- Gao X. Yang L. Petros J. A. Marshall F. F. Simons J. W. Nie S. Curr. Opin. Biotechnol. 2005;16:63. doi: 10.1016/j.copbio.2004.11.003. [DOI] [PubMed] [Google Scholar]
- Chen H. He J. Wu S.-T. IEEE J. Sel. Top. Quantum Electron. 2017;23:1900611. [Google Scholar]
- Demir H. V. Nizamoglu S. Erdem T. Mutlugun E. Gaponik N. Eychmüller A. Nano Today. 2011;6:532. doi: 10.1016/j.nantod.2011.10.006. [DOI] [Google Scholar]
- Jang E. Jun S. Jang H. Lim J. Kim B. Kim Y. Adv. Mater. 2010;22:3076. doi: 10.1002/adma.201000525. [DOI] [PubMed] [Google Scholar]
- Lee J. Sundar V. C. Heine J. R. Bawendi M. G. Jensen K. F. Adv. Mater. 2000;12:1102. doi: 10.1002/1521-4095(200008)12:15<1102::AID-ADMA1102>3.0.CO;2-J. [DOI] [Google Scholar]
- Wood V. Bulović V. Nano Rev. 2010;1:5202. doi: 10.3402/nano.v1i0.5202. [DOI] [PMC free article] [PubMed] [Google Scholar]
- Jang H. S. Yang H. Kim S. W. Han J. Y. Lee S.-G. Jeon D. Y. Adv. Mater. 2008;20:2696. doi: 10.1002/adma.200702846. [DOI] [PubMed] [Google Scholar]
- Ziegler J. Xu S. Kucur E. Meister F. Batentschuk M. Gindele F. Nann T. Adv. Mater. 2008;20:4068. doi: 10.1002/adma.200800724. [DOI] [Google Scholar]
- Oh J. H. Kang H. Ko M. Do Y. R. Opt. Express. 2015;23:A791. doi: 10.1364/OE.23.00A791. [DOI] [PubMed] [Google Scholar]
- Reiss P. Carrière M. Lincheneau C. Vaure L. Tamang S. Chem. Rev. 2016;116:10731. doi: 10.1021/acs.chemrev.6b00116. [DOI] [PubMed] [Google Scholar]
- Altıntas Y. Talpur M. Y. Ünlü M. Mutlugün E. J. Phys. Chem. C. 2016;120:7885. doi: 10.1021/acs.jpcc.6b01977. [DOI] [Google Scholar]
- Kim S. Kim T. Kang M. Kwak S. K. Yoo T. W. Park L. S. Yang I. Hwang S. Lee J. E. Kim S. K. Kim S.-W. J. Am. Chem. Soc. 2012;134:3804. doi: 10.1021/ja210211z. [DOI] [PubMed] [Google Scholar]
- Bomm J. Büchtemann A. Fiore A. Manna L. Nelson J. H. Hill D. van Sark W. G. J. H. M. Beilstein J. Nanotechnol. 2010;1:94. doi: 10.3762/bjnano.1.11. [DOI] [PMC free article] [PubMed] [Google Scholar]
- Zhang H. Cui Z. Wang Y. Zhang K. Ji X. Lü C. Yang B. Gao M. Adv. Mater. 2003;15:777. doi: 10.1002/adma.200304521. [DOI] [Google Scholar]
- Lesyuk R. Cai B. Reuter U. Gaponik N. Popovych D. Lesnyak V. Small Methods. 2017;1:1700189. doi: 10.1002/smtd.201700189. [DOI] [Google Scholar]
- Rycenga M. Cobley C. M. Zeng J. Li W. Moran C. H. Zhang Q. Qin D. Xia Y. Chem. Rev. 2011;111:3669. doi: 10.1021/cr100275d. [DOI] [PMC free article] [PubMed] [Google Scholar]
- Halas N. J. Lal S. Chang W.-S. Link S. Nordlander P. Chem. Rev. 2011;111:3913. doi: 10.1021/cr200061k. [DOI] [PubMed] [Google Scholar]
- Jain P. K. El-Sayed I. H. El-Sayed M. A. Nano Today. 2007;2:18. doi: 10.1016/S1748-0132(07)70016-6. [DOI] [Google Scholar]
- Lakowicz J. R. Ray K. Chowdhury M. Szmacinski H. Fu Y. Zhang J. Nowaczyk K. Analyst. 2008;133:1308. doi: 10.1039/B802918K. [DOI] [PMC free article] [PubMed] [Google Scholar]
- Munechika K. Chen Y. Tillack A. F. Kulkarni A. P. Plante I. J.-L. Munro A. M. Ginger D. S. Nano Lett. 2011;11:2725. doi: 10.1021/nl2010127. [DOI] [PubMed] [Google Scholar]
- Chen Y. Munechika K. Ginger D. S. Nano Lett. 2007;7:690. doi: 10.1021/nl062795z. [DOI] [PubMed] [Google Scholar]
- Kim K.-S. Kim H. Kim J.-H. Kim J.-H. Lee C.-L. Laquai F. Yoo S. I. Sohn B.-H. J. Mater. Chem. 2012;22:24727. doi: 10.1039/C2JM35156K. [DOI] [Google Scholar]
- Kulakovich O. Strekal N. Yaroshevich A. Maskevich S. Gaponenko S. Nabiev I. Woggon U. Artemyev M. Nano Lett. 2002;2:1449. doi: 10.1021/nl025819k. [DOI] [Google Scholar]
- Singh M. P. Strouse G. F. J. Am. Chem. Soc. 2010;132:9383. doi: 10.1021/ja1022128. [DOI] [PubMed] [Google Scholar]
- Ray K. Badugu R. Lakowicz J. R. Chem. Mater. 2007;19:5902. doi: 10.1021/cm071510w. [DOI] [PMC free article] [PubMed] [Google Scholar]
- Ratchford D. Shafiei F. Kim S. Gray S. K. Li X. Nano Lett. 2011;11:1049. doi: 10.1021/nl103906f. [DOI] [PubMed] [Google Scholar]
- Park H. C. Isnaeni Gong S. Cho Y.-H. Small. 2017;13:1701805. doi: 10.1002/smll.201701805. [DOI] [PubMed] [Google Scholar]
- Liu S. Jiang R. You P. Zhu X. Wang J. Yan F. Energy Environ. Sci. 2016;9:898. doi: 10.1039/C5EE03779D. [DOI] [Google Scholar]
- Baek S.-W. Park G. Noh J. Cho C. Lee C.-H. Seo M.-K. Song H. Lee J.-Y. ACS Nano. 2014;8:3302. doi: 10.1021/nn500222q. [DOI] [PubMed] [Google Scholar]
- Ye X. Zheng C. Chen J. Gao Y. Murray C. B. Nano Lett. 2013;13:765. doi: 10.1021/nl304478h. [DOI] [PubMed] [Google Scholar]
- Okuno Y. Nishioka K. Kiya A. Nakashima N. Ishibashi A. Niidome Y. Nanoscale. 2010;2:1489. doi: 10.1039/C0NR00130A. [DOI] [PubMed] [Google Scholar]
- Liu N. Prall B. S. Klimov V. I. J. Am. Chem. Soc. 2006;128:15362. doi: 10.1021/ja0660296. [DOI] [PubMed] [Google Scholar]
- Jiang R. Chen H. Shao L. Li Q. Wang J. Adv. Mater. 2012;24:OP200. doi: 10.1002/adma.201201896. [DOI] [PubMed] [Google Scholar]
- Zhou F. Li Z.-Y. Liu Y. Xia Y. J. Phys. Chem. C. 2008;112:20233. doi: 10.1021/jp807075f. [DOI] [Google Scholar]


