Abstract
Fe3O4–Ag Janus composites were synthesized using a two-step solvothermal method. The optimal growth process was determined by investigating the relationship between the particle morphologies and reaction time. Magnetic and Raman spectroscopic measurements showed that the as-synthesized Janus composites have both good magnetic response and significant surface-enhanced Raman scattering (SERS) effects, as well as reproducibility. The calculated Raman enhancement factor reached an unprecedented magnitude of 109 compared with the values of other Fe3O4–Ag compounds. Furthermore, the SERS effect was exhibited even at a concentration of probe molecules as low as 10−13 M. This demonstrates that the as-synthesized Fe3O4–Ag Janus composite particles have promise for application as separable, highly sensitive SERS substrates.
Fe3O4–Ag Janus composites were synthesized using a two-step solvothermal method.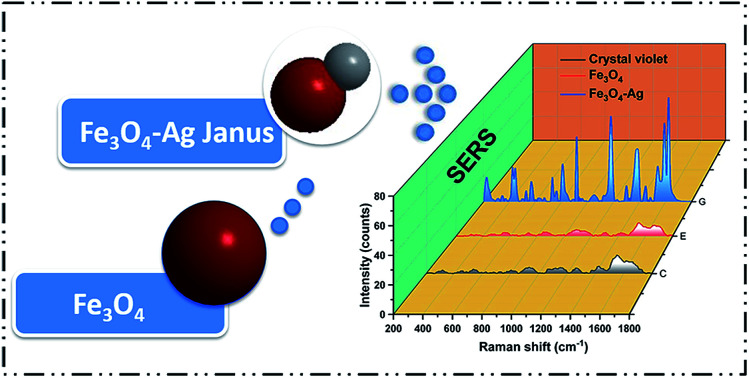
Introduction
Binary or even multicomponent composite materials, especially particles, have always been attractive for scientists because of their versatile structures and unique physical and chemical properties. It is noteworthy that Janus particles,1 as a good example of a binary structure, has drawn the attention of researchers to a large degree.2–9 Janus particles are new kinds of nano or micrometer particles that consist of two semispheres of different chemical groups. Nowadays, the concept of Janus has been developed to produce particles comprising at least two components with different chemistry, functionality, or polarity.10 Through more in-depth studies on Janus particles, a variety of shapes have been developed, such as dumbbell-like, snowman-like, and mushroom-like particle, among others,11 which can be metal–metal, metal-oxide, metal–organic, or organic–organic. Owing to the interesting features of Janus particles, such as a tunable and controllable structure, they can be used in a wide range of applications, such as magnetics, optics, catalysis, and biomedicine.10 Plenty of methods have been explored to synthesize Janus particles. Song et al. used a chemical method to synthesize Fe3O4–Au nanoparticles and successfully realized self-assembly to form two-layered plasmonic–magnetic vesicles, which are able to provide rich information on tumours and also guide cancer therapy.12 Jin et al. also synthesized Fe3O4–Au Janus nanoparticles tuned in the range of 3–12 nm by use of a seed-mediated growth method, which exhibited greatly enhanced catalytic and magnetic properties.13 Delogu used mechanochemical decomposition to obtain Ag–Ni Janus nanoparticles under specific conditions, which provided an interesting synthetic opportunity for nanometer-sized systems.14 Walther et al. assembled an amphiphilic polybutadiene Janus nanoparticle core with two distinctive chains, each of poly(methyl methacrylate/methacrylic acid) and polystyrene, protruding out of it, which allowed adsorption and lateral ordering at the interface.15 Zhang et al. prepared dumbbell-like Fe3O4–Ag composite microspheres in a gel system and showed SERS (surface-enhanced Raman scattering) enhancement, which exhibited good detection performance and high selectivity for thiram, and could be applied for the detection of thiram in aqueous samples.16
Among all of these excellent studies, Fe3O4–Ag Janus composites have attracted great interest from researchers and a solvothermal method is suggested to be a simple way to form a Fe3O4–Ag Janus composite.16 On the one hand, a Fe3O4–Ag Janus composite has a strong SERS effect owing to considerable electromagnetic enhancement,17–22 but on the other hand, it can be easily magnetized because of the ferromagnetism of the Fe3O4 particles. That is to say, it serves as an efficient SERS substrate that can be effectively separated, and collected from solution using an external magnetic field, suggesting that it is able to be fully cleaned and recycled in applications.23–34 Furthermore, the cost is greatly reduced due to quite a lot of the noble metal Ag component being substituted by Fe3O4. Therefore, such Fe3O4–Ag Janus composites are available as separable substrates for SERS to detect residual pesticides in crops and fruits, analyze adsorbed molecules on surfaces, and mark biomolecules such as genes, DNA and proteins.35–41 There is no denying that considerable research efforts have been devoted to Fe3O4–Ag composite materials and SERS activity to detected molecules, using a diverse range of concentrations or kinds of materials, in order to obtain strong SERS signals. However, how to realize high sensitivity effectively in Fe3O4–Ag Janus composites, as well as evaluate their SERS effect accurately, is still a challenge and there are relatively few studies devoted to the determination of the SERS enhancement effect of Fe3O4–Ag Janus composites. Herein, we used a two-step solvothermal method to synthesize Fe3O4–Ag Janus composite particles and obtained the optimal growth process by investigating the relationship between the particle morphologies and reaction time. Subsequently, the SERS effect of the Fe3O4–Ag Janus substrates was determined via the recording of the Raman spectra and detailed calculation of the Raman enhancement factor (EF).42–44 Additionally, a series of various concentrations of probe molecules were prepared in order to certify their sensitivity. Moreover, a few cyclic measurements of the SERS effect were also conducted to show their reproducibility. Consequently, it was validated that such Fe3O4–Ag Janus composites are quite effective, reproducible and highly sensitive for use as SERS substrates.
Experimental
Materials
Hexahydrated ferric chloride (FeCl3·6H2O), sodium acetate (CH3COONa), ethylene glycol (EG), sodium polyacrylate (PAAS), oleic acid (OA), sodium oleate (NaOA), silver nitrate (AgNO3), ethanol, and crystal violet (CV) were purchased from Aladdin. All chemicals were directly used as received without further purification.
Methods
Fe3O4 particles
Fe3O4 particles were synthesized via a solvothermal method.16 In a typical synthesis procedure: FeCl3·6H2O (1.3 g), CH3COONa (3.6 g) and PAAS (0.12 g) were mixed in EG (20 ml). After magnetic stirring for four hours, the above solution mixture was transferred to a Teflon-lined stainless-steel autoclave (50 ml) and then heated at 220 °C for 6 h. The black product was centrifuged and washed several times with ethanol and water, then Fe3O4 particles were obtained after drying and were stored in ethanol.
Fe3O4–Ag Janus composite particles
Were also synthesized via a solvothermal method.16 Firstly, NaOA (0.45 g) and OA (0.6 ml) were dissolved in ethanol (5 ml), and then an aqueous solution of AgNO3 (0.01 g ml−1) was dropped in under magnetic stirring. Then, the as-obtained Fe3O4 particles (50 mg, 10 ml ethanol) were then added into the above solution under ultrasonic dispersion for 30 minutes. Finally, the mixture was transferred into a Teflon-lined stainless-steel autoclaves (50 ml) and heated at 200 °C for 1 h, 6 h, 10 h, and 20 h. The products were centrifuged and washed several times with ethanol and water, then Fe3O4–Ag Janus composite particles were obtained after drying.
Characterization
The morphologies of the as-prepared products were characterized by field-emission scanning electron microscopy (FESEM, JEOL JSM-7000F, Japan) at an acceleration voltage of 15.0 kV and transmission electron microscopy (TEM, JEOL JEM-2100, Japan) at 200 kV. The elemental composition was determined by energy dispersive spectrometer (EDS, JEOL JSM-7000F, Japan). The phases and the crystalline structures were investigated by X-ray diffraction (XRD, XRD-7000, Shimadzu, Japan; CuKα, λ = 0.15418 nm). The X-ray patterns were recorded in the 2θ range from 15° to 80° at a speed of 5° min−1.
Magnetic hysteresis loops
Magnetic properties were measured using a vibrating sample magnetometer (VSM 7403, Lakeshore, USA) at room temperature with an external field of 9 kOe.
SERS measurements
During the SERS tests, samples with the same concentrations (0.01 g ml−1) were firstly dispersed into CV solution in water. Herein, the CV molecules were used as probes for detecting Raman signals and 5 μL of solution was dropped onto a glass slide, forming an area 20 mm in diameter and was dried for use. A substrate sample of pure CV aqueous solution was also prepared as a control. The tests were accomplished using a confocal microscopy Raman Spectrometer (Lab RAM, HR800, France) with a laser beam at an excitation wavelength of 532 nm. The acquisition time was 10 s for each sample in the range of 200 to 1800 cm−1. A scheme showing how to prepare the samples for the SERS tests is shown in Fig. S1 in the ESI.†
Results and discussion
Analysis of the morphology and structure
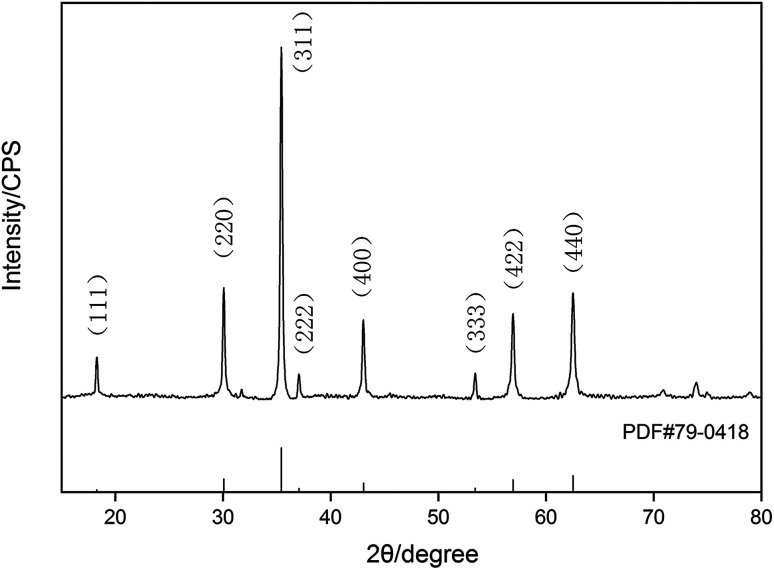
The X-ray diffraction pattern of the Fe3O4 particles is shown in Fig. 1. All of the diffraction peaks, including (111), (220), (311), (222), (400), (333), (422) and (440), can be fully indexed to a magnetite phase (PDF#79-0418). The sharp and strong diffraction peaks confirmed the complete crystallization of the Fe3O4 particles. The average crystallite size, calculated using the Scherrer formula, was 25.7 nm.45
Fig. 1. XRD patterns of Fe3O4.
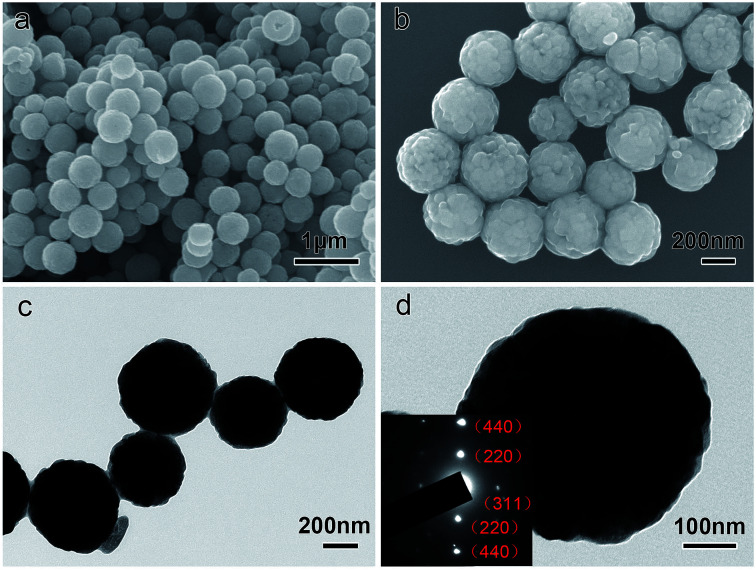
The morphology and size of the as-prepared Fe3O4 particles were investigated by SEM and TEM analysis, as shown in Fig. 2. It can be seen that the Fe3O4 particles have a spherical shape and are monodispersed and uniform on a large scale. The average particle size is about 450 nm in diameter. The granular and uneven surface morphology indicates that the particles have a typical hierarchical structure, in which the primary smaller nanocrystals (20–30 nm) assemble together to form secondary Fe3O4 particles. The inset in Fig. 2d shows the selected area electron diffraction (SAED) pattern. The diffraction spots reveal the single-crystalline nature of the Fe3O4 particles. The composition of the product was determined using energy-dispersive X-ray spectroscopy (EDX, Fig. S2†), which indicated that the Fe : O concentration is very close to the initial stoichiometric 3 : 4 ratio of these two elements.
Fig. 2. (a) and (b) SEM, (c) and (d) TEM and (inset d) SAED images of the Fe3O4 particles.
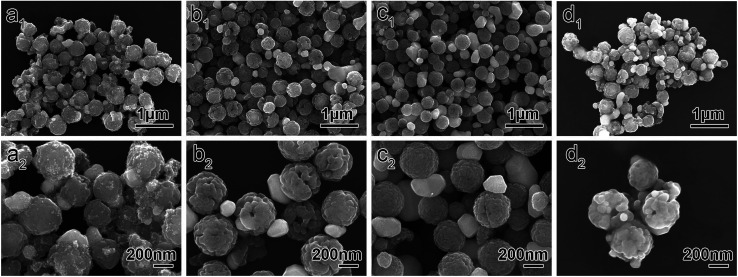
The as-prepared Fe3O4 particles were used as seeds for the subsequent growth of the silver nanoparticles. Fig. 3 shows the SEM images of the Fe3O4–Ag Janus composite particles prepared at different reaction times. As shown in Fig. 3a1 and a2, the Ag nanoparticles (shown in white with the smaller particle size in the SEM images) could be ambiguously observed on the surface of the Fe3O4 (shown in grey with the bigger particle size in the SEM images) when the reaction time was only one hour. However, the size of the Ag nanoparticles was not uniform and a typical Janus structure was hardly obtained. Upon increasing the reaction time to 6 h, as seen in Fig. 3b1 and b2, the size of the Ag particles became uniform and a typical Janus structure began to appear. The more clear-cut Fe3O4–Ag Janus structure can be seen in Fig. S3.† When the reaction time was increased to 10 h, a typical Janus structure was formed to a great extent, in which only one Ag particle attached onto each Fe3O4 particle (Fig. 3c1 and c2). Further increasing the reaction time to 20 h, the particles agglomerated and the Janus structure became inhomogeneous, in which multiple silver nanoparticles were simultaneously attached to the surface of one iron oxide particle, as seen in Fig. 3d1 and d2.
Fig. 3. SEM images of the Fe3O4–Ag Janus composite particles prepared at different reaction times: (a1 and a2) 1 h. (b1 and b2) 6 h. (c1 and c2) 10 h. (d1 and d2) 20 h.
Herein, there are mainly two reasons for forming a Fe3O4–Ag Janus structure. On the one hand, magnetic Fe3O4 particles are homodispersed in the Ag precursor solution by ultrasonic treatment. Fe3O4 particles are thus immobilized in the interior gel system,16 which provides target locations for the formation of Ag nanoparticles and also plays an obvious role in limiting the growth of a single Ag particle on the surface of a single Fe3O4 particle during the reaction process. On the other hand, a lattice match is a critical factor for the formation of Janus structures. There is a large lattice mismatch between the Fe3O4 (fcc, a = 8.40 Å) and Ag (fcc, a = 4.08 Å),46 thus the metal interface is a high-energy interface and a large energy is urgently needed to be overcome for bonding between the two substances. In other words, it is minimization of the total system energy that works, so that it tends to form an asymmetric Janus structure instead of a core/shell structure, which leads to a decrease in the interface energy between Fe3O4 and Ag, thereby reducing the total system energy. Besides this, one Ag nanoparticle grows bigger with the continual Ag reduction in the reaction system.
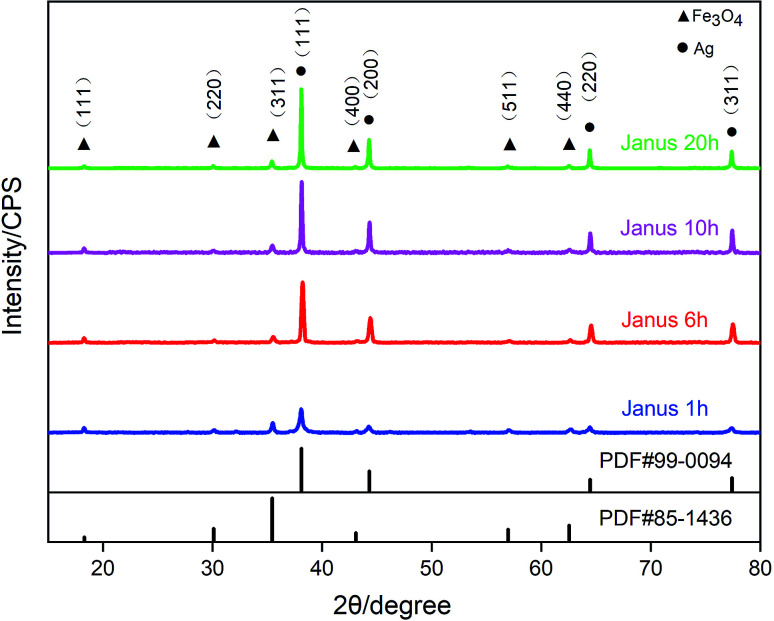
Fig. 4 shows the XRD image of the Fe3O4–Ag Janus composite particles. Two kinds of diffraction peaks can be observed. The peaks at 18.29°, 30.09°, 35.44°, 43.07°, 56.96°, 62.55° can be indexed to the (111), (200), (311), (400), (511), (440) planes of spinel Fe3O4 (PDF#85-1436) and the peaks at 38.11°, 44.29°, 64.44°, 77.39°, corresponding to the (111), (200), (220), (311) planes are characteristic of face-centered cubic Ag (PDF#99-0094). From the XRD patterns, it can also be seen that the proportion and crystallinity of the silver in the composite particles increases upon an increase in the reaction time. The peak intensity of Fe3O4 is rather low compared with that of Ag, which can probably be attributed to the large lattice stress from the interface of Fe3O4–Ag and the low crystallinity.47
Fig. 4. XRD patterns of the Fe3O4–Ag Janus composite.
Fig. 5a and b show typical TEM images of the Fe3O4–Ag Janus composite particles prepared in a reaction time of 10 h. A typical snowman-like Janus asymmetrical structure can be observed, in which Fe3O4 is around 450 nm and Ag is 150 nm. High-resolution transmission electron microscopy (HRTEM) was used to characterize the microstructure of the Janus particles, as shown in Fig. 5c. As marked in the image, the lattice fringe spacing of Fe3O4 was measured to be 0.493 nm (blue line), matching the d values of the (111) plane of a spinel magnetite phase. The lattice fringe spacing of Ag was measured to be 0.247 nm (red line), matching the d values of the (111) plane of a fcc Ag phase. From the image, it can also be seen that the Ag nanoparticles are closely attached on the surface of the Fe3O4 particles. The composition was also confirmed using EDX (Fig. S4†), and the data demonstrate that the Janus composite particles are composed of Ag, Fe and O elements with a desired atomic Ag/Fe/O ratio of about 1.2 : 3 : 4, which is close to the expected ratio for these three elements.
Fig. 5. TEM image of snowman-like Fe3O4–Ag Janus composite particles after a reaction time of 10 h. (a) Low-magnification TEM image. (b) A single Fe3O4–Ag Janus particle. (c) High-resolution transmission electron microscope image.
Magnetic properties
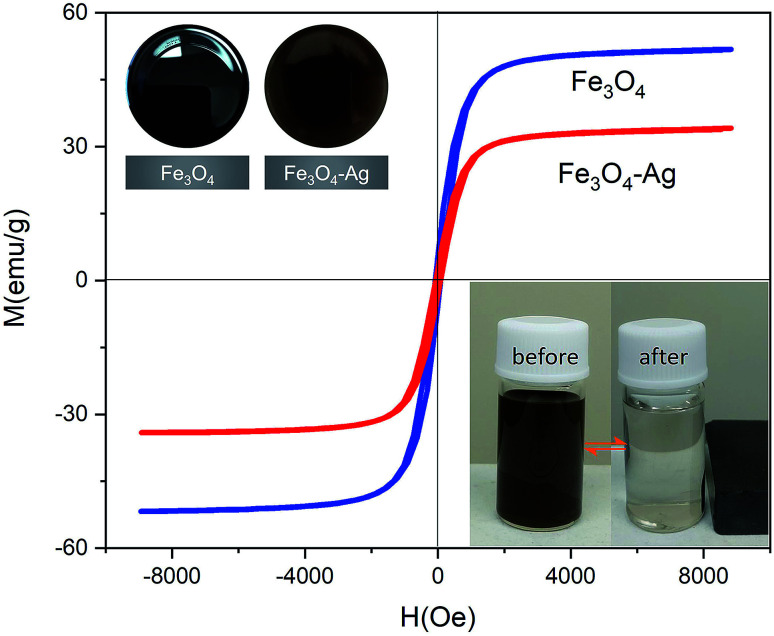
Fig. 6 shows the typical room temperature magnetization loops of the Fe3O4 and Fe3O4–Ag Janus composite particles. The Fe3O4 and Fe3O4–Ag aqueous solutions present a few differences in color, as shown in the insets in the top left of Fig. 6. Furthermore, the saturation magnetization (Ms) of Fe3O4 is 52 emu g−1, while the Ms for Fe3O4–Ag is 37 emu g−1. Obviously, the decrease in Ms is due to the attachment of nonmagnetic Ag nanoparticles. It can be estimated from the difference in the saturation magnetization that the proportion of Ag in the Fe3O4–Ag composite particles is about 30 wt%. The Fe3O4–Ag suspension in water shows fast movement with the applied magnetic field and re-disperses quickly with a slight shake once the magnetic field is removed (see the insets in the bottom right of Fig. 6), suggesting that the Fe3O4–Ag particles possess excellent magnetic responsivity and redispersibility. That is to say, that we can conduct magnetic collection, magnetic separation, and magnetic tracer target analysis easily using an external magnetic field.
Fig. 6. M − H curves of the Fe3O4 and Fe3O4–Ag Janus 10 h particles. The insets in the top left are photographs of the samples in solution, Fe3O4 (left) and Fe3O4–Ag Janus (right). The insets in the bottom right are photographs of the Fe3O4–Ag Janus 10 h taken before and after magnetic attraction by an applied magnet.
Analysis of the SERS effect
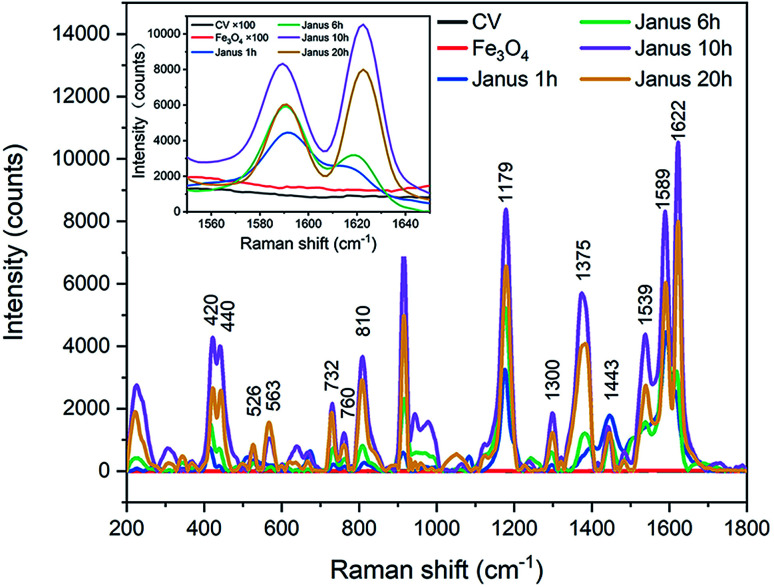
The SERS activity was characterized and analyzed via the Raman spectra. Herein, CV molecules were applied for detecting Raman signals by using well-defined Fe3O4–Ag Janus composite particles as substrates. The Cl atoms attached to the N atoms at the end of the CV molecules can be easily detached, allowing the CV molecules to become positively charged (Fig. S5†), which makes it more likely for them to bond to negatively charged Ag nanoparticles modified by oleate. It is suggested that CV molecules present great discrimination, which contributes to the absorption of CV molecules by the Janus substrate. Besides this, as the distance between the CV molecules and substrate reduces, it promotes an electromagnetic effect on the SERS detection. The results of the SERS measurements are shown in Fig. 7 and S6† (each single SERS spectrum for CV, Fe3O4, Fe3O4–Ag Janus 1 h, Fe3O4–Ag Janus 6 h, Fe3O4–Ag Janus 10 h, Fe3O4–Ag Janus 20 h, respectively). Furthermore, the Raman shift and attribution of the main characteristic vibration peaks obtained are listed in Table S1 in the ESI.† As shown in Fig. 7, there are hardly any SERS signals for the pure Fe3O4 sample because there is no Ag component in it. However, a series of peaks for CV appeared at 420 cm−1, 440 cm−1, 810 cm−1, 914 cm−1, 1179 cm−1, 1375 cm−1, 1589 cm−1, 1622 cm−1, etc., after adding an Ag source to form Fe3O4–Ag Janus particles. It was confirmed that the Fe3O4–Ag Janus 10 h presented the most remarkable Raman signals. Herein, it is worth mentioning that local electromagnetic field enhancement induced by surface plasmon resonance (SPR) is considered to be the most important contribution. Surface plasmon resonance from Ag NPs definitely amplifies the electromagnetic effect, which occurs exactly when the frequency of incident light and natural oscillation frequency of free electrons on the surface are equal. Besides this, the more hot spots that are present for lasering, created from Ag NPs exposed on the surface of Fe3O4 particles, greatly promotes the electromagnetic effect of the metals.48 Therefore, CV molecules near the surface of the Janus substrate are subjected to a greatly amplified electromagnetic field. As a result, the Raman scattering signals are enhanced.
Fig. 7. SERS spectra of CV adsorbed on the Fe3O4–Ag Janus composite for different reaction times. The concentration of CV was 10−6 M.
To further confirm the SERS effect, the EF value was calculated using the following formula: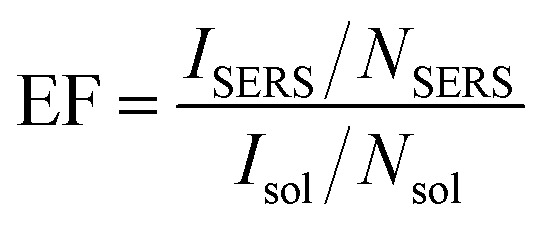 where ISERS is the intensity of the ring breathing band of CV in the SERS; Isol is the intensity of the ring breathing band of CV in the normal Raman spectrum of the solution in water; NSERS is the number of the corresponding CV in the SERS; Nsol is the number of the corresponding CV in the normal solution in water.
Taking into consideration that the volumes of the SERS solution and the normal solution of CV are identical,48 then the EF can be expressed as: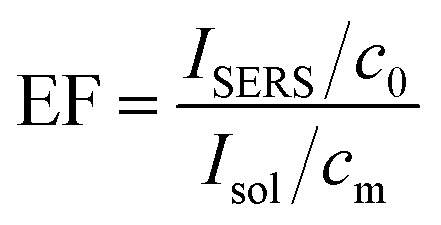 where c0 is the concentration of CV in the solution, 10−6 M; cm is the common density of CV, 1.19 g cm−3.
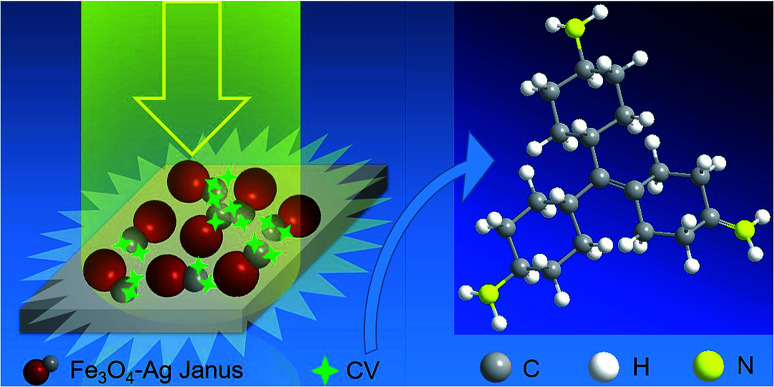
Herein, we chose an intensity value in wavenumbers of 1622 cm−1 as the ISERS or Isol value (see the inset in Fig. 7 and S6†). The detailed values and calculated EF values are given in Table S2 in the ESI.† According to the theoretical evaluation of the SERS, the EF of Janus 10 h amounts to an unprecedented value of 1.57 × 10⁹, three orders of magnitude higher than the value of the pure Fe3O4 sample, as well as one or more orders of magnitude more than the reported results for other Fe3O4–Ag composites (Table S3 in the ESI†). It is generally accepted that such a large EF value can be principally attributed to the electromagnetic effect in the Fe3O4–Ag Janus structure, which has an enormous influence on the SERS activity. Moreover, the electromagnetic effect in the as-prepared Fe3O4–Ag Janus composite is primarily derived from the SPR of the Ag NPs causing considerable hot spots (see the scheme in Fig. 8). As shown in Fig. 7, there was no Raman enhancement in the Fe3O4 particles because of few electromagnetic effects and hot spots on the substrate. Afterwards, as the Ag NPs formed and grew with reaction time, which contributed to the electromagnetic effect, more hot spots were provided for CV molecule to absorb upon and react on the substrate. Besides this, it was suggested that Janus 10 h exhibited the maximum electromagnetic effect, as can be seen from the Raman intensity. However, the electromagnetic effect was somewhat weakened upon an increase in the reaction time to 20 h owing to the agglomeration of Ag nanocrystals, which resulted in a lowering of the electromagnetic effect and not enough exposed hot spots, which is supported by the SEM observations shown in Fig. 3d1 and d2.
Fig. 8. A scheme showing the electromagnetic effect of SERS for the Fe3O4–Ag Janus substrate.
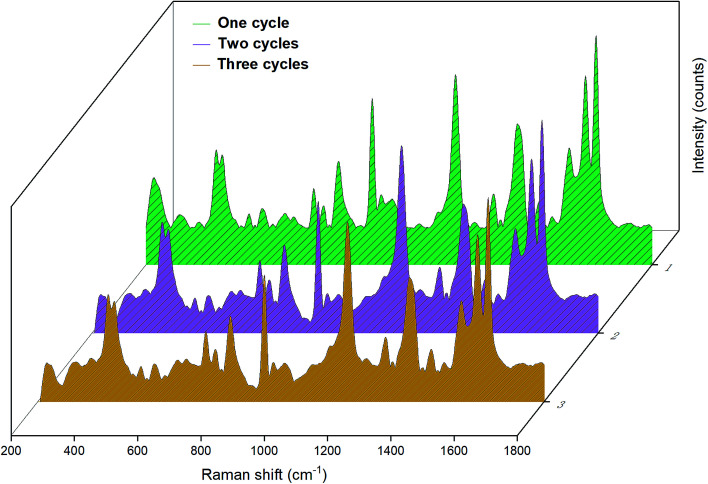
Furthermore, we also examined the reproducible application of the Fe3O4–Ag Janus substrate.49 First, the as-prepared Janus 10 h was dispersed in an aqueous solution containing CV and was then characterized by SERS measurements. Second, the Janus substrate was cleaned with deionized water several times under ultrasonic treatment and separated using an external magnet field to remove any residual molecules and ions and was then dried at 50 °C. Next, a renewable substrate was obtained for further SERS detection. Several cycles were conducted repeatedly following the steps above. The results of the SERS detection using the Janus substrate for different cycles are shown in Fig. 9. As can be observed from the SERS results, the main peaks in the Raman spectra are extremely similar, although the intensity decreases a little after each round of recycling on account that a few CV molecules adsorbed on the substrate were washed away during cleaning.49 However, it still retains high SERS sensitivity and realizes the aim of efficient SERS detection, which confirms that the as-obtained Fe3O4–Ag Janus composite can be used as a reproducible SERS substrate.
Fig. 9. SERS spectra of the reproducible measurements for the Fe3O4–Ag Janus 10 h substrate. The concentration of CV was 10−6 M.
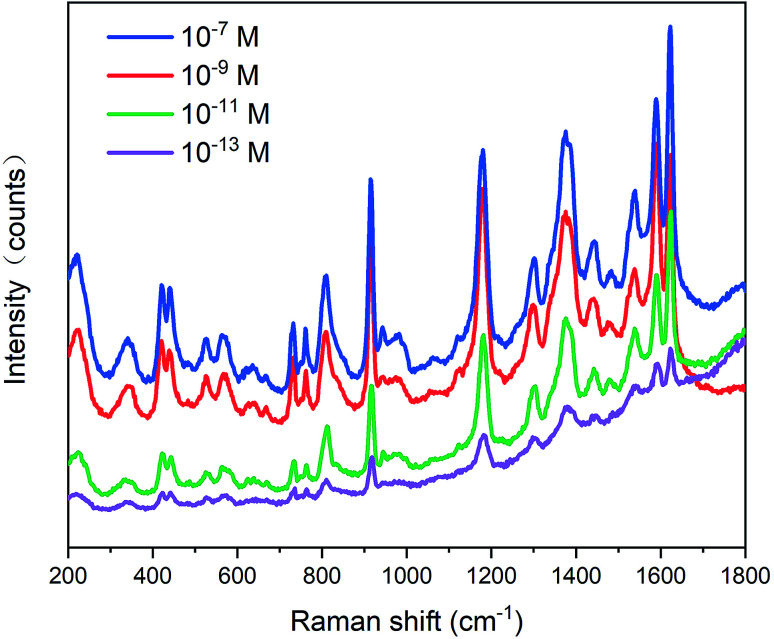
A series of substrates were prepared and measured for further detecting the activity and sensitivity of the Fe3O4–Ag Janus structure. As can be seen from Fig. 10, the SERS spectra were obtained for different CV concentrations of 10−7, 10−9, 10−11, and 10−13 M, respectively. The results indicated that CV can be well detected in the SERS substrate of the Fe3O4–Ag Janus 10 h at a concentration of as low as 10−13 M, which demonstrates that the detection limit is much lower than 10−13 M. In comparison with other Fe3O4–Ag Janus particles or Fe3O4–Ag composites reported in previous studies, our as-prepared Fe3O4–Ag Janus composite possesses vast superiority not only in terms of EF values, but also in concentration limit (Table S3 in the ESI†). It was confirmed that such a Janus composite (mainly referring to Janus 10 h) has the expected morphology, an extremely enhanced SERS effect, and highly sensitive detection. As a result, it holds promise for use in a number of fields, such as sensors and detectors for organic molecules, pesticides, drugs, and so on.
Fig. 10. SERS spectra of CV adsorbed on the Fe3O4–Ag Janus composite at different concentrations, 10−7 M, 10−9 M, 10−11 M, 10−13 M, respectively.
Conclusions
A two-step solvothermal method was performed to prepare Fe3O4–Ag Janus composite particles. The as-prepared Fe3O4–Ag Janus 10 h composite demonstrated not only magnetic responsive ability but also an enhanced SERS effect. Its EF value reached a magnitude of 109 and Raman enhancement signals could be well detected at a CV concentration of as low as 10−13 M, giving the substrate the desired sensitivity for the SERS effect. Moreover, the as-obtained Janus substrate also exhibits reproducibility and recyclability. Therefore, it is expected to be applied as a separable, highly sensitive SERS substrate, as a sensor for the detection of biological molecules and organic pollutants.
Conflicts of interest
There are no conflicts to declare.
Supplementary Material
Acknowledgments
This work was supported by the National Natural Science Foundation of China (No. 51222104, 51371134, 51671155). We also acknowledge testing and analysis from the Instrument Analysis Center at Xi'an Jiaotong University (China) and the Department of Chemical Science and Technology at Tokushima University (Japan).
Electronic supplementary information (ESI) available. See DOI: 10.1039/c8ra09569h
Notes and references
- Yan J. Bloom M. Bae S. C. Luijten E. Granick S. Nature. 2012;491:578–581. doi: 10.1038/nature11619. [DOI] [PubMed] [Google Scholar]
- Panwar K. Jassal M. Agrawal A. K. Particuology. 2015;19:107–112. doi: 10.1016/j.partic.2014.06.007. [DOI] [Google Scholar]
- Li S. Qi W. Peng H. Wu J. Comput. Mater. Sci. 2015;99:125–132. doi: 10.1016/j.commatsci.2014.12.007. [DOI] [Google Scholar]
- Jiang F. Tian Q. Tang M. Chen Z. Yang J. Hu J. CrystEngComm. 2011;13:7189–7193. doi: 10.1039/C1CE05632H. [DOI] [Google Scholar]
- Dutta D. Hazarika R. Dutta P. D. Goswami T. Sengupta P. Dutta D. K. RSC Adv. 2016;6:85173–85181. doi: 10.1039/C6RA16941D. [DOI] [Google Scholar]
- Wang C. Daimon H. Sun S. Nano Lett. 2009;9:1493–1496. doi: 10.1021/nl8034724. [DOI] [PubMed] [Google Scholar]
- Panwar K. Jassal M. Agrawal A. K. RSC Adv. 2016;6:92754–92764. doi: 10.1039/C6RA12378C. [DOI] [Google Scholar]
- Mou F. Z. Xu L. L. Ma H. R. Guan J. G. Chen D. R. Wang S. H. Nanoscale. 2012;4:4650–4657. doi: 10.1039/C2NR30733B. [DOI] [PubMed] [Google Scholar]
- Zerrouki D. Baudry J. Pine D. Chaikin P. Bibette J. Nature. 2008;455:380–382. doi: 10.1038/nature07237. [DOI] [PubMed] [Google Scholar]
- Kaewsaneha C. Tangboriboonrat P. Polpanich D. Eissa M. Elaissari A. ACS Appl. Mater. Interfaces. 2013;5:1857–1869. doi: 10.1021/am302528g. [DOI] [PubMed] [Google Scholar]
- Hu J. Zhou S. X. Sun Y. Y. Fang X. S. Wu L. M. Chem. Soc. Rev. 2012;41:4356–4378. doi: 10.1039/C2CS35032G. [DOI] [PubMed] [Google Scholar]
- Song J. Wu B. Zhou Z. Zhu G. Liu Y. Yang Z. Lin L. Yu G. Zhang F. Zhang G. Duan H. Stucky G. D. Chen X. Angew. Chem., Int. Ed. Engl. 2017;56:8110–8114. doi: 10.1002/anie.201702572. [DOI] [PubMed] [Google Scholar]
- Jin C. Qu Y. Wang M. Han J. Hu Y. Guo R. Langmuir. 2016;32:4595–4601. doi: 10.1021/acs.langmuir.6b01269. [DOI] [PubMed] [Google Scholar]
- Delogu F. Acta Mater. 2014;66:388–395. doi: 10.1016/j.actamat.2013.11.028. [DOI] [Google Scholar]
- Walther A. Matussek K. Mueller A. H. E. ACS Nano. 2008;2:1167–1178. doi: 10.1021/nn800108y. [DOI] [PubMed] [Google Scholar]
- Zhang X. L. Niu C. Y. Wang Y. Q. Zhou S. M. Liu J. Nanoscale. 2014;6:12618–12625. doi: 10.1039/C4NR03301A. [DOI] [PubMed] [Google Scholar]
- Willets K. A. Duyne R. P. V. Annu. Rev. Phys. Chem. 2007;58:267. doi: 10.1146/annurev.physchem.58.032806.104607. [DOI] [PubMed] [Google Scholar]
- Fan C. Zhu S. Xin H. Tian Y. Liang E. J. Opt. 2017;19:015401. doi: 10.1088/2040-8986/19/1/015401. [DOI] [Google Scholar]
- Sun L. He J. An S. Zhang J. Ren D. J. Mol. Struct. 2013;1046:74–81. doi: 10.1016/j.molstruc.2013.04.048. [DOI] [Google Scholar]
- Mullen K. I. Carron K. T. Anal. Chem. 1991;63:2196–2199. doi: 10.1021/ac00019a023. [DOI] [Google Scholar]
- Liu Y. Xu C. Lu J. Zhu Z. Zhu Q. Manohari A. G. Shi Z. Appl. Surf. Sci. 2017:830–836. [Google Scholar]
- Schmidt J. P. Cross S. E. Buratto S. K. J. Chem. Phys. 2004;121:10657–10659. doi: 10.1063/1.1799992. [DOI] [PubMed] [Google Scholar]
- Liu X. Fang Z. Zhang X. Zhang W. Wei X. Geng B. Cryst. Growth Des. 2009;9:197–202. doi: 10.1021/cg800213w. [DOI] [Google Scholar]
- Chen O. Riedemann L. Etoc F. Herrmann H. Coppey M. Barch M. Farrar C. T. Zhao J. Bruns O. T. Wei H. Guo P. Cui J. Jensen R. Chen Y. Harris D. K. Cordero J. M. Wang Z. W. Jasanoff A. Fukumura D. Reimer R. Dahan M. Jain R. K. Bawendi M. G. Nat. Commun. 2014;5:8. [Google Scholar]
- Yin Y. Alivisatos A. P. Nature. 2005;437:664. doi: 10.1038/nature04165. [DOI] [PubMed] [Google Scholar]
- Amarjargal A. Tijing L. D. Im I. T. Kim C. S. Chem. Eng. J. 2013;226:243–254. doi: 10.1016/j.cej.2013.04.054. [DOI] [Google Scholar]
- Qin S. Cai W. Tang X. Yang L. Analyst. 2014;139:5509–5515. doi: 10.1039/C4AN01084A. [DOI] [PubMed] [Google Scholar]
- Li X. Si H. Niu J. Z. Shen H. Zhou C. Yuan H. Wang H. Ma L. Li L. S. Dalton Trans. 2010;39:10984–10989. doi: 10.1039/C0DT00965B. [DOI] [PubMed] [Google Scholar]
- Jiang J. Gu H. Shao H. Devlin E. Papaefthymiou G. C. Ying J. Y. Adv. Mater. 2008;20:4403–4407. doi: 10.1002/adma.200800498. [DOI] [Google Scholar]
- Chen Q. Yang M. Yang X. Li H. Guo Z. Rahma M. H. Spectrochim. Acta, Part A. 2018;189:147–153. doi: 10.1016/j.saa.2017.08.029. [DOI] [PubMed] [Google Scholar]
- Zhang B. Zhang H. Fan X. Li X. Yin D. Zhang Q. J. Colloid Interface Sci. 2013;398:51–58. doi: 10.1016/j.jcis.2013.01.042. [DOI] [PubMed] [Google Scholar]
- Sun Y. Tian Y. He M. Zhao Q. Chen C. Hu C. Liu Y. J. Electron. Mater. 2012;41:519–523. doi: 10.1007/s11664-011-1800-0. [DOI] [Google Scholar]
- Ma M. L. Zhang Q. Y. Yin D. Z. Dou J. B. Zhang H. P. Xu H. L. Catal. Commun. 2012;17:168–172. doi: 10.1016/j.catcom.2011.10.015. [DOI] [Google Scholar]
- Zhang B. L. Zhang H. P. Fan X. L. Li X. J. Yin D. Z. Zhang Q. Y. J. Colloid Interface Sci. 2013;398:51–58. doi: 10.1016/j.jcis.2013.01.042. [DOI] [PubMed] [Google Scholar]
- Gao G. Wang K. Huang P. Zhang Y. Zhi X. Bao C. Cui D. CrystEngComm. 2012;14:7556–7559. doi: 10.1039/C2CE25395J. [DOI] [Google Scholar]
- Gu H. W. Yang Z. M. Gao J. H. Chang C. K. Xu B. J. Am. Chem. Soc. 2005;127:34–35. doi: 10.1021/ja045220h. [DOI] [PubMed] [Google Scholar]
- Zhang D. Fang J. Li T. J. Colloid Interface Sci. 2018;514:217–226. doi: 10.1016/j.jcis.2017.12.017. [DOI] [PubMed] [Google Scholar]
- Ralevic U. Isic G. Anicijevic D. V. Laban B. Bogdanovic U. Lazovic V. M. Vodnik V. Gajic R. Appl. Surf. Sci. 2018;434:540–548. doi: 10.1016/j.apsusc.2017.10.148. [DOI] [Google Scholar]
- Min K. Jeon W. J. Kim Y. Choi J.-Y. Yu H. K. Nanotechnology. 2018;29:105502. doi: 10.1088/1361-6528/aaa746. [DOI] [PubMed] [Google Scholar]
- Krajczewski J. Kolataj K. Pietrasik S. Kudelski A. Spectrochim. Acta, Part A. 2018;193:1–7. doi: 10.1016/j.saa.2017.11.060. [DOI] [PubMed] [Google Scholar]
- He L. Liu C. Tang J. Zhou Y. Yang H. Liu R. Hu J. Appl. Surf. Sci. 2018;434:265–272. doi: 10.1016/j.apsusc.2017.10.155. [DOI] [Google Scholar]
- Cai W. B. Ren B. Li X. Q. She C. X. Liu F. M. Cai X. W. Tian Z. Q. Surf. Sci. 1998;406:9–22. doi: 10.1016/S0039-6028(97)01030-3. [DOI] [Google Scholar]
- Jia H. Y. Zeng J. B. Song W. An J. Zhao B. Thin Solid Films. 2006;496:281–287. doi: 10.1016/j.tsf.2005.08.359. [DOI] [Google Scholar]
- Le Ru E. C. Blackie E. Meyer M. Etchegoin P. G. J. Phys. Chem. C. 2007;111:13794–13803. doi: 10.1021/jp0687908. [DOI] [Google Scholar]
- Miranda M. A. R. Sasaki J. M. Acta Crystallogr., Sect. A: Found. Adv. 2018;74:54–65. doi: 10.1107/S2053273317014929. [DOI] [PubMed] [Google Scholar]
- Zhang L. Dou Y. H. Gu H. C. J. Colloid Interface Sci. 2006;297:660–664. doi: 10.1016/j.jcis.2005.11.009. [DOI] [PubMed] [Google Scholar]
- Huang J. Sun Y. Huang S. Yu K. Zhao Q. Peng F. Yu H. Wang H. Yang J. J. Mater. Chem. 2011;21:17930–17937. doi: 10.1039/C1JM13045E. [DOI] [Google Scholar]
- Shan Y. Yang Y. Cao Y. Huang Z. RSC Adv. 2015;5:102610–102618. doi: 10.1039/C5RA17606A. [DOI] [Google Scholar]
- Yang L. Bao Z. Wu Y. Liu J. J. Raman Spectrosc. 2012;43:848–856. doi: 10.1002/jrs.3106. [DOI] [Google Scholar]
Associated Data
This section collects any data citations, data availability statements, or supplementary materials included in this article.


