

Abstract
Background
The aim of our research was to prospectively explore the clinical value of a deep learning algorithm (DLA) to detect referable diabetic retinopathy (DR) in different subgroups stratified by types of diabetes, blood pressure, sex, BMI, age, glycosylated hemoglobin (HbA1c), diabetes duration, urine albumin‐to‐creatinine ratio (UACR), and estimated glomerular filtration rate (eGFR) at a real‐world diabetes center in China.
Methods
A total of 1147 diabetic patients from Shanghai General Hospital were recruited from October 2018 to August 2019. Retinal fundus images were graded by the DLA, and the detection of referable DR (moderate nonproliferative DR or worse) was compared with a reference standard generated by one certified retinal specialist with more than 12 years of experience. The performance of DLA across different subgroups stratified by types of diabetes, blood pressure, sex, BMI, age, HbA1c, diabetes duration, UACR, and eGFR was evaluated.
Results
For all 1674 gradable images, the area under the receiver operating curve, sensitivity, and specificity of the DLA for referable DR were 0.942 (95% CI, 0.920‐0.964), 85.1% (95% CI, 83.4%‐86.8%), and 95.6% (95% CI, 94.6%‐96.6%), respectively. The DLA showed consistent performance across most subgroups, while it showed superior performance in the subgroups of patients with type 1 diabetes, UACR ≥ 30 mg/g, and eGFR < 90 mL/min/1.73m2.
Conclusions
This study showed that the DLA was a reliable alternative method for the detection of referable DR and performed superior in patients with type 1 diabetes and diabetic nephropathy who were prone to DR.
Keywords: deep learning algorithm, diabetic retinopathy, referable DR, retinal fundus images
Highlights
Our deep learning algorithm (DLA)‐based diabetic retinopathy (DR) grading software showed excellent performance in detecting referable DR, especially in patients with type 1 diabetes and diabetic nephropathy who were prone to DR.
The DLA showed consistent performance in the detection of referable DR across different subgroups stratified by blood pressure, sex, BMI, age, glycosylated hemoglobin, and diabetes duration in a real‐world diabetic center.
摘要
背景
前瞻性探索在中国的一个真实世界糖尿病中心中, 深度学习算法 (DLA) 在按糖尿病类型、血压、性别、BMI、年龄、HbA1c、糖尿病病程、肾小球滤过率(UACR)和估计肾小球滤过率(eGFR)水平分层的不同亚组中检测可参考糖尿病视网膜病变 (DR) 的临床价值。
方法
从 2018 年 10 月至 2019 年 8 月, 招募1147 名糖尿病患者。视网膜眼底图像由 DLA进行分级, 并将可参考 DR(中度非增殖性 DR 或更差)的检测与一位经认证拥有十二年以上经验的眼科专家的参考标准进行比较。评估按糖尿病类型、血压、性别、BMI、年龄、HbA1c、糖尿病病程、尿白蛋白与肌酐比和肾小球滤过率分层的不同亚组 DLA 的表现。
结果
对于所有 1674 个可分级图像, DLA 对可参考 DR 的 AUC、敏感度和特异度分别为 0.942(95% CI, 0.920‐0.964)、85.1%(95% CI, 83.4%‐86.8%)和 95.6% (95% CI, 94.6%96.6%)。 DLA 在大多数亚组中有一致的表现, 而在1型糖尿病、UACR≥30 mg/g和eGFR <90mL/min/1.73m2 的患者亚组中有优异的表现。
结论
本研究表明, DLA是检测可参考DR的一种可靠的替代方法, 并且在易发生DR的1型糖尿病和糖尿病肾病患者中表现更好。
Keywords: 深度学习算法, 糖尿病视网膜病变, 可参考DR, 视网膜眼底图像
1. INTRODUCTION
The prevalence of diabetes mellitus (DM) is increasing worldwide, and it has been reported to be 12.8% in Chinese adults. 1 Diabetic retinopathy (DR), which is a common but serious complication of diabetes, is the leading cause of blindness worldwide. 2 , 3 The prevalence of DR among DM patients has been estimated at 34.6%, 2 and the number of DR patients is growing. 4 Sight‐threatening DR can be avoided when detected early through screening strategies by regular clinical examination or grading of retinal photographs and treated in a timely fashion. 5 , 6
There are different methods of DR screening in the world, including direct and indirect ophthalmoscopy, digital fundus photography, fundus fluorescein angiography, and other examinations. 7 , 8 Recently, deep learning algorithms (DLA), a branch of artificial intelligence (AI), has been widely applied in image recognition, speech recognition, and natural language processing. 9 , 10 For DR detection, DLA have demonstrated excellent sensitivity and specificity, and have been shown to produce expert‐level diagnoses for grading fundus photographs. 4 , 11 , 12 , 13 , 14 , 15 , 16 However, a majority of DLA systems have been validated using online curated or publicly available datasets (EyePACS, Messidor‐2, e‐ophtha), 11 , 12 , 15 which contained high‐quality photographs from individuals.
DR was strongly associated with chronic hyperglycemia, diabetic duration, hypertension, and nephropathy. 17 It was reported that the incidence of DR was higher in patients with type 1 diabetes than in those with type 2 diabetes. 18 Retinopathy caused by hypertension may interfere with the diagnosis of DR. However, few studies have been conducted on the performance of DLA in different settings. To our knowledge, only Ting et al have reported that their DLA showed comparable performance in different subgroups of patients stratified by age, sex, and glycosylated hemoglobin (HbA1c). 13
Therefore, in this study, we conducted a prospective clinic‐based DR screening in the real world, using automated DR grading software (an AI‐based DLA) to grade more than 2000 retinal photographs of patients with diabetes collected by Shanghai General Hospital. The diagnostic accuracy of the DLA was validated, and the performance of the DLA across different subgroups stratified by types of diabetes, blood pressure (BP), sex, BMI, age, HbA1c, diabetes duration, urine albumin‐to‐creatinine ratio (UACR), and estimated glomerular filtration rate (eGFR) was evaluated. We also analyzed the reasons for ungradable images and the inconsistency between the DLA and the retinal specialist.
2. METHODS
2.1. Study design, population, and imaging
This study recruited patients with diabetes from the Department of Endocrinology of Shanghai General Hospital between October 2018 and August 2019. Patients who were pregnant at the time or had any history of intraocular surgery other than cataract surgery in the past year were excluded from the study. Ultimately, a total of 1147 patients (2286 eyes) were enrolled.
Clinical data including age, sex, weight, height, BMI, BP, diabetes duration, total cholesterol (TC), high‐density lipoprotein (HDL), low‐density lipoprotein (LDL), triglycerides (TG), HbA1c, serum creatinine, urine albumin, and urine creatinine were recorded. UACR was calculated using the following formula: UACR = urine albumin/urine creatinine. The eGFR was calculated using the Chronic Kidney Disease Epidemiology Collaboration (CKD‐EPI) equation. 19
For each patient, macula‐centered 45° color fundus photographs of each eye were taken using a retinal fundus camera (KOWA nonmyd WX, Tokyo, Japan). No mydriatic agents were applied. This study was approved by the hospital ethics committee, and all participants signed written informed consent.
2.2. Automated DR grading software
The automated DR grading software used in this study (VoxelCloud, China) was developed using deep learning techniques. Two different networks were included in the software: DR classification network and quality control network. The DR classification network, which was the crucial component of the automated DR grading software, was trained on two datasets. The first dataset (Eyepacs dataset) came from an extensive private retinal image database obtained between 2005 and 2015, containing 140 000 fundus photographs of approximately 37 000 patients, which was used to train the initial DR grading model. The images were assigned retinopathy severity levels based on the International Clinical Diabetic Retinopathy Severity (ICDRS) scale, 20 which was developed by the International Council of Ophthalmology and adopted by the American Academy of Ophthalmology. 21 The second dataset (domestic fundus dataset), obtained from a public hospital in China (not from Shanghai General Hospital, different from the dataset obtained between October 2018 and August 2019), contained approximately 1200 color fundus images, and the DR severity grade was assigned based on the consensus among three retinal specialists. These data were selected to improve the performance of our model in complex situations.
The quality control network was trained on 6400 fundus photographs with different image quality, which was a subset of the first dataset used for training the DR classification network. Architecture and training details of both networks are shown in Supplementary Methods.
All color fundus images were resized to a standard resolution of 800 by 800 pixels and normalized to pixel intensity values between 0 and 1 before being processed by the software.
2.3. Reference standard grading
The reference standard for DR was generated by one certified retinal specialist with more than 12 years of experience; this specialist assigned the grades based on the ICDRS scale, 20 which uses a 5‐point grading system: no DR, mild nonproliferative DR (NPDR), moderate NPDR, severe NPDR, and proliferative DR (PDR). The retinal specialist was blinded to the results of the automated DR grading software. Referable DR was defined as moderate NPDR or worse.
All images were graded by both the automated DR grading software and the retinal specialist. Then, the performance of the DLA‐based DR grading software was compared to the reference standards. To compare the diagnostic performance of the DLA in different subgroups, we categorized the patients into different subgroups according to type of diabetes (type 1 diabetes, type 2 diabetes), history of hypertension (presence or absence of high blood pressure [HBP]), sex (female, male), BMI (<24 kg/m2, ≥24 kg/m2), age (≤40 years, >40 years and ≤60 years, >60 years), HbA1c (<7% [53 mmol/mol], ≥7% [53 mmol/mol] and <9% [75 mmol/mol], ≥9% [75 mmol/mol]), diabetes duration (<1 year, ≥1 year, ≥5 years, ≥10 years), UACR (<30 mg/g, ≥30 mg/g), and eGFR (≥90 mL/min/1.73m2, <90 mL/min/1.73m2).
2.4. Statistical analysis
Variables were expressed as the mean and SD or as the median and interquartile range (25%‐75%) as appropriate. One‐way analysis of variance or the Kruskal‐Wallis test was used to compare differences in continuous variables among DR stages (no DR, mild NPDR, moderate NPDR, severe NPDR, and PDR). The Mann‐Kendall test was employed to investigate the trends between DR stages and patients' demographic and clinical characteristics. The sensitivity, specificity, and area under the receiver operating curve (AUC) with 95% CI of the DLA in detecting referable DR were calculated and compared to the reference standard at the level of individual eyes. Analyses were performed in R V.3.6.0 (R Foundation for Statistical Computing, Vienna, Austria).
3. RESULTS
The overall demographics and clinical characteristics of the patients are listed in Table 1. In total, 1147 patients with diabetes were enrolled in this study, including 36 with type 1 diabetes and 1111 with type 2 diabetes. The mean age of the patients was 50 ± 12 years, and 68.4% of the patients were male. The duration of diabetes in the study population was 2.08 (0.08‐9.12) years, HbA1c was 8.26 ± 2.07% (66.8 ± 22.6 mmol/mol), BMI was 25.67 ± 3.58 kg/m2, systolic blood pressure (SBP) was 128 ± 16 mm Hg, and diastolic blood pressure (DBP) was 78 ± 10 mm Hg. Of the 1147 patients, 772 (67.3%) had no DR, 143 (12.5%) had mild NPDR, 93 (8.1%) had moderate NPDR, 43 (3.7%) had severe NPDR, 20 (1.7%) had PDR, and 76 (6.6%) were considered ungradable because both eyes had insufficient fundus image quality graded by the retinal specialist per the ICDR grading system. Among the gradable patients, the prevalence of any DR and referable DR were 27.9% and 14.6%, respectively. Age (P < .001), duration of diabetes (P < .001), SBP (P < .001), HbA1c (P = .03), LDL (P = .03), UACR (P < .001), and eGFR (P < .001) were significantly different among the DR stages, while there were no significant differences in BMI, DBP, TC, HDL, or TG among the DR stages (P > .05) (Table 1). The correlations of DR stages with age (Kendall's tau‐b = 0.07, P < .001), duration of diabetes (Kendall's tau‐b = 0.19, P < .001), SBP (Kendall's tau‐b = 0.08, P < .001), DBP (Kendall's tau‐b = 0.05, P = .04), HbA1c (Kendall's tau‐b = 0.09, P < .001) and UACR (Kendall's tau‐b = 0.15, P < .001) were significantly positive, while the correlations of DR stages with TC (Kendall's tau‐b = −0.07, P < .001), LDL (Kendall's tau‐b = −0.08, P < .001), and eGFR (Kendall's tau‐b = −0.09, P < .001) were negative (Table 1).
TABLE 1.
Demographic and clinical characteristics of patients with diabetes stratified by different DR stages assigned by the retinal specialist
| Non‐referable DR | Referable DR | ||||||||
|---|---|---|---|---|---|---|---|---|---|
| No DR | Mild NPDR | Moderate NPDR | Severe NPDR | PDR | Ungradable | ANOVA/Kruskal‐Wallis (P value) | Kendall's tau‐b | ||
| No. of patients (%) | 1147 (100%) | 772 (67.3%) | 143 (12.5%) | 93 (8.1%) | 43 (3.7%) | 20 (1.7%) | 76 (6.6%) | ‐ | ‐ |
| No. of type 1 diabetes (%) | 36 | 20 (55.5%) | 4 (11.1%) | 1 (2.8%) | 1 (2.8%) | 5 (13.9%) | 5 (13.9%) | ‐ | ‐ |
| No. of type 2 diabetes (%) | 1111 | 752 (67.6%) | 139 (12.5%) | 92 (8.3%) | 42 (3.8%) | 15 (1.4%) | 71 (6.4%) | ‐ | ‐ |
| Age, mean (SD), y | 50 ± 12 | 49 ± 12 | 50 ± 11 | 52 ± 12 | 56 ± 10 | 49 ± 9 | 59 ± 12 | <0.001 | 0.07, P < .001 |
| Men, n (%) | 784 (68.4%) | 523 | 103 | 70 | 25 | 14 | 49 | ‐ | ‐ |
| BMI (kg/m2) | 25.67 ± 3.58 | 25.69 ± 3.60 | 25.87 ± 3.50 | 25.20 ± 3.84 | 25.33 ± 3.14 | 24.80 ± 3.05 | 26.00 ± 3.62 | 0.46 | −0.02, P = .38 |
| Diabetes duration, median (IQR), y | 2.08 (0.08‐9.12) | 1.17 (0.00‐6.10) | 3.00 (0.25‐10.17) | 8.17 (1.00‐13.42) | 10.17 (2.21‐15.75) | 9.79 (0.42‐14.42) | 7.17 (1.35‐15.17) | <0.001 | 0.19, P < .001 |
| SBP (mm Hg) | 128 ± 16 | 127 ± 15 | 130 ± 18 | 131 ± 17 | 134 ± 19 | 133 ± 20 | 133 ± 18 | <0.001 | 0.08, P < .001 |
| DBP (mm Hg) | 78 ± 10 | 77 ± 10 | 80 ± 11 | 78 ± 10 | 79 ± 12 | 78 ± 12 | 75 ± 10 | 0.11 | 0.05, P = .04 |
| HbA1c (%) | 8.26 ± 2.07 | 8.18 ± 2.12 | 8.48 ± 2.08 | 8.46 ± 1.80 | 9.09 ± 2.03 | 8.46 ± 1.93 | 7.91 ± 1.75 | 0.03 | 0.09, P < .001 |
| HbA1c (mmol/mol) | 66.8 ± 22.6 | 65.9 ± 23.2 | 69.2 ± 22.7 | 69.0 ± 19.7 | 75.8 ± 22.2 | 69.0 ± 21.1 | 62.9 ± 19.1 | 0.03 | 0.09, P < .001 |
| TC (mmol/L) | 4.83 ± 1.29 | 4.91 ± 1.26 | 4.70 ± 1.10 | 4.67 ± 1.22 | 4.65 ± 1.23 | 4.47 ± 1.40 | 4.67 ± 1.89 | 0.08 | −0.07, P < .001 |
| HDL (mmol/L) | 1.01 ± 0.28 | 1.01 ± 0.26 | 1.00 ± 0.29 | 1.04 ± 0.35 | 1.03 ± 0.32 | 1.03 ± 0.39 | 1.04 ± 0.32 | 0.87 | −0.02, P = .36 |
| LDL (mmol/L) | 2.68 ± 0.92 | 2.75 ± 0.91 | 2.66 ± 0.93 | 2.53 ± 1.00 | 2.47 ± 0.75 | 2.40 ± 1.16 | 2.38 ± 0.86 | 0.03 | −0.08, P < .001 |
| TG (mmol/L) | 2.15 ± 2.82 | 2.18 ± 2.71 | 2.08 ± 2.77 | 2.02 ± 1.76 | 1.88 ± 1.73 | 1.51 ± 0.88 | 2.41 ± 5.15 | 0.73 | −0.04, P = .07 |
| UACR (mg/g) | 71.4 ± 327.6 | 44.8 ± 167.5 | 54.5 ± 161.1 | 75.0 ± 207.6 | 216.9 ± 484.6 | 439.1 ± 1455.6 | 186.1 ± 702.4 | <0.001 | 0.15, P < .001 |
| eGFR (mL/min/1.73m2) | 113.0 ± 19.2 | 115.3 ± 17.0 | 114.2 ± 19.3 | 108.7 ± 21.9 | 99.0 ± 23.8 | 108.8 ± 26.3 | 100.5 ± 23.4 | <0.001 | −0.09, P < .001 |
Note: Data are presented as the mean ± SD or median (IQR) as appropriate. Ungradable: insufficient image quality.
Abbreviations: ANOVA, analysis of variance; DBP, diastolic blood pressure; DR, diabetic retinopathy; eGFR, estimated glomerular filtration rate; HbA1c, glycosylated hemoglobin; HDL, high‐density lipoprotein; IQR, interquartile range; LDL, low‐density lipoprotein; NPDR, nonproliferative DR; PDR, proliferative DR; SBP, systolic blood pressure; TC, total cholesterol; TG, triglycerides; UACR, urine albumin‐to‐creatinine ratio.
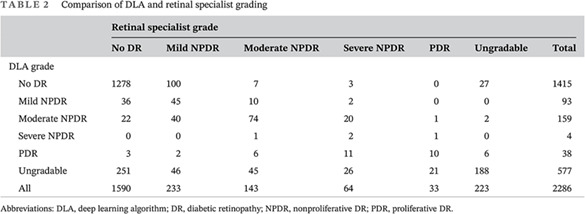
The final analysis included 2286 images from 1147 patients. Eight patients had only one eye. The distributions of the grades assigned by the retinal specialist and the DLA were compared, and the weighted kappa score was 0.771 (95% CI, 0.7288‐0.8131). Of the 2286 images, 223 (9.8%) could not be graded by the retinal specialist because of insufficient image quality. Of the 2063 images with sufficient quality, 1823 (88.4%) showed no or mild DR, and 240 (11.6%) showed referable DR, as graded by the retinal specialist. The DLA classified 577 (25.2%) images as ungradable due to insufficient quality. Of the 1674 images with sufficient quality for both the reference standard and the DLA, 1481 (88.5%) showed no or mild DR, and 193 (11.5%) showed referable DR, as graded by the DLA (Table 2).
TABLE 2.
Comparison of DLA and retinal specialist grading
| Retinal specialist grade | |||||||
|---|---|---|---|---|---|---|---|
| No DR | Mild NPDR | Moderate NPDR | Severe NPDR | PDR | Ungradable | Total | |
| DLA grade | |||||||
| No DR | 1278 | 100 | 7 | 3 | 0 | 27 | 1415 |
| Mild NPDR | 36 | 45 | 10 | 2 | 0 | 0 | 93 |
| Moderate NPDR | 22 | 40 | 74 | 20 | 1 | 2 | 159 |
| Severe NPDR | 0 | 0 | 1 | 2 | 1 | 0 | 4 |
| PDR | 3 | 2 | 6 | 11 | 10 | 6 | 38 |
| Ungradable | 251 | 46 | 45 | 26 | 21 | 188 | 577 |
| All | 1590 | 233 | 143 | 64 | 33 | 223 | 2286 |
Abbreviations: DLA, deep learning algorithm; DR, diabetic retinopathy; NPDR, nonproliferative DR; PDR, proliferative DR.
The performance of the DLA in detecting referable DR is shown in Table 3. For all gradable images, the DLA achieved an AUC of 0.942 (95% CI, 0.920‐0.964), a sensitivity of 85.1% (95% CI, 83.4%‐86.8%), and a specificity of 95.6% (95% CI, 94.6%‐96.6%). The DLA showed consistent performance across different subgroups of patients stratified by history of HBP, sex, BMI, age, HbA1c, and diabetes duration. However, it showed superior performance in the subgroups with type 1 diabetes (AUC 0.996 and 95% CI, 0.988‐1.000 for type 1 diabetes vs 0.938, 95% CI, 0.915‐0.962 for type 2 diabetes), UACR ≥ 30 mg/g (AUC 0.945, 95% CI, 0.944‐0.946 for UACR ≥ 30 mg/g vs 0.931, 95% CI, 0.930‐0.932 for UACR < 30 mg/g), or eGFR < 90 mL/min/1.73m2 (AUC 0.971, 95% CI, 0.970‐0.972 for eGFR < 90 mL/min/1.73m2 vs 0.941, 95% CI, 0.940‐0.942 for eGFR ≥ 90 mL/min/1.73m2) (Table 3, Figure S1).
TABLE 3.
Area under the receiver operating curve (AUC), sensitivity, and specificity of the DLA in detecting referable DR with reference to a retinal specialist's grading
| Referable diabetic retinopathy | ||||
|---|---|---|---|---|
| No. of eyes | AUC | Sensitivity, % (95% CI) | Specificity, % (95% CI) | |
| ALL | 1674 | 0.942 (0.920‐0.964) | 85.1 (83.4‐86.8) | 95.6 (94.6‐96.6) |
| Type of diabetes | ||||
| Type 1 diabetes | 53 | 0.996 (0.988‐1.000) | 100.0 (100.0‐100.0) | 97.7 (93.7‐100.0) |
| Type 2 diabetes | 1621 | 0.938 (0.915‐0.962) | 84.2 (82.4‐85.9) | 95.0 (94.5‐96.6) |
| HBP history | ||||
| No history of HBP | 1114 | 0.940 (0.910‐0.970) | 84.4 (82.3‐86.6) | 96.5 (95.4‐97.6) |
| HBP | 560 | 0.943 (0.911‐0.975) | 86.2 (83.4‐89.1) | 93.8 (91.8‐95.8) |
| Sex | ||||
| Female | 503 | 0.924 (0.897‐0.977) | 84.2 (81.0‐87.4) | 96.1 (94.4‐97.8) |
| Male | 1171 | 0.948 (0.924‐0.971) | 85.5 (83.4‐87.5) | 95.4 (94.2‐96.6) |
| BMI (kg/m2) | ||||
| BMI <24 | 515 | 0.937 (0.901‐0.973) | 81.0 (77.6‐84.4) | 94.7 (92.8‐96.7) |
| BMI ≥24 | 1159 | 0.944 (0.916‐0.972) | 87.8 (85.9‐89.7) | 96.0 (94.8‐97.1) |
| Age (y) | ||||
| Age ≤ 40 | 515 | 0.949 (0.907‐0.992) | 80.0 (76.5‐83.5) | 96.9 (95.4‐98.4) |
| 40<Age ≤ 60 | 896 | 0.943 (0.914‐0.972) | 90.1 (88.2‐92.1) | 94.7 (93.3‐96.2) |
| Age>60 | 263 | 0.930 (0.876‐0.984) | 78.1 (73.1‐83.1) | 96.1 (93.8‐98.4) |
| HbA1c, % (mmol/mol) | ||||
| HbA1c<7 (53) | 526 | 0.967 (0.931‐1.000) | 82.9 (79.5‐86.0) | 97.8 (96.5‐99.0) |
| 7 (53) ≤ HbA1c<9 (75) | 574 | 0.939 (0.902‐0.975) | 87.3 (84.6‐90.0) | 95.3 (93.6‐97.0) |
| HbA1c ≥9 (75) | 539 | 0.934 (0.898‐0.969) | 85.2 (82.2‐88.2) | 93.4 (91.3‐95.5) |
| Diabetes duration (y) | ||||
| Diabetes duration<1 | 705 | 0.960 (0.923‐0.997) | 87.2 (84.7‐89.6) | 97.0 (95.7‐98.3) |
| Diabetes duration ≥1 | 969 | 0.931 (0.904‐0.959) | 84.4 (82.1‐86.7) | 94.5 (93.1‐96.0) |
| Diabetes duration ≥5 | 558 | 0.918 (0.885‐0.952) | 84.9 (81.9‐87.9) | 92.6 (90.4‐94.8) |
| Diabetes duration ≥10 | 299 | 0.910 (0.867‐0.953) | 85.7 (81.7‐89.7) | 91.9 (88.9‐95.0) |
| UACR (mg/g) | ||||
| UACR<30 | 1129 | 0.931 (0.930‐0.932) | 82.5 (80.3‐84.7) | 95.8 (94.6‐97.0) |
| UACR≥30 | 356 | 0.945 (0.944‐0.946) | 85.7 (82.1‐89.3) | 94.7 (92.3‐97.0) |
| eGFR (mL/min/1.73m2) | ||||
| eGFR ≥90 | 1553 | 0.941 (0.940‐0.942) | 85.5 (83.7‐87.2) | 95.6 (94.5‐96.6) |
| eGFR<90 | 86 | 0.971 (0.970‐0.972) | 84.6 (77.0‐92.2) | 94.5 (89.7‐99.3) |
Abbreviations: AUC, area under the receiver operating curve; DLA, deep learning algorithm; DR, diabetic retinopathy; eGFR, estimated glomerular filtration rate; HbA1c, glycosylated hemoglobin; HBP, high blood pressure; UACR, urine albumin‐to‐creatinine ratio.
Of the 2286 images, 389 images could not be graded by the DLA because of their insufficient quality but could be graded by the retinal specialist. A review of those 389 images indicated that most of them (n = 364 [93.6%]) had grayish‐green gradual translucent ring artifacts, which may be caused by light leakage due to improper distance between the eyes and the camera. Some images (n = 66 [17.0%]) had glare artifacts, which could also be seen in some images with ring artifacts. A few images had the defect of improper exposure (n = 3 [0.8%]) or poor focus/optical path occlusion (eyelashes, eyelids, etc.) (n = 19 [4.9%]). There were 35 images that could be graded by the DLA but not by the retinal specialist. The most common features of these images were ring artifacts (n = 11 [31.4%]) and improper exposure (n = 23 [65.7%]). Of the 2286 images, 188 images (8.4%) could not be graded by the DLA or the retinal specialist. More than 80% (n = 156 [83.0%]) of those 188 images had ring artifacts (Table 4). Examples of typical images with insufficient quality can be found in Figure S2.
TABLE 4.
Features of ungradable images
| Features | Gradable by retinal specialist/ungradable by DLA (n = 389) | Gradable by DLA/ungradable by retinal specialist (n = 35) | Ungradable by retinal specialist and DLA (n = 188) |
|---|---|---|---|
| Ring artifact (improper distance between the eyes and the camera) | 364 | 11 | 156 |
| Glare artifact (reflection of optical lens | 66 | 4 | 83 |
| Improper exposure) | 3 | 23 | 21 |
| Poor focus or occlusion of optical path | 19 | 0 | 35 |
Abbreviations: DLA, deep learning algorithm.
The DLA gave 67 false positives and 22 false negatives for referable DR. We then analyzed the reasons for inconsistency between the DLA and the retinal specialist, which are presented in Table 5. The most common reasons for false‐positive classification were the misdiagnosis of retinal microaneurysm as intraretinal hemorrhage (n = 25 [37.3%]) and the misidentification of arteriovenous crossing (n = 19 [28.4%]) as venous beading. The other reasons included retinal vessel occlusion (n = 2 [3.0%]), age‐related macular degeneration (n = 4 [6.0%]), macular holes (n = 1 [1.5%]), congenital vascular malformation (n = 1 [1.5%]), and congenital optic papillary malformation (n = 1 [1.5%]), all of which were misclassified as referable DR. However, approximately 20.9% of false‐positive images had no abnormal ocular findings, including some images in which normal retinal microvessels were misidentified as intraretinal microvascular abnormalities (IRMA) (n = 2 [3.0%]) and some images in which a glare and/or stains on a normal fundus were misidentified as exudates (n = 12 [17.9%]). An analysis of false‐negative cases (n = 22) revealed that more than half of the images displayed linear intraretinal hemorrhage mistaken for blood vessels (n = 13 [59.1%]), and seven images (31.8%) had been misclassified for unknown reasons. The remaining reasons included omission of IRMA (n = 1 [4.5%]) and venous beading (n = 1 [4.5%]). Examples of typical false‐negative and false‐positive images can be found in Figures S3 and S4.
TABLE 5.
Features of false positives and false negatives in the identification of referable diabetic retinopathy by the DLA
| Reason | No. | Proportion (%) |
|---|---|---|
| False positives | 67 | 100 |
| Retinal microaneurysm misdiagnosed as intraretinal hemorrhage | 25 | 37.3 |
| Arteriovenous cross signs mistaken for venous beads | 19 | 28.4 |
| Retinal vessel occlusion | 2 | 3.0 |
| AMD | 4 | 6.0 |
| Macular hole | 1 | 1.5 |
| Congenital vascular malformation | 1 | 1.5 |
| Congenital optic papillary malformation | 1 | 1.5 |
| Normal retinal microvessels misdiagnosed as IRMA | 2 | 3.0 |
| Normal fundus with glare and/or stain misdiagnosed as exudates | 12 | 17.9 |
| False negatives | 22 | 100 |
| Linear intraretinal hemorrhage mistaken for a blood vessel | 13 | 59.1 |
| Omission of IRMA | 1 | 4.5 |
| Omission of venous beading | 1 | 4.5 |
| Others with unknown reasons | 7 | 31.8 |
Abbreviations: AMD, age‐related macular degeneration; DLA, deep learning algorithm; IRMA, intraretinal microvascular abnormalities.
4. DISCUSSION
The prevalence of DR is increasing worldwide, and the reported prevalence ranged from 18.45% to 28.8% among DM patients in China. 22 , 23 , 24 , 25 Our study demonstrated that the prevalence of any DR in patients with diabetes was 27.9%. DR does not usually have any obvious symptoms until it progresses to vision loss. Therefore, the annual screening for DR as well as other chronic complications related to diabetes is crucial in routine diabetes care. Early identification, assessment, and treatment are helping to reduce the overall burden of vision loss. Our DLA system is used in parallel with the clinical workflow, and it takes only 2 minutes from the beginning of retinal fundus image acquisition to the output of the results, indicating that it could rapidly screen a large number of patients and free the clinician from repetitive work.
Recently, a growing number of studies have been published on the accuracy of DLA for DR screening. Gulshan et al validated their DLA using approximately 10 000 retinal images retrieved from two publicly available databases (EyePAC‐1 and Messidor‐2) and achieved excellent performance (AUC 0.99; sensitivity and specificity >90%) for referable DR. 11 Li et al tested their DLA using 13 657 images from independent, multiethnic datasets and achieved an AUC, sensitivity, and specificity of 0.955, 92.5%, and 98.5%, respectively, for referable DR. 15 Although these studies provided excellent insight, their DLA were validated against public databases comprising mainly high‐quality photographs. In real‐world circumstances, the quality of the photographs will be lower, which may reduce the performance of DLA. However, a prospective study conducted in two tertiary eye care centers in South India showed that their DLA performed excellently in the detection of referable DR, with 88.9% to 92.1% sensitivity, 92.2% to 95.2% specificity, and an AUC of 0.963 to 0.980, 16 which was comparable to the results of previous studies using public databases. Our DLA, which also used real‐world screening data and nonmydriatic fundus photographs, showed similar performance (AUC 0.942, sensitivity 85.1%, and specificity 95.6%) to this prospective study conducted in South India. Therefore, our DLA offers a user‐friendly, efficient, and professional tool for the early detection of referable DR in diabetic centers. In addition, we expect it to be beneficial in low‐resource areas where specialized ophthalmologists are not available.
Our study showed that the DLA had better performance in the subgroups of patients with type 1 diabetes, albuminuria, and an eGFR < 90 mL/min/1.73m2 . It was reported that compared with patients with type 2 diabetes, those patients with type 1 diabetes were more likely to develop DR 18 , 26 and that chronic kidney disease (CKD), low eGFR, and/or high UACR was associated with DR. 18 , 27 Our research also found that the reduced eGFR levels and increased UACR levels were associated with the severity of DR. The performance of our DLA among the type 1 diabetes, albuminuria, and lower eGFR groups suggested that it performed better in patients with a high risk of DR. We speculate that patients with type 1 diabetes, albuminuria, and lower eGFR may have more typical DR lesions. However, the sample size of type 1 diabetes was small, and a large sample size is needed for further verification.
Older subjects are prone to media opacities, 28 and the clinical features of hypertensive retinopathy are similar to those of DR. Therefore, age and hypertension are sources of potential errors and may affect the performance of DLA. However, our DLA performed consistently in the subgroups of different ages and subgroups with or without a history of HBP, as well as in the subgroups stratified by sex, BMI, HbA1c, and diabetes duration. Therefore, our DLA performed excellently and consistently in those different subgroups, while it performed better in the subgroups with a high risk of DR (eg, type 1 diabetes and kidney impairment).
Poor‐quality images are inevitable during the image acquisition process. In real‐world screenings, the rates of poor‐quality or ungradable images have been reported to be as high as 20%. 28 , 29 Sufficient image quality is a key prerequisite for a reliable automatic DR detection system. 30 Here we analyzed the reasons for the images that cannot be graded by DLA. In our study, the DLA classified 25.2% as ungradable images due to insufficient quality; the most common reason for poor image quality was the existence of ring artifacts (90%), which may be caused by light leaks due to improper distance between the eyes and the camera. The fundus photograph quality control model embedded in the image acquisition program can provide an automatic classifier for image quality, with the ability to effectively recognize low‐quality images in real time and prompt image recapture, thereby reducing unqualified images.
Herein, we also explored the characteristics of misclassifications (false negatives and false positives) that occurred when our DLA was used to detect DR; this analysis will help us to better understand the functional weaknesses of our DLA and identify strategies to reduce errors in the future. Nearly 80% of the false‐positive images displayed abnormal retinal features, which may have benefited from a referral when sent to the ophthalmologist. Among the false‐positive images, 37.3% involved retinal microaneurysm misdiagnosed as intraretinal hemorrhage, and 28.4% involved arteriovenous crossing misidentified as venous beading. The sensitivity of our DLA grading for the referable DR was 85.1%, which would result in many missed cases. We analyzed the reasons for false‐negative classification and found that nearly 60% of false‐negative cases were shown to involve undetected linear intraretinal hemorrhage. Optimization of our DLA through further training on the above lesions may help to improve its fine‐grained classification capabilities in the future.
While the results were encouraging, our study also had a few limitations. First, all retinal fundus images were from one hospital. Different equipment settings and camera systems would impact DR screening images and thus affect the performance of the DLA. To further validate our model, we need to collect more retinal fundus images from different hospitals in future research; we plan to apply this system in the community hospitals of our hospital alliance. Second, our DLA can only predict the DR grade but cannot identify diabetic macular edema, another major cause of vision loss in patients with diabetes. Nondiabetic retinopathy also cannot be identified because our system is trained only for DR. Third, the reference standard used for this study was based on one retinal specialist. However, he is an experienced ophthalmologist with more than 12 years of experience.
In conclusion, our DLA‐based DR grading software showed excellent and consistent performance in the detection of referable DR in retinal fundus images across a majority of subgroups in a real‐world diabetic center and showed superior performance in patients with type 1 diabetes and diabetic kidney disease. Moreover, we expect that it will prove to be highly useful when applied in primary care settings where qualified eye care professionals are not always available; further application and research is needed to improve the clinical validity of this algorithm.
CONFLICT OF INTEREST
No potential conflicts of interest relevant to this article were reported.
Supporting information
Appendix S1. Supporting Information
ACKNOWLEDGEMENTS
The authors acknowledge the contributions of all the participants.
This work was supported by the National Natural Science Foundation of China (No. 81870610), the Shanghai Science and Technology Commission Foundation (No. 18411968800), the Shanghai “Rising Stars of Medical Talent” Outstanding Youth Medical Talents, and the Clinical Research Plan of SHDC (SHDC2020CR3065B).
Li N, Ma M, Lai M, et al. A stratified analysis of a deep learning algorithm in the diagnosis of diabetic retinopathy in a real‐world study. Journal of Diabetes. 2022;14(2):111-120. doi: 10.1111/1753-0407.13241
Na Li, Mingming Ma, and Mengyu Lai contributed equally to this work and are considered to be co‐first authors.
Funding information Clinical Research Plan of SHDC, Grant/Award Number: SHDC2020CR3065B; National Natural Science Foundation of China, Grant/Award Number: 81870610; Shanghai “Rising Stars of Medical Talent” Outstanding Youth Medical Talents; Shanghai Science and Technology Commission Foundation, Grant/Award Number: 18411968800
Contributor Information
Zhi Zheng, Email: zhengzhi139@163.com.
Yufan Wang, Email: yyffwang@sina.com.
REFERENCES
- 1. Li Y, Teng D, Shi X, et al. Prevalence of diabetes recorded in mainland China using 2018 diagnostic criteria from the American Diabetes Association: national cross sectional study. BMJ. 2020;369:m997. [DOI] [PMC free article] [PubMed] [Google Scholar]
- 2. Yau JW, Rogers SL, Kawasaki R, et al. Meta‐analysis for eye disease study G. Global prevalence and major risk factors of diabetic retinopathy. Diabetes Care. 2012;35(3):556‐564. [DOI] [PMC free article] [PubMed] [Google Scholar]
- 3. Ting DS, Cheung GC, Wong TY. Diabetic retinopathy: global prevalence, major risk factors, screening practices and public health challenges: a review. Clin Experiment Ophthalmol. 2016;44(4):260‐277. [DOI] [PubMed] [Google Scholar]
- 4. Verbraak FD, Abramoff MD, Bausch GCF, et al. Diagnostic accuracy of a device for the automated detection of diabetic retinopathy in a primary care setting. Diabetes Care. 2019;42(4):651‐656. [DOI] [PubMed] [Google Scholar]
- 5. Cheung N, Mitchell P, Wong TY. Diabetic retinopathy. Lancet. 2010;376(9735):124‐136. [DOI] [PubMed] [Google Scholar]
- 6. Wong TY, Cheung CM, Larsen M, Sharma S, Simo R. Diabetic retinopathy. Nat Rev Dis Primers. 2016;2:16012. [DOI] [PubMed] [Google Scholar]
- 7. Pieczynski J, Grzybowski A. Review of diabetic retinopathy screening methods and Programmes adopted in different parts of the world. Eur Ophthal Rev. 2015;9:49‐55. [Google Scholar]
- 8. Goh JK, Cheung CY, Sim SS, Tan PC, Tan GS, Wong TY. Retinal imaging techniques for diabetic retinopathy screening. J Diabetes Sci Technol. 2016;10(2):282‐294. [DOI] [PMC free article] [PubMed] [Google Scholar]
- 9. LeCun Y, Bengio Y, Hinton G. Deep learning. Nature. 2015;521(7553):436‐444. [DOI] [PubMed] [Google Scholar]
- 10. Carin L, Pencina MJ. On deep learning for medical image analysis. JAMA. 2018;320(11):1192‐1193. [DOI] [PubMed] [Google Scholar]
- 11. Gulshan V, Peng L, Coram M, et al. Development and validation of a deep learning algorithm for detection of diabetic retinopathy in retinal fundus photographs. Jama. 2016;316(22):2402‐2410. [DOI] [PubMed] [Google Scholar]
- 12. Gargeya R, Leng T. Automated identification of diabetic retinopathy using deep learning. Ophthalmology. 2017;124(7):962‐969. [DOI] [PubMed] [Google Scholar]
- 13. Ting DSW, Cheung CY, Lim G, et al. Development and validation of a deep learning system for diabetic retinopathy and related eye diseases using retinal images from multiethnic populations with diabetes. JAMA. 2017;318(22):2211‐2223. [DOI] [PMC free article] [PubMed] [Google Scholar]
- 14. Abramoff MD, Lou Y, Erginay A, et al. Improved automated detection of diabetic retinopathy on a publicly available dataset through integration of deep learning. Invest Ophthalmol Vis Sci. 2016;57(13):5200‐5206. [DOI] [PubMed] [Google Scholar]
- 15. Li Z, Keel S, Liu C, et al. An automated grading system for detection of vision‐threatening referable diabetic retinopathy on the basis of color fundus photographs. Diabetes Care. 2018;41(12):2509‐2516. [DOI] [PubMed] [Google Scholar]
- 16. Gulshan V, Rajan RP, Widner K, et al. Performance of a deep‐learning algorithm vs manual grading for detecting diabetic retinopathy in India. JAMA Ophthalmol. 2019;137:987‐993. [DOI] [PMC free article] [PubMed] [Google Scholar]
- 17. American Diabetes A . 11. Microvascular complications and foot care: standards of medical Care in Diabetes‐2021. Diabetes Care. 2021;44(Suppl 1):S151‐S167. [DOI] [PubMed] [Google Scholar]
- 18. Romero‐Aroca P, Navarro‐Gil R, Valls‐Mateu A, Sagarra‐Alamo R, Moreno‐Ribas A, Soler N. Differences in incidence of diabetic retinopathy between type 1 and 2 diabetes mellitus: a nine‐year follow‐up study. Br J Ophthalmol. 2017;101(10):1346‐1351. [DOI] [PMC free article] [PubMed] [Google Scholar]
- 19. Stevens PE, Levin A. Kidney disease: improving global outcomes chronic kidney disease guideline development work group M. evaluation and management of chronic kidney disease: synopsis of the kidney disease: improving global outcomes 2012 clinical practice guideline. Ann Intern Med. 2013;158(11):825‐830. [DOI] [PubMed] [Google Scholar]
- 20. Wilkinson CP, Ferris FL 3rd, Klein RE, et al. Global diabetic retinopathy project G. proposed international clinical diabetic retinopathy and diabetic macular edema disease severity scales. Ophthalmology. 2003;110(9):1677‐1682. [DOI] [PubMed] [Google Scholar]
- 21. Panel AAoORV. Preferred Practice Pattern® Guidelines. Diabetic Retinopathy. San Francisco, CA: American Academy of Ophthalmology; 2016. [Google Scholar]
- 22. Zhang G, Chen H, Chen W, Zhang M. Prevalence and risk factors for diabetic retinopathy in China: a multi‐hospital‐based cross‐sectional study. Br J Ophthalmol. 2017;101(12):1591‐1595. [DOI] [PMC free article] [PubMed] [Google Scholar]
- 23. Song P, Yu J, Chan KY, Theodoratou E, Rudan I. Prevalence, risk factors and burden of diabetic retinopathy in China: a systematic review and meta‐analysis. J Glob Health. 2018;8(1):010803. [DOI] [PMC free article] [PubMed] [Google Scholar]
- 24. Yang QH, Zhang Y, Zhang XM, Li XR. Prevalence of diabetic retinopathy, proliferative diabetic retinopathy and non‐proliferative diabetic retinopathy in Asian T2DM patients: a systematic review and meta‐analysis. Int J Ophthalmol. 2019;12(2):302‐311. [DOI] [PMC free article] [PubMed] [Google Scholar]
- 25. Zhang Y, Shi J, Peng Y, et al. Artificial intelligence‐enabled screening for diabetic retinopathy: a real‐world, multicenter and prospective study. BMJ Open Diabetes Res Care. 2020;8(1):e001596. [DOI] [PMC free article] [PubMed] [Google Scholar]
- 26. Wang SY, Andrews CA, Herman WH, Gardner TW, Stein JD. Incidence and risk factors for developing diabetic retinopathy among youths with type 1 or type 2 diabetes throughout the United States. Ophthalmology. 2017;124(4):424‐430. [DOI] [PMC free article] [PubMed] [Google Scholar]
- 27. Grunwald JE, Alexander J, Maguire M, et al. Prevalence of ocular fundus pathology in patients with chronic kidney disease. Clin J Am Soc Nephrol. 2010;5(5):867‐873. [DOI] [PMC free article] [PubMed] [Google Scholar]
- 28. Scanlon PH, Foy C, Malhotra R, Aldington SJ. The influence of age, duration of diabetes, cataract, and pupil size on image quality in digital photographic retinal screening. Diabetes Care. 2005;28(10):2448‐2453. [DOI] [PubMed] [Google Scholar]
- 29. Scanlon PH, Malhotra R, Thomas G, et al. The effectiveness of screening for diabetic retinopathy by digital imaging photography and technician ophthalmoscopy. Diabet Med. 2003;20(6):467‐474. [DOI] [PubMed] [Google Scholar]
- 30. Krause J, Gulshan V, Rahimy E, et al. Grader variability and the importance of reference standards for evaluating machine learning models for diabetic retinopathy. Ophthalmology. 2018;125(8):1264‐1272. [DOI] [PubMed] [Google Scholar]
Associated Data
This section collects any data citations, data availability statements, or supplementary materials included in this article.
Supplementary Materials
Appendix S1. Supporting Information