Abstract
Seven undescribed phenylspirodrimane derivatives, stachybochartins A–G (1–7), and four known analogues (8–11) were isolated from the endophytic fungus Stachybotrys chartarum obtained from Pinellia ternata. Stachybochartins A–D are four rare C–C-coupled dimeric derivatives and stachybochartin G features a seco-bisabosqual skeleton. Their structures and configurations were elucidated via spectroscopic analysis, electronic circular dichroism (ECD) calculations, the ECD exciton chirality method and the modified Mosher's method. Stachybochartins A–D and G displayed cytotoxic activities against MDA-MB-231 breast cancer cells and U-2OS osteosarcoma cells, with IC50 values ranging from 4.5 to 21.7 μM. Stachybochartins C and G exerted strong anti-proliferative activities against U-2OS cells in concentration- and time-dependent manners and induced apoptosis.
The diverse structures and anticancer activities of phenylspirodrimane derivatives are investigated.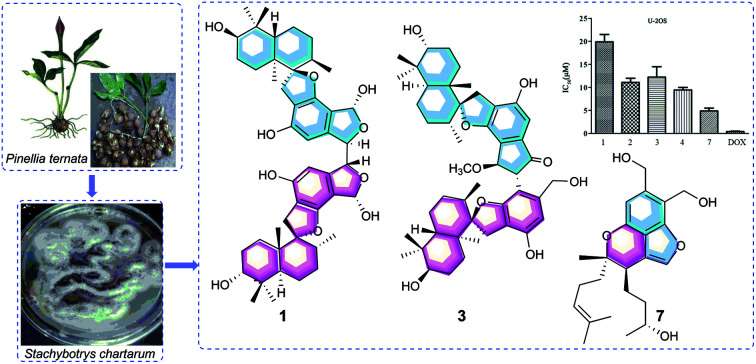
1. Introduction
Phenylspirodrimanes are a group of meroterpenoids in which a benzene ring attaches to a drimane sesquiterpene, forming a spirofuran structure. They are particular metabolites that have only been discovered from two fungal genera, Stachybotrys and Memnoniella.1 Phenylspirodrimane members have been reported to have diverse biological activities, such as antiosteoporosis activity,2 the ability to inhibit immune-complex disease3,4 and tyrosine kinase receptors,5 and antihyperlipidemic effects.6 Due to their unique structures and potential medical applications, chemists are also interested in the synthesis of phenylspirodrimanes and have developed different processes to totally synthesize several bioactive examples, like K-76, L-671, and corallidictyals A–D.7–9 It is worth noting that a few derivatives of phenylspirodrimanes have been found as dimers. The two monomers in dimers such as stachybocins A–C10,11 are normally linked through different alkyl diamine chains, which are presumably derived from different amino acids. Chartarlactam L was the first dimer reported with a C8′–C8′′′ linkage6,12 and, thereafter, two dimers, stachartone A and stachartarin A,13,14 were reported to unusually dimerize through the formation of a 2-phenyl-1-indanone fragment. The dimers were also found to possess potential biological activities that were different to those of the monomers, such as antibacterial activities, HIV-1 protease inhibitory effects, and potential ET receptor antagonists.10,11,15
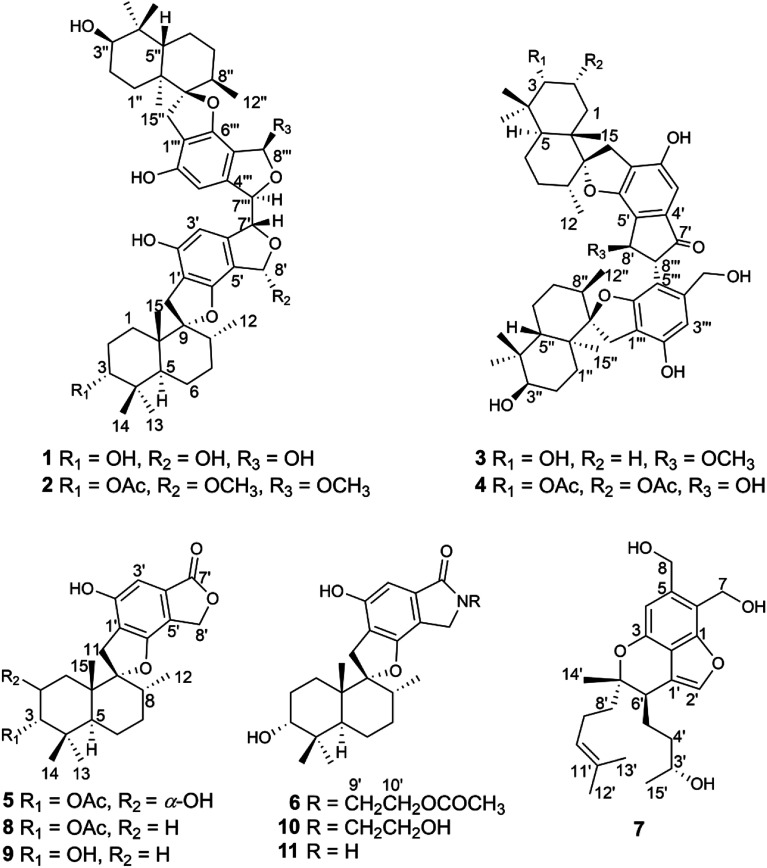
Recently, during metabolite research into endophytic fungi from Pinellia ternata,16–19 chemical investigation of the strain Stachybotrys chartarum PT2-12 led to the discovery of four phenylspirodrimane C–C-coupled dimers (1–4) and three new monomers (5–7), along with four known examples (8–11) (Fig. 1). Differently to the C8′–C8′′′ linkage in chartarlactam L,6 the two monomers in 1 and 2 were dimerized through the unusual C7′–C7′′′ linkage. The isolates were assayed for their cytotoxic activities against three human cancer cell lines (MDA-MB-231, U-2OS and MCF-7). Stachybochartins A–D and G showed potent cytotoxicity against MDA-MB-231 and U-2OS cells and stachybochartins C and G were found to exert significant anti-proliferative activities against U-2OS cells through the activation of caspase-dependent apoptosis. Herein, the isolation, structural elucidation, and cytotoxic activities of these stachybochartins are described.
Fig. 1. The structures of compounds 1–11.
2. Results and discussion
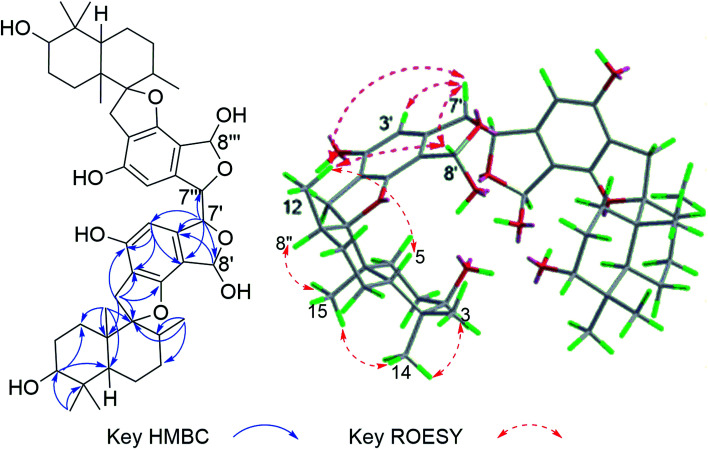
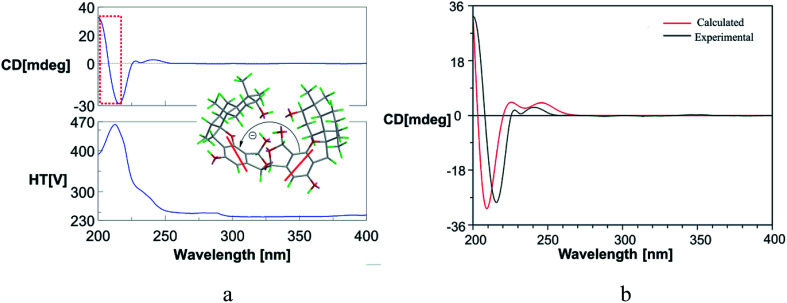
The molecular formula of stachybochartin A (1) was determined as C46H62O10, from the positive HRESIMS ion peak at m/z: 797.4232 [M + Na]+ (calcd for C46H62NaO10: 797.4235), revealing 16 degrees of unsaturation. In the 1H NMR spectrum, the obviously recognized signals were one aromatic singlet (δH 6.31, s), three oxymethine signals (δH 5.70, s; δH 4.72, s; δH 3.33, m), and four methyl signals (δH 1.03, 3H, s; δH 0.97, 3H, s; δH 0.88, 3H, s; δH 0.76, 3H, d, J = 6.4 Hz), while the remaining signals were from twelve protons in the field range from δH 2.00 to 3.00. Analysis of 13C NMR and DEPT spectra revealed the presence of 23 carbon signals from four methyl (δC 29.0, 23.0, 16.6, and 16.0), five methylene (δC 32.6, 32.5, 26.1, 25.4 and 22.3), six methine (δC 108.7, 97.3, 76.5, 64.1, 41.5 and 38.5), five nonprotonated aromatic (δC 160.7, 154.8, 134.2, 114.7, and 109.6), and three quaternary (δC 98.7, 43.2 and 37.4) carbons. The above data resembled that from stachybotrylactones, yet only showed half the total mass revealed by MS studies.20 Therefore, 1 was deduced to be a dimeric phenylspirodrimane with a symmetrical structure. HMBC results further confirmed the phenylspirodrimane structure (Fig. 2). The correlations from H3-15 to H-1/H-5/H-9/H-10, from H3-14 to H-3/H-4, and from H-3 to H-1/H-5 verified the drimane sesquiterpene moiety. Meanwhile, the spirobenzofuran moiety was revealed through correlations from H2-11 to C-1′, C-2′, C-6′, C-9, and C-10. It was further noticed that the carbonyl C-7′ and the oxygenated methylene C-8′ seen in stachybotrylactones20 were replaced by the hemiacetal C-8′ at δH 5.70/δC 97.3 and the oxygenated methine C-7′ at δH 4.72/δC 64.1 in 1. The methine nature of C-7′ revealed the C-7′–C-7′′′ bond between the two symmetrical units. This was also evidenced by the HMBC correlations from H-7′ (δH 4.72) to C-7′, C-3′, C-4′, and C-8′, as well as from H-8′ (δH 5.70) to C-4′, C-5′, C-6′, and C-7′. The monomeric core in 1 was deduced to possess the same relative configuration as those of stachybotrylactones from ROESY analysis (Fig. 2). The key ROESY correlations of H-3/H3-14/H3-15, H3-15/H-11a/H-8, H-11b/H3-12, and H-5/H3-13 confirmed the β-orientations of H-3, H3-14, H3-15, H2-11 and H-8, while H-5, H3-12, and H3-13 were α-oriented. The ROESY correlations from H-8′ to H3-12 and H-7′ further revealed that H-7′ and H-8′ were on the same side of the molecular plane. Based on the ECD exciton chirality method,21,22 the (R)-configuration of C-7′/C-7′′′ was revealed through the negative couplet of the benzene moiety at around 210 nm (Fig. 3a), which was further confirmed via ECD calculations (Fig. 3b).
Fig. 2. The key HMBC and ROESY correlations for stachybochartin A (1).
Fig. 3. (a) The ECD spectrum of stachybochartin A (1) in MeOH. The negative couplet at around 208 nm (a negative Cotton effect at 214 nm and a positive one at 202 nm) in the ECD spectrum indicated the 7′R, 7′′′R configuration in 1; (b) a comparison of the experimental and calculated ECD spectra of 1.
Stachybochartin B (2) was determined to have the molecular formula C50H68O11, from the HRESIMS ion peak at m/z: 867.4658 [M + Na]+. The 1D NMR spectra signals of 2 were apparently double those of 1, which indicated that 2 was an analogue of 1 with different substituents. The methylation of the hydroxyl groups at C-8′ and C-8′′′ and the acetylation of the hydroxyl group at C-3 in 2 were confirmed via the HMBC correlations from δH 3.66 (–OCH3) to C-8′, from δH 3.67 (–OCH3) to C-8′′′, from H-8′ to δC 56.2 (–OCH3), from H-8′′′ to δC 56.4 (–OCH3), and from H-3 (δH 4.58)/δH 2.00 (–OCOCH3) to δC 172.5 (–OCOCH3). The relative configurations of the two monomeric units were determined to be identical to those in 1via ROESY correlations (Fig. S1†). In addition, the well matched ECD curves of 1 and 2 (Fig. S2†) established that their absolute configurations are the same. The dimeric compounds of 1 and 2 were speculated to be derived from the monomer stachybotrylactone (9), where two monomers formed a C–C bond via a free radical coupling reaction at C-7′ and C-7′′′.
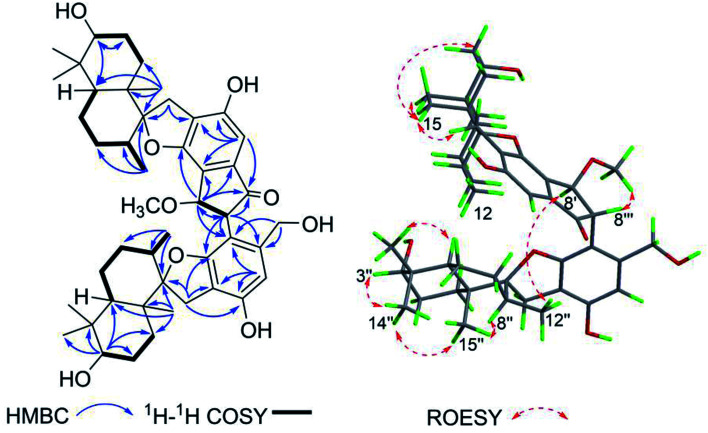
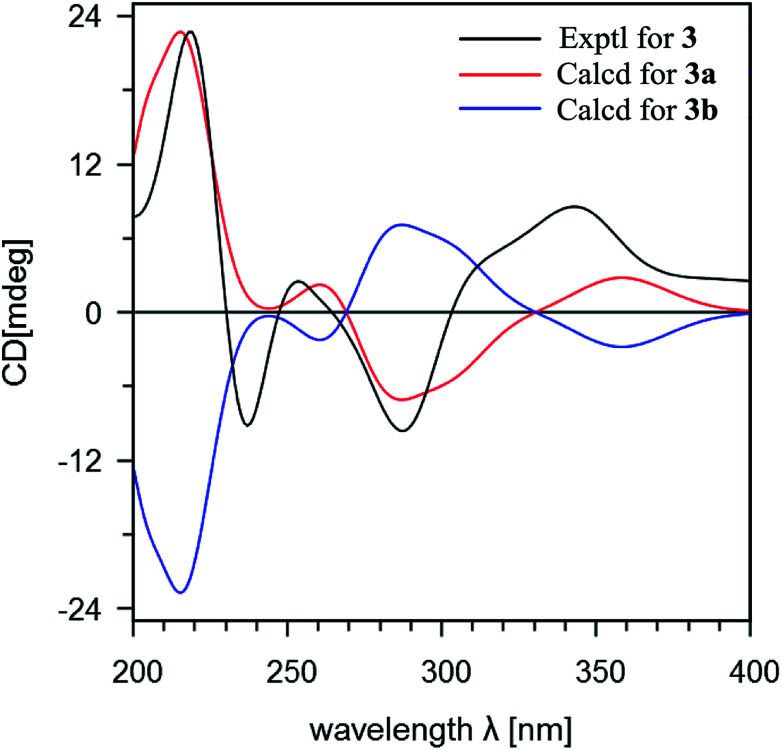
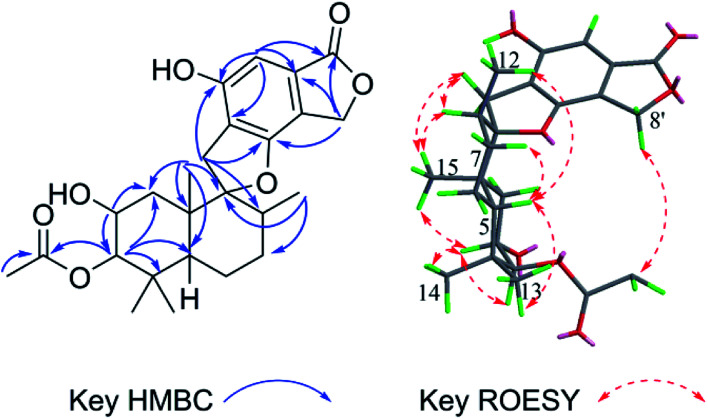
Stachybochartin C (3) was obtained as a yellow amorphous solid. Its molecular formula C47H64O9 with 16 degrees of unsaturation was determined via the positive HRESIMS ion peak at m/z: 795.4447 [M + Na]+ (calcd for C47H64NaO9: 795.4443). The 1D and 2D NMR data indicated that 3 was another dimer but with a different dimeric mode. Careful analysis of the 1H–1H COSY correlations revealed two spin systems (C-1–C-3 and C-5–C-12), which further assisted the elucidation of the drimane moieties through the HMBC correlations from H3-15 to H-1/H-5/H-9/H-10, H3-14 to H-3/H-4, and H-3 to H-1/H-5. The correlations from H2-11 to C-1′, C-2′, C-6′, C-9, and C-10 further confirmed that the attached benzene ring helped form the spirofuran structure. Similar HMBC correlations also established the other monomeric unit. The 2-phenyl-1-indanone fragment, as in stachartone A,13,14 was mainly determined via HMBC correlations from H-8′ (δH 4.89) to C-4′, C-5′, C-6′, C-7′ and C-8′′′ and H-8′′′ to C-8′, C-7′, C-4′′′, C-5′′′ and C-6′′′. Meanwhile, an additional methoxyl signal was also observed at C-8′ in 3 due to HMBC correlation from δH 3.72 (3H, s, –OCH3) to C-8′ (δC 85.3). Therefore, the planar structure of 3 was determined as shown. Though ROESY analysis (Fig. 4), the relative configuration of 3 was established to be the same as that of stachartone A.13 The ROESY correlations from H-3 to H3-14/H3-15 and from H3-15 to H2-11 and H-8 revealed that H-3, H3-14, H3-15, H2-11 and H-8 had the same orientation, leaving H-5, H3-12 and H3-13 with the opposite orientation. The same NOEs were also observed for the other drimane moiety, which therefore possessed the same relative configuration. Moreover, the correlations between H-8′′′ and 8′-OCH3 and between H-8′ and H3-12′′ confirmed that H-8′ and H-8′′′ were oriented oppositely and that the two drimane moieties were closely approximated in space. ECD calculations were further used to verify the configuration. As shown in Fig. 5, the 3a calculated spectrum showed overall agreement with the experimental ECD spectrum, which determined the 3R, 5S, 8R, 9R, 10S, 8′R, 3′′R, 5′′S, 8′′R, 9′′R, 10′′S and 8′′′R configuration of 3.
Fig. 4. The key HMBC and ROESY correlations for stachybochartin C (3).
Fig. 5. A comparison of the experimental and calculated ECD spectra of stachybochartin C (3). (3a: 3R, 5S, 8R, 9R, 10S, 8′R, 3′′R, 5′′S, 8′′R, 9′′R, 10′′S, 8′′′R; 3b: 3S, 5R, 8S, 9S, 10R, 8′S, 3′′S, 5′′R, 8′′S, 9′′S, 10′′R, 8′′′S).
The molecular formula C50H66O12 of stachybochartin D (4) was determined from HRESIMS data. 1D and 2D NMR data analysis revealed that 4 possessed the same dimeric phenylspirodrimane skeleton as 3, but with different substituents. Two additional acetoxyl groups were placed at C-2 and C-3, as established via the HMBC correlations from δH 1.88 (3H, s) to δC 172.3 and from δH 2.09 (3H, s) to δC 173.2. Meanwhile, the lack of a methoxyl signal and the chemical shifts of H-8′ (δH 5.18) and C-8′ (δC 75.7) revealed a hydroxyl group at C-8′. The relative configuration of 4 was deduced to be the same as that of 3 due to their similar ROESY correlations (Fig. S3†), and H-2 in 4 had the same orientation as H-3 and H3-15 according to their observed mutual NOEs. The identical ECD curves of 3 and 4 (Fig. S4†) additionally indicated that their absolute configurations were the same.
The molecular formula of stachybochartin E (5), C25H32O7, was determined from the HRESIMS ion peak at m/z: 467.2038 [M + Na]+ (calcd for C25H32NaO7: 467.2040). Its structure was determined to be similar to that of stachybotrylactone acetate (8)23 on the basis of their similar NMR data. The difference between them was the appearance of a hydroxyl group at C-2 (δH 4.07, ddd, J = 12.2, 4.3, 2.6 Hz; δC 65.7) in 5, which was also evidenced by the HMBC correlations from H-2 to C-1 and C-3. The small coupling constant of JH-3/H-2 (J = 2.6 Hz) indicated that the orientation of H-2 and H-3 was the same, and the ROESY correlations of H-2/H3-14/H3-15/H-3, H3-15/H-8 and H-5/H3-13 further suggested the β-orientation of H3-15, H-8, H2-11, H-3 and H-2 and the α-orientation of H-5 and H3-12 (Fig. 6). In the ECD spectrum, the distinctive positive Cotton effect (CE) at 219 nm and negative CEs at 268 and 339 nm (Fig. S5†) provided evidence for an absolute configuration of 2R, 3S, 5S, 8R, 9R and 10S.24
Fig. 6. The key HMBC and ROESY correlations for stachybochartin E (5).
Stachybochartin F (6) was assigned the molecular formula of C27H38NO6 from positive HRESIMS data. The 1H and 13C NMR spectra of 6 were almost identical to those of stachybotramide (10).23 The differences were the additional acetyl group and the upfield-shifted H2-10′ of 6, suggesting that 6 was the 10′-OH acetylated derivative of stachybotramide. This deduction was proved through the HMBC correlation from H2-10′ (δH 4.32) to the carbonyl carbon at δC 172.7. Moreover, the ROESY correlations (Fig. S6†) suggested that it had the same relative configuration as that of 5, and their similar CEs (Fig. S7†) confirmed their identical absolute configurations.
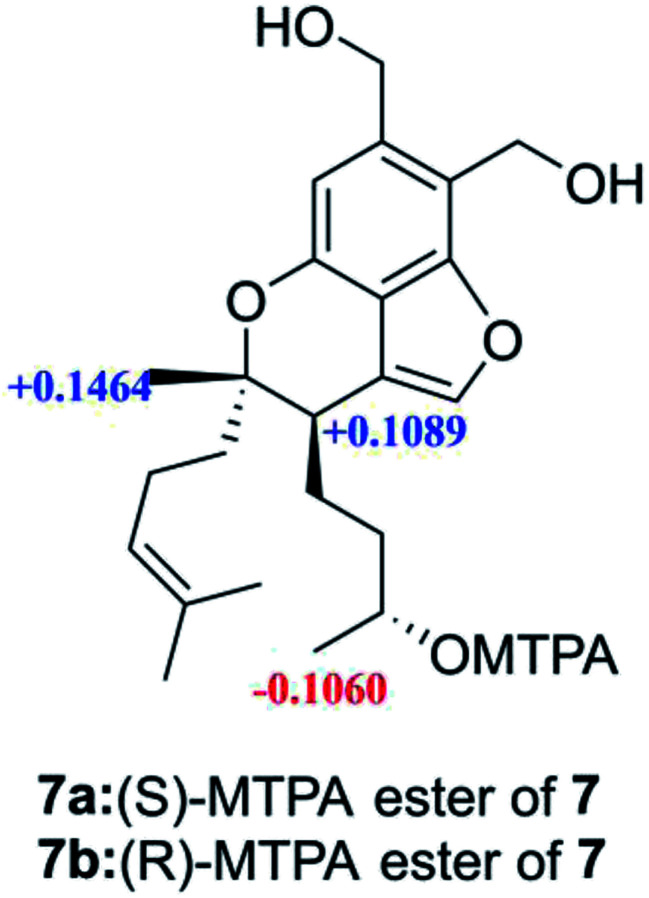
Stachybochartin G (7) had the molecular formula C23H32O5. Analysis of the NMR data clearly indicated that 7 was closely related to stachybisbin B,25 and the absence of an acetyl group indicated the deacetylation of 7-OH in 7. The planar structure of 7 was confirmed via HMBC correlations (Fig. S8†). The ROESY correlations of H-6′/H2-8′ and H3-14′/H2-5′ indicated that H3-14′ and H-6′ had opposite orientation, and the identical ECD curve (Fig. S9†) to that of stachybisbin B determined the same 6′R and 7′S configurations in 7. In addition, the 3′S configuration was determined via the modified Mosher's method (Fig. 7).18 Therefore, the absolute configuration of 7 was determined to be 3′S, 6′R, and 7′S.
Fig. 7. Δδ values (in ppm) = δS − δR, obtained for the (S)- and (R)-MPTA esters.
All the isolates were evaluated for their cytotoxicity against three human cancer cell lines: MDA-MB-231, MCF-7, and U-2OS. Stachybochartins A–D (1–4) and G (7) displayed activity against the human cancer cell lines MDA-MB-231 and U-2OS, with IC50 values ranging from 4.5 to 21.7 μM, but all the isolates were inactive (IC50 > 50 μM) against the cell line MCF-7 (Table S1†).
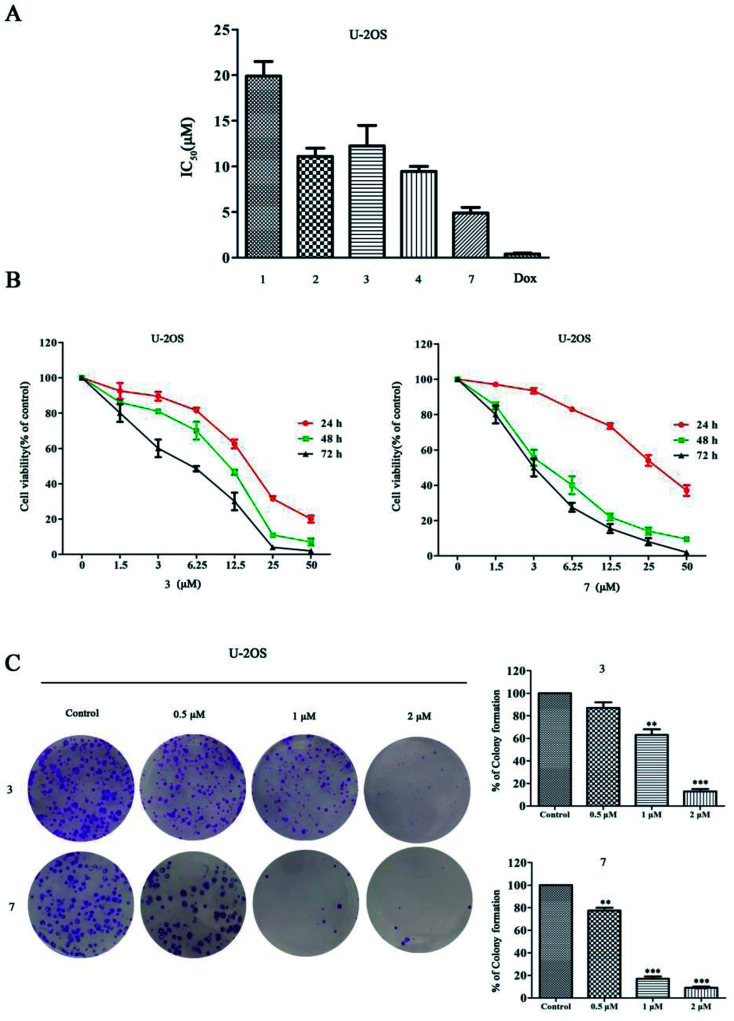
Stachybochartins C (3) and G (7) showed a more remarkable effect on U-2OS cells than on other cell types, thus their cytotoxic effects were further evaluated on U-2OS cells with doxorubicin (DOX) as a positive control (Fig. 8A). As shown in Fig. 8B, both 3 and 7 significantly inhibited the cell viability in concentration- and time-dependent manners, which was also confirmed by the results of colony formation assays, as shown in Fig. 8C. Together, these data indicated that 3 and 7 inhibited the proliferation of U-2OS cells.
Fig. 8. The effects of stachybochartins A–D (1–4) and G (7) on cell viability in U-2OS cells and on inhibiting U-2OS cell proliferation. (A) U-2OS cells were treated with 1–4, 7 and DOX (positive control) for 48 h, and the IC50 values were quantified using MTT assays. (B) U-2OS cells were treated with different concentrations of 3 and 7 (0, 1.5, 3, 6.25, 12.5, 25 or 50 μM) for the indicated times, and cell viability was determined via MTT assays. (C) The effects of 3 and 7 on the clonogenic ability of U-2OS cells treated for 48 h are shown. The data are presented as mean ± SEM from three independent experiments. *: P < 0.05, **: P < 0.01 and ***: P < 0.001, compared to the control.
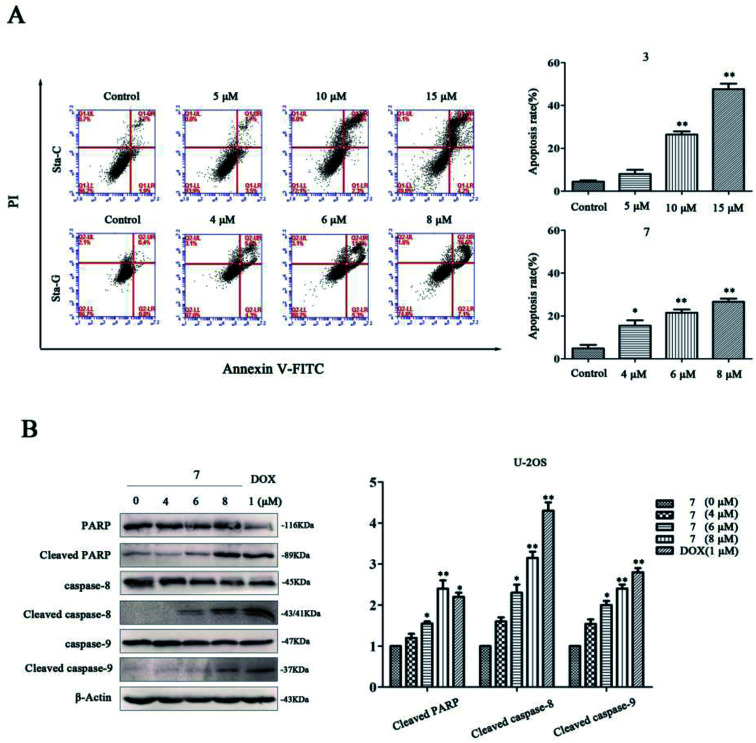
To investigate whether the cytotoxicity was associated with cell apoptosis, we respectively detected the apoptosis of U-2OS cells after treatment with stachybochartins C (3) and G (7). Compared with the control, the percentage of apoptotic cells increased in a dose-dependent manner for both the stachybochartin C and G groups (Fig. 9A), indicating apoptosis in the cells. The caspase-cascade system plays a crucial role in cell apoptosis, and caspases are the executors of apoptosis.26 Therefore, we examined the expression of caspase-related proteins in stachybochartin G-treated U-2OS cells. Significant caspase-8, caspase-9 and PARP processing were observed in the total cell lysates, and their cleavages markedly increased in a dose-dependent manner (Fig. 9B). Thus, these data suggest that the cytotoxic effects of stachybochartin G on U-2OS cells were caused by the activation of caspase-dependent apoptosis.
Fig. 9. Stachybochartins C (3) and G (7) induced caspase-dependent apoptosis in U-2OS cells. (A) U-2OS cells were pretreated with 3 (0–15 μM) or 7 (0–8 μM) for 48 h and apoptosis rates were analyzed via flow cytometry. (B) After treatment with 7 (0–8 μM) and DOX (1 μM, as a positive control) for 48 h, the expression levels of PARP and cleaved PARP, pro-caspase-8, cleaved caspase-8, pro-caspase-9, and cleaved caspase-9, were analyzed via western blotting. β-Actin was used as a protein loading control. The data are presented as mean ± SEM from three independent experiments. *: P < 0.05 and **: P < 0.01, compared to the control.
3. Conclusions
In conclusion, seven phenylspirodrimane derivatives, stachybochartins A–G (1–7), together with four known analogues were isolated from the endophytic fungus Stachybotrys chartarum. The four dimers are structurally infrequent, especially stachybochartins A and B with their C7′–C7′′′ linkages. The dimers, along with stachybochartin G, displayed cytotoxic activities against human MDA-MB-231 breast cancer cells and U-2OS osteosarcoma cancer cells, and the activation of caspase-dependent apoptosis was the possible pathway for their anticancer activities. In addition, stachybochartin G, which features a seco-bisabosqual skeleton, showed stronger activity than normal phenylspirodrimanes. These findings may provide evidence for further research into the anticancer activities of these compounds.
4. Experimental section
4.1. General experimental procedures
Optical rotations were measured with a Jasco P-1020 polarimeter (Jasco, Tokyo, Japan). UV spectra were acquired with a Shimadzu UV-2450 spectrophotometer (Shimadzu, Tokyo, Japan). CD spectra were recorded using a Jasco J-810 spectrometer (Jasco, Tokyo, Japan). IR spectra (KBr disks, in cm−1) were obtained using a Bruker Tensor 27 spectrometer (Bruker, Karlsruhe, Germany). NMR spectra (1H: 500 MHz; 13C: 125 MHz) were recorded at 300 K with a Bruker Avance III NMR instrument (Bruker, Karlsruhe, Germany), with TMS as the internal standard. CD3OD (δH = 3.31 and δC = 49.15) was used as the solvent. High-resolution electrospray ionization mass spectra (HRESIMS) data were obtained using an Agilent 6520B UPLC-Q-TOF instrument (Agilent Technologies, Santa Clara, CA, USA). Column chromatography (CC) was carried out using silica gel (Qingdao Marine Chemical Co. Ltd., Qingdao, China), Sephadex LH-20 (Pharmacia, Stockholm, Sweden), and RP-C18 silica (40–63 μm, Fuji, Japan). The fractions obtained from column chromatography were studied via TLC with precoated silica gel GF254 (Qingdao Haiyang Chemical Co., Ltd., China) plates. Analytical HPLC was performed using an Agilent 1200 Series instrument with a DAD detector, using a Shim-pack VPODS column (5 μm, 4.6 × 250 mm; Agilent Technologies, Palo Alto, CA, USA). Preparative HPLC was carried out using Shimadzu LC-10A apparatus equipped with a Shim-pack RP-C18 column (10 μm, 20 × 200 mm, i.d., Shimadzu, Tokyo, Japan) and Shimadzu SPD-20A detector.
4.2. Fungal materials and fermentation
The fungal strain Stachybotrys chartarum PT2-12 was isolated from rhizomes of Pinellia ternata, which were collected from the suburb of Nanjing, Jiangsu Province, People's Republic of China, in October 2014. It was identified according to morphological studies, which were reinforced by 18S rDNA and internal transcribed spacer (ITS) sequences with 100% identity matching to known S. chartarum (GenBank accession No. KC787692.1).
The fungus S. chartarum was cultured on potato dextrose agar (PDA) at 28 °C. Seven days later, agar plugs were cut into small pieces (about 0.3 × 0.3 × 0.3 cm3) under aseptic conditions, 3–4 pieces of which were inoculated in an Erlenmeyer flask (500 mL) containing 200 mL of potato dextrose liquid medium. Then the flasks were incubated on a rotary shaker at 28 °C and 160 rpm for 7 days to prepare the seed culture. Fermentation was carried out in 30 Erlenmeyer flasks (2 L), each containing 320 g of rice and 400 mL of distilled H2O; these were cultivated at 28 °C for 45 days. The solid culture medium was soaked overnight and sterilized at 121 °C for 20 min before use.
4.3. Extraction and isolation
The solid rice material was extracted with an equal volume of ethyl acetate (EtOAc) three times at room temperature, and the organic solvent was evaporated to dryness under vacuum to afford the crude extract (213.0 g). The EtOAc extract was fractionated via silica gel CC using PE (petroleum ether)–EtOAc (v/v: 80 : 1, 40 : 1, 20 : 1, 10 : 1, 5 : 1, 2 : 1, 1 : 1 and 0 : 1) gradient elution to give eight fractions (Fr.1–Fr.8). Fr.7 (1 : 1, 789 mg) was subjected to Sephadex LH-20 CC with CH2Cl2–MeOH (1 : 1) as the eluent, giving nine subfractions (Fr.7.1–Fr.7.9) after combination according to TLC. Fr.7.7 (64.7 mg) was separated via RP-HPLC, eluted with CH3CN–H2O (42 : 58) at a flow rate of 10.0 mL min−1, to afford 5 (1.7 mg; tR = 23.6 min), 8 (3.2 mg; tR = 33.5 min), and 9 (45.4 mg; tR = 44.8 min). Fr.8 (0 : 1; 21.4 g) was repeatedly subjected to chromatography using an ODS column, eluting with gradient MeOH–H2O (v/v: 20 : 80, 30 : 70, 40 : 60, 50 : 50, 60 : 40, 80 : 20 and 100 : 0), giving seven subfractions (Fr.8.1–Fr.8.7) after combination according to TLC. The subfraction Fr.8.4 was purified via preparative HPLC with CH3CN–H2O (40 : 60), to give 7 (5.8 mg; tR = 32.3 min). Fr.8.5 was purified via preparative HPLC with CH3CN–H2O (50 : 50), to give 6 (4.8 mg; tR = 18.8 min), 10 (17.6 mg, tR = 26.5 min), and 11 (31.0 mg; tR = 39.9 min). Fr.8.6 (1.0 g) was further separated via medium pressure preparative HPLC (ODS MPLC) with MeOH–H2O (85 : 15), to give eight fractions (Fr.8.6.1–Fr.8.6.8). Fr.8.6.3 (143.1 mg) was purified via preparative HPLC with CH3CN–H2O (70 : 30) to give 3 (39.1 mg; tR = 13.1 min) and 2 (9.6 mg; tR = 34.1 min). Fr.8.6.4 (116.3 mg) was purified via preparative HPLC with CH3CN–H2O (70 : 30) to give 1 (15.9 mg; tR = 22.8 min). Fr.8.6.7 (89.9 mg) was purified via preparative HPLC with CH3CN–H2O (85 : 15) to give 4 (17.2 mg, tR = 12.9 min).
Stachybochartin A (1)
Yellow powder; [α]25D: −33.5 (c 0.12, MeOH); UV (MeOH) λmax (log ε): 213 (4.27), 288 (3.25) nm; IR (KBr) vmax: 3429, 2928, 1629, 1458, 1358, 1261, 1123, 1083, 1038, 960 cm−1; CD (MeOH) λmax (Δε): 202 (+31.9), 214 (−48.1), and 242 (+3.2) nm; 1H and 13C NMR data: see Table 1; HRESIMS m/z: 797.4232 [M + Na]+ (calcd for C46H62NaO10: 797.4235).
1H (500 MHz) and 13C (125 MHz) NMR data for 1 and 2 in CD3OD.
| Position | 1 | Position | 2 unit A | Position | 2 unit B | |||
|---|---|---|---|---|---|---|---|---|
| δ H, mult. (J in Hz) | δ C | δ H, mult. (J in Hz) | δ C | δ H, mult. (J in Hz) | δ C | |||
| 1/1′′ | 1.82, m | 25.4 | 1 | 1.93, m | 25.9 | 1′′ | 1.82, m | 25.4 |
| 1.05, m | 1.12, m | 1.09, m | ||||||
| 2/2′′ | 1.96, m | 26.1 | 2 | 1.90, m | 23.3 | 2′′ | 1.92, m | 26.1 |
| 1.52, m | 1.53, m | 1.52, m | ||||||
| 3/3′′ | 3.33, m | 76.5 | 3 | 4.58, t (2.4) | 79.7 | 3′′ | 3.32, m | 76.4 |
| 4/4′′ | 38.5 | 4 | 37.8 | 4′′ | 38.5 | |||
| 5/5′′ | 2.18, dd (12.4, 2.0) | 41.5 | 5 | 2.18, dd (11.4, 2.3) | 42.5 | 5′′ | 2.23, dd (11.9, 1.7) | 41.5 |
| 6/6′′ | 1.58, m | 22.3 | 6 | 1.53, m | 22.0 | 6′′ | 1.53, m | 22.0 |
| 1.50, m | 1.60, m | 1.60, m | ||||||
| 7/7′′ | 1.58, m | 32.6 | 7 | 1.56, m | 32.6 | 7′′ | 1.56, m | 32.6 |
| 1.49, m | 1.62, m | 1.62, m | ||||||
| 8/8′′ | 1.82, m | 38.5 | 8 | 1.82, m | 38.1 | 8′′ | 1.83, m | 38.8 |
| 9/9′′ | 98.7 | 9 | 98.6 | 9′′ | 98.6 | |||
| 10/10′′ | 43.5 | 10 | 43.5 | 10′′ | 98.8 | |||
| 11/11′′ | 3.17, d (16.3) | 32.5 | 11 | 3.17, d (16.3) | 32.4 | 11′′ | 3.15, d (16.4) | 32.6 |
| 2.78, d (16.3) | 2.83, d (16.3) | 2.79, d (16.4) | ||||||
| 12/12′′ | 0.76, d (6.5) | 16.0 | 12 | 0.80, d (6.5) | 15.9 | 12′′ | 0.76, d (6.5) | 16.0 |
| 13/13′′ | 0.97, s | 29.0 | 13 | 0.96, s | 28.5 | 13′′ | 0.97, s | 29.0 |
| 14/14′′ | 0.88, s | 23.0 | 14 | 0.91, s | 22.2 | 14′′ | 0.88, s | 23.0 |
| 15/15′′ | 1.03, s | 16.6 | 15 | 1.06, s | 16.3 | 15′′ | 1.03, s | 16.7 |
| 1′/1′′′ | 114.7 | 1′ | 114.6 | 1′′′ | 114.7 | |||
| 2′/2′′′ | 154.8 | 2′ | 155.2 | 2′′′ | 154.9 | |||
| 3′/3′′′ | 6.31, s | 108.7 | 3′ | 6.35, s | 108.8 | 3′′′ | 6.32, s | 108.7 |
| 4′/4′′′ | 134.2 | 4′ | 133.9 | 4′′′ | 134.3 | |||
| 5′/5′′′ | 109.6 | 5′ | 109.2 | 5′′′ | 109.5 | |||
| 6′/6′′′ | 160.7 | 6′ | 160.7 | 6′′′ | 160.5 | |||
| 7′/7′′′ | 4.72, s | 64.1 | 7′ | 4.75, d (2.3) | 64.1 | 7′′′ | 4.76, d (2.3) | 64.4 |
| 8′/8′′′ | 5.7, s | 97.3 | 8′ | 5.71, s | 97.4 | 8′′′ | 5.57, s | 97.8 |
| 8′-OCH3 | 3.66, s | 56.2 | 8′′′-OCH3 | 3.67, s | 56.4 | |||
| 3-OAc | 2.00, s | 21.3 | ||||||
| 172.5 | ||||||||
Stachybochartin B (2)
Yellow powder; [α]25D: −63.6 (c 0.14, MeOH); UV (MeOH) λmax (log ε): 213 (4.82), 288 (3.66) nm; IR (KBr) vmax: 3431, 2925, 1713, 1630, 1457, 1382, 1263, 1124, 1083, 1038, 962 cm−1; CD (MeOH) λmax (Δε): 202 (+21.3), 214 (−33.6), and 241 (+2.8) nm; 1H and 13C NMR data: see Table 1; HRESIMS m/z: 867.4658 [M + Na]+ (calcd for C50H68NaO11: 867.4654).
Stachybochartin C (3)
White powder; [α]25D: −38.3 (c 0.13, MeOH); UV (MeOH) λmax (log ε): 214 (4.63), 287 (3.89) nm; IR (KBr) vmax: 3429, 2932, 2877, 1705, 1623, 1459, 1386, 1350, 1255, 1112 cm−1; CD (MeOH) λmax (Δε): 202 (+1.0), 219 (+16.5), 237 (−10.1), 251 (−0.3), 288 (−9.0), and 345 (+3.3) nm; 1H and 13C NMR data: see Table 2; HRESIMS m/z: 795.4447 [M + Na]+ (calcd for C47H64NaO9: 795.4443).
1H (500 MHz) and 13C (125 MHz) NMR data for 3 and 4 in CD3OD.
| Position | 3 unit A | 3 unit B | 4 unit A | 4 unit B | |||||||
|---|---|---|---|---|---|---|---|---|---|---|---|
| δ H, mult. (J in Hz) | δ C | δ H, mult. (J in Hz) | δ C | δ H, mult. (J in Hz) | δ C | δ H, mult. (J in Hz) | δ C | ||||
| 1 | 1.97, m | 25.5 | 1′′ | 1.45, m | 25.0 | 1 | 2.14, t (12.2) | 31.7 | 1′′ | 1.06, m | 25.0 |
| 1.14, m | 1.05, m | 1.43, m | 1.47, m | ||||||||
| 2 | 1.98, m | 25.9 | 2′′ | 2.00, m | 25.7 | 2 | 5.26, ddd (12.2, 4.0, 2.1) | 69.9 | 2′′ | 1.99, m | 25.7 |
| 1.57, m | 1.58, m | 1.57, m | |||||||||
| 3 | 3.34, m | 76.4 | 3′′ | 3.22, t (2.4) | 77.8 | 3 | 4.94, d (2.1) | 78.2 | 3′′ | 3.23, t (2.6) | 77.9 |
| 4 | 38.6 | 4′′ | 38.8 | 4 | 39.3 | 4′′ | 38.8 | ||||
| 5 | 2.19, dd (11.7, 2.9) | 41.6 | 5′′ | 1.17, m | 41.2 | 5 | 2.26, dd (11.4, 1.8) | 41.8 | 5′′ | 1.21, m | 41.3 |
| 6 | 1.58, m | 22.1 | 6′′ | 1.51, m | 21.7 | 6 | 1.51, m | 21.7 | 6′′ | 1.08, m | 21.5 |
| 1.52, m | 1.13, m | 1.57, m | 1.48, m | ||||||||
| 7 | 1.62, m | 32.6 | 7′′ | 1.58, m | 32.6 | 7 | 1.63, m | 32.0 | 7′′ | 1.20, m | 32.5 |
| 1.53, m | 1.20, m | 1.55, m | 1.60, m | ||||||||
| 8 | 1.87, m | 38.5 | 8′′ | 1.63, m | 37.7 | 8 | 1.89, m | 38.2 | 8′′ | 1.63, m | 37.8 |
| 9 | 99.9 | 9′′ | 98.9 | 9 | 99.0 | 9′′ | 98.9 | ||||
| 10 | 43.5 | 10′′ | 43.4 | 10 | 44.8 | 10′′ | 43.4 | ||||
| 11 | 3.28, d (17.4) | 33.2 | 11′′ | 3.08, d (16.5) | 32.6 | 11 | 3.27, d (17.7) | 33.4 | 11′′ | 3.08, d (16.7) | 32.6 |
| 2.88, d (17.4) | 2.75, d (16.5) | 2.92, d (17.7) | 2.75, d (16.7) | ||||||||
| 12 | 0.75, d (6.4) | 16.4 | 12′′ | 0.65, d (6.4) | 16.2 | 12 | 0.78, d (6.5) | 16.1 | 12′′ | 0.63, d (6.4) | 16.1 |
| 13 | 0.94, s | 29.0 | 13′′ | 0.84, s | 29.2 | 13 | 0.93, s | 28.3 | 13′′ | 0.86, s | 29.2 |
| 14 | 0.88, s | 22.8 | 14′′ | 0.79, s | 23.2 | 14 | 1.05, s | 22.0 | 14′′ | 0.80, s | 23.2 |
| 15 | 1.07, s | 16.6 | 15′′ | 0.90, s | 16.1 | 15 | 1.17, s | 17.1 | 15′′ | 0.91, s | 16.1 |
| 1′ | 123.0 | 1′′′ | 113.0 | 1′ | 122.7 | 1′′′ | 113.1 | ||||
| 2′ | 156.4 | 2′′′ | 153.6 | 2′ | 156.2 | 2′′′ | 153.5 | ||||
| 3′ | 6.76, s | 102.4 | 3′′′ | 6.41, s | 108.7 | 3′ | 6.78, s | 102.2 | 3′′′ | 6.39, s | 108.8 |
| 4′ | 139.6 | 4′′′ | 142.0 | 4′ | 139.5 | 4′′′ | 142.0 | ||||
| 5′ | 125.0 | 5′′′ | 110.2 | 5′ | 127.6 | 5′′′ | 110.4 | ||||
| 6′ | 160.0 | 6′′′ | 161.0 | 6′ | 160.1 | 6′′′ | 161.0 | ||||
| 7′ | 206.4 | 7′′′ | 4.64, d (12.5) | 63.5 | 7′ | 207.1 | 7′′′ | 4.61, s | 63.7 | ||
| 4.57, d (12.5) | |||||||||||
| 8′ | 4.89, d (3.5) | 85.3 | 8′′′ | 4.02, d (3.5) | 55.7 | 8′ | 5.18, d (3.2) | 75.7 | 8′′′ | 3.92, d (3.2) | 59.1 |
| 2-OAc | 2-OAc | 1.88, s | 20.9 | ||||||||
| 172.3 | |||||||||||
| 3-OAc | 3-OAc | 2.09, s | 20.9 | ||||||||
| 173.2 | |||||||||||
| 8′-OCH3 | 3.72, s | 59.0 | |||||||||
Stachybochartin D (4)
White powder; [α]25D: −29.2 (c 0.12, MeOH); UV (MeOH) λmax (log ε): 213 (4.15), 287 (3.43) nm; IR (KBr) vmax: 3431, 2921, 2851, 1713, 1629, 1464, 1385, 1260, 1125, 621 cm−1; CD (MeOH) λmax (Δε): 205 (+1.0), 220 (+21.9), 236 (−19.0), 250 (−1.2), 288 (−15.4), and 344 (+5.4) nm; 1H and 13C NMR data: see Table 2; HRESIMS m/z: 857.4478 [M − H]− (calcd for C50H65O12: 857.4482).
Stachybochartin E (5)
Pale yellow powder; [α]25D: −8.2 (c 0.10, MeOH); UV (MeOH) λmax (log ε): 219 (4.09), 268 (3.34), 309 (3.08) nm; IR (KBr) νmax: 3419, 2922, 2851, 1744, 1628, 1469, 1384, 1334, 1261, 1126, 1088, 957, 619 cm−1; CD (MeOH) λmax (Δε): 219 (+3.77), 268 (−1.04), and 339 (−0.28) nm; 1H and 13C NMR data: see Table 3; HRESIMS m/z: 467.2038 [M + Na]+ (calcd for C25H32NaO7: 467.2040).
1H (500 MHz) and 13C (125 MHz) NMR data for compounds 5–7 in CD3OD.
| Position | 5 | 6 | Position | 7 | |||
|---|---|---|---|---|---|---|---|
| δ H (multi, J in Hz) | δ C | δ H (multi, J in Hz) | δ C | δ H (multi, J in Hz) | δ C | ||
| 1 | 1.73, t (12.2) | 34.7 | 1.83, m | 25.4 | 1 | 154.2 | |
| 1.40, dd (12.2, 4.3) | 1.09, m | ||||||
| 2 | 4.07, ddd (12.2, 4.3, 2.6) | 65.7 | 1.97, m | 26.0 | 2 | 117.7 | |
| 1.52, m | |||||||
| 3 | 4.87, d (2.6) | 81.4 | 3.34, t (3.4) | 76.4 | 3 | 150.2 | |
| 4 | 39.2 | 38.7 | 4 | 6.70, s | 109.2 | ||
| 5 | 2.04, m | 41.7 | 2.13, dd (11.6, 2.6) | 41.4 | 5 | 140.4 | |
| 6 | 1.60, m | 21.5 | 1.54, m | 22.1 | 6 | 116.4 | |
| 1.50, m | 1.60, m | ||||||
| 7 | 1.50, m | 32.1 | 1.59, m | 32.3 | 7 | 4.91, s | 56.0 |
| 1.65, m | 1.53, m | ||||||
| 8 | 1.91, m | 37.8 | 1.86, m | 38.4 | 8 | 4.79, d (1.1) | 63.4 |
| 9 | 100.1 | 99.8 | 1′ | 117.8 | |||
| 10 | 44.8 | 43.5 | 2′ | 7.51, s | 140.0 | ||
| 11 | 3.29, d (17.5) | 32.9 | 3.23, d (17.0) | 33.0 | 3′ | 3.69, sext (6.1) | 68.8 |
| 2.96, d (17.5) | 2.85, d (17.0) | ||||||
| 12 | 0.79, d (6.5) | 15.9 | 0.73, d (6.5) | 15.9 | 4′ | 1.59, m | 38.4 |
| 1.47, m | |||||||
| 13 | 0.92, s | 28.4 | 0.98, s | 28.9 | 5′ | 1.99, m | 27.3 |
| 1.33, m | |||||||
| 14 | 1.00, s | 22.1 | 0.89, s | 23.0 | 6′ | 2.96, dd (10.6, 3.0) | 42.4 |
| 15 | 1.13, s | 17.3 | 1.05, s | 16.5 | 7′ | 85.3 | |
| 1′ | 121.6 | 119.0 | 8′ | 1.64, m | 39.8 | ||
| 1.55, m | |||||||
| 2′ | 156.7 | 155.2 | 9′ | 2.10, m | 23.3 | ||
| 3′ | 6.74, s | 103.7 | 6.67, s | 102.2 | 10′ | 4.97, t (7.1) | 125.0 |
| 4′ | 119.4 | 114.5 | 11′ | 132.6 | |||
| 5′ | 128.2 | 134.7 | 12′ | 1.60, s | 25.8 | ||
| 6′ | 156.5 | 157.5 | 13′ | 1.51, s | 17.6 | ||
| 7′ | 173.5 | 171.4 | 14′ | 1.37, s | 22.0 | ||
| 8′ | 5.31, d (14.8) | 68.8 | 4.55, d (17.0) | 48.9 | 15′ | 1.13, d (6.2) | 23.5 |
| 5.16, d (14.8) | 4.38, d (17.0) | ||||||
| 9′ | 3.84, m | 42.9 | |||||
| 10′ | 4.32, m | 63.2 | |||||
| 3-OAc | 172.9 | ||||||
| 2.09, s | 21.1 | ||||||
| 10′-OAc | 172.7 | ||||||
| 2.03, s | 20.7 | ||||||
Stachybochartin F (6)
Yellow powder; [α]25D: −27.7 (c 0.14, MeOH); UV (MeOH) λmax (log ε): 218 (4.16), 264 (3.52), 300 (3.14) nm; IR (KBr) νmax: 3422, 2924, 2875, 1742, 1670, 1468, 1387, 1349, 1239, 1142, 1079, 622 cm−1; CD (MeOH) λmax (Δε): 215 (+2.29), 264 (−2.41), and 338 (−0.17) nm; 1H and 13C NMR data: see Table 3; HRESIMS m/z: 472.2693 [M + H]+ (calcd for C27H38NO6: 472.2694).
Stachybochartin G (7)
Yellow gum; [α]25D: −27.8 (c 0.10, MeOH); UV (MeOH) λmax (log ε): 220 (4.00), 258 (3.41), 262 (3.42), 282 (3.00) nm; IR (KBr) νmax: 3423, 2921, 2851, 1648, 1384, 1126, 619 cm−1; CD (MeOH) λmax (Δε): 219 (+18.1), 259 (−7.1) nm; 1H and 13C NMR data: see Table 3; HRESIMS m/z: 411.2141 [M + Na]+ (calcd for C23H32NaO5: 411.2142).
4.4. Cell cultures
MDA-MB-231 (human triple-negative breast cancer), MCF-7 (human breast cancer) and U-2OS (human osteosarcoma) cells were obtained from the Cell Bank of the Shanghai Institute of Biochemistry and Cell Biology, Chinese Academy of Sciences (Shanghai, China). MDA-MB-231 was cultured in DMEM medium. MCF-7 cells and U-2OS cells were cultured in RPMI-1640 medium. All cell lines were supplemented with 10% FBS containing 50 μg mL−1 penicillin and 50 μg mL−1 streptomycin, and were grown in an incubator at 37 °C with 5.0% CO2 under a humidified environment.
4.5. Cell viability assays and colony formation assays
Cell viability was measured via a standard colorimetric test using MTT. Cells were plated in standard 96-well culture plates (5 × 10³ cells per well). After a 24 h period of incubation, cells were treated with various concentrations of stachybochartin C (3) or stachybochartin G (7) for 24, 48 and 72 h. DMSO (0.1%) was used as a vehicle, the final concentration of which was less than 0.1% (v/v). 20 μL of MTT (5 mg mL−1) solution was added to each well and the plates were incubated for about four hours. The formed formazan crystals were dissolved in DMSO (150 μL per well) under constant shaking for 10 min. The absorbance of formazan production was measured using an ELISA reader (SpectraMax Plus384, Molecular Devices, Sunnyvale, CA) at 570 nm (test wavelength) and 650 nm (reference wavelength). Cell viability was calculated via the following formula:% cell viability = (At/As) × 100%where At and As denote the absorbances of the test substance and solvent control, respectively.
For colony formation, 1000 cells were plated in 6-well culture plates. After treatment with various concentrations of stachybochartin C, stachybochartin G, and 0.1% DMSO for 14 days, the cells were stained with crystal violet solution (Beyotime, Jiangsu, China). The cell viability assays and colony formation assays were performed as previously described.27
4.6. Annexin V-Alexa Fluor 647/PI staining assay for cell apoptosis
U-2OS cells were treated with various concentrations of stachybochartin C or stachybochartin G for 48 h. For flow cytometry, 1 × 10⁶ cells in 100 μL of binding buffer were stained with 5 μL of Annexin V-Alexa Fluor 647 (BD Biosciences, San Jose, CA, USA) and 5 μL of PI (Miltenyi Biotec, Shanghai, China). After incubation at room temperature and protection from light for 30 min, the cells were then analyzed via flow cytometry (488 nm excitation and 647 nm emission filters) using a BD Accuri C6 flow cytometer.
4.7. Western blot analysis
U-2OS cells were incubated with various concentrations of stachybochartin G or 0.1% DMSO for 24 h. After harvesting, the cells were treated with cell lysis buffer (Beyotime, Jiangsu, China) to extract the total proteins and centrifuged at 12 000 rpm for 10 min. Proteins were extracted for western blot analysis, as previously described.28 Bound immuno-complexes were detected using the ChemiDOC™ XRS+ system (BioRad Laboratories, Hercules, CA).
Conflicts of interest
The authors declare that they have no conflicts of interest.
Supplementary Material
Acknowledgments
This research work was supported by the National Natural Science Foundation of China (81602985), the Program for Changjiang Scholars and the Innovative Research Team in University (IRT_15R63), the 111 Program of Introducing Talents of Discipline to Universities (B18056), and the Priority Academic Program Development of Jiangsu Higher Education Institutions (PAPD). The ECD calculations were supported by the High Performance Computing Center, China Pharmaceutical University.
Electronic supplementary information (ESI) available. See DOI: 10.1039/c8ra10195g
References
- Wang A. Xu Y. Gao Y. Huang Q. Luo X. An H. Dong J. Phytochem. Rev. 2014;14:623–655. doi: 10.1007/s11101-014-9365-1. [DOI] [Google Scholar]
- Kim J. W. Ko S. K. Kim H. M. Kim G. H. Son S. Kim G. S. Hwang G. J. Jeon E. S. Shin K. S. Ryoo I. J. Hong Y. S. Oh H. Lee K. H. Soung N. K. Hashizume D. Nogawa T. Takahashi S. Kim B. Y. Osada H. Jang J. H. Ahn J. S. J. Nat. Prod. 2016;79:2703–2708. doi: 10.1021/acs.jnatprod.6b00641. [DOI] [PubMed] [Google Scholar]
- Sawadjoon S. Kittakoop P. Isaka M. Kirtikara K. Madla S. Thebtaranonth Y. Planta Med. 2004;70:1085–1087. doi: 10.1055/s-2004-832652. [DOI] [PubMed] [Google Scholar]
- Kaise H. Shinohara M. Miyazaki W. Izawa T. Nakano Y. Sugawara M. Sugiura K. Sasaki K. J. Chem. Soc., Chem. Commun. 1979;16:726–727. doi: 10.1039/C39790000726. [DOI] [Google Scholar]
- Vázquez M. J. Vega A. Rivera-Sagredo A. Jiménez-Alfaro M. D. Díez E. Hueso-Rodríguez J. A. Tetrahedron. 2004;60:2379–2385. doi: 10.1016/j.tet.2004.01.014. [DOI] [Google Scholar]
- Li Y. Wu C. Liu D. Proksch P. Guo P. Lin W. J. Nat. Prod. 2014;77:138–147. doi: 10.1021/np400824u. [DOI] [PubMed] [Google Scholar]
- Corey E. J. Das J. J. Am. Chem. Soc. 1982;104:5551–5553. doi: 10.1021/ja00384a075. [DOI] [Google Scholar]
- Cano M. J. Bouanou H. Tapia R. Alvarez E. Alvarez-Manzaneda R. Chahboun R. Alvarez-Manzaneda E. J. Org. Chem. 2013;78:9196–9204. doi: 10.1021/jo4014047. [DOI] [PubMed] [Google Scholar]
- Falck J. R. Kishta Reddy K. Chandrasekhar S. Tetrahedron Lett. 1997;38:5245–5248. doi: 10.1016/S0040-4039(97)01146-5. [DOI] [Google Scholar]
- Ogawa K. Nakamura M. Hayashi M. Yaginuma S. Yamamoto S. Furihataf K. Shin-yaft K. Seto H. J. Antibiot. 1995;48:1396–1400. doi: 10.7164/antibiotics.48.1396. [DOI] [PubMed] [Google Scholar]
- Wu B. Oesker V. Wiese J. Malien S. Schmaljohann R. Imhoff J. F. Mar. Drugs. 2014;12:1924–1938. doi: 10.3390/md12041924. [DOI] [PMC free article] [PubMed] [Google Scholar]
- Li Y. Wu C. Liu D. Proksch P. Guo P. Lin W. J. Nat. Prod. 2014;77:435. doi: 10.1021/np500081v. [DOI] [PubMed] [Google Scholar]
- Ding Z. G. Ding J. H. Zhao J. Y. Chunyu W. X. Li M. G. Gu S. J. Wang F. Wen M. L. Fitoterapia. 2018;125:94–97. doi: 10.1016/j.fitote.2017.12.022. [DOI] [PubMed] [Google Scholar]
- Ding Z. G. Zhao J. Y. Ding J. H. Chunyu W. X. Li M. G. Gu S. J. Wang F. Wen M. L. Nat. Prod. Res. 2018;32:2370–2374. doi: 10.1080/14786419.2017.1413565. [DOI] [PubMed] [Google Scholar]
- Roggo B. E. Hug P. Moss S. Stampfli A. Kriemler H. P. Peter H. H. J. Antibiot. 1996;49:374–379. doi: 10.7164/antibiotics.49.374. [DOI] [PubMed] [Google Scholar]
- Li T. X. Yang M. H. Wang Y. Wang X. B. Luo J. Luo J. G. Kong L. Y. Sci. Rep. 2016;6:38958. doi: 10.1038/srep38958. [DOI] [PMC free article] [PubMed] [Google Scholar]
- Gombodorj S. Yang M. H. Shang Z. C. Liu R. H. Li T. X. Yin G. P. Kong L. Y. Fitoterapia. 2017;120:72–78. doi: 10.1016/j.fitote.2017.05.014. [DOI] [PubMed] [Google Scholar]
- Yang M. H. Li T. X. Wang Y. Liu R. H. Luo J. Kong L. Y. Fitoterapia. 2017;116:72–76. doi: 10.1016/j.fitote.2016.11.008. [DOI] [PubMed] [Google Scholar]
- Gao N. Shang Z. C. Yu P. Luo J. Jian K. L. Kong L. Y. Yang M. H. Chin. Chem. Lett. 2017;28:1194–1199. doi: 10.1016/j.cclet.2017.02.022. [DOI] [Google Scholar]
- Kwon Y. J. Sohn M. J. Kim H. J. Kim W. G. Biol. Pharm. Bull. 2014;37:1406–1410. doi: 10.1248/bpb.b14-00108. [DOI] [PubMed] [Google Scholar]
- Berova N. Bari L. D. Pescitelli G. Chem. Soc. Rev. 2007;36:914–931. doi: 10.1039/B515476F. [DOI] [PubMed] [Google Scholar]
- Li W. S. Wu J. Li J. Satyanandamurty T. Shen L. Bringmann G. Org. Lett. 2017;19:182–185. doi: 10.1021/acs.orglett.6b03479. [DOI] [PubMed] [Google Scholar]
- Jarvis B. B. Salemme J. Morais A. Nat. Toxins. 1995;3:10–16. doi: 10.1002/nt.2620030104. [DOI] [PubMed] [Google Scholar]
- Zhao J. Feng J. Tan Z. Liu J. Zhao J. Chen R. Xie K. Zhang D. Li Y. Yu L. Chen X. Dai J. J. Nat. Prod. 2017;80:1819–1826. doi: 10.1021/acs.jnatprod.7b00014. [DOI] [PubMed] [Google Scholar]
- Bao Y. R. Chen G. D. Wu Y. H. Li X. X. Hu D. Liu X. Z. Li Y. Yao X. S. Gao H. Fitoterapia. 2015;105:151–155. doi: 10.1016/j.fitote.2015.06.022. [DOI] [PubMed] [Google Scholar]
- Boatright K. M. Salvesen G. S. Curr. Opin. Cell Biol. 2003;15:725–731. doi: 10.1016/j.ceb.2003.10.009. [DOI] [PubMed] [Google Scholar]
- Zhang C. Yang L. Wang X. B. Wang J. S. Geng Y. D. Yang C. S. Kong L. Y. Cancer Lett. 2013;340:51–62. doi: 10.1016/j.canlet.2013.06.021. [DOI] [PubMed] [Google Scholar]
- Zhang J. Chiu J. Zhang H. Qi T. Tang Q. Ma K. Lu H. Li G. Biochem. Pharmacol. 2013;86:317–328. doi: 10.1016/j.bcp.2013.05.003. [DOI] [PubMed] [Google Scholar]
Associated Data
This section collects any data citations, data availability statements, or supplementary materials included in this article.


