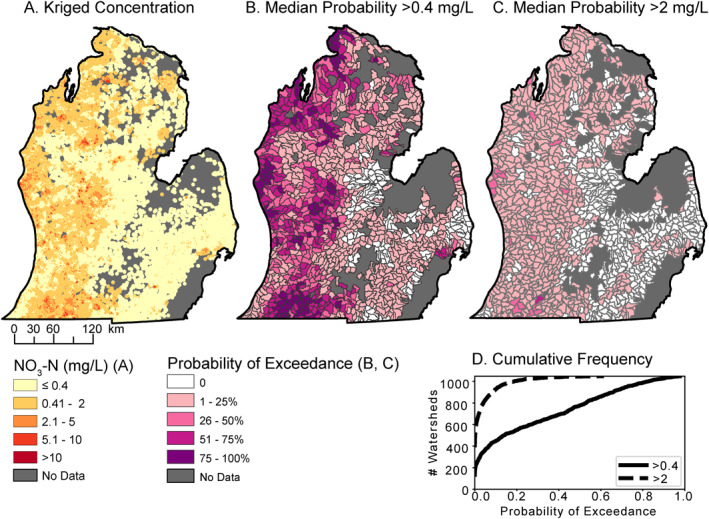
Figure 3.

Nitrate estimates for the quaternary aquifer based on samples from 2006 to 2015: (a) Predicted NO3‐N concentration clipped to areas of confidence at 250 m resolution, (b) median probability of exceeding 0.4 mg/L NO3‐N at HUC12 watershed level, which is the most common detection limit in this region during this sampling period. (c) Median probability of exceeding 2 mg/L NO3‐N at HUC12 watershed level. (d) Cumulative frequency of watersheds at both exceedance levels. Note: Low median probabilities can be of significant consequence at local scales.
