Abstract
The transportation industry plays an important role in the world economy. Diesel engines are still widely used as the main power generator for trucks, heavy machinery and ships. Removal technology for nitrogen oxides in diesel exhaust are of great concern. In this paper, a gas supply system for simulating the marine diesel engine exhaust is set up. An experimental study on exhaust denitration is carried out by using a dielectric barrier discharge (DBD) reactor to generate non-thermal plasma (NTP). The power efficiency and the denitration efficiency of different gas components by NTP are discussed. The exhaust gas reaction mechanism is analyzed. The application prospects of NTP are explored in the field of diesel exhaust treatment. The experimental results show that the power efficiency and energy density (ED) increase with the input voltage for this system, and the power efficiency is above 80% when the input voltage is higher than 60 V. The removal efficiency of NO is close to 100% by NTP in the NO/N2 system. For the NO/O2/N2 system, the critical oxygen concentration (COC) increases with NO concentration. The O2 concentration plays a decisive role in the denitration performance of the NTP. H2O contributes to the oxidative removal of NO, and NH3 improves the removal efficiency at low ED while slightly reducing the denitration performance at high ED. CO2 has little effect on NTP denitration performance, but as the ED increases, the generated CO gradually increases. When simulating typical diesel engine exhaust conditions, the removal efficiency increases first and then decreases with the increase of ED in the NO/O2/CO2/H2O/N2 system. After adding NH3, the removal efficiency of NOx reaches up to 40.6%. It is necessary to add reducing gas, or to combine the NTP technology with other post treatment technologies such as SCR catalysts or wet scrubbing, to further increase the NTP denitration efficiency.
The experimental study on exhaust denitration is carried out by using dielectric barrier discharge (DBD) reactor to generate non-thermal plasma (NTP).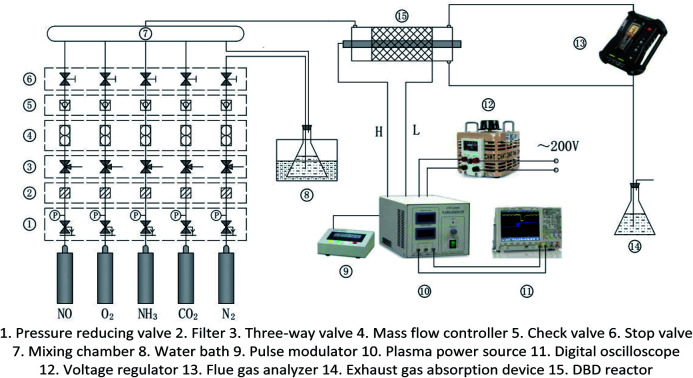
1. Introduction
Today, diesel engines are still widely used in the fields of road transport and non-road machinery and are dominant as the main power and generation power units in the marine sector. Exhaust pollutants such as hydrocarbons (HC), particulate matter (PM), SOx and NOx are inevitably generated during the operation of the diesel engine. These exhaust pollutants not only cause acid rain, building and soil corrosion, but also endanger human health and lead to diseases such as cancer and respiratory diseases. The SOx and NOx emission of ocean-faring vessels has been limited by IMO's MARPOL73/78 Annex VI.1 The removal technologies of diesel exhaust pollutants include pre-treatment, in-machine treatment and post-treatment.2,3 The post-treatment technologies that can remove a variety of diesel exhaust pollutants at the same time have gained higher attention.
Plasma, the fourth form of matter, was discovered in the mid-18th century. It can generally be classified into high temperature plasma, thermal equilibrium plasma, and non-thermal equilibrium plasma depending on the temperature of the particles. It is used in a variety of fields such as welding and cutting,4 surface modification of materials,5–7 and the removal of contaminants.8–10 At present, the research on non-thermal equilibrium plasma (NTP) is the most extensive. The methods for generating NTP mainly include electron beam method,9,11,12 microwave irradiation method,5–7,13,14 high voltage discharge method (including DC, AC and pulse power),2,15–17etc. The method of pulse power combined with the dielectric barrier discharge (DBD) reactor to generate NTP has many advantages, such as higher power efficiency, uniform and silent discharge.18–21 So it receives more attention. NTP used for exhaust post-treatment began in the 1970s and is one of the hotspots. It is almost no secondary pollution and has a good application prospect.
There are two ways for NTP to remove NO. One is to form N2 and O2 by reduction, and the other is to form higher valence oxides by oxidation, such as NO2, N2O5, etc.12,22 Moreover, diesel exhaust contains a large amount of N2 (≈76%) and O2 (≈14%),23 and because the dissociation energy of O2 (5.2 eV mol−1) is smaller than N2 (9.8 eV mol−1),24 O2 will be converted to stronger oxidizing substance such as oxygen radical (·O) and O3. These reasons make it more unfavorable to remove NO by the reduction route. NO which is difficult to remove in the exhaust gas is converted into other components, whether it is reduced to N2 or oxidized to high-valent nitrogen oxides, the denitration efficiency can be increased. We mainly focus on the denitration efficiency, and the exact percentage of NO reduction to N2 will no long be discussed in the paper.
Zhang and Zhou25,26 used pulse corona discharge plasma combined with lye absorption for desulfurization and denitration simultaneously. They studied NO oxidation efficiency and removal efficiency by parameters such as gas flow, discharge current, NO concentration and SO2 concentration. But they did not consider the effect of O2 concentration on NTP NOx removal efficiency. Some studies24,27 show that with the increasing of O2 concentration, the removal efficiency of NOx gradually decreases, and there is so called critical oxygen concentration (COC) at which the NOx removal efficiency is zero, which means the reduction rate of converting NOx to N2 and O2 is equal to the oxidation rate of converting N2 to NOx. And critical O2 concentration may change with initial NO concentration. Mok et al.16 used pulsed corona discharge NTP to study the effect of O2 concentration, humidity and peak voltage on the removal efficiency, but the NO concentration was only 210 ppm (1 ppm = 1 μL L−1) in their experiment. Zhao et al.24 studied the removal efficiency of corona discharge NTP at different O2 concentrations (0–13.6%), but the NO concentration in this study was only 437 ppm, which was much smaller than that of typical real ship diesel exhaust. What's more, both H2O and CO2 are inevitable components in diesel exhaust. These components may affect the NTP denitration reaction, while Zhao24 and Aritoshi27 did not consider the effect of H2O on NTP denitration performance. And most researchers have not considered the effect of CO2 on NTP denitration performance. Also, the denitration mechanism of NTP is not the same under different gas composition, and still needs further exploration. In addition, because the exhaust gas temperature changes with the diesel engine power, and engine exhaust gas generally contains SO2 (the concentration varies with the sulfur content of the fuel used, such as the concentration of SO2 in the exhaust gas is about 600 μL L−1 for marine large low-speed two-stroke diesel engine when using heavy fuel oil of 3.5% sulfur content23), both temperature and SO2 will have a certain impact on the NTP denitration efficiency. Chmielewski et al.12 studied the effects of different temperatures (70 °C and 90 °C) and the SO2 concentration (0–2000 μL L−1) on the NTP denitration efficiency. Their experimental results show that the plasma denitration efficiency will increase with the temperature, so as the SO2 concentration. We want to investigate the NTP denitration efficiency in the poor cases and the application prospect of NTP. Therefore, the influence of temperature and SO2 concentration on the NTP denitration efficiency is not considered in this paper. All experiments are carried out at room temperature of 25 °C and the concentration of SO2 is zero.
In summary, in order to study the effects of energy density, different initial NO, O2, NH3, H2O and CO2 on the NTP denitration performance, a simulating diesel exhaust supply system was set up in this paper. A coaxial cylindrical DBD reactor was designed and fabricated with quartz glass. Non-thermal plasma was generated by pulsed power. NOx removal mechanism was proposed and analyzed by experimental results. The application prospects of NTP were explored in the field of diesel exhaust treatment.
2. Approach
The exhaust composition of a typical large-scale low-speed two-stroke diesel engine is shown in Table 1. NO accounts for more than 90% of NOx in the diesel exhaust, the rest mainly being NO2, and NO is relatively more difficult to remove. Therefore, this paper mainly focuses on the removal of NO. The concentration of NO in the diesel exhaust will change with the engine load, and generally does not exceed 1500 μL L−1. Therefore, three NO concentrations indicating the emissions at different engine loads are studied in the paper, including the low NO concentration (500 μL L−1), the medium NO concentration (1000 μL L−1) and the high NO concentration (1500 μL L−1). When NH3 is needed, it is added at an ammonia–nitrogen ratio of 1. The highest O2 concentration in engine exhaust gas is 14%, and in order to study the changes of critical O2 concentrations with initial NO concentrations, the final selected O2 concentrations are 1%, 5%, 8%, 10% and 14%, respectively. H2O can generate a variety of strong oxidizing free radicals in NTP, including ·HO2, ·OH and H2O2. They will have a certain influence on the NTP denitration performance. Therefore, three groups of experiments with H2O concentrations of 0%, 3.5% and 5.1% are selected for comparison. Because the experimental results show that CO2 has little effect on the NTP denitration performance, 0% and 4.5% CO2 concentration are selected for comparative analysis in this paper. Considering the different components in the diesel exhaust and the performance of the power source, the gas components of each experiment vary from simple to complex. Because N2 accounts for the largest proportion in the exhaust gas, it is used as carrier gas in our experiments. In addition, O2 accounts for the second proportion in the exhaust gas and has the fundamental effect on the NTP denitration performance, the experiments of single component gas in NTP are carried both in NO/N2 system and O2/N2 system. Other gases do not seem to be major players in this case and given the length of the article, they are not included in this paper so far. The following research is carried out:
Low-speed two-stroke diesel engine exhaust composition (volume fraction)23.
| Components | N2 (%) | O2 (%) | CO2 (%) | H2O (%) | NOx (μL L−1) |
| Volume fraction | 76.2 | 14 | 4.5 | 5.1 | 1500 |
(1) The denitration performance of NTP is strongly related to the energy density in DBD, and the output efficiency of the power source is an important factor to be considered in future industrial applications. Therefore, the energy density and power supply efficiency varying with different input voltages and currents were studied firstly under a typical diesel exhaust condition, i.e., 1500 μL L−1 NO + 14% O2 + 5.1% H2O + 4.5% CO2 + 76.2% N2. Secondly, to understand the removal mechanism of the single-component NO exhaust, and the effect of the NO concentration on the power supply characteristics under a specific ideal condition, we carried out a group of experiments in NO/N2 system, where initial NO concentrations were 500 μL L−1, 1000 μL L−1 and 1500 μL L−1, respectively.
(2) Since N2 and O2 are the main components of diesel exhaust, O2 will be converted to a large amount of oxygen active particles with strong oxidative in NTP system, and N2 will also be converted to nitrogen active particles. These active particles will recombine to a certain concentration of NOx, which will partially offset the NOx removal effect of NTP. Therefore, the oxidative formation of NOx at different energy densities was investigated in O2/N2 system with the O2 concentration of 1%, 5%, 10% and 14%, respectively.
(3) It is expected that NO is converted to N2 and O2 through the reduction route. And the mechanism of NO removal by reduction way needs further study. Therefore, we carried out these experiments in NO/N2 system with the initial NO concentrations of 500 μL L−1, 1000 μL L−1 and 1500 μL L−1, respectively.
(4) As mentioned above, there is a critical oxygen concentration (COC) that makes the NOx removal efficiency zero. When the O2 concentration is higher than the COC, the NTP will not have denitration ability with the ED increasing. It even leads to the increase of the NOx. While when the O2 concentration is lower than the COC, the removal efficiency increases with the ED. What's more, the COC is also related to the initial NO concentration. Therefore, we investigated the range of the COC at initial NO concentrations of 500 μL L−1, 1000 μL L−1 and 1500 μL L−1, respectively.
(5) NH3 is often used as reducing agent in traditional selective catalytic reduction (SCR) denitration, while the NTP denitration performance and mechanism are not well understood when NH3 exists. To this end, the effect of NH3 in NO/O2/N2 system was studied at O2 concentrations of 1%, 5%, 8%, 10% and 14% with initial NO concentrations of 500 μL L−1, 1000 μL L−1 and 1500 μL L−1, respectively.
(6) H2O is an inevitable component in diesel exhaust. H2O will generate strong oxidizing hydroxyl radical (·OH) by the action of NTP, which will further inhibit NO reduction removal. When NH3 is added to the system, the NO removal reactions will be more complicated. In this paper, the NTP denitration performance was studied in NO/O2/H2O/N2 system with initial NO concentrations of 500 μL L−1, 1000 μL L−1 and 1500 μL L−1, O2 concentration of 14% and H2O concentrations of 0%, 3.5% and 5.1%, respectively. These results were also compared with that when NH3 was added.
(7) CO2 is the fourth major component of diesel exhaust. At present, most studies ignore the effect of CO2 on NTP denitration performance. However, CO2 may convert to CO in NTP, and CO has been used as the reducing agent for denitration in some reports.28–31 Therefore, in order to study the possible effects of CO2 on NTP denitration, we added 4.5% CO2 in NO/O2/H2O/N2 system with initial NO concentrations of 500 μL L−1, 1000 μL L−1 and 1500 μL L−1, O2 concentration of 14% and H2O concentration of 5.1%, respectively. Then NH3 was added in NO/O2/H2O/CO2/N2 system to investigate the possible changes.
(8) Finally, based on the above experimental results, the NTP denitration mechanism of simulating diesel exhaust is proposed in the paper, and the application prospect of NTP denitration in the field of marine diesel exhaust is discussed.
3. Experimental system and data processing
3.1. Experimental system
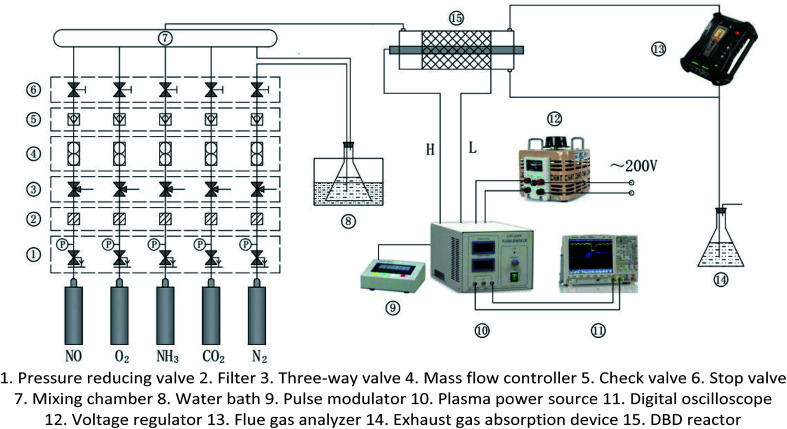
The experimental system is shown in Fig. 1. It mainly includes gas supply unit, pulse plasma power unit, DBD reactor, flue gas analyzer (Testo350, Germany), and exhaust absorption device. The gas supply unit mainly includes gas cylinder, pressure reducing valve, mass flow controller (Beijing Sevenstar CS200A, D, China), mixing chamber. The pulse plasma power unit mainly includes plasma power source (Nanjing Suman CTP-2000K, China), pulse modulator (Nanjing Suman PC-07, China), voltage regulator (Zhejiang Chint TDGC2-1, China), digital oscilloscope (Agilent MSO7104B, USA). N2, O2 and CO2 are high-purity standard gas. NO is 10% standard gas with N2 as the carrier gas, and so as NH3. H2O is added by the N2 bubbling method with constant temperature water bath. The DBD reactor is made of quartz glass. The structure and dimensions are shown in Fig. 2. The left end of the reactor is inlet, and the right end is outlet and detection port. The inner diameter of the reactor body is 24 mm, and the outer diameter is 27 mm. A copper rod is inserted in the reactor body as high-voltage electrode which is 550 mm long and 15 mm in diameter. The surface of the copper rod is machined with thread which is 2 mm in pitch and 1 mm in depth. The outer surface of the reactor is coated with 60 mesh copper net connected with the low voltage electrode of the power source. The discharge space is 4.5 mm.
Fig. 1. Experimental system of DBD denitration.
Fig. 2. Structure and dimensions of DBD reactor.
3.2. Experimental method
The total gas flow is kept constant at 2 L min−1 with N2 as carrier gas in all experiments. The concentrations of N2, NO, CO2, O2, and NH3 in the DBD reactor are adjusted by the mass flow controllers. The H2O is added in by bubbling method, and its concentration is controlled by the temperature of the water bath. Before each group of experiments, the plasma power source is kept off and the initial gas concentration is adjusted to the demanded level according to the flue gas analyzer's measurement. Then the plasma power source is turned on to generate NTP in the DBD reactor. The output power of the power source is adjusted by input voltage and input current. And the concentrations of the DBD reactor outlet gas at different powers are monitored continuously. The input voltage of the plasma power source is controlled by the voltage regulator, and the input current is controlled by the frequency adjustment knob of the plasma power source. When the input voltage is constant, the input current can adjust to the maximum value by the frequency knob. It is also the maximum input power at the voltage, and the frequency of the output sine wave is generally 6–8 kHz.
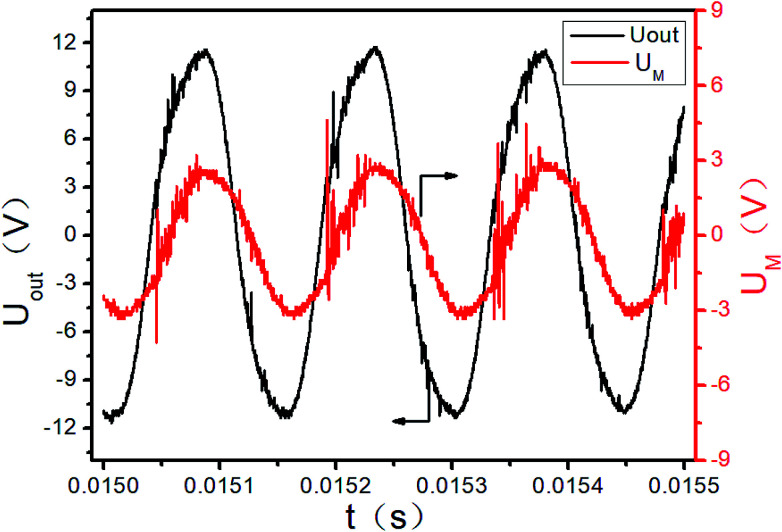
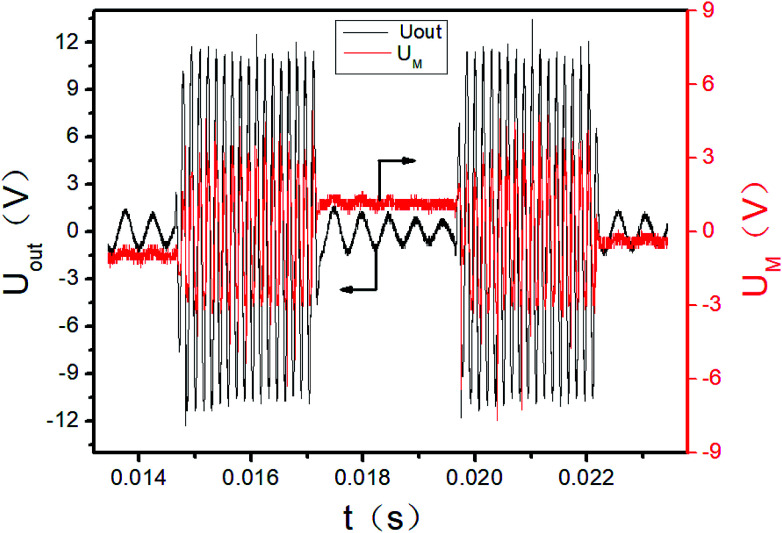
The initial output of the plasma power source is sine waves with certain frequency, as shown in Fig. 3. The sine waves with certain frequency can be modulated into pulse waves with different duty cycles and pulse frequencies by the pulse modulator, as shown in Fig. 4. The attenuation ratio K of output voltage Uout is 1000 : 1 in Fig. 3 and 4, which means the true coordinate unit of Uout is kV (in order to be consistent with the calculation process below, the unit of Uout is still set as V in the Fig. 3, 4 and 6). In all these experiments, the pulse frequency and the duty cycle are kept at 200 Hz and 50%, respectively.
Fig. 3. Sine wave of the initial power output (partial).
Fig. 4. Pulse signal of power output (2 cycles).
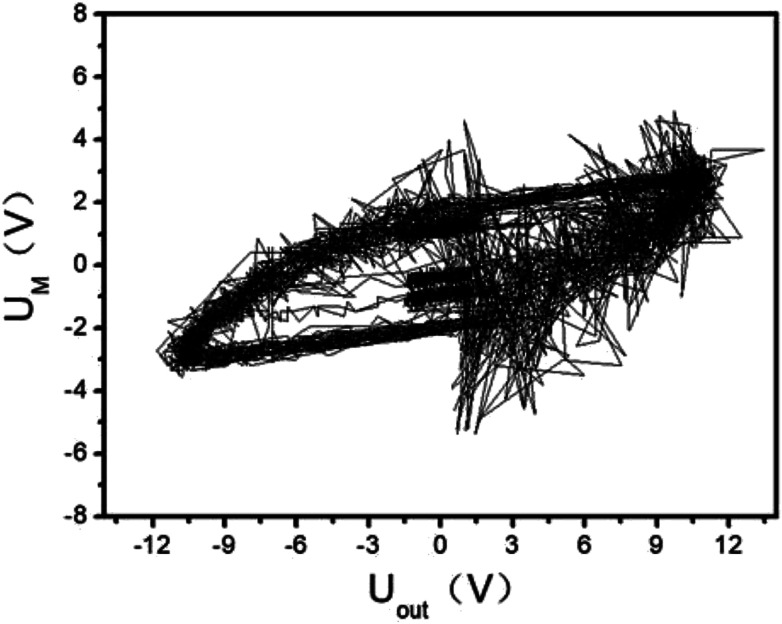
Fig. 6. Diagram of Lissajous integral area.
3.3. Data processing
The NOx removal efficiency is calculated according to the imported and exported NOx concentration of DBD recorded by the flue gas analyzer. The input power of the power source is calculated according to the input voltage and current. The output power of the power source is calculated according to the output waveform of the power source recorded by the digital oscilloscope. The power efficiency and the energy density were calculated further.
The removal efficiency of NOx is calculated by the following formula:
 |
1 |
Here ηNOx is the removal efficiency of NOx, %; Cin is the inlet NOx concentration (the sum of NO and NO2 concentration), μL L−1; Cout is the outlet NOx concentration, μL L−1.
The input power of the plasma power source is calculated as follows:
| Pin = UinIin | 2 |
Here Pin is the input power of the plasma power source, W; Uin is the input voltage of the power source, V; Iin is the input current of the power source, A.
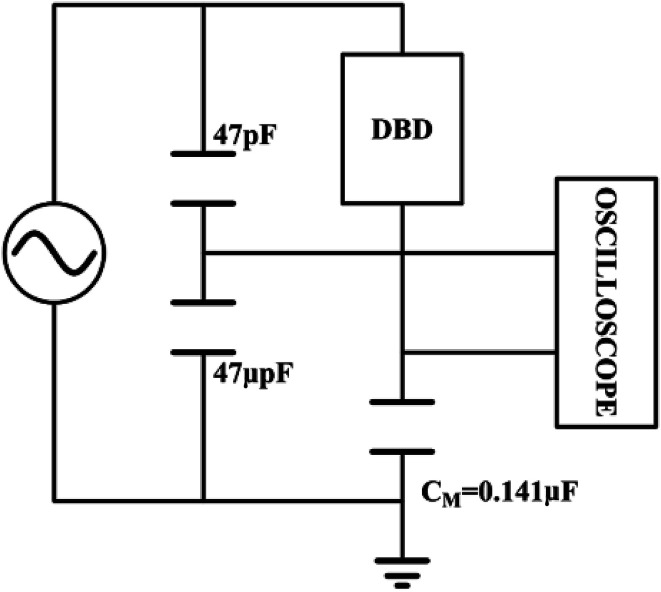
The output power of the plasma power source is calculated by the voltage-electric charge Lissajous method.32–34 Its equivalent circuit is shown in Fig. 5. The measurement principle is that a 0.141 μF capacitor CM is connected in series with the low-voltage end of the DBD reactor. The voltage UM of the capacitor CM is measured by the digital oscilloscope. The electric charge Q of the DBD discharge is equal to the capacitor CM. The current flowing through the loop is calculated as:
 |
3 |
Fig. 5. Equivalent circuit diagram for discharging power by voltage-charge method.
The discharge power is defined as:
 |
4 |
The UM and Uout are measured by the digital oscilloscope. When the input voltage is 100 V and the input current is 0.8 A, the curves of the high-voltage signal Uout and UM are shown in Fig. 4. The waveforms during 0.0150–0.0155 seconds of Fig. 4 are shown in Fig. 3. The Lissajous figure is shown in Fig. 6 with Uout as the X-axis and UM as the Y-axis. The Lissajous figure area A of a single pulse period is calculated by integration tool of origin. The sensitivity of the oscilloscope in the X and Y directions is KX and KY, respectively. The output power by voltage-electric charge Lissajous method can be defined as:
| Pout = fKCMKXKYA | 5 |
The power efficiency of NTP can be expressed as:
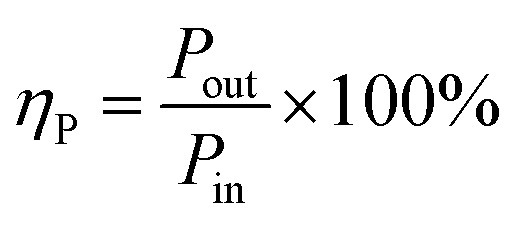 |
6 |
The output power of the plasma power source is equal to the power loaded in the DBD reactor. The energy density (ED) is usually used to represent the amount of energy that the DBD reactor acting on the flue gas. The calculation formula can be expressed as:
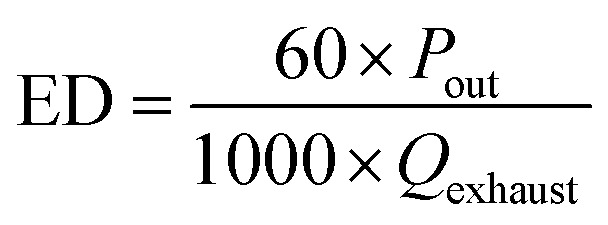 |
7 |
Here ED is the energy density of the DBD reactor, kJ L−1; Pout is the output power of the plasma power source, W; Qexhaust is the volume flow rate of the exhaust gas, L min−1.
4. Results and discussion
4.1. The changes of ED and power efficiency
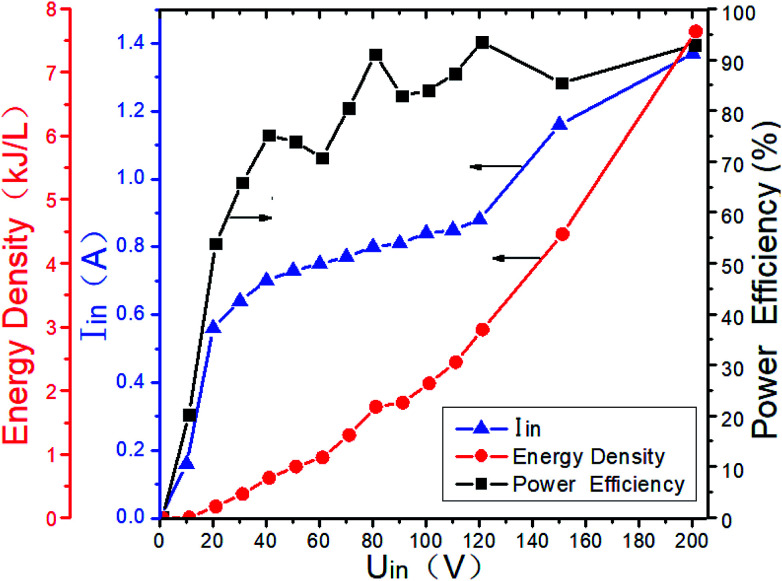
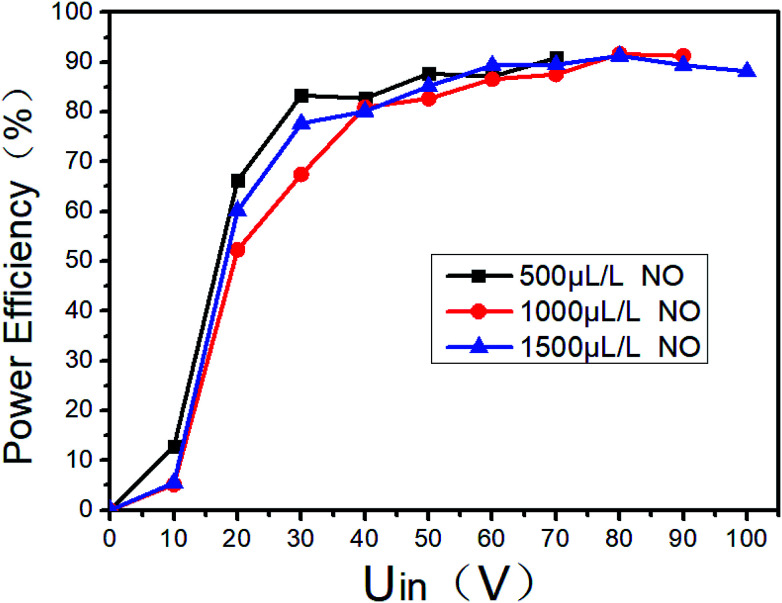
Gas breakdown will occur when the voltage between the two electrodes of the DBD reactor is higher than a certain value. The breakdown voltage is closely related to the discharge space. And it is also related to the gas composition and the ED in DBD reactor. When the typical marine diesel engine exhaust is simulated, that is, 1500 μL L−1 NO + 14% O2 + 5.1% H2O + 4.5% CO2 + 76.2% N2, the changes of ED and power efficiency with input voltage are shown in Fig. 7. When the input voltage is low (<20 V), the discharge is extremely unstable, and the input current is also small, so as the output power and power efficiency. As the input voltage increases (20–60 V), the DBD discharge becomes more and more stable, and the input current also increases gradually, so as the ED and power efficiency. When the input voltage is higher than 60 V, the input current and the ED gradually increases with the input voltage, and the power efficiency remains above 80%. As shown in Fig. 8, the power efficiency varies with the input voltage in the NO/N2 system, where N2 as the carrier gas and NO concentrations are 500 μL L−1, 1000 μL L−1 and 1500 μL L−1, respectively. When the input voltage is lower than 20 V, the power efficiency does not exceed 70%, when the input voltage is higher than 60 V, the power efficiency remains above 80%. Compared with Fig. 7, when the gas components are different at the same input voltage, the power efficiency is basically the same, indicating that the gas composition has little effect on the power efficiency.
Fig. 7. ED and power efficiency vary with input voltage at 1500 μL L−1 NO + 14%O2 + 5.1% H2O + 4.5% CO2 + 76.2% N2.
Fig. 8. Power output efficiency varies with input voltage at different NO concentrations.
In order to improve the power efficiency, the input voltage should be higher than 60 V. If the system is used in practice, it is recommended that the input voltage be higher than 60 V. However, when the system is scaled up, the optimal efficiency zone and the corresponding ED may be different, and should be determined in actual tests.
4.2. Effect of NTP on single component O2
As mentioned in the introduction, the main components in diesel exhaust are N2 and O2. They will have a great influence on NTP denitration. Therefore, we first study the effect of NTP in the N2/O2 system. The possible reactions may include R1–R18 (refer to the end of this section) at least. N2 and O2 will be converted into a variety of active particles in NTP. Herron35 and Fernandez's36 results show that only N(2D) and N(4S) active particles participate in the NO generation process. Zhao,24 Herron,37 Atkinson38 and others have shown that mainly O(3P) and O(1D) active particles participate in the NOx reaction process. Because of the high concentration of N2 and O2, and the reaction of R5 and R6 are faster, O(1D) will be quenched very quickly, and finally only O(3P) participates in the NOx reaction process. The formations of active particles are shown as R1–R6. N(2D) and N(4S) are no longer distinguished below, so as O(3P) and O(1D). They are denoted by ·N and ·O, respectively.
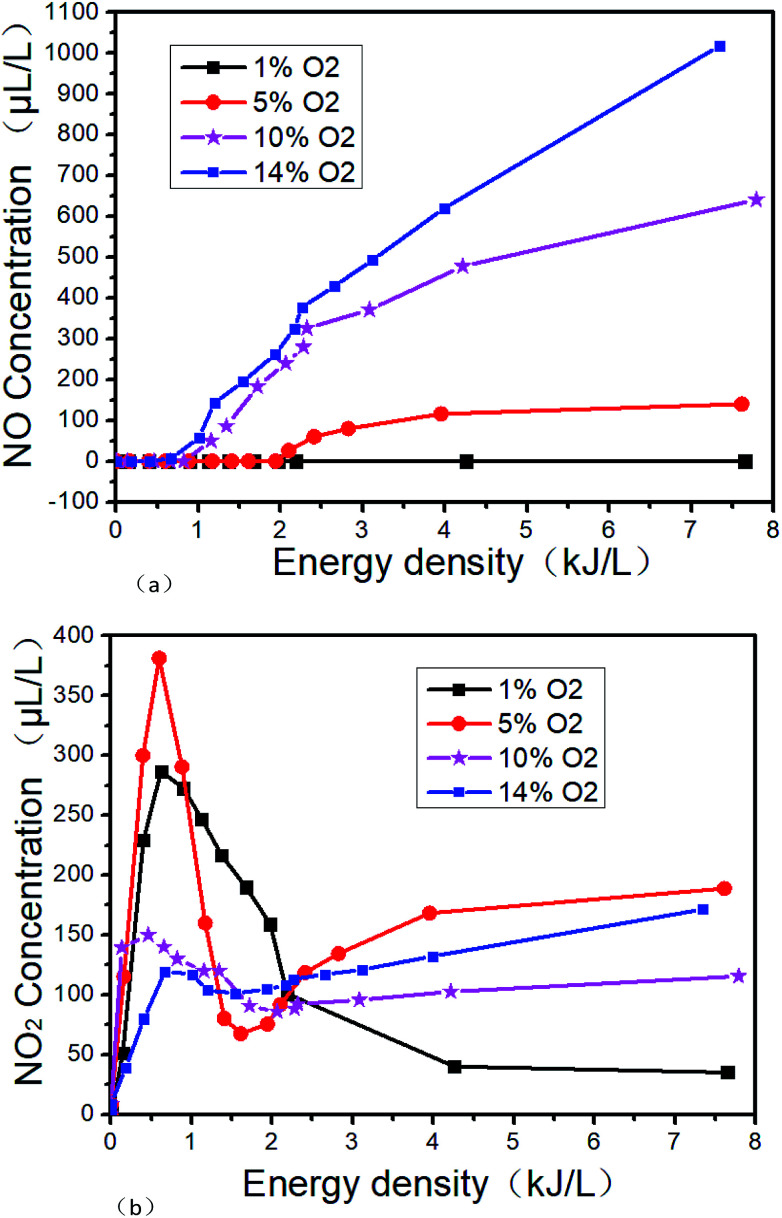
The changes of DBD outlet gas concentration with ED in O2/N2 system are shown in Fig. 9. Fig. 9(a) and (b) show the trend of NO and NO2 with ED at different O2 concentrations, respectively. From Fig. 9(a), it can be seen that NO will not be generated at low ED regardless of the O2 concentration. However as the O2 concentration and the ED increase, the NO concentration also increases. There will be no NO generated in the ED range of 0–7.6 kJ L−1 at 1% O2 concentration. But when the O2 concentration is 14% and the SIE is 7.3 kJ L−1, the NO concentration is as high as 1018 μL L−1. The reactions R7 and R8 may take place in the process. From Fig. 9(b), it can be seen that NO2 is more easily generated at lower ED in the N2/O2 system. The concentration of NO2 increases first and then decreases with the increase of O2 concentration when the ED is higher than 2.1 kJ L−1, indicating that the excessive O2 will inhibit the generation of NO2. When O2 concentration is 5%, it is most beneficial to the formation of NO2. The concentration of NO2 is up to 380 μL L−1 when the O2 concentration is 5% and the ED is 0.9 kJ L−1.
Fig. 9. Effect of NTP at different energy density in O2/N2 system. (a) NO varies with energy density, (b) NO2 varies with energy density.
Based on the above results, reactions R7–R16 may take place under our experimental condition. For R16, O3 will be formed by NTP in the presence of O2. Because O3 is more oxidative than O2, NO will be oxidized to higher valence oxides. The possible reactions are mainly R16–R18.39 When the ED is 4 kJ L−1 and the O2 concentration is 14%, the NOx concentration is 750 μL L−1. According to the above experimental results, the generated NOx concentration by NTP gradually increases with the O2 concentration and ED in O2/N2 system.
| e + N2 → e + N(4S) + N(4S) | R1 |
| e + N2 → e + N(2D) + N(2D) | R2 |
| e + O2 → e + O(3P) + O(3P) | R3 |
| e + O2 → e + O(3P) + O(1D) | R4 |
| O(1D) + O2 → O(3P) + O2 | R5 |
| O(1D) + N2 → O(3P) + N2 | R6 |
| ·N + O2 → NO + ·O | R7 |
| ·N + ·O → NO | R8 |
| ·O + NO → NO2 | R9 |
| ·O + NO2 → NO + O2 | R10 |
| ·N + NO2 → N2 + O2 | R11 |
| ·N + NO → N2 + ·O | R12 |
| ·O + NO2 → NO3 | R13 |
| e + NO → e + ·O + ·N | R14 |
| e + NO2 → e + NO + ·O | R15 |
| ·O + O2 → O3 | R16 |
| NO + O3 → NO2 + O2 | R17 |
| NO2 + O3 → NO3 + O2 | R18 |
4.3. Effect of NTP on single component NO
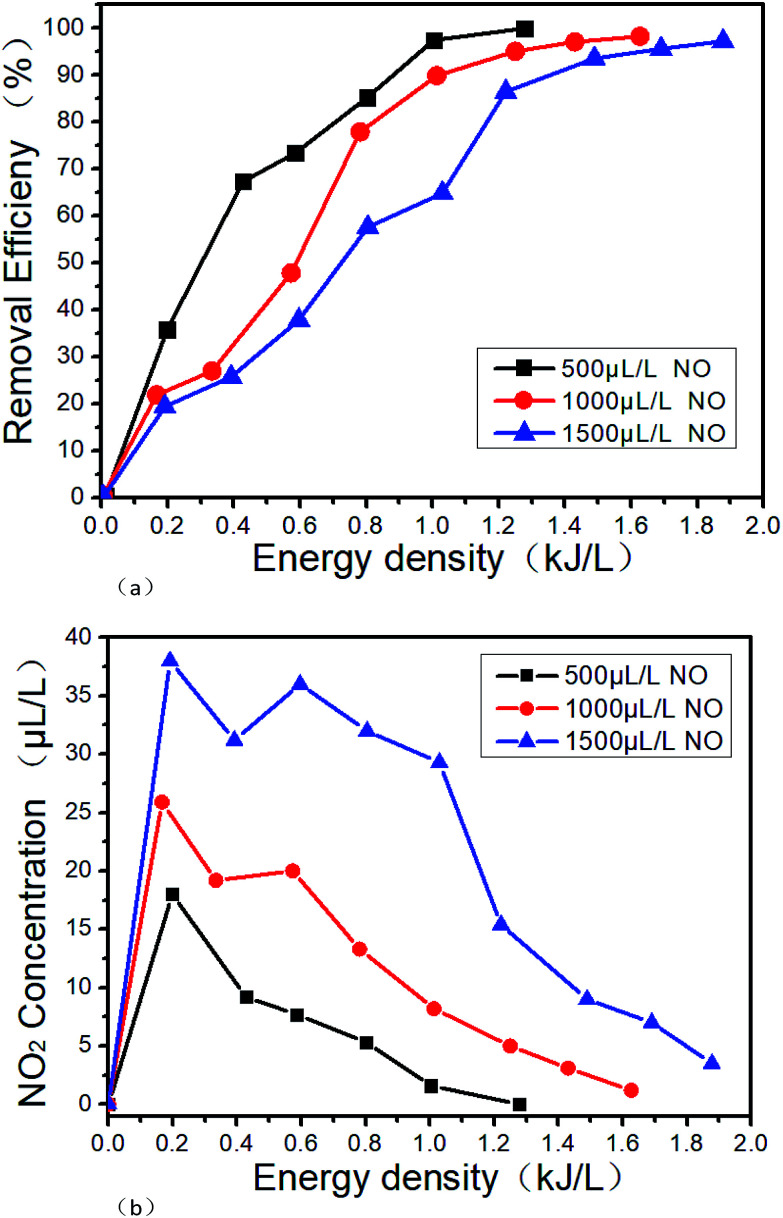
Fig. 10 shows the denitration performance of NTP in NO/N2 system. Under this condition, NO is converted to N2 by the reduction way, and the reactions mainly are R12 and R14.40 It can be seen from Fig. 10(a) that the removal efficiency slightly decreases with the increase of the NO concentration under the same ED. However, the NO is almost completely removed when the ED reaches a certain value. The removal efficiency increases with the ED when the NO concentration is constant. The removal efficiencies are all above 95% when the NO concentrations and the EDs are 500 μL L−1 0.99 kJ L−1, 1000 μL L−1 1.26 kJ L−1 and 1500 μL L−1 1.68 kJ L−1, respectively. The reason for the above experimental result is mainly that the collisions between molecules are more intense with the increase of ED, and R14 is more likely to take place. Also, the reaction R1 and R2 will produce more ·N active particles, and then the reaction R12 will increase the removal efficiency. Sun34 got the similar results with us when the NO concentration was 2000 μL L−1. It can be seen from Fig. 10(b) that while NO is removed by the reduction way, a small part of NO is also oxidized to NO2, which means that the reactions of R9 and R14 take place. And the higher the initial NO concentration, the more NO2 generates. However, with the increase of the ED, the concentration of NO2 increases first and then decreases. When the ED reaches a certain value, NO2 is completely removed mainly due to the reactions of R10, R11 and R15. Under the experimental condition, the highest removal efficiency of 99% is obtained in this paper.
Fig. 10. Denitration performance of NTP at different energy densities in NO/N2 system, (a) removal efficiency varies with the energy density, (b) NO2 varies with the energy density.
Zhao's results24 show that with the increase of ED, the removal efficiency of NOx will reach 98.5% wi0.5%, and could not be further increased. It is mainly because that N2O which generated by the reaction of R19 is difficult to convert. When NH3 is added, R20 may also take place, but R21 is more difficult to take place. However, the speculation cannot be confirmed in this paper due to that the flue gas analyzer we use could not measure the N2O concentration.
Based on the above results, NO tends to reduce to N2 by NTP in NO/N2 system, and the removal efficiency is higher than 95%.
| NO + ·N → N2O | R19 |
| NO2 + ·NH2 → N2O + H2O | R20 |
| N2O + ·O → 2NO | R21 |
4.4. Effect of O2 on NTP denitration performance
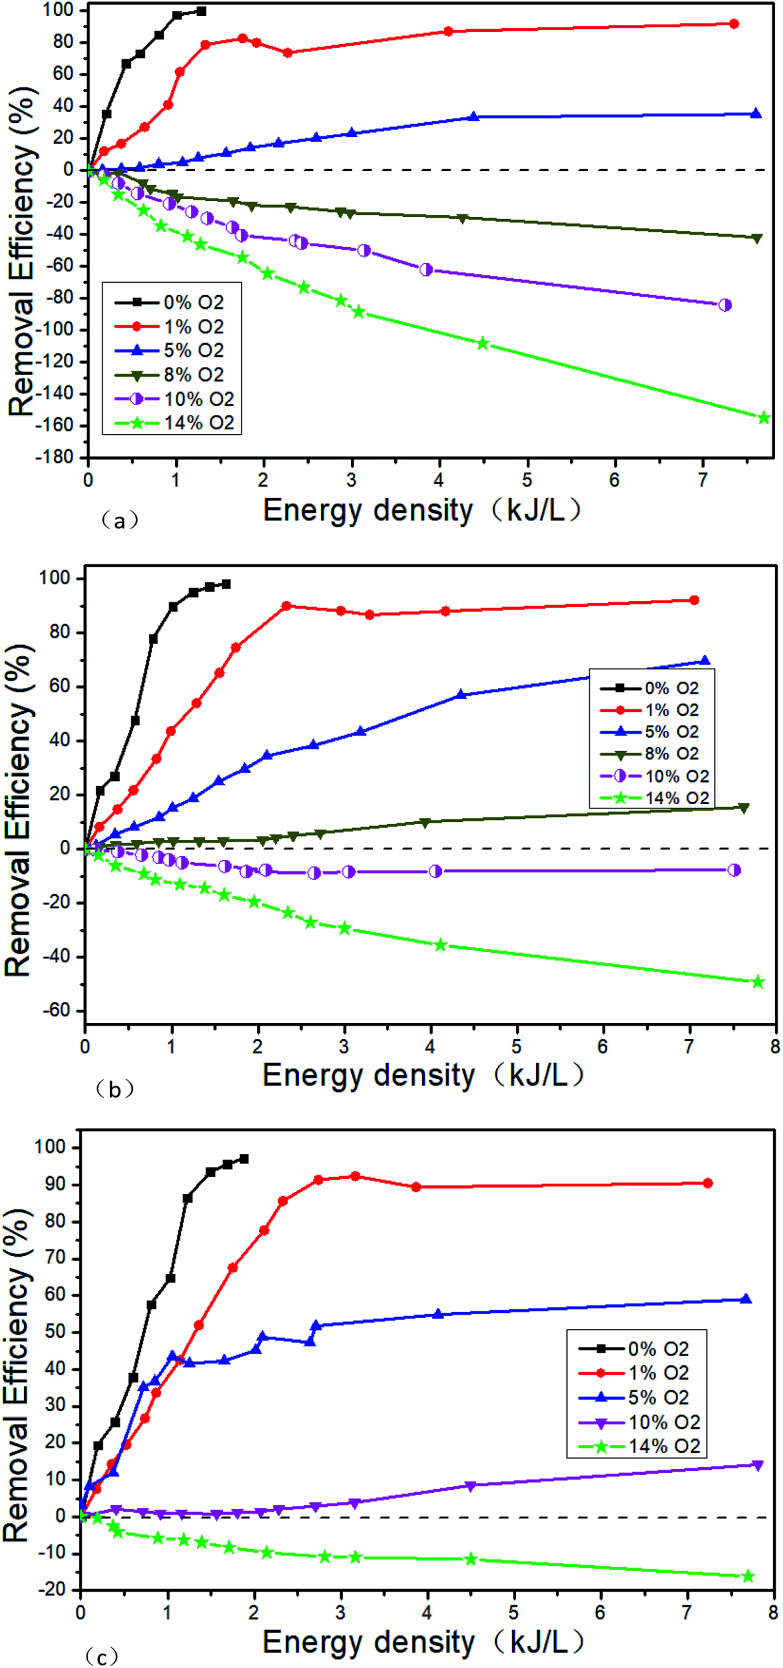
Tokunaga41 and Zhao24 believe that the removal efficiency of NOx will decrease with the increase of O2 concentration, and there is a critical O2 concentration to make the NOx removal efficiency zero. Tokunaga' results show that the critical O2 concentration is about 3.6% when the initial NO concentration is 500 μL L−1.41 Zhao's results show that the critical O2 concentration is about 2.5% when the initial NO concentration is 350 μL L−1.24 The NO concentration of the typical marine diesel engine exhaust is generally much higher than 500 μL L−1. When the initial NO concentration is higher, the changes of the critical O2 concentration are not very clear. Based on this, the NOx removal performance of NTP is studied when the initial NO concentrations, O2 concentrations and the EDs change. Fig. 11 shows the NTP denitration performance under different conditions of NO and O2. Since the remove rate is close to 100% at lower energy density when O2 concentration is zero, the experiments at higher energy densities are no longer performed.
Fig. 11. Denitration performance of NTP in NO/O2/N2 system, (a) 500 μL L−1 NO + O2, (b) 1000 μL L−1 NO + O2, (c) 1500 μL L−1 NO + O2.
It can be seen that the higher the NO concentration, the higher the removal efficiency at the same O2 concentration. The reason for this phenomenon is that the probability of NO collision with high-energy particles is higher in the reaction system with the increase of NO concentration. The greater the likelihood, the more NO will be removed by converting to N2. While it may be helpful to use the isotope labeling method to detect the migration of nitrogen atoms in NO to confirm the speculation, it is not included in this study due to experimental conditions.
Secondly, it can be seen that the removal efficiency decreases with the increase of O2 concentration when the initial NO concentration is constant. The removal efficiency is more than 90% at low O2 concentration (less than 1%) when the ED is bigger enough. When the O2 concentration is more than 14%, the removal efficiency is negative. And with the increase of the ED, the removal efficiency is further reduced. The critical O2 concentration gradually increases with the initial NO concentration. The critical O2 concentration range is 5–8% when the initial NO concentration 500 μL L−1. Tokunaga41 believes that the critical O2 concentration is about 3.6% when the initial O2 concentration is 500 μL L−1. But our experimental results are not agreed with his. The possible reason is that the NTP generation methods are different. Tokunaga uses electron beam method and we use the DBD method. It is reported that the average free energy of electrons generated by the electron beam method is much higher than that of the DBD method.42 Therefore, more N2 which is difficult to excite is converted to ·N by the electron beam method. So the reactions of R1–R9 are easier by electron beam method even at lower O2 concentration. And then the chemical reaction direction is toward to NOx generation.
The critical O2 concentration range is 5–8%, 8–10% and 10–14% corresponding to the initial NO concentration 500 μL L−1, 1000 μL L−1 and 1500 μL L−1, respectively. The COC gradually increases with the initial NO concentration. The removal efficiency increases with the ED when the O2 concentration is lower than the COC, and decreases with the ED when the O2 concentration is higher than the COC.
4.5. Effect of NH3 on NTP denitration performance
NH3 is often used as reducing agent for the removal of NOx in the conventional SCR method. At present, there are few studies on the NOx removal by NH3 in NTP system, and the NOx removal mechanism by NTP + NH3 is even more unclear. It is generally believed that the ammonia radical (·NH2) plays a major role in the NOx removal in NTP system when NH3 is added. The reactions of the ·NH2 formation are R22–R25 (refer to the end of this section).
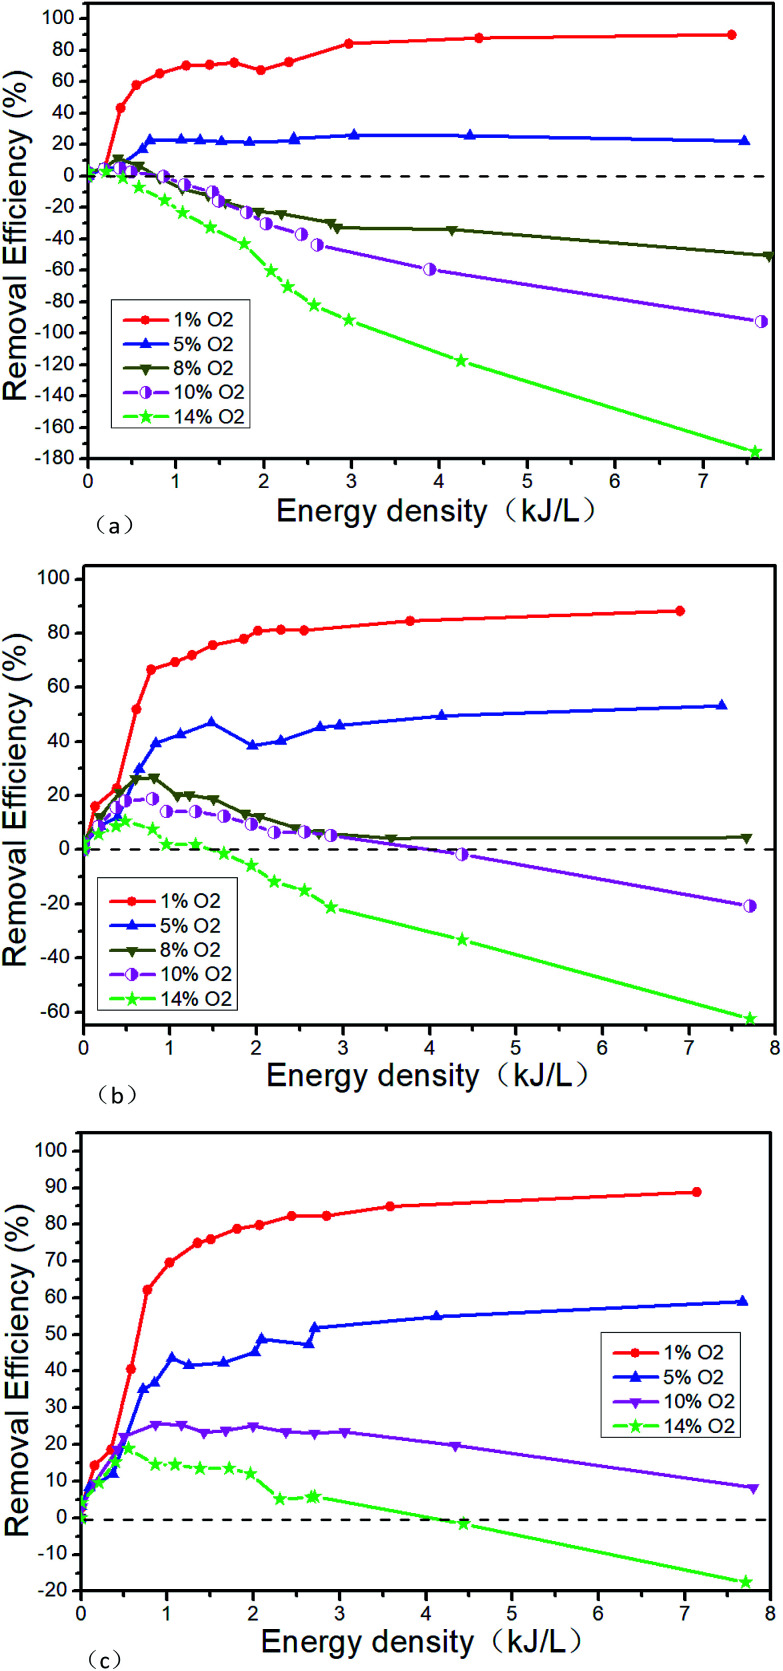
Fig. 12 shows the NTP denitration performance of NH3 under different conditions of NO and O2. Taking the initial NO concentration of 1000 μL L−1 as an example, it can be seen from the comparison with Fig. 11 that when the O2 concentration is 1% and the energy density is greater than 2.25 kJ L−1, the NOx removal efficiency changes from 90% (Fig. 11(b) shown) to 80% (as shown in Fig. 12(b)) when NH3 is added. When the O2 concentration is greater than 10%, the removal efficiency remains positive at low ED after adding NH3. But with the increase of the ED, the removal efficiency gradually decreases and eventually becomes negative. When the O2 concentration is 14% and the ED is 7.8 kJ L−1, the lowest removal efficiency changes from −49.2% (as shown in Fig. 11(b)) to −62.4% (as shown in Fig. 12(b)) after NH3 is added. When the O2 concentration is less than 5%, NO is removed by the reduction way and R13 is supposed to be the main reaction. The generated NO2 is removed by the reaction R11. After the addition of NH3, the reactions of R22–R28 mainly take place. At low O2 concentration, the addition of NH3 leads the removal efficiency decreasing. The experimental result may be caused by the fact that in this experimental condition the removal of NOx is mainly caused by the collision, which breaks the molecular bonds between high-energy particles and molecules generated by NTP. And then the molecular bonds recombine to generate bigger bond energy molecules, such as N2. However, after the addition of NH3, the probability of collision between the high energy particles and the NO molecules is lowered, thereby the removal efficiency decreases. When the O2 concentration is greater than 10%, the NTP removal efficiency becomes negative. The reason for this phenomenon may be that the O2 concentration is much higher than NO, and the oxygen-active particles generated by collisions between high-energy particles and O2 molecules are much more, making the reactions R7 and R8 more likely to react. Although the NOx can be decreased after the addition of NH3 at the low ED, the concentration of oxygen-activated particles increases with the ED. And the NO generation rate by oxidation reaction is higher than the removal efficiency by NH3 reduction reaction, which eventually leads to the negative removal efficiency.
Fig. 12. Denitration performance of NTP in NO/NH3/O2/N2 system, (a) 500 μL L−1 NO + 500 μL L−1 NH3 + O2, (b) 1000 μL L−1 NO + 1000 μL L−1 NH3 + O2, (c) 1500 μL L−1 NO + 1500 μL L−1 NH3 + O2.
Secondly, the experimental results show that the NO2 concentration will be slightly reduced at different O2 concentrations when NH3 is added. Mizuno43 believes that NO does not react with NH3 at room temperature, and the conversion of NO to NO2 is determined by the concentration of ·O instead of the NH3. In the range of room temperature to 150 °C, NH3 only affects the removal efficiency of NO2 instead of NO.
Based on the findings above, NH3 has little effect on the critical O2 concentration. However, when other initial conditions are constant, the removal efficiency will be greatly improved at the low energy density and further reduced at the high energy density after adding NH3. Therefore, it should be avoided the energy density is too much when NH3 is added, which will result in the oxidation of NH3 and the decrease of the removal efficiency.
| e + NH3 → ·NH2 + ·H | R22 |
| ·O + NH3 → ·NH2 + ·OH | R23 |
| ·OH + NH3 → ·NH2 + H2O | R24 |
| ·H + NH3 → ·NH2 + H2 | R25 |
| ·NH2 + NO → N2 + H2O | R26 |
| ·NH2 + NO2 → N2 + H2O | R27 |
| NH3 + NO2 → N2 + H2O | R28 |
4.6. Effect of H2O on NTP denitration performance
H2O is an inevitable combustion product in diesel exhaust. H2O can generate a variety of strong oxidizing free radicals in NTP, including ·HO2, ·OH and H2O2. These strong oxidizing active particles will contribute to the oxidative removal of NO. The possible reactions are R29–R33 (M is a third inert body in the reaction system).44
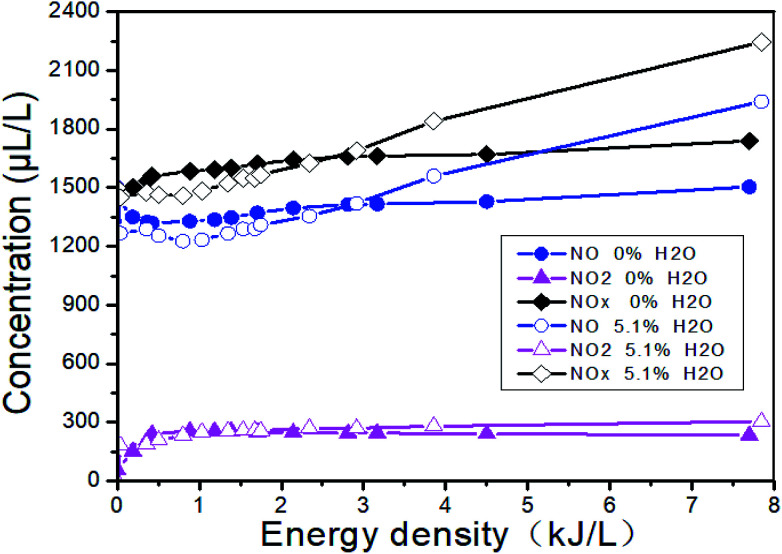
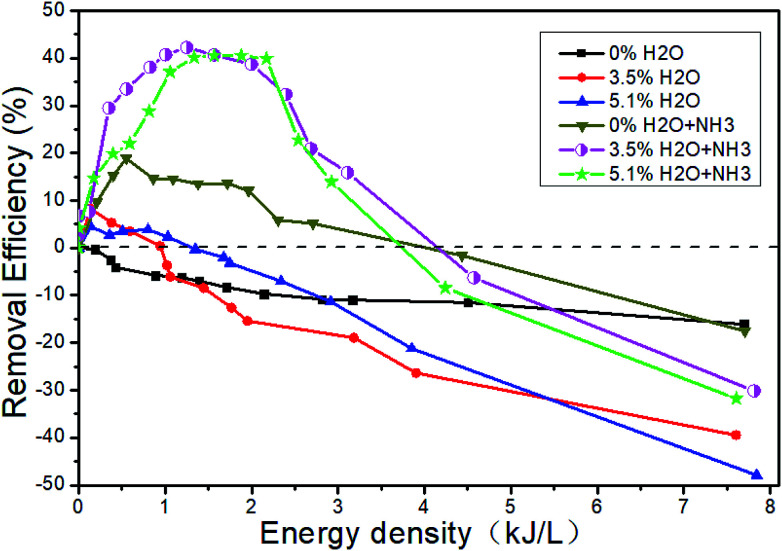
Fig. 13 shows the changes of the NOx concentrations at the outlet when the inlet gases are 1500 μL L−1 NO + 14% O2 + 5.1% H2O + N2, i.e., H2O is added. Fig. 14 shows the denitration performance of NH3 at different H2O concentrations in the system of 1500 μL L−1 NO + 14% O2 + H2O + N2, i.e., both H2O and NH3 are added. It can be seen from Fig. 13 that H2O nearly has no effect on the concentration of NO2. H2O can reduce the NO concentration a little bit at the low ED and increase the NO concentration at the high ED, which means H2O can increase the removal efficiency at the low ED and lower the removal efficiency at the high ED. However, there is no obvious regular pattern between H2O concentration and NTP removal efficiency with the increase of the ED (Fig. 14). The reactions mainly consist of R29–R38. When NH3 is added, the removal efficiency increases first and then decreases with the increase of the ED. When both NH3 and H2O are present, the removal efficiency of NOx can be greatly improved.
Fig. 13. Effect of H2O on the NOx removal.
Fig. 14. Effect of H2O and NH3 on the removal efficiency.
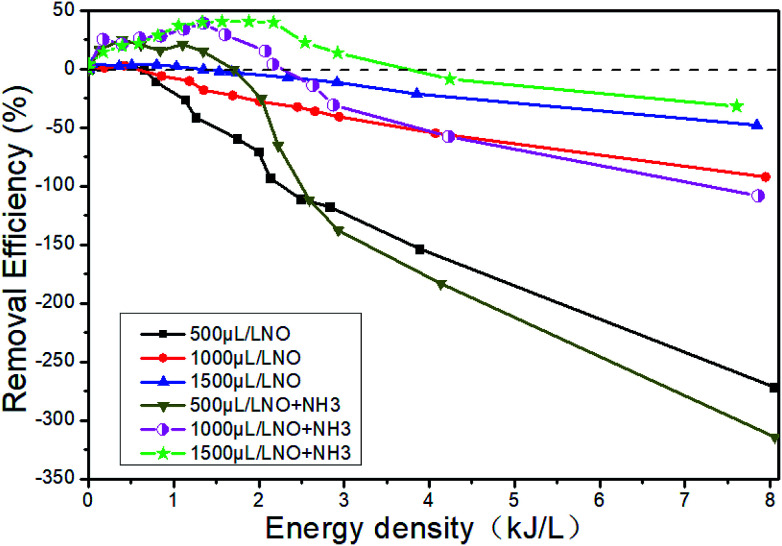
Fig. 15 shows the changes of NTP removal efficiency at different initial NO concentrations in the system of 14% O2 + 5.1% H2O + NO + NH3 + N2. Whether NH3 is added or not, the removal efficiency of NOx gradually increases with the initial NO concentration. At constant initial NO concentration, the removal efficiency increases first and then decreases with the increase of the ED. This conclusion has been shown in Section 3.5. The addition of NH3 will contribute to the increase of removal efficiency in the whole ED range in the system of 1500 μL L−1 NO + 14% O2 + 5.1% H2O + NH3 + N2, and the removal efficiency is up to 40.6% when the ED is 1.57 kJ L−1.
Fig. 15. Effect of H2O on NTP denitration performance at different initial NO concentrations.
In general, H2O can increase the NTP removal efficiency at the low ED and reduce the removal efficiency at the high ED. When H2O and NH3 coexist, the NTP removal efficiency is greatly improved. Therefore, the system consists of the following reactions:
| e + H2O → e + ·H + ·OH | R29 |
| O(1D) + H2O → ·OH + ·OH | R30 |
| ·OH + ·OH + M → H2O2 + M | R31 |
| O(3P) + ·OH → O2 + ·H | R32 |
| O2 + ·H → ·HO2 | R33 |
| NO + 2·OH → NO2 + H2O | R34 |
| NO + ·HO2 → NO2 + ·OH | R35 |
| NO + ·OH → HNO2 | R36 |
| HNO2 + ·OH → NO2 + H2O | R37 |
| NO2 + ·OH → HNO3 | R38 |
4.7. Effect of CO2 on NTP denitration performance
CO2 is also an inevitable combustion product in diesel exhaust, and most researchers have not explored the effects of CO2 on the NTP denitration. Therefore, in this section we investigate the impact of CO2 in the NTP system for different initial NO concentrations and the presence of NH3.
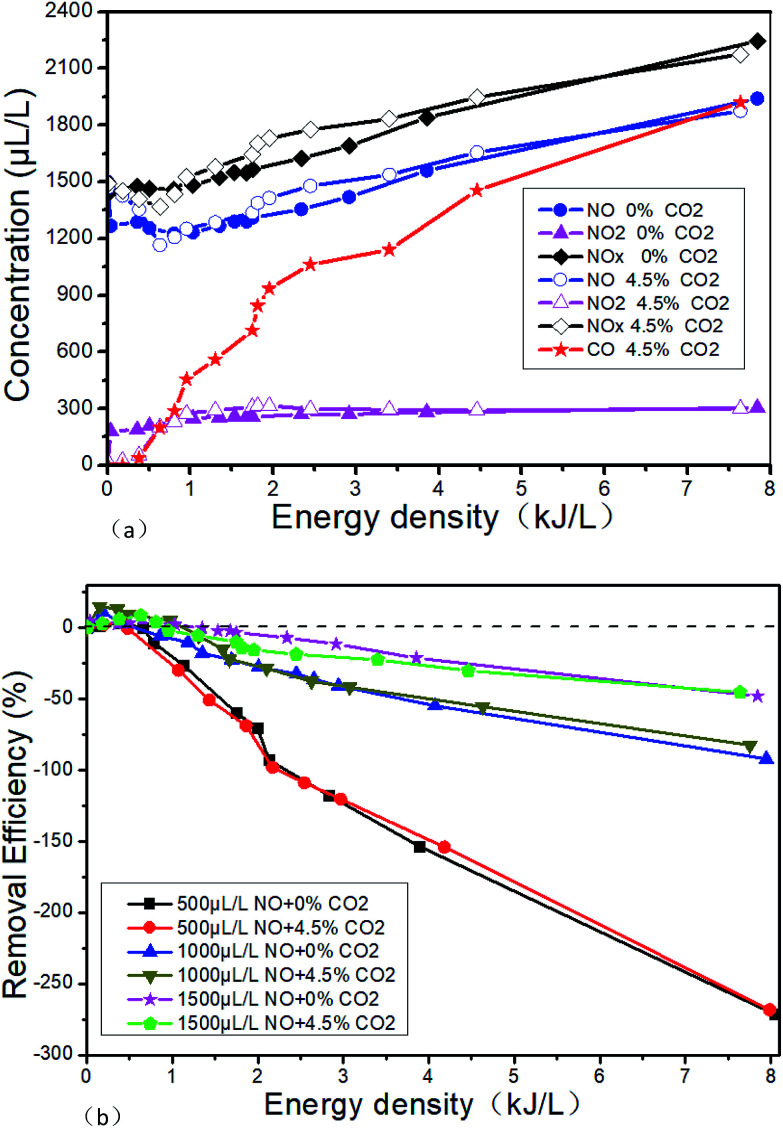
The effects of 4.5% CO2 on the DBD outlet gas concentration in the system of 1500 μL L−1 NO + 14% O2 + 5.1% H2O + N2 are shown in Fig. 16(a). The effect of 4.5% CO2 on the NTP removal efficiency at different initial NO concentration in 14% O2 + 5.1% H2O + N2 + NO is shown in Fig. 16(b). It can be seen from Fig. 16(a) that CO2 almost has no effect on the concentration of NO and NO2 at the DBD outlet. But when 4.5% CO2 is added, a certain concentration of CO will be produced, and the outlet CO concentration will gradually increase with the ED. When the ED is 7.64 kJ L−1, the CO concentration is up to 1920 μL L−1. The possible reactions are R39–R43. And R40 is the main reaction because CO2 concentration is much higher than the CO. It can be seen from Fig. 16(b) that CO2 basically does not have any influence on the NTP removal efficiency at different initial NO concentrations.
Fig. 16. Effects of CO2 on the NTP denitration performance, (a) effects of CO2 on DBD outlet gas concentration in the system of 1500 μL L−1 NO + 14% O2 + 5.1% H2O + 76.2% N2. (b) Effects of CO2 on the NTP removal efficiency at different initial NO concentration in 14% O2 + 5.1% H2O + 76.2% N2 + NO.
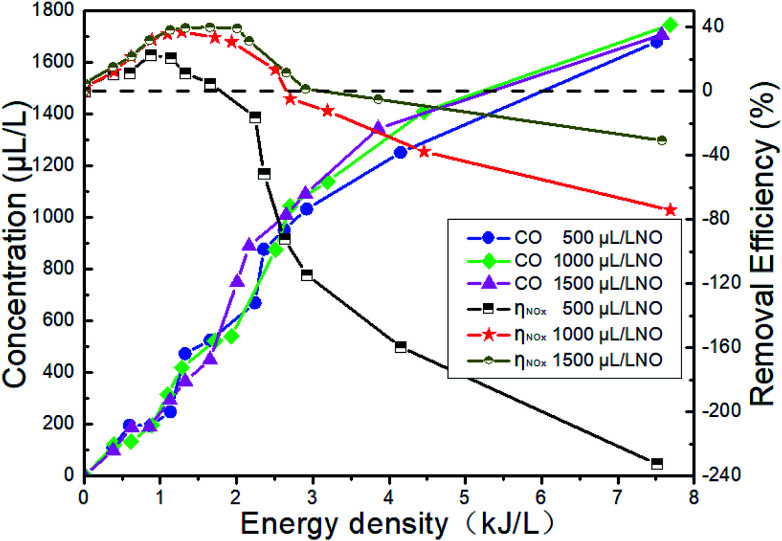
The changes of NTP removal efficiency at different initial NO concentrations are shown in Fig. 17 when NH3 is added in the system of 14% O2 + 5.1% H2O + 4.5% CO2 + 76.2% N2 + NO. The CO concentration in the outlet increases with the ED instead of the initial NO concentration. The NTP removal efficiency increases significantly when NH3 is added. However, CO2 has no effect on the NTP removal efficiency in the presence of NH3 when compared with Fig. 15. In addition, we opened the DBD reactor after the experiment of adding CO2, and a layer of black carbon was observed on the surface of high-pressure copper rod. This may be due to the further decomposition of CO, which means reaction R44 occurred.
Fig. 17. Effect of CO2 on NTP removal efficiency with the presence of NH3.
In summary, CO2 nearly has no effect on the removal efficiency of NOx under different experimental conditions. But CO will be detected in the outlet and black carbon will be generated on the surface of high-voltage electrode after adding CO2, and the CO concentration will gradually increase with the ED.
| e + CO2 → e + ·O + CO | R39 |
| CO + ·O → CO2 | R40 |
| CO + 2·OH → CO2 + H2O | R41 |
| CO + ·HO2 → CO2 + ·OH | R42 |
| 3CO + O3 → 3CO2 | R43 |
| e + CO → e + ·O + C | R44 |
5. Reaction mechanism of NOx and application prospect of NTP
5.1. Reaction mechanism of NOx in NTP
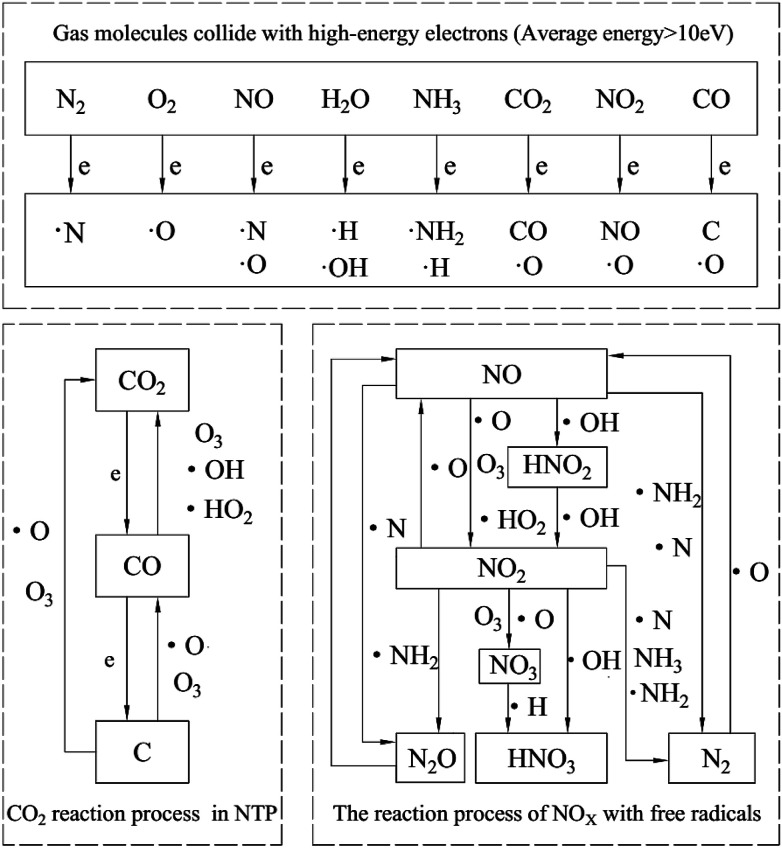
When the inlet gases are N2, O2, CO2, H2O, NO and NH3, NTP denitration can be roughly divided into three stages.16,22,40,45
(1) The first stage is the discharge. At this stage gas molecules are mainly bombarded by high-energy electrons. It breaks the molecular covalent bonds, changes the gas molecules into free radicals and excites some decomposed atoms to the unstable excited state. The following reactions mainly take place at this stage: R1–R4, R14 and R15, R22, R29, R39 and R44.
(2) The second stage is the post-discharge. At this stage the excited-state atoms generated in the first stage collide with the gas molecules to generate secondary radicals. Then the radicals collide with other particles leading to quench or new radicals' generation. The reactions are mainly R5 and R6, R16, R23–R25, R30–R33.
(3) The third stage is that the free radicals react with NOx. The reactions mainly include R7–R13, R17–R21, R26–R28, R34–R38. The reactions of free radicals with CO mainly include R40–R43.
In general, under our experimental conditions, the reaction mechanism of diesel engine exhaust in the NTP system is shown in Fig. 18. It mainly consists of two parts. The first is that gas molecules generate various free radicals under the bombardment of high-energy electrons. The second is the radicals react with other particles. The reaction process of NOx with free radicals is described in the right of Fig. 18. Other researchers16,22,40,45 get the similar results with us. While our experimental results show that CO2 has little effect on the removal efficiency of NOx. CO2 is converted to CO and even further converted to black carbon. Therefore, the reaction process of CO2 in NTP is separately listed in the left of Fig. 18.
Fig. 18. Reaction mechanism of diesel engine exhaust gas in NTP system.
5.2. Analysis of NTP application prospect
As NO can be removed by oxidation or reduction, when the O2 concentration is low, NO is mainly removed by the reduction route. When the O2 concentration is high, many strong oxidative constituents are generated such as ·OH, ·O and O3. And then the NO is oxidized to NO2. But N2 will be converted to NOx at high O2 concentration and high energy density, causing the NTP removal efficiency to become negative. Although it is beneficial to the NTP removal efficiency improvement when the initial NO concentration is higher, it is difficult to further improve removal efficiency only by NTP technology because of the high O2 concentration in the marine diesel exhaust. In this paper, the highest removal efficiency is only 8.6% at 0.8 kJ L−1 energy density when inlet gases are 1500 μL L−1 NO + 14% O2 + 5.1% H2O + 4.5% CO2 + 76.2% N2. Chmielewski12 simulated the diesel engine exhaust conditions when burning heavy oil, and the removal efficiency obtained was also very low. Therefore, in order to achieve high-efficiency NOx removal at high O2 concentration, it is necessary to combine NTP denitration technology with other methods. The possible methods include the following:
(1) Adding reducing gas, such as H2,46 NH3 (ref. 11, 21 and 47–49) and HC50–52 (including CH4, C2H2, C2H4, C3H6, etc.). In this paper, the highest removal efficiency of 40.6% is obtained at the energy density of 1.65 kJ L−1 when NH3 is added.
(2) Combining NTP with the denitration catalysts.15,21,49,51,53–56 The catalysts commonly used include molecular sieves, activated carbon and metal oxides. For example, we can combine NTP with traditional vanadium-based SCR catalyst. Because NTP can convert NO to NO2, which means increasing NO2/NOx ratio, it is beneficial to increase the reaction rate of SCR.57 The removal efficiency is generally above 90% in this way, but it is also necessary to add reducing gas.
(3) Combining NTP with wet scrubbing technology.58–60 This technology has matured on ships today. NTP can oxidize NO to NO2 which is more soluble in water. Chmielewski11 obtained the removal efficiency of 49% by combining NTP with wet scrubbing. And Yang61 got the removal efficiency of more than 60% by combing electrolytic seawater with wet scrubbing. However, in general, the removal efficiency is still much lower than the traditional methods such as SCR technology.
A major problem for NTP industrial applications is that energy consumption of NTP is very large. Improving the energy utilization rate can be solved by optimizing the structure of the DBD reactor and matching the reactor with the power source.
6. Conclusions
A non-thermal plasma denitration system based on simulated diesel engine exhaust was set up in this paper. The NTP was generated by dielectric barrier discharge reactor. The NO removal performance by NTP under different O2, H2O, CO2, NO, NH3 concentrations and energy densities conditions were studied. The reaction mechanism of NOx in NTP system was proposed. The application prospect of NTP technology was analyzed. In the end we get the following conclusions:
(1) For the experimental system, the power source efficiency gradually increases with the input voltage. When the input voltage is greater than 60 V, the power supply efficiency is basically maintained above 80%.
(2) NO concentration increases gradually with the O2 concentration and the ED in the N2/O2 system. When the O2 concentration is 14% and the ED is 7.3 kJ L−1, the concentration of NO is up to 1018 μL L−1. The amount of NO2 increases and then stabilizes with the ED. When the O2 concentration is 5% and the ED is 0.9 kJ L−1, the concentration of NO2 is up to 380 μL L−1. Therefore, a certain concentration of NOx will be generated when introducing NTP in the air.
(3) NTP has a high removal efficiency for NO/N2 system. When low concentration O2 exists, NTP removal efficiency is above 90%. And NO is mainly removed by the reduction route. NTP will have no denitration performance at high concentration of O2. However, NH3 can inhibit the formation of NOx and improve the removal efficiency. At low O2 concentration, the removal efficiency of NOx gradually increases with the ED; at high O2 concentration, the removal efficiency becomes negative. And the higher the ED, the more NOx will generate. Therefore, the O2 concentration plays a decisive role in NTP denitration performance. And the critical O2 concentration increases with the initial NO concentration.
(4) Under typical diesel engine exhaust condition, H2O has little effect on NO2 when NH3 is not added, but it can increase NO removal efficiency at the low ED and the excessive ED causes the increasement of NO at the outlet. The highest removal efficiency of 4.5% can be obtained in the system of 1500 μL L−1 NO + 14% O2 + 5.1% H2O + N2. The highest removal efficiency of 18.9% can be obtained in the system of 1500 μL L−1 NO + 1500 μL L−1 NH3 + 14% O2 + N2. However, when H2O and NH3 are added, the removal efficiency is up to 40.6% in the system of 1500 μL L−1 NO + 1500 μL L−1 NH3 + 5.1% H2O +14% O2 + N2 because of the synergistic effect.
(5) CO2 nearly has no effect on the removal efficiency of NOx, but the concentration of CO will increase gradually with the ED. When the ED is 7.64 kJ L−1, the CO concentration will up to 1920 μL L−1. The reaction process of CO2 is added in the reaction mechanism of diesel engine exhaust in NTP system.
(6) Because of the high concentration of O2 in the marine diesel engine exhaust, in order to further improve the removal efficiency of NOx, it is necessary to add reducing gas to the NTP reactor, or combine the NTP technology with SCR catalysts or other technologies such as wet scrubbing.
Conflicts of interest
There are no conflicts to declare.
Supplementary Material
Acknowledgments
This work was supported by National Natural Science Foundation of China (51876019), Innovation Talent Support Program of Liaoning Province (LR2017048), and Transportation Industry High-Level Talent Training Program.
Notes and references
- IMO, MARPOL Annex VI and NTC 2008 with Guidelines for Implementation, International Maritime Organization, London, UK, 2013 edn, 2013 [Google Scholar]
- Di Natale F. Carotenutoa C. D'Addioa L. Lanciaa A. Antesb T. Szudygab M. Jaworekc A. Gregoryd D. Jacksone M. Volpef P. Chem. Eng. 2013;32:361–366. [Google Scholar]
- Fang P. Chen X. Tang Z. Huang J. Zeng W. Chem. Ind. Eng. Prog. 2017;36:1067–1076. [Google Scholar]
- Huang J., He J., Li T., Yu S., Shi Y. and Fan D., Transactions on Intelligent Welding Manufacturing, Springer, 2018 [Google Scholar]
- Zhou B. Qian X. Li M. Ma J. Liu L. Hu C. Xu Z. Jiao X. J. J. o. N. R. J. Nanopart. Res. 2015;17:130. doi: 10.1007/s11051-015-2946-0. [DOI] [Google Scholar]
- Yue M. Zhou B. Jiao K. Qian X. Xu Z. Teng K. Zhao L. Wang J. Jiao Y. J. A. S. S. Appl. Surf. Sci. 2015;327:93–99. doi: 10.1016/j.apsusc.2014.11.149. [DOI] [Google Scholar]
- Zhang C. Liu L. Xu Z. Lv H. Wu N. Zhou B. Mai W. Zhao L. Tian X. Guo X. J. P. C. Polym. Compos. 2018;39:E1262–E1268. doi: 10.1002/pc.24843. [DOI] [Google Scholar]
- Ma S. Zhao Y. Yang J. Zhang S. Zhang J. Zheng C. Renewable Sustainable Energy Rev. 2017;67:791–810. doi: 10.1016/j.rser.2016.09.066. [DOI] [Google Scholar]
- Balachandran W. Manivannan N. Beleca R. Abbod M. F. Brennen D. Alozie N. S. Ganippa L. C. IEEE Trans. Ind. Appl. 2016;52:2496–2505. [Google Scholar]
- Kuwahara T. Nakaguchi H. Kuroki T. Okubo M. J. Hazard. Mater. 2016;308:216–224. doi: 10.1016/j.jhazmat.2016.01.034. [DOI] [PubMed] [Google Scholar]
- Penetrante B. M. and Schultheis S. E., Non-thermal plasma techniques for pollution control: part b: electron beam and electrical discharge processing, Springer Science & Business Media, 2013 [Google Scholar]
- Chmielewski A. G. Zwolińska E. Licki J. Sun Y. Zimek Z. Bułka S. Radiat. Phys. Chem. 2018;144:1–7. doi: 10.1016/j.radphyschem.2017.11.005. [DOI] [Google Scholar]
- Jin Y.-j. Xin J. Yao J.-j. Zhang B. Song D. Shi R.-x. J. Fuel Chem. Technol. 2011;39:460–464. doi: 10.1016/S1872-5813(11)60030-3. [DOI] [Google Scholar]
- Wei Z. Zeng G. Xie Z. Ma C. Liu X. Sun J. Liu L. Fuel. 2011;90:1599–1603. doi: 10.1016/j.fuel.2010.11.021. [DOI] [Google Scholar]
- McAdams R., Beech P., Gillespie R., Guy C., Jones S., Liddell T., Morgan R., Shawcross J., Weeks D. and Hughes D., Non-thermal plasma based technologies for the after-treatment of automotive exhaust particulates and marine diesel exhaust NOx, Accentus plc, Warship Support Agency J Oesterle; GmbH& Co. KG, US, 2003 [Google Scholar]
- Mok Y. S. Nam I.-S. Chem. Eng. J. 2002;85:87–97. doi: 10.1016/S1385-8947(01)00221-2. [DOI] [Google Scholar]
- Mizuno A. Clements J. S. Davis R. H. IEEE Trans. Ind. Appl. 1986:516–552. [Google Scholar]
- Brandenburg R. Wagner H. Morozov A. Kozlov K. J. Phys. D: Appl. Phys. 2005;38:1649. doi: 10.1088/0022-3727/38/11/003. [DOI] [Google Scholar]
- Wang T. Sun B.-M. Xiao H.-P. Zeng J.-y. Duan E.-p. Xin J. Li C. Plasma Chem. Plasma Process. 2012;32:1189–1201. doi: 10.1007/s11090-012-9399-3. [DOI] [Google Scholar]
- Yukimura K. Kawamura K. Hiramatsu T. Murakami H. Kambara S. Moritomi H. Yamashita T. Thin Solid Films. 2007;515:4278–4282. doi: 10.1016/j.tsf.2006.02.069. [DOI] [Google Scholar]
- Cha M. Song Y. Lee J. Kim S. Int. J. Environ. Sci. Technol. 2007;1:28–33. [Google Scholar]
- Yu Q. Gao Y. Tang X. Yi H. Zhang R. Zhao S. Gao F. Zhou Y. Catal. Commun. 2018;110:18–22. doi: 10.1016/j.catcom.2018.02.025. [DOI] [Google Scholar]
- Li B., Marine Diesel Engine, Dalian Maritime University Press, Dalian, China, 2008 [Google Scholar]
- Zhao G. B. Garikipati S. J. Hu X. Argyle M. D. Radosz M. AlChE J. 2005;51:1800–1812. doi: 10.1002/aic.10452. [DOI] [Google Scholar]
- Zhou Y. Zhong Z. Fu Z. Zhong D. East China Electric Power. 2012;7:1217–1221. [Google Scholar]
- Zhang J. Zhou Y. Zhong Z. Jiang X. Piao G. J. Southeast Univ. 2014;44:1194–1199. [Google Scholar]
- Aritoshi K. Fujiwara M. Ishida M. Jpn. J. Appl. Phys. 2002;41:3936. doi: 10.1143/JJAP.41.3936. [DOI] [Google Scholar]
- Liang X.-j. Zhong Z.-p. Jin B.-s. Wei H.-g. Guo H.-k. J. Energy Power Eng. 2009;5:016. [Google Scholar]
- Lu L. Qiang Z. Lili G. Industrial Catalysis. 2017;12:001. [Google Scholar]
- Ren C., Master's thesis, Beijing University of Chemical Technology, Beijing, China, 2011 [Google Scholar]
- Wang X., Master's thesis, Beijing University of Chemical Technology, Beijing, China, 2012 [Google Scholar]
- Rosenthal L. A. Davis D. A. IEEE Trans. Ind. Appl. 1975:328–335. [Google Scholar]
- Wang D., Master's thesis, North China Electric Power University, Beijing, China, 2014 [Google Scholar]
- Sun H., Master thesis, North China Electric Power University, Beijing, China, 2009 [Google Scholar]
- Herron J. T. J. Phys. Chem. Ref. Data. 1999;28:1453–1483. doi: 10.1063/1.556043. [DOI] [Google Scholar]
- Fernandez A. Goumri A. Fontijn A. J. Phys. Chem. A. 1998;102:168–172. doi: 10.1021/jp972365k. [DOI] [Google Scholar]
- Herron J. T. Green D. S. Plasma Chem. Plasma Process. 2001;21:459–481. doi: 10.1023/A:1011082611822. [DOI] [Google Scholar]
- Atkinson R. Baulch D. Cox R. Hampson Jr R. Kerr J. Rossi M. Troe J. J. Phys. Chem. Ref. Data. 1997;26:1329–1499. doi: 10.1063/1.556010. [DOI] [Google Scholar]
- Ji R. Xu W. Wang J. Yan C. Zhu T. J. Chem. Eng. 2018;69:2353–2363. [Google Scholar]
- Liang W., Li J. and Zhu T., Air pollution control technology and application of low temperature plasma, Chemical Industry Press, Beijing, China, 2016 [Google Scholar]
- Tokunaga O. Suzuki N. Radiat. Phys. Chem. 1984;24:145–165. doi: 10.1016/0146-5724(84)90013-X. [DOI] [Google Scholar]
- Xie C., Master's thesis, Wuhan Textile University, Wuhan, China, 2015 [Google Scholar]
- Mizuno A. IEEE Trans. Dielectr. Electr. Insul. 2000;7:615–624. doi: 10.1109/94.879357. [DOI] [Google Scholar]
- Ding S. Yu Q. Zhang Y. Liu Y. Xie C. Yu G. J. Adv. Oxid. Technol. 2015;18:114–122. [Google Scholar]
- Yin L., Master's thesis, Jiangsu University, Zhenjiang, China, 2016 [Google Scholar]
- Gholami R. Stere C. E. Goguet A. Hardacre C. Philos. Trans. R. Soc., A. 2018;376:20170054. doi: 10.1098/rsta.2017.0054. [DOI] [PMC free article] [PubMed] [Google Scholar]
- Hsieh M.-F. Wang J. Control Eng. Pract. 2011;19:409–422. doi: 10.1016/j.conengprac.2011.01.004. [DOI] [Google Scholar]
- Brandenberger S. Kröcher O. Tissler A. Althoff R. Appl. Catal., B. 2010;95:348–357. doi: 10.1016/j.apcatb.2010.01.013. [DOI] [Google Scholar]
- Wang T. Zhang X. Liu J. Liu H. Wang Y. Sun B. Appl. Therm. Eng. 2018;130:1224–1232. doi: 10.1016/j.applthermaleng.2017.11.113. [DOI] [Google Scholar]
- Wang H. Cao Y. Chen Z. Yu Q. Wu S. Fuel. 2018;224:323–330. doi: 10.1016/j.fuel.2018.03.065. [DOI] [Google Scholar]
- Wang T. Liu H. Zhang X. Guo Y. Zhang Y. Wang Y. Sun B. Fuel Process. Technol. 2017;158:199–205. doi: 10.1016/j.fuproc.2017.01.011. [DOI] [Google Scholar]
- Lee D. H. Kim K.-T. Kang H. S. Song Y.-H. Park J. E. Environ. Sci. Technol. 2013;47:10964–10970. doi: 10.1021/es401513t. [DOI] [PubMed] [Google Scholar]
- McAdams R. Beech P. Shawcross J. Plasma Chem. Plasma Process. 2008;28:159–171. doi: 10.1007/s11090-007-9091-1. [DOI] [Google Scholar]
- Bröer S. Hammer T. Appl. Catal., B. 2000;28:101–111. doi: 10.1016/S0926-3373(00)00166-1. [DOI] [Google Scholar]
- Chen J. Chen Y. Zhou M. Huang Z. Gao J. Ma Z. Chen J. Tang X. Environ. Sci. Technol. 2016;51:473–478. doi: 10.1021/acs.est.6b04050. [DOI] [PubMed] [Google Scholar]
- Yu Q. Wang H. Liu T. Xiao L. Jiang X. Zheng X. Environ. Sci. Technol. 2012;46:2337–2344. doi: 10.1021/es203405c. [DOI] [PubMed] [Google Scholar]
- Bai S.-Z. Wang G.-H. Liu Y. Sun L. Li G.-X. Fresenius Environ. Bull. 2017;26:1359–1364. [Google Scholar]
- Kuroki T. Nishii S. Kuwahara T. Okubo M. J. Electrostat. 2017;87:86–92. doi: 10.1016/j.elstat.2017.04.007. [DOI] [Google Scholar]
- Yu W., Master's thesis, Wuhan Textile University, Wuhan, China, 2013 [Google Scholar]
- Yang S. Han Z. Pan X. Yan Z. Yu J. RSC Adv. 2016;6:114623–114631. doi: 10.1039/C6RA24537D. [DOI] [Google Scholar]
- Yang S. Pan X. Han Z. Zhao D. Liu B. Zheng D. Yan Z. Chem. Eng. J. 2018;331:8–15. doi: 10.1016/j.cej.2017.08.083. [DOI] [Google Scholar]


