Abstract
The experimental conditions necessary for stabilising irbesartan (IBS) tautomers in solution and selectively obtaining the desmotropic crystal forms are presented herein. 1H and 2H tautomers were stabilized in specific solution conditions and the 2H-tetrazole⋯imidazole interaction was confirmed by solution-state NMR. The results showed that highly polar and polarisable solvents (higher values of the electrostatic factor (EF)) lead to the crystallisation of IBS form B. Furthermore, the variations of pH in methanol, in turn, determined the crystallisation of desmotropes A and/or B.
The experimental conditions necessary for stabilising irbesartan (IBS) tautomers in solution and selectively obtaining the desmotropic crystal forms are presented herein.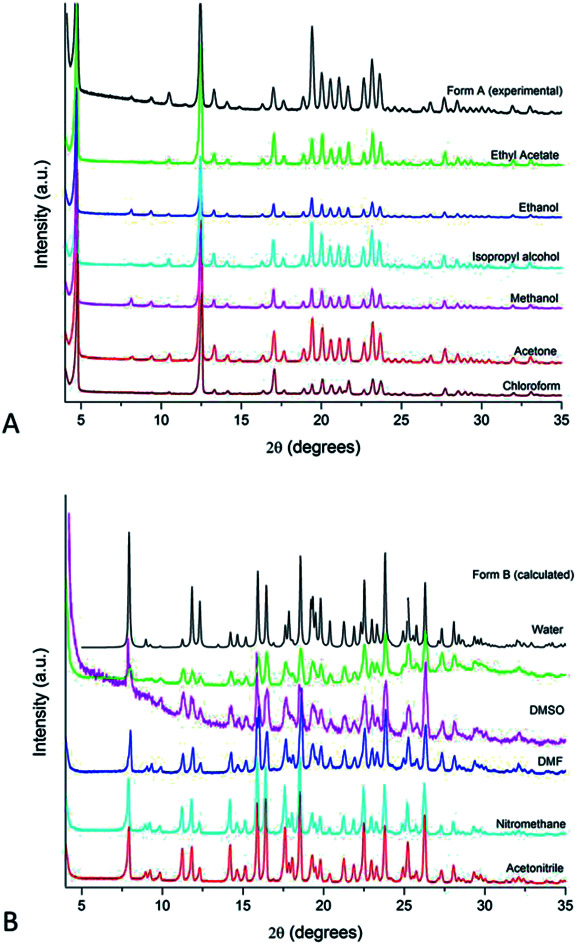
Introduction
Tautomerism corresponds to a type of structural isomerisation in which a chemical compound is represented by at least two structures with the same atoms differing in the position of an atom or a group of atoms.1 This phenomenon typically involves proton transfer and the rearrangement of double bonds. The relationship between two tautomers in solution is expressed as a chemical equilibrium which may be affected by intrinsic structural features (e.g. substituents and position of insaturation),2,3 the solution environment,4,5 pH and temperature.6 The ratio between two tautomers is not only defined by their relative energies but is also influenced by the strength of the intermolecular interactions which may consume one species and shift the equilibrium reaction.5 A better understanding of this balance has been generated by the development of more advanced calculation tools, which can measure the thermodynamic relationship between tautomers and its association to the transition states barrier for proton transfer.5,7–9
The studies of tautomerisation are especially important in the pharmaceutical field, because modifications in the hydrogen bonds and molecular shape may change the affinity between drug and receptor.10,11 Additionally, drug development and manufacturing require strict control of the tautomeric forms being formulated. In case the tautomeric forms are isolated in the solid-state without having another chemical compound within the same crystal lattice, the phenomenon is identified as desmotropy.12
Irbesartan (IBS), 2-butyl-3-[[4-[2-(2∼{H}-tetrazol-5-yl)phenyl]phenyl]methyl]-1,3-diazaspiro[4.4]non-1-en-4-one13 is a tetrazole derivative drug used in the treatment of hypertension.14 Recent studies have also shown pharmacological effects of IBS on hyperuricemia, oxidative stress, inflammation, lipid metabolism and metabolic syndrome.15,16 In solution IBS has two interconvertible structures, the 1H- and 2H-tautomers, that differ from one to another by the relative position of a proton in the tetrazole ring (Scheme 1).
Scheme 1. Prototropic tautomerism in the tetrazole system (adapted from Bauer et al. 1998).17.
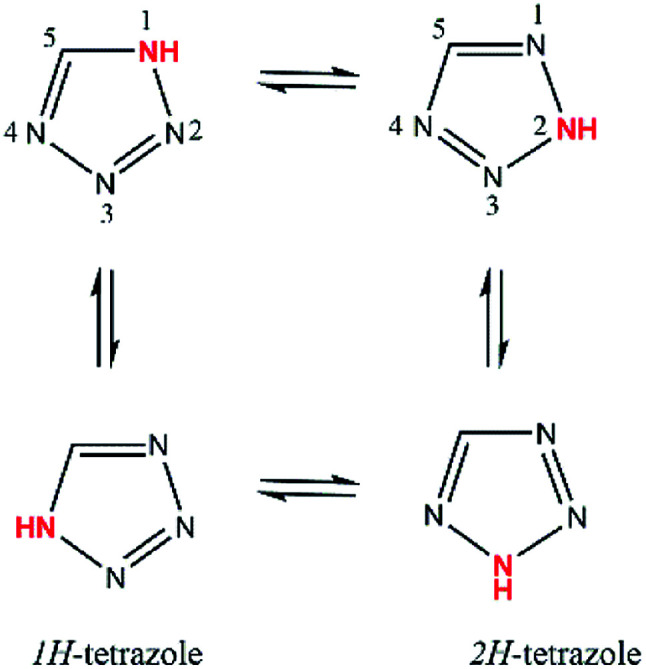
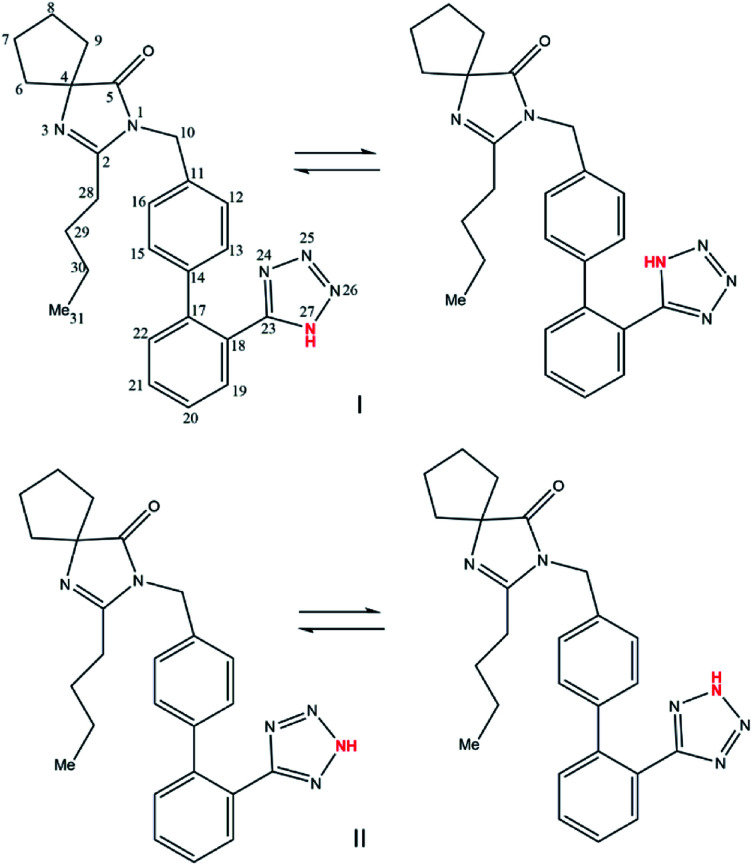
The IBS tautomers can be obtained as two different crystalline structures known as Form A (1H-tautomer) and Form B (2H-tautomer).17 These solid forms have been identified and analysed as desmotropes using solid-state NMR spectroscopy17 and theoretical calculation studies.18 According to Bauer et al. (1998), Form B is obtained through a proton migration and an internal rotation of the tetrazole ring.17 The migration of the proton initially leads to an equilibrium between 4 structures, which are presented in Scheme 2. If there is rapid internal rotation of the azole-carbon phenylene–carbon bond, the 4 structures become 2 equivalent pairs. IBS has a kinetics of proton migration that makes it possible to isolate a tautomer in pure form by recrystallization methods.17
Scheme 2. Molecular interconvertible structures of IBS: (I) Form A and (II) Form B (adapted from Bauer et al. 1998).17.
Although the literature has shown that desmotropes of the same family present different physicochemical properties,19,20 to the best of our knowledge, no systematic study on the crystallisation behaviour of desmotropic pairs has been described. The strategies that have been used to selectively stabilise tautomers in the solid-state are cocrystallisation and the formation of salts with different counter-ions.2,21–28 In the present work, however, we have explored the effect of solvent polarity and temperature29 on the nature of the IBS tetrazole tautomer crystallised from solution. A series of organic solvents were tested in the range of relative permittivity (dielectric constant)30 from 4.81 to 80 at temperatures of 25 °C and 40 °C, while the solution's pH varied from 1 to 11.
Experimental section
Effect of solvent
The crystallisation of IBS desmotropes was performed via solution crystallization in a series of pure solvents indicated in Table 1. An excess of IBS Forms A and B in 50 : 50 proportion was placed into 2.0 mL microtubes containing 1.5 mL of the solvent under evaluation. The resulting slurry was maintained at 25 °C and 900 rpm using a BIOSAN TS-100C Thermo-Shaker. After reaching the equilibrium (approximately 72 hours), the liquid was removed. The obtained solids were dried at 60 °C for 1 hour and stored in a desiccator until PXRD measurements.
IBS solid forms obtained by solvent at two different temperatures and properties of the solvents used.
| Solvent | Solid form 72 h, 25 °C | Solid form 72 h, 40 °C | Relative permittivity εa | Dipole moment μa | Electrostatic factor EFb |
|---|---|---|---|---|---|
| Chloroform | Form A | Form A | 4.81 | 1.15 | 5.53 |
| Ethyl acetate | Form A | Form A | 6.02 | 1.88 | 11.32 |
| Isopropyl alcohol | Form A | Form A | 17.9 | 1.66 | 29.71 |
| Acetone | Form A | Form A | 20.7 | 2.85 | 58.99 |
| Ethanol | Form A | Form A | 24.5 | 1.69 | 41.40 |
| Methanol | Form A | Form A | 32.7 | 1.70 | 55.59 |
| Nitromethane | Form B | Form B | 35.9 | 3.54 | 127.09 |
| Acetonitrile | Form B | Form B | 37.5 | 3.45 | 129.38 |
| DMF | Form B | Form B | 36.7 | 3.86 | 141.66 |
| Water | Form B | Form B | 80.1 | 1.82 | 145.78 |
| DMSO | Form B | Form B | 46.7 | 3.90 | 182.13 |
The reported relative permittivity (ε) and the dipole moment (μ) values were obtained from literature.32
The electrostatic factor is calculated as the product of μ and ε.
Effect of pH
The effect of pH was evaluated in methanol and water using HCl 0.1 mol L−1 or 0.01 mol L−1 and NaOH 0.1 mol L−1 or 0.01 mol L−1 in order to adjust the pH values. Afterwards, the procedure is an excess of both IBS solid forms in 50 : 50 proportion was placed into 2.0 mL microtubes containing 1.5 mL of the methanol or water with adjusted pH. The samples were agitated at 25 °C and 900 rpm using a BIOSAN TS-100 °C Thermo-Shaker for 72 hours. The obtained solids were removed from the solution, dried at 60 °C for 1 hour and kept in a desiccator until PXRD analysis.
Solution-state NMR studies
Tautomeric equilibrium in solution was determined by solution NMR. 1H, 13C and 2D-Heteronuclear Multiple Bond Correlation NMR samples were prepared using CD3OD or 5% CF3COOD/CD3OD. Spectra were recorded on a Bruker Ascend 400 MHz instrument and chemical shifts (δ) are reported in ppm relative to internal tetramethylsilane (TMS, δ = 0.0 ppm) as standard.
Powder X-ray diffraction
Powder samples were placed onto a zero-background sample holder. PXRD patterns were collected from a PANalytical Empyrean diffractometer, equipped with a Cu Kα source (λ = 1.5418 Å) operated at 45 kV and 40 mA, step size 0.016°, step time 20 s, angular scanning speed 2° min−1 and 2θ angular range between 4° and 50° using a silicon strip detector (PIXcel 1D).
Results and discussion
Table 1 presents the crystallisation outcome, the reported relative permittivity (ε), dipole moment (μ) and electrostatic factor (EF) of the solvents used. The EF is calculated as the product of μ and ε of the corresponding solvent.31,32 In other words, this factor combines chemical polarity and polarizability. Polarity characterises the intrinsic orientation of the named molecule and quantify the overall static dipole moment, while the polarisability describes the ability of a molecule to be polarised by an external electric field.31,33 For example, DMSO presents the highest value of EF of all the solvents used meaning that it is highly polar and capable of increasing its polarity in the presence of polarised species. On the other hand, chloroform has shown the lowest EF, which indicates that the solvent is non-polar and less susceptible of forming dipole interactions with other molecules in the surrounding environment. It is important to note that the EF does not consider the properties of the solute in solution.31 It can, however, imply the nature of the solvent/solute interactions which may affect the crystallization process.
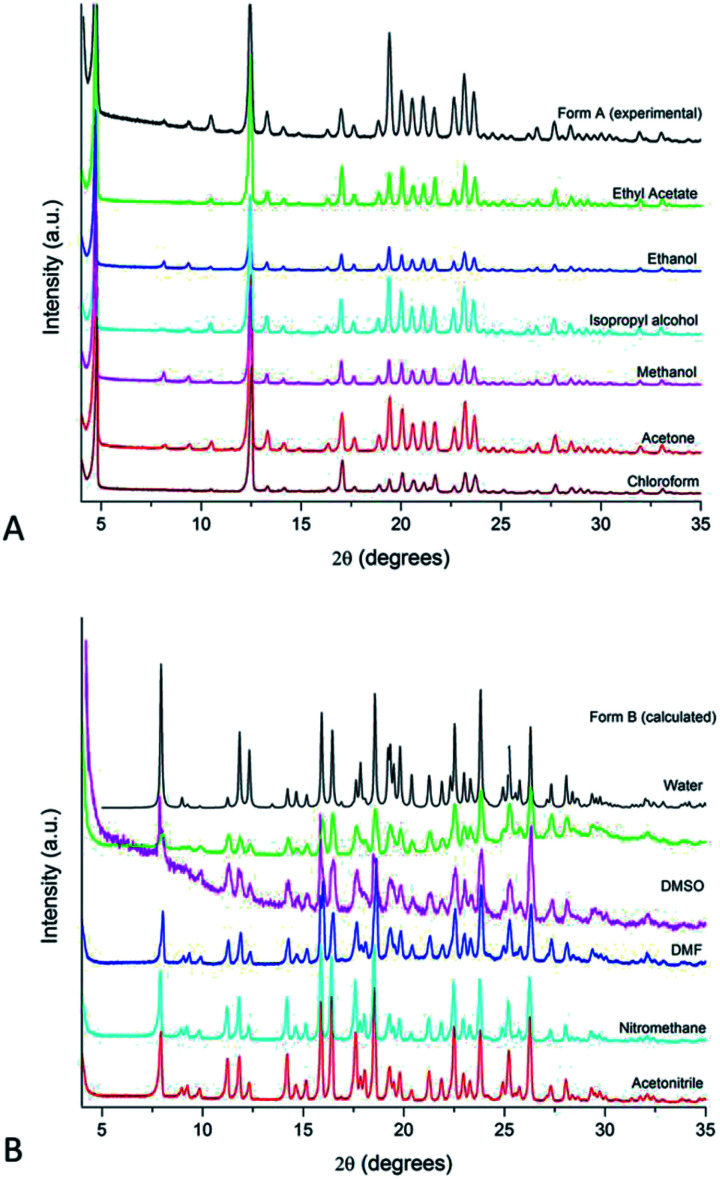
Indeed, there is a clear pattern associating the IBS solid form obtained from crystallisation to the EF of the solution media. It has been demonstrated that Form A crystallises from alcohols, acetone, ethyl acetate and chloroform, whereas Form B has been consistently obtained from water, acetonitrile, nitromethane, N,N-dimethylformamide (DMF) and dimethyl sulfoxide (DMSO) (see diffractograms in Fig. 1). The same outcome was observed from experiments at 40 °C. The crystallisation experiments performed in highly polar and polarisable solvents have all resulted in IBS Form B.
Fig. 1. PXRD patterns of IBS samples grown from solution evaporation at 25 °C: (A) Form A and (B) Form B. The calculated pattern of Form B and the experimental pattern of Form A (commercial raw material) is added for comparison.
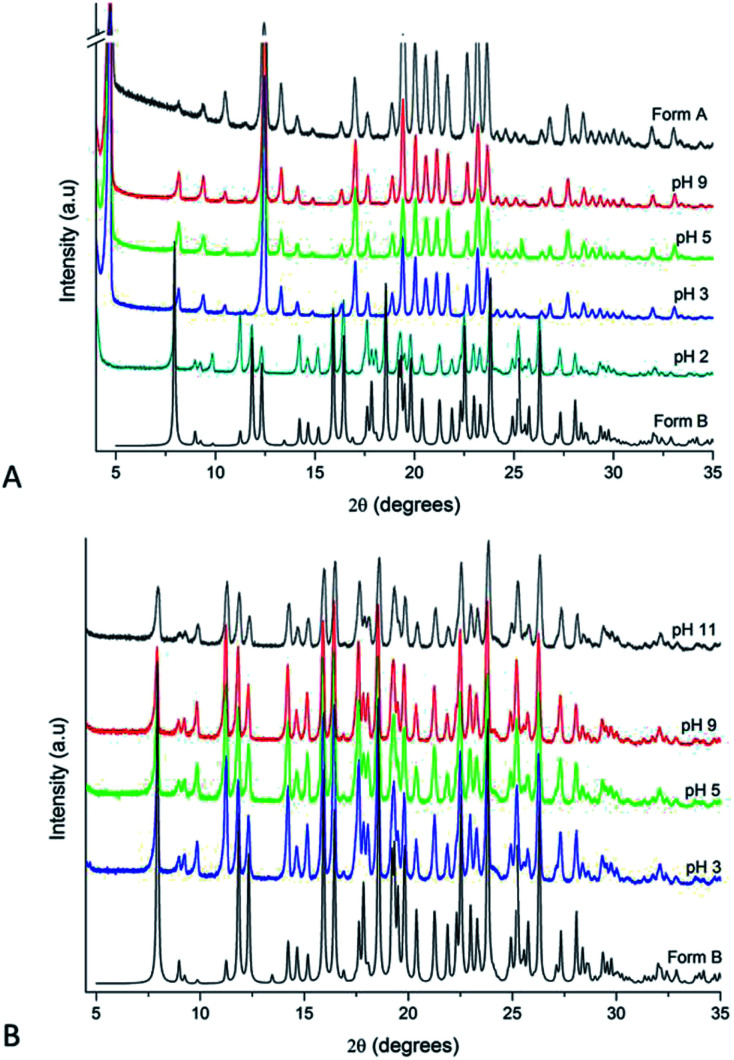
The influence of pH on the proton mobility in the tetrazole ring was also evaluated. Therefore, acidifying and alkalinising agents were added to MeOH (solvent which promotes crystallisation of Form A) and water (solvent which leads to Form B) used in solution crystallisation. Fig. 2 shows the crystallisation behaviour of IBS in MeOH (Fig. 2A) and water (Fig. 2B) at different pH values. In methanolic solutions, the characteristic reflection related to Form A at 2θ of 4.70° clearly disappeared from the PXRD patterns at pH 2. In aqueous solutions, however, Form B was crystallised from all the experiments performed at the different pH values. In water, according to Agmon (1995) the proton mobility is abnormally high34 favouring the tautomer with less activation energy (2H, Form B) which is the most stable and preferred form in the gas phase.7,18,34,35 The crystallisation results suggest that pH variation has no impact in the tautomeric equilibrium in aqueous solutions.
Fig. 2. PXRD patterns of IBS samples grown from different pH solutions at 25 °C: (A) methanol and (B) water.
Solution-state NMR was therefore used to follow-up these results. Tables 2 and 3 summarize data from 1H and 13C NMR spectra measured for IBS in neutral and acidic CD3OD solutions (atom numbering as indicated in Scheme 2). Chemical shifts observed in neutral solution were found to be analogous to data previously reported in the literature.17 The comparison of the spectra obtained in acidic CD3OD, however, showed dissimilarities. The most significant differences in the chemical shifts of the 1H NMR spectra between the two IBS solutions were found for H-6 to H-10, H-12 to H-16 and H-28, in which the acidic solution shows signals at lower field. Additionally, the 1H spectrum of the neutral solution shows one signal at 7.16 ppm for H-12, H-13, H-15 and H-16 whereas two separate signals were identified in the spectrum of the acidic solution for these protons, one at 7.28 ppm corresponding to H-12 and H-16 and another at 7.21 ppm for H-13 and H-15. Further, all hydrogens of the acidic solution are located downfield in respect to the corresponding hydrogens in neutral solution. In addition, while hydrogens at C-6, C-7, C-8, and C-9 are distributed in two signals in the 1H spectrum of neutral solution, these hydrogens form a single multiplet at 2.02–2.26 ppm in acidic solution.
13C NMR shifts for IBS in neutral and acidic solutions.
| Position | δ C/ppm | |
|---|---|---|
| Neutral | Acidic | |
| 2 | 165.75 | 174.77 |
| 4 | 77.3 | 73.3 |
| 5 | 187.53 | 180.31 |
| 6 | 38.38 | 38.32 |
| 7 | 27.01 | 26.71 |
| 8 | 27.01 | 26.71 |
| 9 | 38.38 | 38.32 |
| 10 | 44.16 | 44.99 |
| 11 | 137.41 | 135.20 |
| 12 | 127.96 | 128.59 |
| 13 | 130.77 | 130.99 |
| 14 | 140.51 | 141.27 |
| 15 | 130.77 | 130.99 |
| 16 | 127.96 | 128.59 |
| 17 | 142.93 | 142.77 |
| 18 | 124.75 | 124.36 |
| 19 | 131.79 | 131.59 |
| 20 | 129.11 | 129.35 |
| 21 | 132.43 | 132.60 |
| 22 | 131.79 | 131.81 |
| 23 | 157.1 | 156.57 |
| 28 | 28.77 | 28.1 |
| 29 | 28.48 | 27.52 |
| 30 | 23.14 | 23.04 |
| 31 | 13.98 | 13.77 |
1H NMR data for IBS neutral and acidic solutions.
| Position | Neutral | Acid | ||
|---|---|---|---|---|
| δ H/ppm | Multiplicity | δ H/ppm | Multiplicity | |
| 6 | 1.82, 1.98 | m | 2.20–2.26 | m |
| 7 | 1.98 | m | 2.20–2.26 | m |
| 8 | 1.98 | m | 2.20–2.26 | m |
| 9 | 1.82, 1.98 | m | 2.20–2.26 | m |
| 10 | 4.78 | s | 5.00 | s |
| 12 | 7.16 | m | 7.28 | m |
| 13 | 7.16 | m | 7.21 | m |
| 15 | 7.16 | m | 7.21 | m |
| 16 | 7.16 | m | 7.28 | m |
| 19 | 7.69 | m | 7.71 | m |
| 20 | 7.58 | m | 7.62 | m |
| 21 | 7.69 | m | 7.73 | m |
| 22 | 7.58 | m | 7.59 | m |
| 28 | 2.40 | m | 2.84 | m |
| 29 | 1.52 | m | 1.61 | m |
| 30 | 1.35 | m | 1.43 | m |
| 31 | 0.89 | t (J = 7.3 Hz) | 0.95 | t (J = 7.3 Hz) |
Differences were also observed between 13C NMR spectra. For instance, it is important to note that C-2 and carbonyl C-5 exhibit considerably different chemical shifts in neutral and acidic solutions, both at lower field in this last solution. Considering it was reported that the formation of hydrogen bond deshields carbonyl carbons in solution,36,37 the difference in chemical shift in C-5 can be attributed to an intramolecular hydrogen bond formation between the carbonyl group and the proton in 1H-tautomer. In this tautomer, the proton is located closer to the carbonyl group than the proton in 2H-tautomer. Thus, the observed difference in chemical shift in carbonyl C-5 between neutral and acidic solution agrees with the shifts reported in the literature for intramolecular hydrogen bonding formation associated with the carbonyl group.36,37
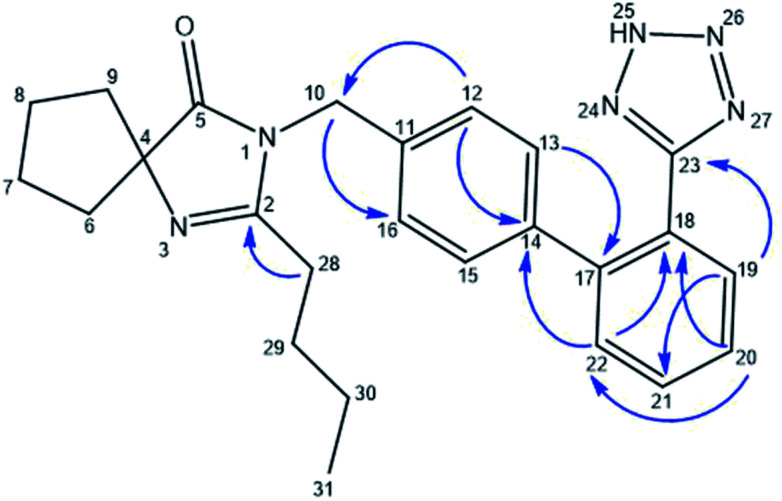
A Heteronuclear Multiple Bond Correlation (HMBC) experiment was required to unambiguously assign C-19, C-22, H-12, H-13, H-15, H-16 and H-28 of IBS acidic solution. In effect, as shown in Fig. 3, H-12 and H-16 at δ 7.28 ppm correlated with C-10 and C-14 at δ 44.99 and δ 141.27 ppm respectively, while H-13 and H-15 at 7.21 ppm correlated with C-17 at δ 142.77 ppm and H-10 at δ 5.0 ppm correlated with C-12 and C-16 at δ 128.59 ppm. On the other hand, H-20 at δ 7.62 ppm correlated with C-18 at δ 124.36 ppm and C-22 at δ 131.81 ppm, while H-19 at δ 7.71 ppm correlated with C-21 and C-23 at δ 132.60 and δ 156.57 ppm respectively. Additionally, H-22 at δ 7.59 ppm correlated with C-18 at δ 124.36 ppm and H-28 at δ 2.84 ppm correlated with C-2 at δ 174.76 ppm.
Fig. 3. HMBC correlations for IBS acidic solution.
Therefore, the 1H, 13C and 2D-HMBC NMR data confirm the proton position in the tetrazole ring corresponding to Forms A and B, in agreement with solid-state NMR experiments reported earlier17 for both IBS desmotropes. Bauer et al. (1998) have shown that IBS 1H and 2H-tautomers are indistinguishable by solution-state NMR and their data was consistent with a tautomeric equilibrium in solution. It is noteworthy that those authors did not test the conditions explored herein. It was demonstrated in the present contribution that the 1H-tautomer of IBS is stabilised in neutral solution while the 2H-tautomer is favoured in acidic methanolic solutions. It suggests, therefore, that the IBS desmotropic crystal form obtained from crystallisation is the tautomeric specie stabilised in solution.
One remaining question is why highly polar and polarisable solvents stabilise the IBS 2H-tetrazole tautomer, while a less polar solvent environments stabilise the 1H tautomer? The answer for the isolated tetrazole system, was previously proposed by several authors in their theoretical7,18,35,38 and experimental29,39 studies. The tautomeric equilibrium in solution is quite sensitive to solvent and molecular substituents.35,38 In non-polar solvents both tautomeric forms are close in energy and their dipole moments are 5.30 D and 2.3 D for 1H and 2H respectively.35 In general, the dipole moment of both tautomers increases with the dipole moment of solvents increase. Moreover, the less polar tautomer 2H is preferred in less polar solvents, while in polar solvents the more polar tautomer 1H is favoured.35 Indeed, it has been found exclusively the 1H-tautomeric form in DMSO solution.35,39 In the case of the influence of substituents in the tetrazole ring in the dipolar moments of their tautomeric species, it has been demonstrated that electro withdrawing substituents in the position 5 (Scheme 1) modify the polarity of the tautomeric species in polar media.38 In this sense, the intermolecular 2H-tetrazole···imidazole hydrogen bond reported for IBS 2H tautomer can act as an electro withdrawing group near to the position 5. For instances, changes in the dipolar moment from 2.63 D to 10.05 D in the 2H-tetrazole···imidazole complex have been reported.18 This value is even higher than the reported dipolar moment of the isolated 1H-tetrazolic form in polar solvents (6.56 D).35 The tetrazole⋯imidazole interaction is absent in 1H-tautomer.
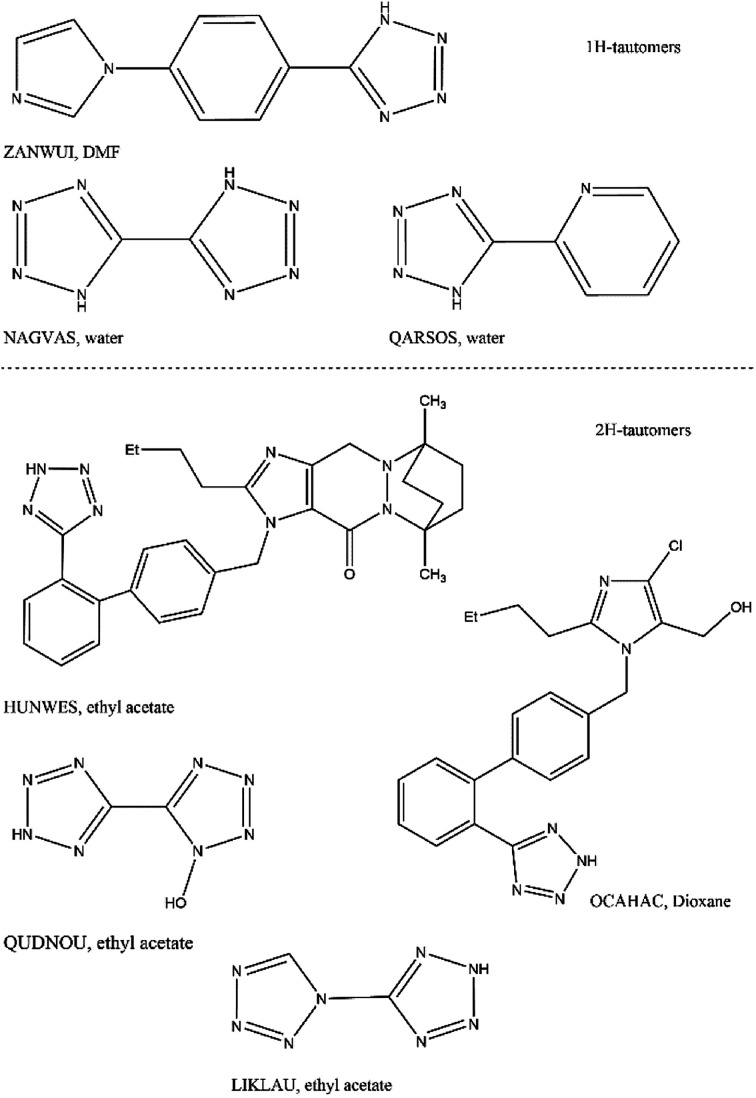
These observations were interesting in analysing the solution conditions in which other pairs of tetrazole tautomers have been selectively obtained in the literature. Therefore, a search of the 1H and 2H tetrazole tautomeric structures reported in the Cambridge Structural Database (CSD) was performed. Chart 1 presents the molecular structures of the molecules presenting the tetrazole system and the solvent from which they were crystallised. The search has shown that the reported structures containing 1H-tautomeric species were obtained from highly polar solvents, whereas the 2H-tautomeric forms were obtained from less polar solvents – except in the case of IBS. The analysis of these reported crystal forms has shown that all of them present a hydrogen bond between the tetrazole hydrogen and one cyclic nitrogen from a neighbouring molecule, however, different from imidazole moiety which is an electro withdrawing group.
Chart 1. Molecular structures, CSD refcode and solvent used to crystallise 1H and 2H-tetrazole species.
In the solid-state, however, the molecular conformation and packing varied according to the flexibility, the size and the molecular complexity. It is noteworthy that two crystal structures of sartans were found in the CSD search, IBS and Losartan (CSD refcode: NOZWII and OCAHAC). Both are the 2H tetrazole tautomeric species which presented similar molecular conformations. Although no significant changes were seen in the 2H-tetrazole···imidazole hydrogen bond of IBS and Losartan (D-H⋯A = 1.939 Å, D⋯A = 2.783 Å, 167.3°; and D-H⋯A = 1.779 Å, D⋯A = 2.724 Å, 164.1°, respectively), the orientation of the tetrazole rings is different in the crystal forms possibly due to the differences in the imidazole substituents of both molecules. These structural modifications lead to different hydrogen bonds between the tetrazole nitrogen N1 and the neighbouring molecule. In the case of Losartan, a stronger OH···tetrazole interaction is formed, while a weak CH···tetrazole is seen in IBS.
The results shown herein suggest a strong influence of the electrostatic character of the solvent in the stabilization of the preferred tautomer in solution. However, the polarizability produced by the tetrazole···imidazole interaction in the IBS molecule has influence in the stabilization of the tautomeric species in solution as well; consequently, crystallising in the solid state the tautomer preferred in solution. Further studies including calculations and experimental ones are required for a better understanding of the fundamentals and the structural requirements involved in the crystallisation of IBS desmotropes.
Conclusions
The effect of intrinsic structural features of the IBS molecule, the solution environment, pH and temperature in the tautomeric equilibrium of the IBS system is reported for the first time herein. 1H and 2H tautomers were stabilized in specific solution conditions and the 2H-tetrazole⋯imidazole interaction was confirmed by solution-state NMR. The desmotropic crystal forms, A and B obtained by crystallization, were correlated with EF values of the solvents. EF is the main characteristic influencing crystallization of IBS crystal forms when pure solvents are used. Form B was favoured with higher values of EF values whereas Form A was obtained from lower EF ones. The influence of pH variation in the crystallization of Form A and B was more relevant in methanol than in water. These results indicate that Form A and B crystallize in methanol depending on the pH conditions. All these conditions should be considered in the design of IBS desmotropes.
Conflicts of interest
There are no conflicts to declare.
Supplementary Material
Acknowledgments
This research was partially funded by a grant from FEES-CONARE (Ref. 115B5662), the University of Costa Rica (UCR, 115B7202), the Costa Rica Institute of Technology (TEC) and the National Laboratory of Nanotechnology (LANOTEC). We would like to acknowledge the PINN program (PI-0132-15) from the Costa Rican Ministry of Science, Technology and Telecommunications (MICITT) and the Postgraduate office of the TEC by the Doctoral Scholarships awarded to Andrea M. Araya Sibaja. The authors are deeply grateful to Gabriela S. Rauber for her insight, discussions and important contribution to this paper.
Notes and references
- IUPAC, in Compendium of Chemical Terminology, IUPAC, Research Triangle Park, NC, 2nd edn, 2006 [Google Scholar]
- Centore R. Manfredi C. Capobianco A. Volino S. Ferrara M. V. Carella A. Fusco S. Peluso A. J. Org. Chem. 2017;82:5155–5161. doi: 10.1021/acs.joc.7b00380. [DOI] [PubMed] [Google Scholar]
- Babu Nanubolu J. Sridhar B. Ravikumar K. CrystEngComm. 2014;16:10602–10617. doi: 10.1039/C4CE01541J. [DOI] [Google Scholar]
- Chourasiya S. S. Patel D. R. Nagaraja C. M. Chakraborti A. K. Bharatam P. V. New J. Chem. 2017;41:8118–8129. doi: 10.1039/C7NJ01353A. [DOI] [Google Scholar]
- Trujillo C. Sánchez-Sanz G. Alkorta I. Elguero J. ChemPhysChem. 2015;16:2140–2150. doi: 10.1002/cphc.201500317. [DOI] [PubMed] [Google Scholar]
- Vila J. A. Arnautova Y. A. Vorobjev Y. Scheraga H. A. Proc. Natl. Acad. Sci. U. S. A. 2011;108:5602–5607. doi: 10.1073/pnas.1102373108. [DOI] [PMC free article] [PubMed] [Google Scholar]
- Jiménez V. Alderete J. B. J. Mol. Struct.: THEOCHEM. 2006;775:1–7. doi: 10.1016/j.theochem.2006.06.010. [DOI] [Google Scholar]
- Othersen O. G. Beierlein F. Lanig H. Clark T. J. Phys. Chem. B. 2003;107:13743–13749. doi: 10.1021/jp0364506. [DOI] [Google Scholar]
- Mirzaei M. S. Taherpour A. A. Chem. Phys. 2018;507:10–18. doi: 10.1016/j.chemphys.2018.04.006. [DOI] [Google Scholar]
- Bax B. Chung C. Edge C. Acta Crystallogr., Sect. D: Struct. Biol. 2017;73:131–140. doi: 10.1107/S2059798316020283. [DOI] [PMC free article] [PubMed] [Google Scholar]
- Arbačiauskienė E. Krikštolaitytė S. Mitrulevičienė A. Bieliauskas A. Martynaitis V. Bechmann M. Roller A. Šačkus A. Holzer W. Molecules. 2018;23:129. doi: 10.3390/molecules23010129. [DOI] [PMC free article] [PubMed] [Google Scholar]
- Elguero J. Cryst. Growth Des. 2011;11:4731–4738. doi: 10.1021/cg200970t. [DOI] [Google Scholar]
- PubChem, Irbesartan, https://pubchem.ncbi.nlm.nih.gov/compound/irbesartan#section=Names-and-Identifiers
- Böcskei Z. Simon K. Rao R. Caron A. Rodger C. A. Bauer M. Acta Crystallogr., Sect. C: Cryst. Struct. Commun. 1998;54:808–810. doi: 10.1107/S0108270197019884. [DOI] [Google Scholar]
- Chida R. Hisauchi I. Toyoda S. Kikuchi M. Komatsu T. Hori Y. Nakahara S. Sakai Y. Inoue T. Taguchi I. Hypertens. Res. 2015;38:765–769. doi: 10.1038/hr.2015.82. [DOI] [PubMed] [Google Scholar]
- Taguchi I. Toyoda S. Takano K. Arikawa T. Kikuchi M. Ogawa M. Abe S. Node K. Inoue T. Hypertens. Res. 2013;36:608–613. doi: 10.1038/hr.2013.3. [DOI] [PubMed] [Google Scholar]
- Bauer M. Harris R. K. Rao R. C. Apperley D. C. Rodger C. A. J. Chem. Soc., Perkin Trans. 2. 1998:475–482. doi: 10.1039/A708038G. [DOI] [Google Scholar]
- Alkorta I. Rozas I. Elguero J. J. Chem. Soc., Perkin Trans. 2. 1998:2671–2676. doi: 10.1039/A804677H. [DOI] [Google Scholar]
- Taulelle P. Sitja G. Pépe G. Garcia E. Hoff C. Veesler S. Cryst. Growth Des. 2009;9:4706–4709. doi: 10.1021/cg900567z. [DOI] [Google Scholar]
- Pranzo M. B. Cruickshank D. Coruzzi M. Caira M. R. Bettini R. J. Pharm. Sci. 2010;99:3731–3742. doi: 10.1002/jps.22072. [DOI] [PubMed] [Google Scholar]
- Thomas L. H. Wales C. Wilson C. C. Chem. Commun. 2016;52:7372–7375. doi: 10.1039/C6CC01027J. [DOI] [PubMed] [Google Scholar]
- Tilborg A. Springuel G. Norberg B. Wouters J. Leyssens T. Cryst. Growth Des. 2014;14:3408–3422. doi: 10.1021/cg500358h. [DOI] [Google Scholar]
- Epa K. Aakeröy C. B. Desper J. Rayat S. Chandra K. L. Cruz-Cabeza A. J. Chem. Commun. 2013;49:7929. doi: 10.1039/C3CC43935F. [DOI] [PubMed] [Google Scholar]
- Wales C. Thomas L. H. Wilson C. C. CrystEngComm. 2012;14:7264. doi: 10.1039/C2CE26069G. [DOI] [Google Scholar]
- Ghosh S. Bag P. P. Reddy C. M. Cryst. Growth Des. 2011;11:3489–3503. doi: 10.1021/cg200334m. [DOI] [Google Scholar]
- Fu X. Li J. Wang L. Wu B. Xu X. Deng Z. Zhang H. RSC Adv. 2016;6:26474–26478. doi: 10.1039/C5RA27759K. [DOI] [Google Scholar]
- Juribašić M. Bregović N. Stilinović V. Tomišić V. Cindrić M. Šket P. Plavec J. Rubčić M. Užarević K. Chem.–Eur. J. 2014;20:17333–17345. doi: 10.1002/chem.201403543. [DOI] [PubMed] [Google Scholar]
- Stilinović V. Kaitner B. Cryst. Growth Des. 2012;12:5763–5772. doi: 10.1021/cg301267h. [DOI] [Google Scholar]
- Katritzky A. R., Ramsden C. A., Joule J. A., Zhdankin V. V., Katritzky A. R., Ramsden C. A., Joule J. A. and Zhdankin V. V., in Handbook of Heterocyclic Chemistry, 2010, pp. 139–209 [Google Scholar]
- Braslavsky S. E. Pure Appl. Chem. 2007;79:293–465. [Google Scholar]
- Griffiths T. R. Pugh D. C. Coord. Chem. Rev. 1979;29:129–211. doi: 10.1016/S0010-8545(00)82109-8. [DOI] [Google Scholar]
- Dean J. A., Lange's Handbook Of Chemistry, 15th edn, 1999 [Google Scholar]
- Zoski C. G., Handbook of electrochemistry, 2007 [Google Scholar]
- Agmon N. Chem. Phys. Lett. 1995;244:456–462. doi: 10.1016/0009-2614(95)00905-J. [DOI] [Google Scholar]
- Wong M. W. Leung-Toung R. Wentrup C. J. Am. Chem. Soc. 1993;115:2465–2472. doi: 10.1021/ja00059a048. [DOI] [Google Scholar]
- Asakawa N. Kuroki S. Kurosu H. Ando I. Shoji A. Ozaki T. J. Am. Chem. Soc. 1992;114:3261–3265. doi: 10.1021/ja00035a016. [DOI] [Google Scholar]
- Patterson-Elenbaum S. Stanley J. T. Dillner D. K. Lin S. Traficante D. Magn. Reson. Chem. 2006;44:797–806. doi: 10.1002/mrc.1851. [DOI] [PubMed] [Google Scholar]
- Trifonov R. E. Alkorta I. Ostrovskii V. A. Elguero J. J. Mol. Struct.: THEOCHEM. 2004;668:123–132. doi: 10.1016/j.theochem.2003.10.019. [DOI] [Google Scholar]
- Wofford D. S. Forkey D. M. Russell J. G. J. Org. Chem. 1982;47:5132–5137. doi: 10.1021/jo00147a018. [DOI] [Google Scholar]


