Abstract
A new homogeneous heteropolysaccharide (CMSPA90-1) was purified from bergamot by DEAE sepharose fast flow and Sephadex G-75 columns, and was shown to have a molecular weight of 17.6 kDa. Its chemical structure was elucidated by acid hydrolysis and methylation analysis, along with high-performance anion-exchange chromatography, Fourier transform infrared spectroscopy coupled with gas chromatography-mass spectrometry, NMR spectroscopies, the Congo red test, and circular dichroism. CMSPA90-1 consisted of a pyranoside and funanside with branches containing α- and β-configurations simultaneously. Arabinose and glucose might form an arabinoglucan backbone. The ultrastructure of CMSPA90-1 was further characterized by scanning electron microscopy (SEM) and atomic force microscopy (AFM). The results of thermogravimetric analysis (TGA) revealed that CMSPA90-1 had good thermal stability. The results of DPPH˙ and ABTS+˙ radical scavenging assays indicated that CMSPA90-1 exhibited free-radical-scavenging properties. Otherwise, CMSPA90-1 could promote the proliferation of mouse splenocytes and the neutral red phagocytosis of RAW264.7 cells, which indicated that CMSPA90-1 could be researched and developed as one of the potential functional foods or natural medicines.
A new homogeneous heteropolysaccharide (CMSPA90-1) was purified from bergamot by DEAE sepharose fast flow and Sephadex G-75 columns, and was shown to have a molecular weight of 17.6 kDa.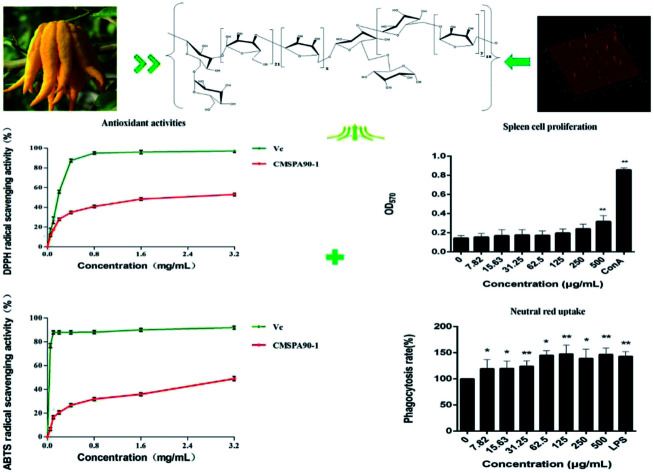
Introduction
Citrus medica L. var. sarcodactylis Swingle, widely known as the bergamot or bergamot orange, belongs to the Rutaceae family. Bergamot contains polysaccharides, alkaloids, saponins, flavonoids, limonene, phytosterols, glycosides, hesperidin, and other physiologically active substances, all of which have been used traditionally for the treatment of tracheitis, angiocardiopathy, hypertension, respiratory tract infections, and asthma.1 Since the Lentinus edodes polysaccharide was first found to have antitumor properties,2 the extraction, purification, structural elucidation and bioactive assays of polysaccharides have received increased attention from researchers. Polysaccharides have a variety of physiological properties, such as antioxidant, antitumor, antiviral, and immunological properties.3,4 Many polysaccharides are ideal candidates for drug delivery and biomedical applications as they are easily obtained from natural sources.5
Few reports are available on the structural and biological properties of polysaccharides derived from bergamot. In the present study, a new polysaccharide, CMSPA90-1, was purified from the crude polysaccharide via DEAE sepharose fast flow and sephadex G-75 gel filtration chromatographies. Its structural elucidation was determined by monosaccharide analysis, infrared spectroscopy, methylation analyses, and 1D and 2D NMR spectroscopies. The advanced structure of the polysaccharide was preliminarily clarified by Congo red test, circular dichroism spectroscopy (CD), thermogravimetry analysis (TGA), scanning electron microscopy (SEM), and atomic force microscopy (AFM). In addition, the bioactivities of CMSPA90-1 were investigated for the antioxidative properties against DPPH˙ and ABTS+˙ radicals as well as the effects on the proliferation of mouse splenocytes and the neutral red phagocytosis of RAW264.7 cells.
Materials and methods
Plant materials and chemicals
Bergamot was obtained from the Beijing Tong Ren Tang Drugstore in Guangzhou, China. The material was identified by Professor R.M. Yu, College of Pharmacy, Jinan University, China. DEAE sepharose fast flow and sephadex G-75 columns were obtained from Whatman Ltd. T-series dextrans, trifluoroacetic acid (TFA), ascorbic acid (vitamin C, Vc), chlorosulfonic acid (CSA), and pyridine (Pyr) were obtained from Guangzhou Chemical Reagent Company, China. Dimethyl sulfoxide (DMSO), 3-(4,5-dimethylthiazol-2-y1)-2,5-diphenyltetrazolium bromide (MTT), trypan, concanavalin A (Con A), penicillin G, and streptomycin sulfate were obtained from Sigma Chemical Co. (St. Louis, MO, USA). RPMI 1640 medium and fetal bovine serum (FBS) were purchased from Gibco Invitrogen Corp. (San Diego, CA, USA). Other chemicals and reagents were of analytical grade.
Extraction, isolation, and purification of crude polysaccharides
Dried fruit pulps of bergamot were milled into powder. The dried powder (500 g) was pretreated with 95% ethanol (1 : 8, w/v) twice for 3 h to remove the pigments, benzine, and other impurities. The residue was dried at 55 °C for 6 h. Dried residues (260 g) were added to a solution of simulated gastric juice (9.5 L, pH 1.5), which was used to mimic the conditions of the stomach according to the ref. 6. Simulated gastric juice contained HCl (1.34 g L−1), NaCl (2.16 g L−1), KH2PO4 (0.63 g L−1), CaCl2 (0.12 g L−1), KCl (0.39 g L−1), and pepsin (0.53 g L−1). Extraction was conducted for 3 h at 37 °C, repeated twice. After centrifugation at 8000g for 15 min and concentration with a rotary evaporator at 70 °C under vacuum, the mixture was obtained by ethanol precipitation at the final concentration of 90% (v/v) ethanol at 4 °C overnight. The precipitate was then deproteinized with Sevag reagent (chloroform/n-butanol at a ratio of 4 : 1, v/v), repeated four times.7 And then, the solution was dialyzed against tap water for 48 h and distilled water for 24 h. The resulting polysaccharide solution was concentrated and lyophilized, and the crude polysaccharide (CMSPA90) was obtained.
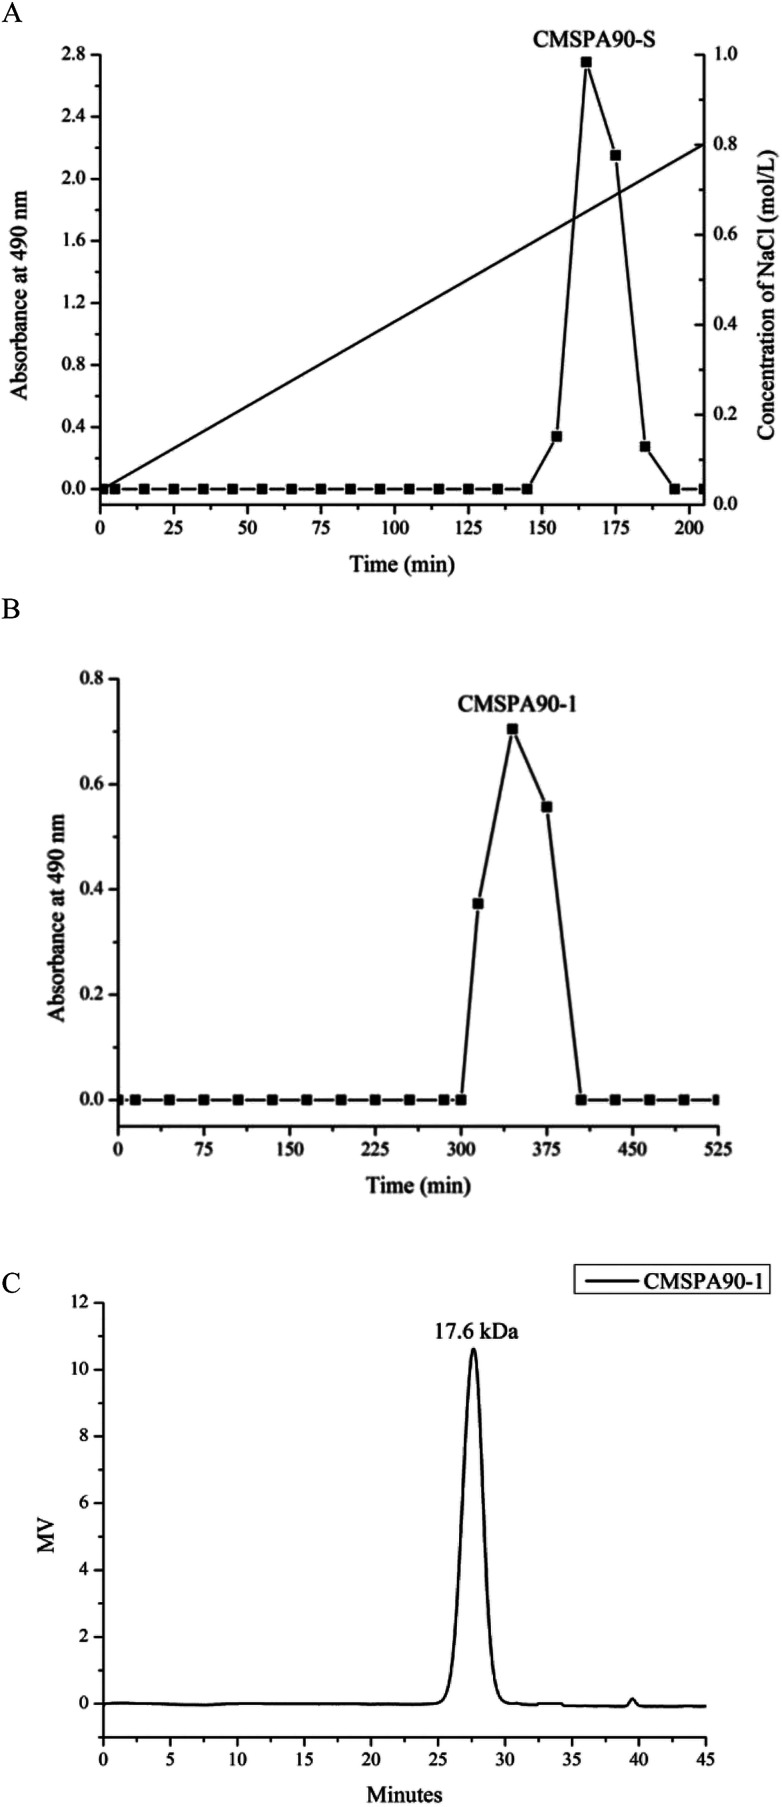
CMSPA90 was dissolved in distilled water, filtered through a filter (0.45 μm), purified on DEAE sepharose fast flow anion-exchange column (2.5 × 40 cm), and eluted with distilled water and a linear gradient of NaCl from 0 to 0.8 M at a flow rate of 1.6 mL min−1. The eluate (8 mL per tube) was collected, and carbohydrates were assayed by the phenol–sulfuric acid method.8 A sharp peak was collected, dialyzed, and further purified by sephadex G-75 gel filtration column (1.5 × 100 cm), eluting with distilled water. The flow rate was maintained at 0.3 mL min−1. Consequently, a polysaccharide was obtained and coded CMSPA90-1 (2.34 g), which had [α]20D = −364.3° (c 1.0, water), and was used in the subsequent studies on its structure and bioactivity.
Analyses of CMSPA90-1
The phenol–sulfuric acid colorimetric method was used to determine total sugar content.9 The UV spectrum of CMSPA90-1 (100 μg mL−1) was determined by a UV-2401 spectrophotometer in the wavelength range of 200–350 nm. IR spectrum was recorded with a Perkin Elmer spectrophotometer with KBr pellets. The dried powder (1 mg) was mixed with KBr powder, pressed into pellets and analyzed in the wavelength range of 4000–400 cm−1.
Homogeneity and average molecular weight
Homogeneity and molecular weight were determined by high-performance gel-permeation chromatography (HPGPC), with standard dextran performed on Waters HPLC system. CMSPA90-1 (2 mg mL−1) was detected by first dissolving in KH2PO4 (0.02 M), filtrating it through a 0.22 μM microporous filtering film, and loading it to the columns, which were eluted with KH2PO4 (0.02 M) at a flow rate of 0.6 mL min−1. The elution volume of CMSPA90-1 was plotted and the molecular weight was measured.10
Monosaccharide composition analysis
CMSPA90-1 (5 mg) was hydrolyzed with 10 mL of 2 M trifluoroacetic acid (TFA) at 120 °C in a sealed tube for 6 h. Excess TFA was removed by evaporation and co-distilled with methanol after the hydrolysis was completed. The monosaccharide composition was measured by HPAEC-PAD. The hydrolysate was re-dissolved in 0.5 mL of distilled water and then filtered with a 0.45 μm filter. The resulting solution (20 μL) was injected on the Dionex ICS-2500 system for the ionic chromatography analysis by HPAEC-PAD, and eluted with a solution of water and 200 mM NaOH with a volume ratio of 92 : 8.11
Methylation analysis
CMSPA90-1 was methylated several times according to the method described in ref. 12. NaOH (500 mg) and CMSPA90-1 (10 mg) were fully dissolved in 10 mL of DMSO with an ultrasonic wave for 0.5 h. Methyl iodide (3 mL) was added for methylation for 1 h at room temperature. The reaction was kept in darkness for 8 h at 25 °C and terminated by distilled water (3 mL). The methylated products were extracted with chloroform and evaporated. Disappearance of the O–H band (3200–3700 cm−1) in IR indicated that it is success for methylation. The methylated products were hydrolyzed in 2 M TFA for 6 h, reduced with NaBH4 (25 mg) at 40 °C for 0.5 h, and then acetylated with acetic anhydride and pyridine at 100 °C for 1 h. The alditol acetates were steamed by rotary evaporator and analyzed by gas chromatography-mass spectrometry (GC-MS).
Nuclear magnetic resonance spectroscopy
Dried CMSPA90-1 (50 mg) was dissolved in 0.6 mL of 99.98% D2O and then filtered with a 0.45 μm filter. One-dimensional [1D, 1H and 13C nuclear magnetic resonance (NMR)] and two-dimensional (2D, HSQC and HMBC) NMR spectroscopies were recorded on an AVANCE 600 MHz NMR spectrometer at 25 °C.13
Congo red test
The interaction of Congo red with CMSPA90-1 was analyzed according to the method with minor modifications.14 The solution of CMSPA90-1 (0.5 mg mL−1) was mixed with Congo red solution (50 mM) and 1 M NaOH. After placing the samples at room temperature for 15 min, the transition of the maximum absorption wavelength was measured in the region of 400–600 nm at various NaOH concentrations (0, 0.1, 0.2, 0.3, 0.4, 0.5, and 0.6 M) by a UV-2401 spectrophotometer.
Circular dichroism analysis
Circular dichroism (CD) spectrum was used to determine the conformational transitions of CMSPA90-1. To investigate the conformational changes of secondary structures, Congo red was added to the sample solution.15 Data were recorded from 190 to 260 nm at 1 nm intervals at 25 °C.
Thermal properties
The thermal properties of CMSPA90-1 were evaluated using a TGA/DSC simultaneous thermal analyzer (Germany) at a temperature range of 25–600 °C at a heating rate of 10 °C min−1 under N2 atmosphere. CMSPA90-1 (5 mg) was weighed and placed in the equipment alumina crucible with an empty aluminum pan used as the reference.16
Scanning electron microscopy and atomic force microscopy
Scanning electron microscope (SEM) images of CMSPA90-1 were observed by scanning electron microscopy (Philips XL-30). The powder samples were placed on a metal stub and then sputtered with gold powder under reduced pressure.17 The samples were observed with 300- and 500-fold magnification at 5.0 kV acceleration voltage.
The ultrastructure of CMSPA90-1 was also observed by atomic force microscopy (AFM) (BioScope Catalyst Bruker, Bil-lerica, MA). The sample was dissolved in pure water to a stock solution of 1 μg mL−1 and stirred for 4 h at room temperature. The diluted solution (5 mL) was then dropped onto a freshly cleaved mica substrate and dried with air.18 A tube-type piezoelectric scanner (5 × 5 μm) and a Si3N4 probe (Olympus, Japan) were employed, and images were obtained simultaneously with 256 × 256 pixels at a scanning rate of 1.0 Hz per line.
Measurement of DPPH˙ radical-scavenging activity
DPPH˙ free radical has been widely used to evaluate the radical-scavenging ability of polysaccharides. 20 μL of CMSPA90-1 solutions (0–3.2 mg mL−1) were mixed with 180 μL of DPPH of ethanol solution (0.2 mM). The absorbance was measured at 517 nm. And then, the solution was shaken and maintained in the dark for 30 min. Vc was used as the positive control. The DPPH˙ free radical scavenging capability was calculated as follows:Scavenging ability (%) = (A0 − A1)/A0 × 100%where A0 is the absorbance in the absence of the test sample and A1 is the absorbance in the presence of the test sample.19
Measurement of ABTS+˙ radical-scavenging activity
ABTS+˙ free radical scavenging activity was measured according to the method.20 ABTS (0.2 mL, 7.4 mM) was added into 0.2 mL of K2S2O8 (2.6 mM) in a centrifuge tube to generate ABTS+˙. The reaction was kept in the dark for 12 h at room temperature. The mixture was then diluted with absolute ethanol to an absorbance value of 0.7 ± 0.02 at 734 nm. CMSPA90-1 solutions (40 μL) at different concentrations (0–3.2 mg mL−1) were added to 160 μL of ABTS+˙ reagent. Vc was used as the positive control. The solutions were kept for 15 min at room temperature, and the absorbance was recorded at 517 nm. The ABTS+˙ free radical scavenging capability was calculated as follows:Scavenging ability (%) = (A0 − A)/A0 × 100%where A0 is the absorbance in the absence of the test sample and A is the absorbance in the presence of the test sample.
Animals and cell line
Kunming mice (grade II, SCXK 2011-0029, 20–25 g, 6–8 weeks old) were obtained from the Experimental Animal Center, Sun Yat-sen University, China. Animals were acclimatized for at least 7 days prior to use and maintained in a temperature-controlled environment (22 ± 2 °C) with a 12 h light–dark cycle and free access to water and standard rodent chow. The RAW264.7 macrophage cell line was obtained from the Cell Bank of Type Culture Collection of the Chinese Academy of Sciences (Shanghai, China). The RAW264.7 cells were maintained in DMEM supplemented with 100 IU mL−1 penicillin, 100 μg mL−1 streptomycin and 10% FBS at 37 °C under humidified air with 5% CO2. The animal experiments were carried out in compliance with the Animal Management Rules of the Ministry of Health of the People's Republic of China and approved by the Animal Care and Use Committee of Jinan University.
Splenic lymphocyte proliferation assay
MTT assay was used to analyze the splenic lymphocyte proliferation of CMSPA90-1. After mice were sacrificed, spleens were separated and crushed in phosphate-buffered saline (PBS) buffer. After centrifugation at 1500 rpm for 5 min, red blood cells were removed with a Tris–HCl–NH4Cl solution (pH 7.2). Cell pellets were re-suspended in RPMI-1640 medium and diluted to 5 × 10⁶ cells per mL. Splenocytes were further placed into a 96-well flat-bottom microplate (100 μL per well, 2000 cells per well) with concentrations of CMSPA90-1 at 0, 7.82, 15.63, 31.25, 62.5, 125, 250, and 500 μg mL−1 to incubate at 37 °C under 5% CO2 for 48 h. Concanavalin A (Con A) (5 μg mL−1) was used as the positive control. Then, 20 μL of MTT (5 mg mL−1) was added to each well for 4 h. The formazan precipitate was solubilized in DMSO (200 μL per well) after removal of MTT by centrifugation. Splenic lymphocyte proliferation was detected at A570 nm according to a multifunctional microplate reader.21
Phagocytosis assay
The phagocytic ability of the macrophages was measured by the neutral red uptake assay. Confluent cultures of RAW264.7 cells in 96-well plates were exposed to medium alone, or with CMPA90-1 at different concentrations of 0, 7.82, 15.63, 31.25, 62.5, 125, 250, and 500 μg mL−1, or LPS solution and incubated for 48 h at 37 °C. PBS was used to remove the non-adherent cells after removal of the supernatant, and 100 μL of neutral red solution was added to each well with incubation for 1 h, then the supernatant was removed. The cells were washed with PBS twice to remove excess neutral red solution. Cell lysate (100 μL, 1.0 M acetic acid/ethanol = 50 : 50, v/v) was added to each well and incubated for 1 h at room temperature. Each well was measured at A540 nm by a multifunctional microplate reader.22
Statistical analysis
All data are presented as mean value ± standard deviation (SD) in triplicate. The software SPSS 11.5 was used to perform statistical analysis with an independent T test. Differences were considered statistically significant when P < 0.05 and P < 0.01.
Results and discussion
Isolation and purification of CMSPA90-1
Crude polysaccharide (CMSPA90) was obtained from dried bergamot with a yield of 0.51%. After separating and fractionating by DEAE sepharose fast flow column, a single peak (CMSPA90-S) was observed (Fig. 1A). CMSPA90-S was further purified by a sephadex G-75 column (Fig. 1B). After lyophilization, the total sugar content of CMSPA90-1 was measured at 97.77% ± 1.4% (w/w), and the absence of the absorption peak at 260–280 nm in the UV spectrum indicated that no proteins or nucleic acid were present in CMSPA90-1.23 The uronic acid content was below the detection limit, indicating that CMSPA90-1 was a neutral polysaccharide. The average molecular weight of CMSPA90-1 was determined to be 17.6 kDa by the HPGPC system (Fig. 1C). A single and symmetrical narrow peak in the profile indicated that CMSPA90-1 was a homogeneous polysaccharide.
Fig. 1. Chromatography of CMSPA90 from bergamot by DEAE-sepharose fast flow chromatography (A), chromatography of CMSPA90-1 by sephadex G-75 (B), and HPGPC of CMSPA90-1 (C).
FT-IR spectral analysis of CMSPA90-1
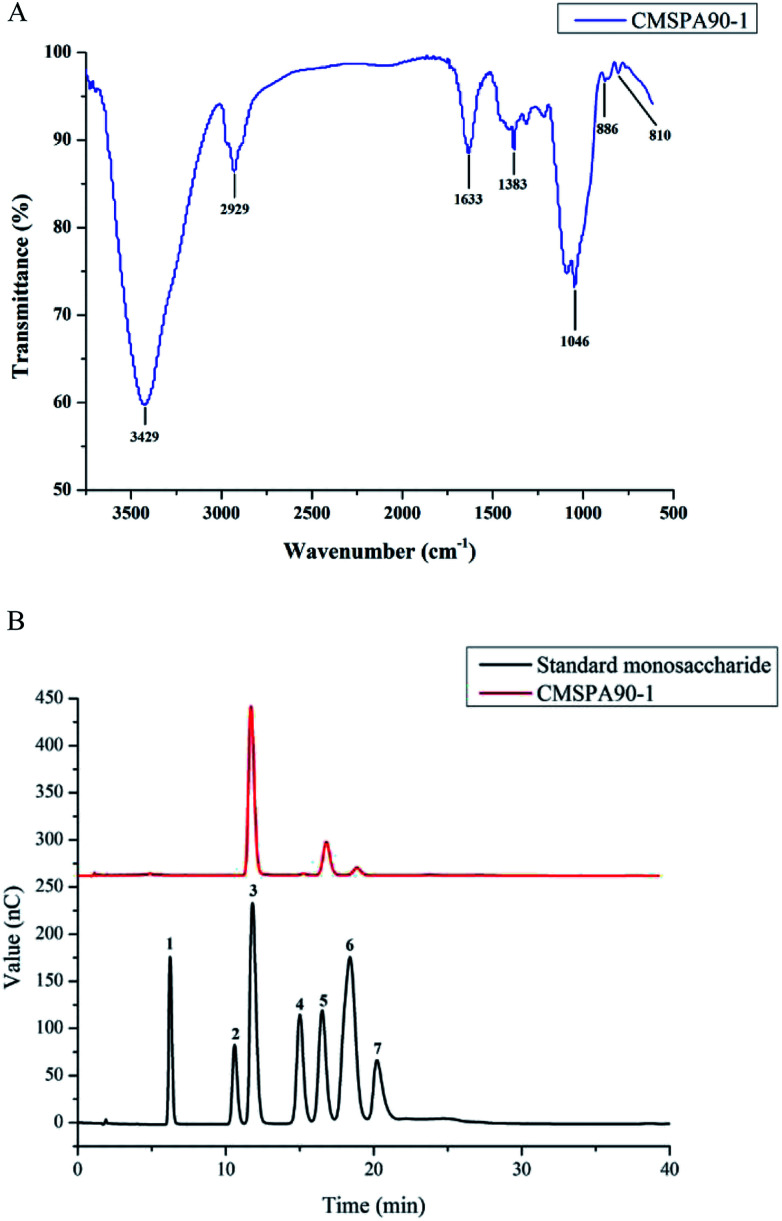
Fourier transform infrared (FT-IR) spectrum of CMSPA90-1 revealed the major functional groups and chemical bonds (Fig. 2A). In the spectrum, the broad absorption at 3429, 2929, and 1633 cm−1 corresponded to O–H, C–H, and C–O stretching vibrations, respectively. The signal at 1383 cm−1 was attributed to deforming vibrations of C–H. The absorption band at 1046 cm−1 was attributed to C–O–C stretching vibrations and C–O–H bending vibrations. The characteristic absorptions at 810 and 886 cm−1 indicated that α- and β-configurations were present simultaneously in CMSPA90-1. No absorption at 1740 cm−1 was observed, indicating that no uronic acid was present.24
Fig. 2. FT-IR spectrum of CMSPA90-1 (A), HPAEC of standard monosaccharides and CMSPA90-1 peaks: (1) fucose, (2) rhamnose, (3) arabinose, (4) galactose, (5) glucose, (6) mannose, (7) fructose (B).
Monosaccharide composition of CMSPA90-1
Arabinose, galactose, glucose, and mannose were identified by HPAEC-PAD after CMSPA90-1's acidic hydrolysation with the molar ratio of 72.15 : 1.00 : 17.78 : 4.44 (Fig. 2B), indicating that CMSPA90-1 was a type of heteropolysaccharide.
Methylation and GC-MS analysis of CMSPA90-1
To obtain more information on the linkage sites and the corresponding percentage of monosaccharide, methylation analysis of CMSPA90-1 was conducted. GC-MS results showed five methylated alditol acetates of sugar residues, including 1,5-tri-O-acetyl-2,3,4,6-tri-O-methyl-d-galactitol, 1,5,6-tri-O-acetyl-2,3,4-tri-O-methyl-d-glucitol, 1,5-di-O-acetyl-2,3-di-O-methyl-l-arabinitol, 1,3,4-tri-O-acetyl-2,5-di-O-methyl-l-arabinitol and 1,3,5,6-tetra-O-acetyl-2,4-di-O-methyl-d-mannitol, indicating that CMSPA90-1 was composed of d-Galp-(1→, →6)-d-Glcp-(1→, →5)-l-Araf-(1→, →3)-l-Araf-(1→ and →3,6)-d-Manp-(1→ at a ratio of 1.00 : 18.06 : 50.21 : 21.79 : 2.03 (Table 1).
Methylation analysis of CMSPA90-1.
| Methylation sugar | Retention time (min) | Molar ratio | Mass fragments (m/z) | Linkage type |
|---|---|---|---|---|
| 2,3,4,6-Me4-Gal | 16.62 | 1.00 | 51, 73, 88, 101, 113, 127 | T→ |
| 2,3,4-Me3-Glc | 17.71 | 18.06 | 60, 74, 87, 101, 117, 129, 175 | 1→6 |
| 2,3-Me2-Ara | 23.73 | 50.21 | 60, 71, 87, 101, 117, 145, 189 | 1→5 |
| 2,5-Me2-Ara | 27.46 | 21.79 | 60, 71, 87, 101, 117, 145, 189 | 1→3 |
| 2,4-Me2-Man | 38.81 | 2.03 | 60, 73, 85, 98, 117, 126, 157 | 1→3,6 |
NMR spectroscopy analysis
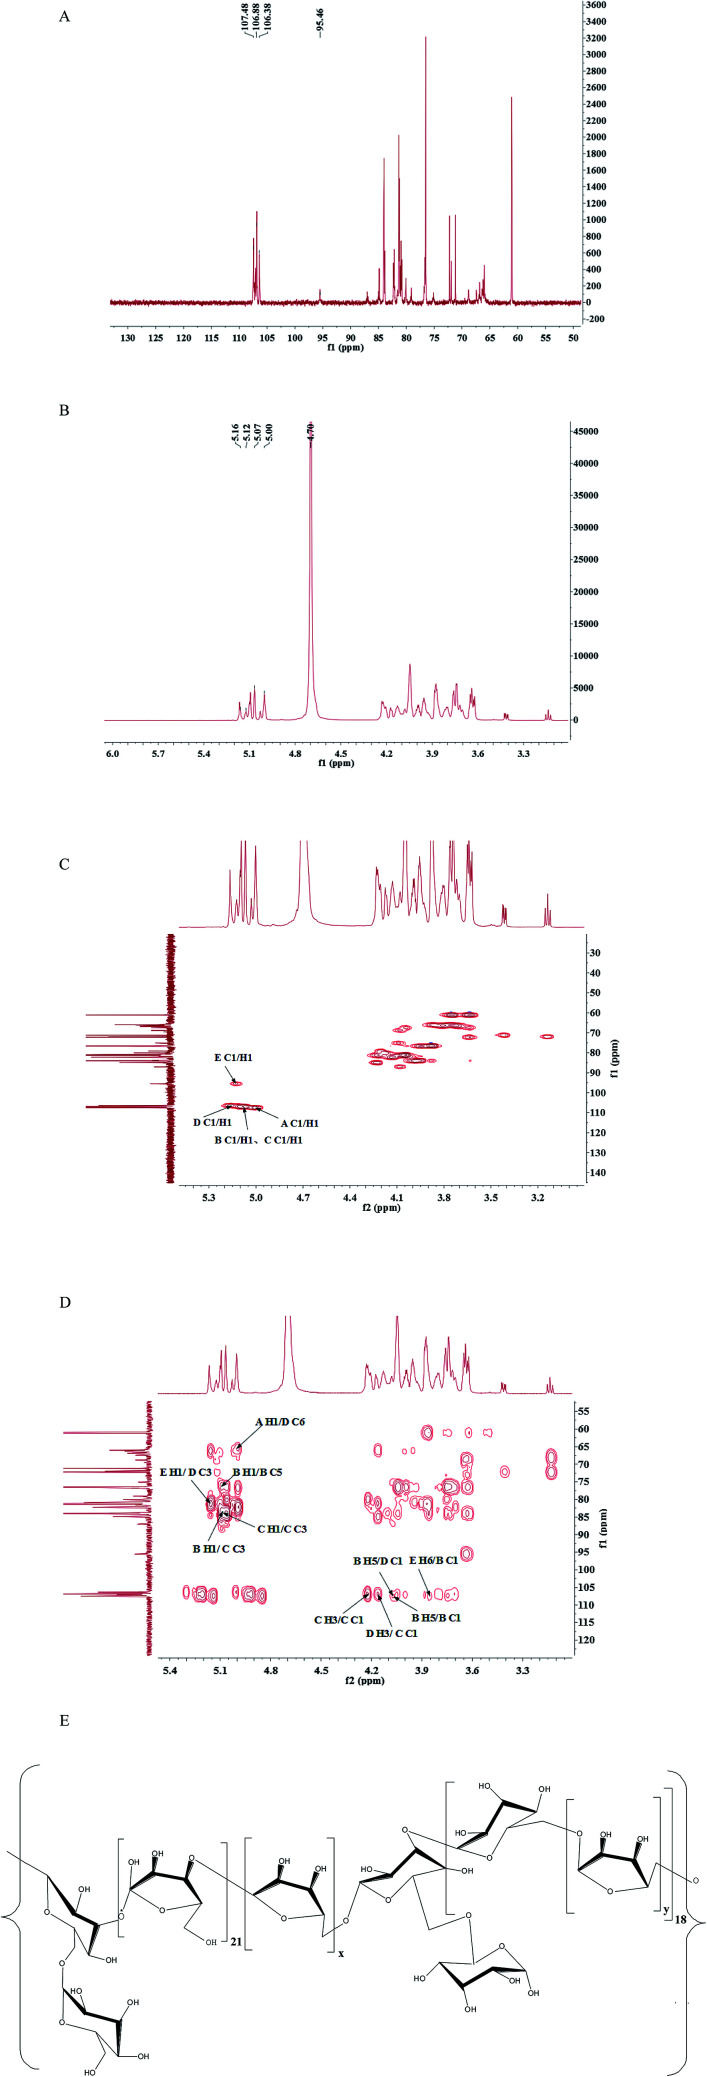
It was difficult to confirm the anomeric signals of CMSPA90-1 from 1H (Fig. 3A) due to the overlap of most proton signals. In addition, some of the signals of anomeric carbon were too weak to distinguish from noise in 13C NMR spectra (Fig. 3B). Four correlation peaks at 5.01/107.45 ppm, 5.08/106.92 ppm, 5.15/106.36 ppm and 5.13/95.50 ppm were clearly observed in the anomeric region of the HSQC spectrum of CMSPA90-1 (Fig. 3C), revealing that there were five sugar residues, with B and C being arabinose residues with different linkages (denoted as A, B, C, D, E, respectively). The results of methylation analysis indicated that →5)-l-Araf-(1→ was the most abundant residue. Meanwhile, the combination of the downfield shifts of C-5 (76.37 ppm) and the two strong correlation peaks at 5.08/76.37 ppm and 4.07/106.92 ppm in the HMBC spectrum (Fig. 3D) confirmed that residue B was the →5)-l-Araf-(1→. Accordingly, the methylation analysis data, the 1H, 13C, and 2D NMR techniques (HSQC and HMBC spectra), as well as data reported in the literature allowed the complete descriptions of residues A, B, C, D and E (Table 2).25–28 In addition, the linkage sites and sequence among the sugar residues were also analyzed according to the HMBC spectrum (Fig. 3D). The strong signal at 5.08/76.37 ppm (B H1/B C5) showed that C-5 of residue B was linked to O-1, also of residue B. The strong correlation peak at 4.07/106.92 ppm (B H5/B C1) suggested that C-1 of residue B was linked to O-5 of residue B. Meanwhile, the methylation and GC-MS results revealed that (1→5)-linked arabinose accounted for 53.94% of the total sugar residues. Thus, the presence of a repetitive unit of (1→5)-linked arabinose was confirmed.
Fig. 3. 1H (A), 13C (B), HSQC spectra (C), HMBC spectra (D), and proposed primary structure of repeating unit (E) of CMSPA90-1.
1H and 13C NMR chemical shifts of CMSPA90-1 (ppm).
| Sugar residue | Chemical shifts | |||||
|---|---|---|---|---|---|---|
| C1/H1 | C2/H2 | C3/H3 | C4/H4 | C5/H5 | C6/H6 | |
| A: β-d-Gal(1→ | 107.48/5.00 | 76.71/3.94 | 80.73/4.17 | 81.12/4.05 | 76.53/3.94 | 66.13/3.72 |
| B: →5)-α-l-Ara(1→ | 106.88/5.07 | 83.90/3.88 | 76.76/4.09 | 84.10/3.63 | 76.37/4.07 | |
| C: →3)-α-l-Ara(1→ | 106.88/5.07 | 81.41/4.04 | 83.98/4.22 | 79.90/4.18 | 65.99/3.72 | |
| D: →3,6)-α-d-Man(1→ | 106.38/5.16 | 84.44/3.88 | 81.29/4.17 | 84.90/3.98 | 76.44/3.94 | 66.40/4.04 |
| E: →6)-α-d-Glc(1→ | 95.46/5.12 | 72.19/3.64 | 76.37/3.88 | 79.93/4.05 | 79.57/4.17 | 65.99/3.86 |
Similarly, the strong correlation peak at 5.08/83.98 ppm (C H1/C C3) suggested that C-3 of residue C was linked to O-1 of residue C. The strong correlation peak at 4.22/106.92 ppm (C H3/C C1) suggested that C-1 of residue C was linked to O-3 of residue C, confirming the presence of a repetitive unit of (1→3)-linked arabinose. Accordingly, the cross peaks at 4.07/106.36 ppm (B H5/D C1), 4.17/106.92 ppm (D H3/C C1), 5.08/83.98 ppm (B H1/C C3), 5.13/81.29 ppm (E H1/D C3), 3.86/106.92 ppm (E H6/B C1) and 5.01/66.40 ppm (A H1/D C6) suggested that C-1 of residue D was linked to O-5 of residue B; C-1 of residue C was linked to O-3 of residue D; C-3 of residue C was linked to O-1 of residue B; C-3 of residue D was linked to O-1 of residue E; C-1 of residue B was linked to O-6 of residue E and C-6 of residue D was linked to O-1 of residue A. Thus, the speculative structure of CMSPA90-1 was shown in Fig. 3E.
Congo red test
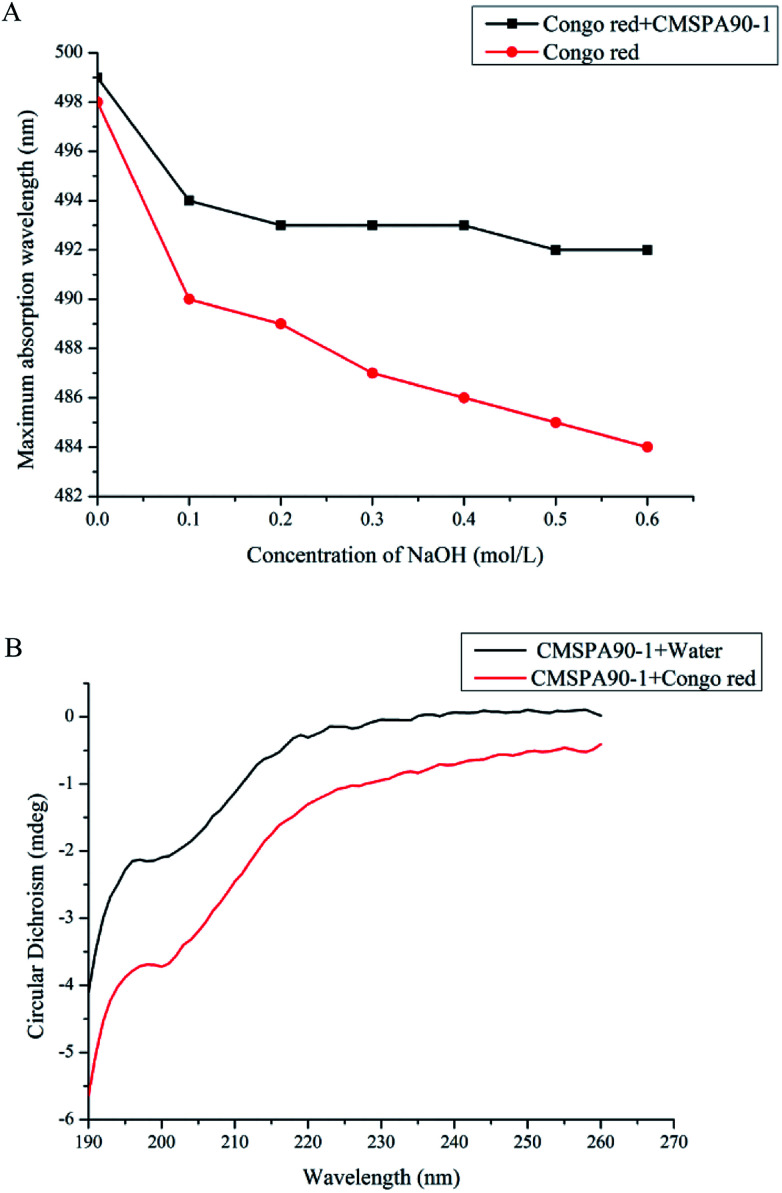
The triple-helical conformation of polysaccharides could be determined by the Congo red test. The complex maximum absorption wavelength (λmax) changed with alkali concentrations ranging from 0 to 0.6 M (Fig. 4A). The maximum absorption wavelengths of Congo red + CMSPA90-1 had a red shift. However, the red shifts of the max of the samples were not observed at all alkali concentrations. Therefore, it could be concluded that the triple-helical structure did not exist in the solution of CMSPA90-1.
Fig. 4. Changes in maximal absorption wavelength of mixture for Congo red and CMSPA90-1 at various concentrations of NaOH (A); CD spectra of CMSPW90-1 (B).
CD spectroscopy
CD spectroscopy could be used to investigate the conformation of polysaccharides in solution.29 The CD spectrum of CMSPA90-1 + Congo red was compared with that of CMSPA90-1 + water at the range from 190 nm to 260 nm. No distinct characteristics of sharply alternating positive and negative Cotton effects were observed after Congo red was added (Fig. 4B), suggesting that no triple helix structure were present in CMSPA90-1,which was consistent with the Congo red test previously performed.
Thermal characteristics
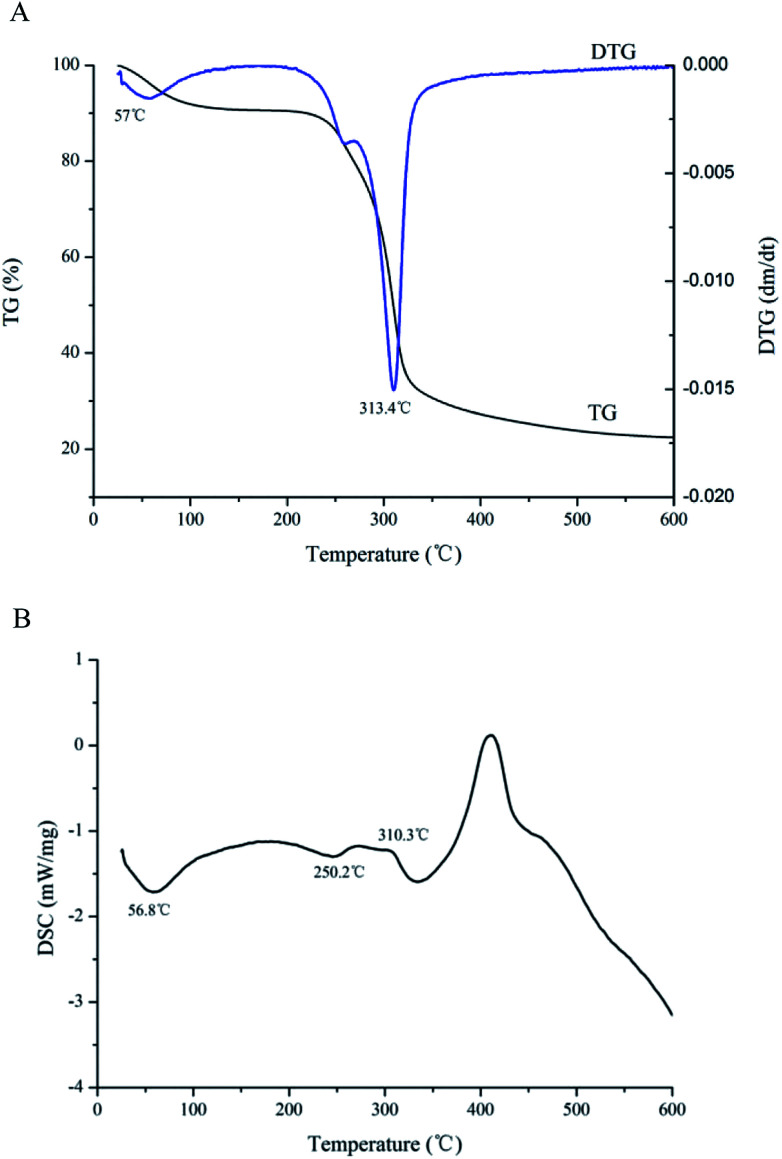
Thermogravimetry analysis (TGA) and differential scanning calorimetry (DSC) were simple and accurate to use for evaluating thermal stability of CMSPA90-1.30 The first mass loss change in the TGA curve was observed at a temperature of 57.5 °C (Fig. 5A), which was attributed to moisture evaporation of CMSPA90-1. The second mass loss change at a temperature of 313.4 °C might be attributed to the thermal decomposition of polysaccharides.31 At the end, ash was found to be 21.4% for CMSPA90-1.
Fig. 5. TGA (A) and DSC (B) results of CMSPA90-1.
DSC could reflect thermal transitions by deformation of a polysaccharide's structure. A decrease in the weight (8.81%) at 56.8 °C in the DSC curve appeared in the first stage (Fig. 5B), indicating the moisture evaporation of polysaccharides. In the second stage, the DSC curve was called quasi-constant rate region since the DSC curve showed a horizontal trend line with an approximately constant value (−1.3 mW mg−1) from 250.2 to 310.3 °C. The TG curve presented a rapid weight loss (63.7%). In the third stage, the DSC curve rose first, and then decreased between 310.3 and 600 °C. It resulted in a slow mass loss (6.1%) that was probably due to the breakage of the depolymerized fragments.32 Overall, these results suggested that CMSPA90-1 could be suitable for applications in thermal processing conditions.
Ultrastructures of CMSPA90-1
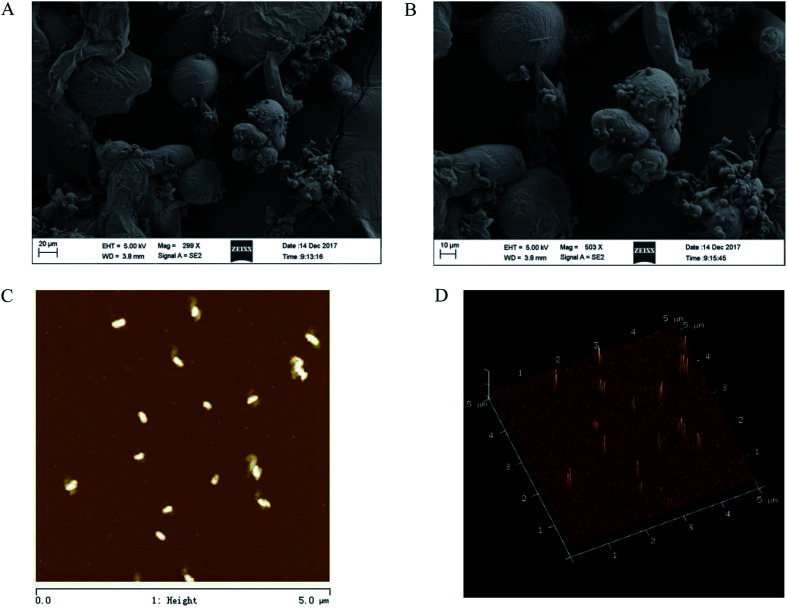
The SEM of CMSPA90-1 revealed that it had a rough surface with randomly distributed individual spherical particles (Fig. 6A and B). The tight configuration of CMSPA90-1 reflected strong interactions between the highly branched polysaccharide chains.33Fig. 6C presented 2D pictures and Fig. 6D provided 3D AFM images of CMSPA90-1. The 2D pictures showed that there were a large number of globular aggregates, indicating the polysaccharide chains were closely twisted together. The 3D pictures showed spherical lumps with diameters ranging from 200 to 300 nm and heights ranging from 16.0 to 20.0 nm. The presence of many spherical and uneven lumps suggested the structures of CMSPA90-1 were branched and entangled, consistent with previous results.
Fig. 6. SEM images of CMSPA90-1 ((A) 300× and (B) 500×), AFM images of CMSPA90-1 ((C) and (D) scan size 5 μm).
Scavenging activity of CMSPA90-1 against DPPH˙ radicals
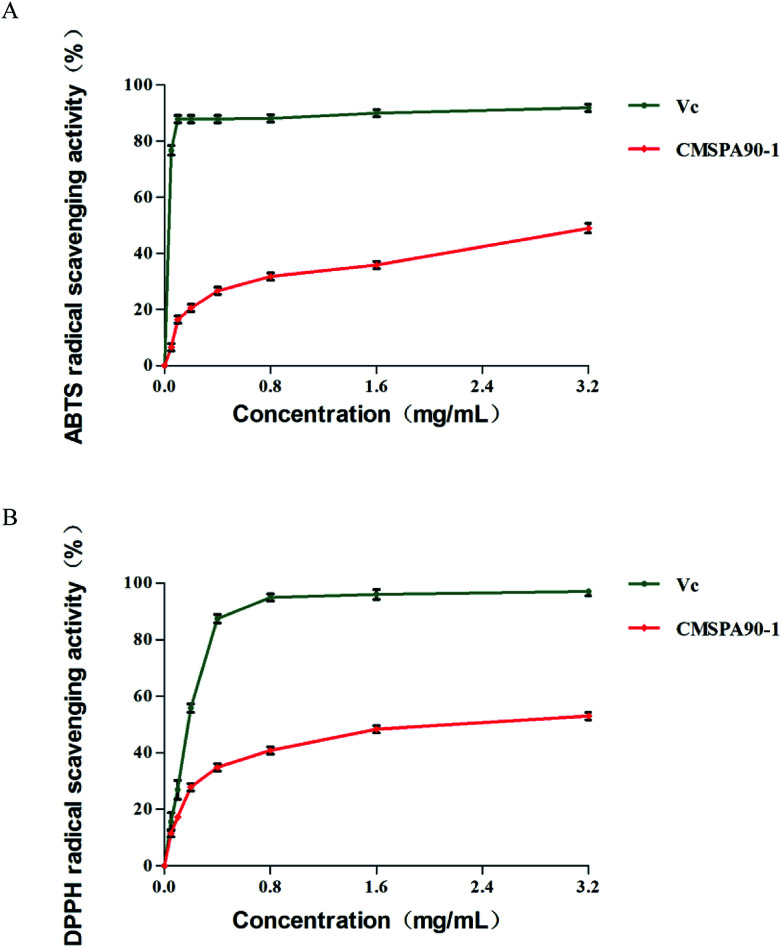
DPPH˙ is a stable and commercially available organic nitrogen radical to evaluate anti-oxidative ability of polysaccharides in vitro. The alcoholic solution of DPPH has a UV-vis absorption maximum at 517 nm.34 CMSPA90-1 and Vc were able to scavenge DPPH˙ radicals to different degrees in a dose-dependent manner when the concentration ranged from 0.05 to 3.2 mg mL−1 (Fig. 7A). The highest DPPH˙ radical scavenging rate of CMSPA90-1 was 52.50% (3.2 mg mL−1).
Fig. 7. Antioxidant activities of CMSPA90-1: DPPH˙ radical-scavenging activity (A), and ABTS+˙ radical-scavenging activity (B). Values are the mean ± SD of three replicates.
ABTS+˙ radical-scavenging properties of CMSPA90-1
The ABTS+˙ free radical could be used to determine the free radical scavenging capacity of various compounds.35 The highest scavenging ratio of ABTS+˙ radicals of CMSPA90-1 (48.74%) was observed at 3.2 mg mL−1 (Fig. 7B). From the figure, the scavenging ability of CMSPA90-1 on ABTS+˙ radicals was concentration-dependent, which was consistent with ref. 36.
Immunoregulatory effects of CMSPA90-1
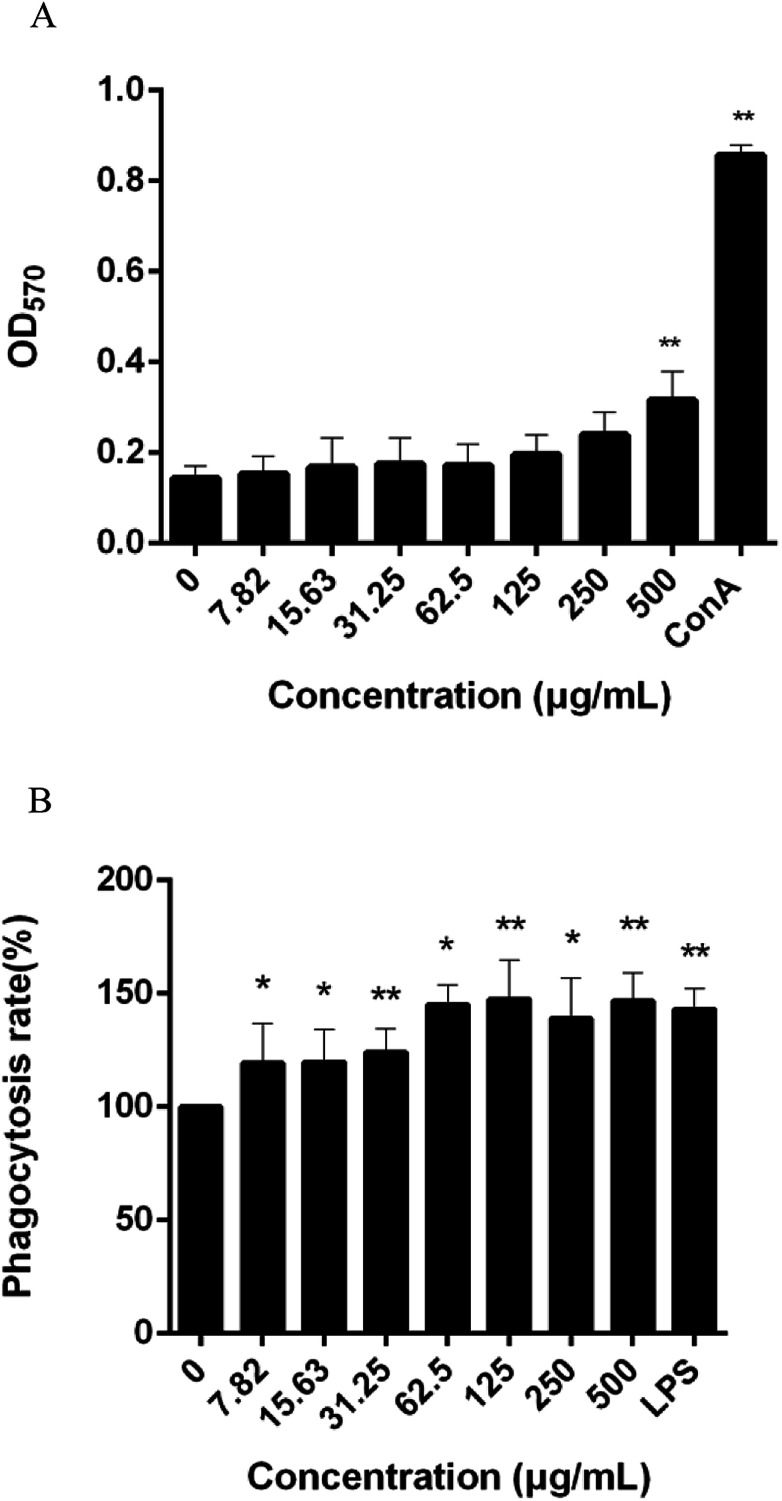
Immunoregulation is one of the basic functions of polysaccharides. The spleen is used for research on antibacterial and antifungal immunization because it combines the innate and adaptive immune system in a uniquely organized way.37 To evaluate the immunoregulatory activity of CMSPA90-1, the effect on lymphocyte proliferation was investigated in murine spleen cells. The result showed that CMSPA90-1 could promote the proliferation of spleen cells in a certain concentration range, and also in a concentration-dependent manner (Fig. 8A).
Fig. 8. Effect of CMSPA90-1 on splenic lymphocyte proliferation. The OD570 nm reflected the proliferative activity of splenic lymphocytes (A); effect of CMSPA90-1 on macrophage phagocytosis, as determined by the neutral red uptake assay (B). Values are the mean ± SD of three replicates. *p < 0.05 and **p < 0.01 compared to negative group.
The first step in an immune response is the phagocytosis of macrophages, and enhanced phagocytic activity indicates the activation of macrophages.38 We used the neutral red uptake method to measure the phagocytic ability of RAW264.7 cells. LPS was used as the positive group. CMSPA90-1 observably promoted phagocytosis activation of RAW264.7 cells to uptake neutral red within a certain concentration range (Fig. 8B). These results demonstrated that CMSPA90-1 could resist foreign invasion and improve organism's immune function.
Conclusion
In this study, CMSPA90-1, a new heteropolysaccharide with good thermal stability, was isolated and purified from bergamot. It was composed of d-Galp-(1→, →6)-d-Glcp-(1→, →5)-l-Araf-(1→, →3)-l-Araf-(1→ and →3,6)-d-Manp-(1→, and had a relative molecular weight of 17.6 kDa. In addition, CMSPA90-1 exhibited a reunion spherical structure with two branches. Otherwise, CMSPA90-1 had no triple helix structure. More interestingly, CMSPA90-1 exhibited DPPH˙ and ABTS+˙ radical scavenging activities and immunoregulatory activities in a certain concentration range. These data could have useful applications in both the health care and pharmaceutical industries for bergamot.
Conflicts of interest
There are no conflicts of interest to declare.
Supplementary Material
Acknowledgments
This research work was financially supported National Natural Science Foundation of China (No. 81673646, 81673571 and 81573568), Major National Science and Technology Projects/Significant New Drugs Creation (No. 2011ZX09102001-033).
References
- He Z. C. Liang F. J. Zhang Y. Y. Pan Y. J. Carbohydr. Res. 2014;388:100–104. doi: 10.1016/j.carres.2013.12.020. [DOI] [PubMed] [Google Scholar]
- Chihara G. Maeda Y. Hamuro J. Sasaki T. Fukuoka F. Nature. 1969;222:687–688. doi: 10.1038/222687a0. [DOI] [PubMed] [Google Scholar]
- Jiao R. Liu Y. Gao H. Xiao J. So K. F. Am. J. Chin. Med. 2016;44:463–488. doi: 10.1142/S0192415X16500269. [DOI] [PubMed] [Google Scholar]
- Yi W. Lei Y. Li E. Li Y. Yan L. Wang P. Zhou H. Liu J. Hu Y. Wang D. Int. J. Biol. Macromol. 2017;102:68–75. doi: 10.1016/j.ijbiomac.2017.04.006. [DOI] [PubMed] [Google Scholar]
- Pushpamalar J. Veeramachineni A. K. Owh C. Loh X. J. ChemPlusChem. 2016;81:504–514. doi: 10.1002/cplu.201600112. [DOI] [PubMed] [Google Scholar]
- Golovchenko V. V. Khramov D. S. Ovodova R. G. Shashkov A. S. Ovodov Y. S. Food Chem. 2012;134:1813–1822. doi: 10.1016/j.foodchem.2012.03.087. [DOI] [PubMed] [Google Scholar]
- Ma F. W. Kong S. Y. Tan H. S. Wu R. Xia B. Zhou Y. Xu H. X. Carbohydr. Polym. 2016;152:699–709. doi: 10.1016/j.carbpol.2016.07.062. [DOI] [PubMed] [Google Scholar]
- Bitter T. Muir H. M. Anal. Biochem. 1962;4:330–334. doi: 10.1016/0003-2697(62)90095-7. [DOI] [PubMed] [Google Scholar]
- Dubois M. Gilles K. A. Hamilton J. K. Rebers P. A. Smith F. Anal. Chem. 1956;28:350–356. doi: 10.1021/ac60111a017. [DOI] [Google Scholar]
- Luo D. H. Carbohydr. Polym. 2008;71:544–549. doi: 10.1016/j.carbpol.2007.06.023. [DOI] [Google Scholar]
- Yu R. M. Yang W. Song L. Y. Yan C. Y. Zhang Z. Zhao Y. Carbohydr. Polym. 2007;70:430–436. doi: 10.1016/j.carbpol.2007.05.005. [DOI] [Google Scholar]
- Hu X. Q. Huang Y. Y. Dong Q. F. Song L. Y. Yuan F. Yu R. M. J. Agric. Food Chem. 2011;59:11548–11552. doi: 10.1021/jf203179y. [DOI] [PubMed] [Google Scholar]
- Yuan F. Yu R. M. Yin Y. Shen J. R. Dong Q. F. Zhong L. Song L. Y. Int. J. Biol. Macromol. 2010;46:436–439. doi: 10.1016/j.ijbiomac.2010.02.002. [DOI] [PubMed] [Google Scholar]
- Rout D. Mondal S. Chakraborty I. Islam S. S. Carbohydr. Res. 2008;343:982–987. doi: 10.1016/j.carres.2007.12.022. [DOI] [PubMed] [Google Scholar]
- Chen S. H. Chen H. X. Tian J. G. Wang Y. W. Xing L. S. Wang J. Carbohydr. Polym. 2013;98:428–437. doi: 10.1016/j.carbpol.2013.06.011. [DOI] [PubMed] [Google Scholar]
- Wang L. Zhang B. Xiao J. Huang Q. Li C. Fu X. Food Chem. 2018;249:127–135. doi: 10.1016/j.foodchem.2018.01.011. [DOI] [PubMed] [Google Scholar]
- Wang Y. G. Li Y. L. Ma X. Q. Ren H. W. Fan W. G. Leng F. F. Yang M. J. Wang X. L. Ind. Crops Prod. 2018;122:596–608. doi: 10.1016/j.indcrop.2018.06.011. [DOI] [Google Scholar]
- Wang X. M. Sun R. G. Zhang J. Chen Y. Y. Liu N. N. Fitoterapia. 2012;83:1576–1584. doi: 10.1016/j.fitote.2012.09.005. [DOI] [PubMed] [Google Scholar]
- Dou J. Meng Y. H. Liu L. Li J. Ren D. Y. Guo Y. R. Int. J. Biol. Macromol. 2015;72:31–40. doi: 10.1016/j.ijbiomac.2014.07.053. [DOI] [PubMed] [Google Scholar]
- Chi C. F. Hu F. Y. Wang B. Li T. Ding G. F. J. Funct. Foods. 2015;15:301–313. doi: 10.1016/j.jff.2015.03.045. [DOI] [Google Scholar]
- Dai Z. Su D. Zhang Y. Sun Y. Hu B. Ye H. Jabbar S. Zeng X. J. Agric. Food Chem. 2014;62:10727–10735. doi: 10.1021/jf503510h. [DOI] [PubMed] [Google Scholar]
- Bi S. X. Jing Y. S. Zhou Q. Q. Hu X. J. Zhu J. H. Guo Z. Y. Song L. Y. Yu R. M. Food Funct. 2018;9:279–293. doi: 10.1039/C7FO01147D. [DOI] [PubMed] [Google Scholar]
- Han Y. Wu J. Liu T. T. Hu Y. D. Zheng Q. S. Wang B. S. Lin H. Y. Li X. Int. J. Biol. Macromol. 2016;83:42–49. doi: 10.1016/j.ijbiomac.2015.11.049. [DOI] [PubMed] [Google Scholar]
- Xie J. H. Liu X. Shen M. Y. Nie S. P. Zhang H. Li C. Gong D. M. Xie M. Y. Food Chem. 2013;136:1453–1460. doi: 10.1016/j.foodchem.2012.09.078. [DOI] [PubMed] [Google Scholar]
- Mandal E. K. Maity K. Maity S. Gantait S. K. Behera B. Maiti T. K. Sikdar S. R. Islam S. S. Carbohydr. Res. 2012;347:172–177. doi: 10.1016/j.carres.2011.10.040. [DOI] [PubMed] [Google Scholar]
- Jing Y. S. Zhu J. H. Liu T. Bi S. X. Chen Z. Y. Song L. Y. Lv W. J. Yu R. M. J. Agric. Food Chem. 2015;63:3464–3471. doi: 10.1021/jf505915t. [DOI] [PubMed] [Google Scholar]
- Niu Y. G. Wang H. Y. Xie Z. H. Whent M. Gao X. D. Zhang X. Food Chem. 2011;128:620–626. doi: 10.1016/j.foodchem.2011.03.055. [DOI] [Google Scholar]
- Song G. L. Du Q. Z. Food Res. Int. 2012;45:381–387. doi: 10.1016/j.foodres.2011.10.035. [DOI] [Google Scholar]
- Wang C. S. Zhang D. W. Zhang M. L. Jiao Y. K. Jiang K. M. Yan C. Y. Ind. Crops Prod. 2018;108:458–469. doi: 10.1016/j.indcrop.2017.07.018. [DOI] [Google Scholar]
- Alpizar-Reyes E. Carrillo-Navas H. Gallardo-Rivera R. Varela-Guerrero V. Alvarez-Ramirez J. Perez-Alonso C. J. Food Eng. 2017;209:68–75. doi: 10.1016/j.jfoodeng.2017.04.021. [DOI] [Google Scholar]
- Wang W. J. Ma X. B. Jiang P. Hu L. L. Zhi Z. J. Chen J. L. Ding T. Ye X. Q. Liu D. H. Food Hydrocolloids. 2016;61:730–739. doi: 10.1016/j.foodhyd.2016.06.019. [DOI] [Google Scholar]
- Wang L. Zhang B. Xiao J. Huang Q. Li C. Fu X. Food Chem. 2018;249:127–135. doi: 10.1016/j.foodchem.2018.01.011. [DOI] [PubMed] [Google Scholar]
- Zheng Y. F. Zhang S. Wang Q. Lu X. Lin L. M. Tian Y. T. Xiao J. B. Zheng B. D. Carbohydr. Polym. 2016;144:438–446. doi: 10.1016/j.carbpol.2016.02.073. [DOI] [PubMed] [Google Scholar]
- Raza A. Li F. Xu X. Tang J. Int. J. Biol. Macromol. 2017;94:335–344. doi: 10.1016/j.ijbiomac.2016.10.033. [DOI] [PubMed] [Google Scholar]
- Su Z. Dai Z. Yang J. J. Yunnan Agric. Univ. 2006;21:205–209. [Google Scholar]
- Wang W. Y. Shi H. Zhu J. H. Li C. L. Song L. Y. Yu R. M. Int. J. Biol. Macromol. 2018;116:289–298. doi: 10.1016/j.ijbiomac.2018.05.008. [DOI] [PubMed] [Google Scholar]
- Mebius R. E. Kraal G. Nat. Rev. Immunol. 2005;5:606–616. doi: 10.1038/nri1669. [DOI] [PubMed] [Google Scholar]
- Cheng A. W. Wan F. C. Wang J. Q. Jin Z. Y. Xu X. M. Int. Immunopharmacol. 2008;8:43–50. doi: 10.1016/j.intimp.2007.10.006. [DOI] [PubMed] [Google Scholar]


