Abstract
The extraction of uranium(vi) from seawater is of paramount interest to meet the rapid expansion of global energy needs. A novel gelatin/PVA composite nanofiber band loaded with bayberry tannin (GPNB-BT) was used to extract uranium(vi) from simulated seawater in this study. It was fabricated by electrostatic spinning and crosslinking, and characterized by SEM, EDX, FTIR, and XPS. Batch experiments were carried out to investigate the adsorption of uranium(vi) onto GPNB-BT. Simultaneously, the regeneration–reuse process of the GPNB-BT was determined and illustrated here. The GPNB-BT exhibited excellent adsorption and regeneration performance, and a maximum adsorption capacity of 254.8 mg g−1 toward uranium(vi) was obtained at 298.15 K, pH = 5.5. Further, the regeneration rate for uranium did not decrease significantly after five cycles. Moreover, even at an extremely low initial concentration of 3 μg L−1 in the simulated seawater for 24 h, GPNB-BT showed an ultrahigh adsorption rate of more than 90% and adsorption capacity of 7.2 μg g−1 for uranium. The high density of adjacent phenolic hydroxyl groups and the specific surface area of GPNB-BT improved the adsorption ability of GPNB-BT for uranium. Therefore, the GPNB-BT was shown to have an application prospect for the effective extraction of uranium(vi) from seawater.
A novel kelp-like gelatin/PVA composite nanofiber band loaded with bayberry tannin was fabricated for the extraction of uranium(vi) from seawater.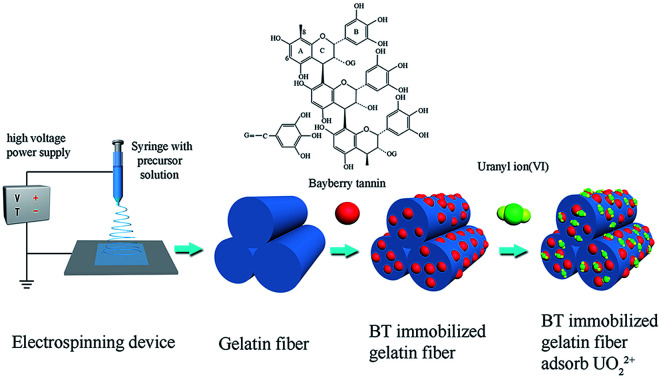
1. Introduction
Uranium(vi), which plays an important role in the development of the nuclear industry, mainly exists in two forms in nature: deposits in terrestrial ores and in seawater.1,2 Uranium resources from terrestrial ores are limited, so it is desired to extract uranium from seawater, in which the quantity of uranium is around 4.5 billion tons.3 To date, lots of technologies have emerged for the extraction of uranium, such as solvent extraction,4 chemical precipitation,5 ion-exchange,6 and adsorption.7,8 Among these methods, adsorption is considered to be an effective and economic way forward to extract uranium from seawater.9 It is reported that various minerals,10 phosphates,11 poly-resins,12 and microorganisms13 have been used as adsorbents for the recovery of uranium(vi) from wastewater. However, the adsorption capacity of adsorbents to uranium still needs to be improved.
It has been reported that plant tannins exhibit specific affinity toward many metal ions.14 Therefore, it may be expected that tannins could be used for the purpose of uranium recovery from aqueous solutions. Bayberry tannin (BT) is a kind of cheap and ubiquitous natural biomass, which has lots of phenolic hydroxyl groups to form a chelate with metal ions. However, tannins cannot be used as an adsorbent directly for the adsorption of uranium because they dissolve easily in solution. To overcome this disadvantage, many techniques have been made to immobilize tannins onto various water-insoluble materials, such as cellulose,15 viscose rayon fiber,16 agarose,17 and other materials containing amino groups, such as albumin, chitosan, and collagen. Collagen has numerous functional groups, such as –NH2, –COOH, and –OH, which can react with uranium.18 However, the small specific surface area and few active sites on collagen limit the amount of tannins immobilized onto collagen and the adsorption capacity for uranium.
The electrostatic spinning and crosslinking of collagen and BT is an effective method to improve the specific surface area and active sites of collagen. A collagen nanofiber membrane with a porous network can been produced by electrospinning, wherein an electric field is used to control the formation and deposition of nanofibers. These are produced with a large surface area and high porosity.19 Gelatin is the main product of collagen hydrolysis, including –NH2, –COOH, and –OH, which can react with tannins well.20 However, the yield of electrospun gelatin fiber is generally low and the mechanical strength of gelatin fiber is poor. Poly vinyl alcohol (PVA) is typically blended with gelatin to increase the mechanical strength and stability of the fibers in the water,21 which can also be an adsorbent with active groups to adsorb uranium(vi). Therefore, it would be promising to produce a novel nanofiber membrane that combines the phenolic hydroxyls of BT and the high specific surface area and porosity of the gelatin/PVA nanofiber band (GPNB).
For all the above reasons, in the present study, such a GPNB-BT was synthesized and assembled from gelatin, PVA, and bayberry tannin by electrospinning, and then crosslinked by glutaraldehyde, which has a strong mechanical strength and hydrophilic property. The effects of pH, dosage, contact time, initial uranium concentrations, temperature, and co-existing anions on the extraction of uranium were studied. The adsorption isotherm and adsorption kinetics were also investigated to understand the adsorption process in detail. Furthermore, the adsorbent before and after adsorption was characterized and the mechanism of the adsorption process of uranium was deduced. It is expected that such a GPNB-BT with a high surface area and porosity and a large amount of tannins immobilized could be widely used for the extraction of uranium from seawater in the future.
2. Materials and methods
2.1. Materials
Gelatin from porcine skin (Type A, Bloom 250) and poly (vinyl alcohol) (PVA, Mw 44.05, 98.0–99.0 mol% alcoholysis degree) were purchased from Aladdin. BT was supplied by Baise Forest Chemical Plant (Guangxi, China) produced from the barks of myrica esculenta by extraction with an acetone–water solution (1 : 1, v/v) and the tannin content was about 77%. Glacial acetic acid and glutaraldehyde used in the experiment were of analytical grade, and were purchased from Kelong Co. Ltd without further purification. Uranium nitrate hexahydrate (UO2(NO3)2·6H2O) was obtained from HuBei Chushengwei Chemistry Co., Ltd. The uranium stock solution was prepared by dissolving (UO2(NO3)2·6H2O) in ultrapure water.
2.2. Synthesis of GPNB-BT
The PVA was dissolved in ultrapure water for 2 h at 90 °C to prepare an 8% (m m−1) of PVA sol. Meanwhile, the gelatin was dissolved in glacial acetic acid and heated at 60 °C for 1 h to prepare an 18% (m m−1) gelation sol. Then, the PVA and gelatin sol were mixed at a solution mass ratio of 6 : 4 for 12 h to obtain a spinning solution, which was loaded in a 10 mL syringe and electrospun at a flow rate of 0.3 mL h−1. The voltage between the needle and the collector was 20 kV. The temperature of electrospinning was 35 °C. The nanofiber membrane was collected, dried in a vacuum oven overnight at 60 °C, and then cut into pieces of 2 × 6 cm. The kelp-like nanofiber band, named as GPNB, was finally obtained.
Meanwhile, 0.3 g of BT was dissolved in 100 mL of ultrapure water completely and mixed with 0.3 g of GPNB at 25 °C for 4 h. After that, the GPNB soaked in tannins was filtered and put into 100 mL of ultrapure water. At the same time, 1.2 mL glutaraldehyde was added into the solution and reacted at 50 °C for 4 h. Subsequently, the product was collected by filtration, thoroughly washed with ultrapure water, and dried in a vacuum oven at 60 °C for 12 h, and finally the GPNB-BT was obtained.
2.3. Batch adsorption experiments
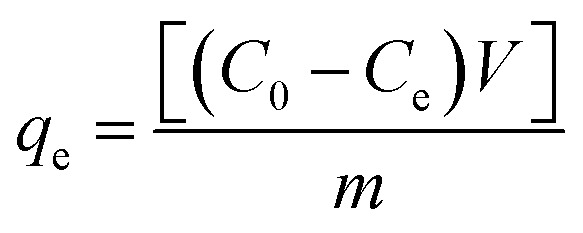
The effects of the solution pH, contact time, initial uranium concentrations, adsorbent dose, and temperature on the removal of uranium(vi) were studied. The adsorption experiments was carried out in a 100 mL conical flask. Typically, 0.02 g of GPNB-BT was added to 50 mL of the uranium(vi) solution with an initial concentration of 80 mg L−1. The pH was adjusted to the desired value with 1 M HCl and 1 M NaOH. All the conical flasks were kept in a thermostated shaker for a specified time, and the experiments were repeated three times. The mixed solutions were filtered after the adsorption of uranium and the concentration of uranium was detected at 650 nm using a U-3900 ultraviolet spectrophotometer (Hitachi U-3900). The equilibrium adsorption capacity (qe) and removal efficiency (Re) of uranium were calculated by the following equations:
 |
1 |
 |
2 |
where qe is the equilibrium adsorption capacity of uranium adsorbed onto a unit gram of GPNB-BT (mg g−1), C0 and Ce are the initial and equilibrium concentrations (mg L−1), m (g) is the weight of the GPNB-BT, and V (L) is the volume of solution. All the experimental data reported herein are the average of duplicate or triplicate determinations and the relative errors were within ± 0.5%.
2.4. Regeneration studies
In order to evaluate the reusability of GPNB-BT, the GPNB-BT after adsorption of uranium was regenerated by treating it with 50 mL of HCl solution at pH = 1 to 6 for 24 h. Then, the regenerated GPNB-BT adsorbed uranium. This regeneration–reuse process was repeated for five cycles.
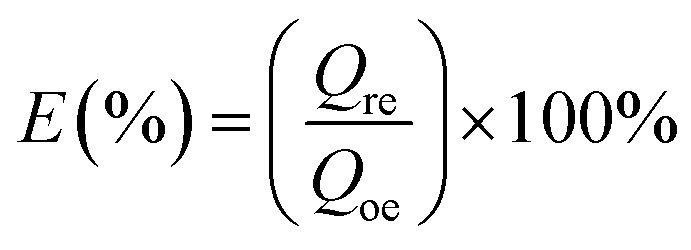
The regeneration rate (E) was calculated by the following equation:
 |
3 |
where Qre is the adsorption capacity after the regeneration of GPNB-BT (mg g−1) and Qoe is the adsorption capacity of GPNB-BT at the first time (mg g−1).
2.5. Characterization of GPNB-BT
The surface morphology of the GPNB-BT was characterized by scanning electron microscopy (SEM, Ultra 55, Zesis Corporation). Then energy dispersive spectrometry (EDX) was employed to understand the elemental composition before and after adsorption. Fourier transform infrared spectrometry (FTIR, Nicolet-6700, Perkin Elmer Instruments Corporation) was used to analyze the molecular structure. X-ray photoelectron spectroscopy (XPS, Thermo Scientific Escalab 250, Thermo Fisher Corporation) was used to detect the binding energies of the GPNB-BT before and after adsorption. The water contact angle was also measured on a dedicated instrument (K100, Germany Klux Corporation).
3. Results and discussion
3.1. Adsorption behavior of the GPNB-BT toward uranium(vi)
3.1.1. Effect of pH on adsorption
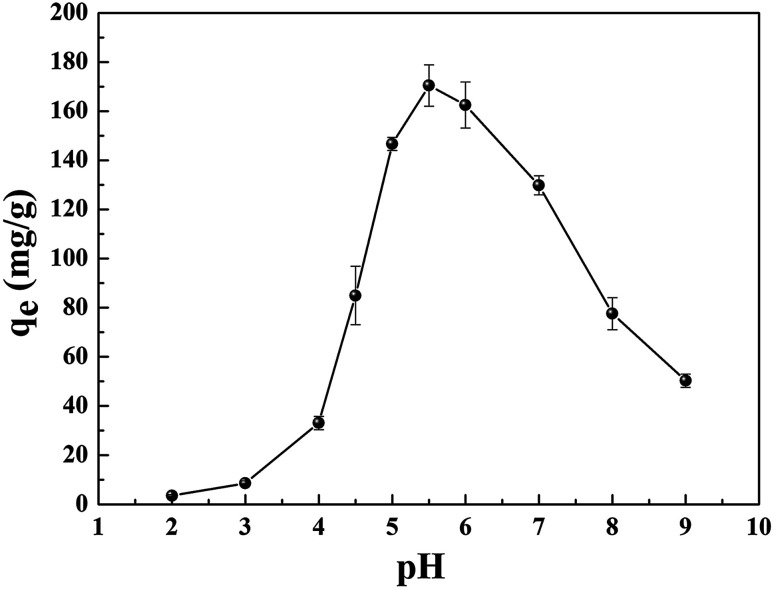
The effect of pH on uranium adsorption by GPNB-BT was studied in the pH range 2–9, and the results are shown in Fig. 1. Obviously, the adsorption capacity of GPNB-BT toward uranium sharply increased with the increase of pH from 2.0 to 5.5 and decreased with the pH further increasing from 5.5 to 9.0. The maximum adsorption capacity of GPNB-BT (171.4 mg g−1) was finally obtained at pH 5.5.
Fig. 1. Effect of solution pH on the adsorption of uranium onto GPNB-BT (initial uranium concentration: 80 mg L−1, adsorbent dose: 0.02 g, volume of solution: 50 mL, temperature: 298.15 K, contact time: 24 h).
The reasons for this phenomenon was as follows: the concentration of H+ in the solution is high at low pH, which leads more H+ to occupy the active site on the adsorbent. At the same time, the uranyl ion is prevented from approaching the active site of the adsorbent by the electrostatic repulsion of H+.22 The lower the pH, the greater the resistance between H+ from the solution and the uranyl ions. At pH < 5.0, the important polynuclear hydroxo–uranyl complex cations exist as (UO2)2(OH)22+, (UO2)4(OH)7+, (UO2)4(OH)62+, (UO2)4(OH)26+, and uranium mainly takes on the forms of (UO2)3(OH)5+ in the pH region 5.0–6.0.23 Therefore, the adsorption capacity is enhanced due to the degree of protonation being reduced. When the pH exceeds 6.0, the uranyl ion is easily hydrolyzed and it is difficult to bind uranium on GPNB-BT because of the U(vi)-carbonate species (UO2)2(CO3)(OH)3− from pH 6.0 to 9.0.24,25 This indicates that the adsorbent has the maximum capacity at pH 5.5, which was the pH thus used in rest of the further studies.
3.1.2. Effect of adsorbent dose on adsorption
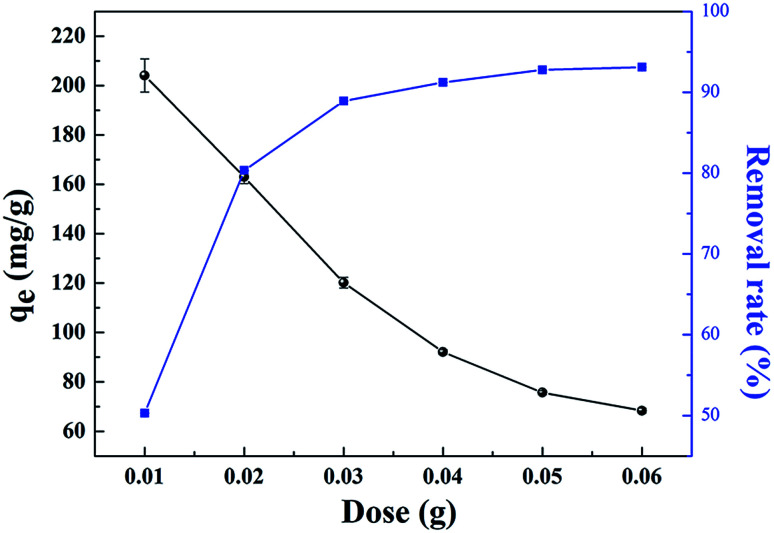
The adsorbent dose is another important parameter that affects the adsorption process. The effect of the adsorbent dose on the adsorption of uranium by GPNB-BT was studied by increasing the dosage of the adsorbent from 0.01 to 0.06 g, and the result is presented in Fig. 2. It was indicated that the removal rate of uranium increased with the increase in adsorbent dose, which might be due to the increased number of active sites on the GPNB-BT. At the same time, the adsorption capacity of GPNB-BT decreased with the increase in the adsorbent dose from 0.01 to 0.06, perhaps due to the reason that the adsorption sites of the surface could not be saturated when the total uranium quantity in solution was fixed.26
Fig. 2. Effect of adsorbent dose on the uranium removal by GPNB-BT (initial uranium concentration: 80 mg L−1, pH: 5.5, volume of solution: 50 mL, contact time: 24 h, temperature: 298.15 K).
3.1.3. Effect of contact time on uranium adsorption and adsorption kinetics
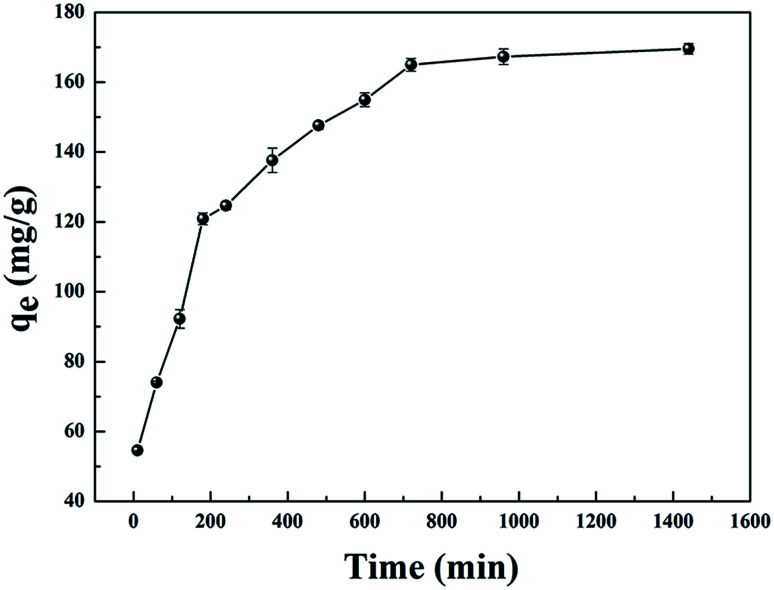
The effect of the contact time on the uranium removal by GPNB-BT at different times is displayed in Fig. 3, where the contact time was varied from 1 to 1400 min. Clearly, the adsorption capacity rapidly increased in the first 600 min, which was attributed to there being a large number of active binding sites for uranyl ion available on the GPNB-BT, leading to a high rate of adsorption. Subsequently, the rate of adsorption gradually slowed down as the equilibrium of adsorption was approached, because, along with the occupation of the active binding sites, the adsorption rate became slow until equilibrium was achieved. Thus, 720 min (12 h) was selected as the optimum contact time throughout this study.
Fig. 3. Effect of contact time on the adsorption capacity of GPNB (initial uranium concentration: 80 mg L−1, adsorbent dose: 0.02 g, pH: 5.5, volume of solution: 50 mL, temperature: 298.15 K).
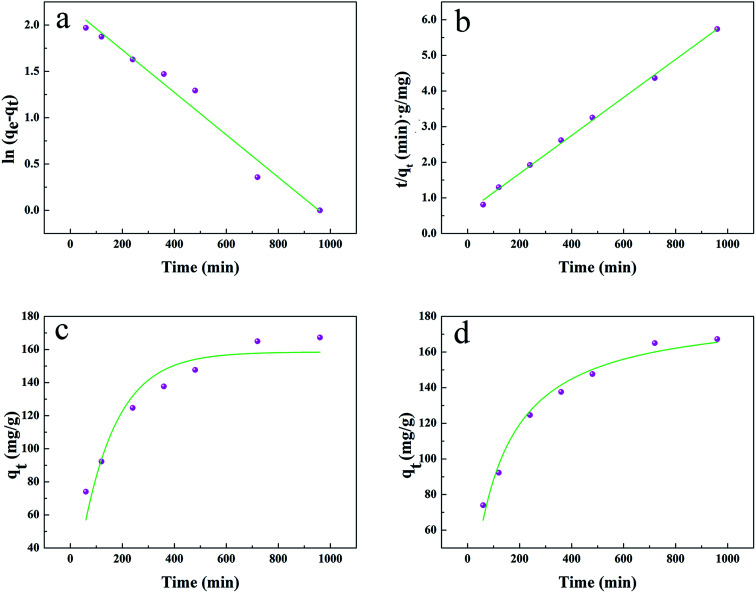
In order to explain the behavior of uranium adsorption by GPNB-BT, the pseudo-first-order kinetic and pseudo-second-order kinetic models were used to investigate the adsorption mechanism.
The pseudo-first-order kinetics of linear and non-linear equations are represented as follows:27
| ln(qe − qt) = ln qe − K1t (linear) | 4 |
| qt = qe(1 − e−K1t) (non-linear) | 5 |
The pseudo-second-order kinetics of linear and non-linear equations are represented as follows:27
 |
6 |
 |
7 |
where qe (mg g−1) and qt (mg g−1) are the adsorption capacities of uranium on GPNB-BT at any time t and equilibrium, respectively, and K1 (min−1) and K2 [g (mg min)−1] are the adsorption rate parameters of the pseudo-first-order and pseudo-second-order kinetics, respectively.
The results are shown in Fig. 4 and Table 1. Compared with other kinetic models, the value of R2 (0.997) for the linear pseudo-second-order fitted best. In addition, the calculated equilibrium adsorption capacity (187.6 mg g−1) from the linear pseudo-second-order was close to the actual experiment adsorption capacity (170.1 mg g−1) shown in Fig. 3. These results indicated that the adsorption of uranium obeys the linear pseudo-second-order model, which suggested that the rate-controlling step of the adsorption process may be the chemical adsorption.28
Fig. 4. (a) and (b) Linear plots of the pseudo-first-order kinetics and pseudo-second-order kinetics, (c) and (d) non-linear plots of the pseudo-first-order kinetics and pseudo-second-order kinetics.
The parameters of the pseudo-first-order and pseudo-second-order kinetics.
| Type | Pseudo-first-order kinetic | Pseudo-second-order kinetic | ||||
|---|---|---|---|---|---|---|
| q e (mg g−1) | K 1 (min−1) | R 2 | q e (mg g−1) | K 2 (g (mg min)−1) | R 2 | |
| Linear model | 8.935 | 0.002 | 0.967 | 187.617 | 2.841 × 10⁻⁵ | 0.997 |
| Non-linear model | 158.487 | 0.007 | 0.903 | 184.131 | 5.009 × 10⁻⁵ | 0.977 |
3.1.4. Effect of initial uranium concentration on uranium adsorption and isotherm studies
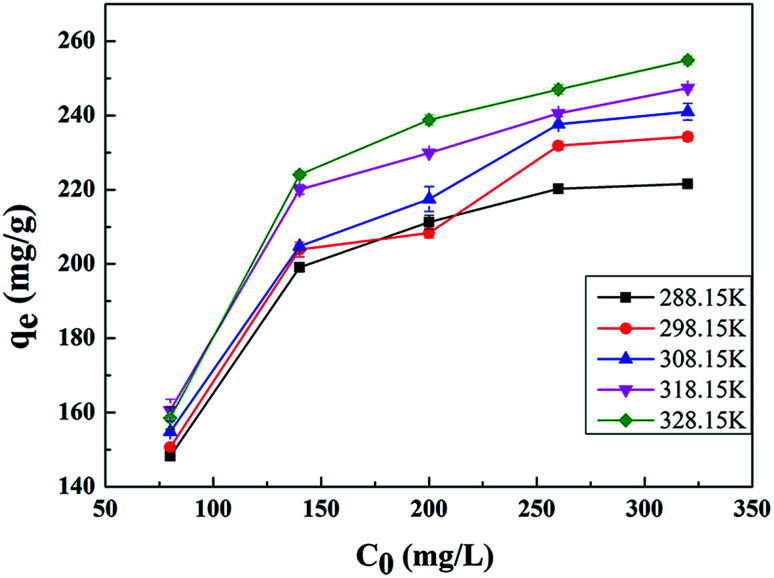
The effect of the initial concentration on the adsorption of uranium was investigated at concentrations ranging from to 80 to 320 mg L−1 and at different temperatures. The results in Fig. 5 indicated that the adsorption capacity increased with the increase in uranium concentration, and then the adsorption capacity slowly increased and finally reached a plateau of 254.8 mg g−1 at an initial concentration of 320 mg L−1 at 328.15 K. This can be attributed to there being lots of coordination sites for uranium available at lower concentration; however, the number of binding sites offered by the GPNB-BT are finite, and these are gradually occupied at higher uranium concentrations, until finally saturation adsorption is obtained.29
Fig. 5. Effect of initial uranium concentration on the adsorption capacity of GPNB-BT for uranium (initial uranium concentration: 80–320 mg L−1, adsorbent dose: 0.02 g, pH: 5.5, volume of solution: 50 mL, temperature: 288.15–328.15 K, contact time: 12 h).
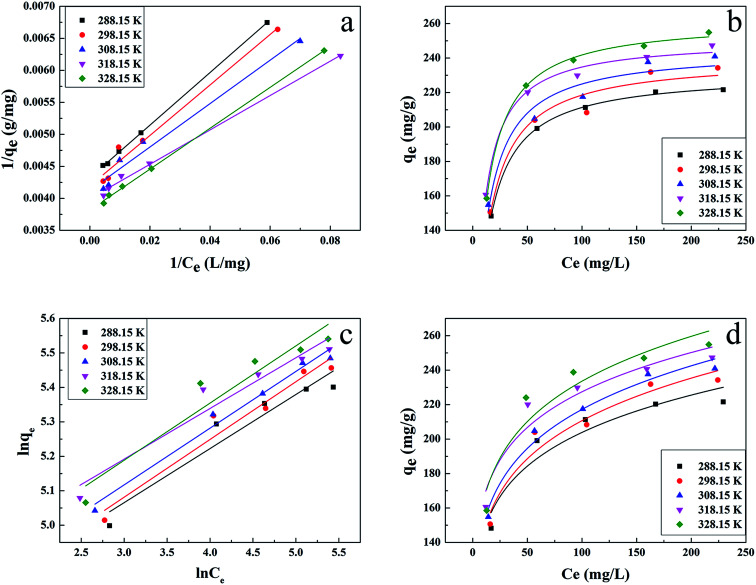
In order to get a better understanding of the uranium adsorption mechanism and to quantify the adsorption data, Langmuir and Freundlich models were used to fit the experimental data.
The Langmuir isotherm is based on the assumption that monolayer adsorption occurs on a uniform surface and the adsorbed layer will be one molecule thick. Furthermore, it is assumed that all the adsorption sites have equal affinities for molecules of the adsorbate.30
Linear and non-linear Langmuir equations are expressed by the following:
 |
8 |
 |
9 |
The Freundlich model considers multilayer adsorption with a heterogeneous energetic distribution of active sites.31
Linear and non-linear Freundlich equations are expressed by the following:
 |
10 |
| qe = KFCe1/n (non-linear) | 11 |
where qm (mg g−1) is the maximum monolayer adsorption capacity, Ce (mg L−1) is the equilibrium concentration of uranium, KL and KF are the Langmuir and Freundlich constant, respectively, and 1/n is the Freundlich constant related to the adsorption capacity and intensity.
The results are presented in Fig. 6 and Table 2, with the Langmuir and Freundlich isotherm parameters calculated from the intercept and slope of the plots. Clearly, it could be seen that the linear Langmuir model fitted the experimental data well according to the high correlation coefficients (R2), which confirmed that the Langmuir model could properly describe the sorption data. Furthermore, these results suggested a monolayer adsorption happened on the homogeneous surface of the GPNB-BT adsorbent.
Fig. 6. Adsorption isotherms of uranium by GPNB-BT, (a) and (b) linear and non-linear Langmuir adsorption isotherm models; (c) and (d) linear and non-linear Freundlich adsorption isotherm models (initial uranium concentration: 80–320 mg L−1, adsorbent dose: 0.02 g, pH: 5.5, volume of solution: 50 mL, temperature: 288.15–328.15 K, contact time: 12 h).
Parameters of the Langmuir and Freundlich models of uranium adsorption by GPNB-BT at different temperatures.
| Type | T (K) | Langmuir constant | Freundlich constant | ||||
|---|---|---|---|---|---|---|---|
| K L (L mg−1) | q m (mg g−1) | R 2 | n | K F(mg g−1), (L mg−1)1/n | R 2 | ||
| Linear model | 288.15 | 0.105 | 231.482 | 0.999 | 6.375 | 98.998 | 0.901 |
| 298.15 | 0.106 | 238.663 | 0.972 | 5.970 | 97.417 | 0.937 | |
| 308.15 | 0.121 | 242.719 | 0.971 | 6.077 | 101.849 | 0.975 | |
| 318.15 | 0.149 | 250.001 | 0.995 | 6.798 | 115.639 | 0.920 | |
| 328.15 | 0.120 | 261.780 | 0.999 | 6.025 | 108.923 | 0.899 | |
| Non-linear model | 288.15 | 0.105 | 231.461 | 0.999 | 6.864 | 104.233 | 0.889 |
| 298.15 | 0.102 | 240.019 | 0.949 | 6.252 | 100.862 | 0.931 | |
| 308.15 | 0.113 | 244.908 | 0.950 | 6.292 | 104.492 | 0.971 | |
| 318.15 | 0.146 | 250.853 | 0.990 | 7.260 | 120.614 | 0.913 | |
| 328.15 | 0.119 | 262.108 | 0.997 | 6.558 | 115.738 | 0.888 | |
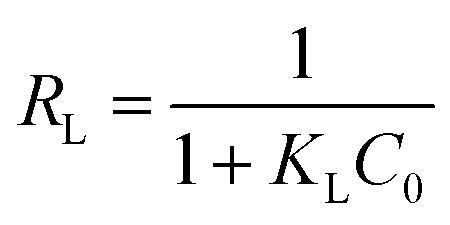
The essential characteristics of the Langmuir isotherm can be explained in terms of a dimensionless equilibrium parameter (RL), which can be expressed by the following equation:
 |
12 |
The values of RL indicate the shape of the isotherm: unfavorable adsorption (RL > 1), linear adsorption (RL = 1), favorable adsorption (0 < RL < 1), or irreversible adsorption (RL = 0). The obtained RL values as shown in Table 3 are 0–1, which indicates that the adsorption of uranium from aqueous solutions by GPNB-BT is favorable.
Equilibrium parameters, RL.
| Temperature (K) | Uranium concentration (mg L−1) | ||||
|---|---|---|---|---|---|
| 80 | 140 | 200 | 260 | 320 | |
| 288.15 | 0.106 | 0.064 | 0.045 | 0.035 | 0.029 |
| 298.15 | 0.105 | 0.063 | 0.045 | 0.035 | 0.029 |
| 308.15 | 0.093 | 0.056 | 0.040 | 0.031 | 0.025 |
| 318.15 | 0.077 | 0.046 | 0.032 | 0.025 | 0.021 |
| 328.15 | 0.095 | 0.056 | 0.040 | 0.031 | 0.025 |
3.1.5. Effect of temperature on uranium adsorption and thermodynamic studies
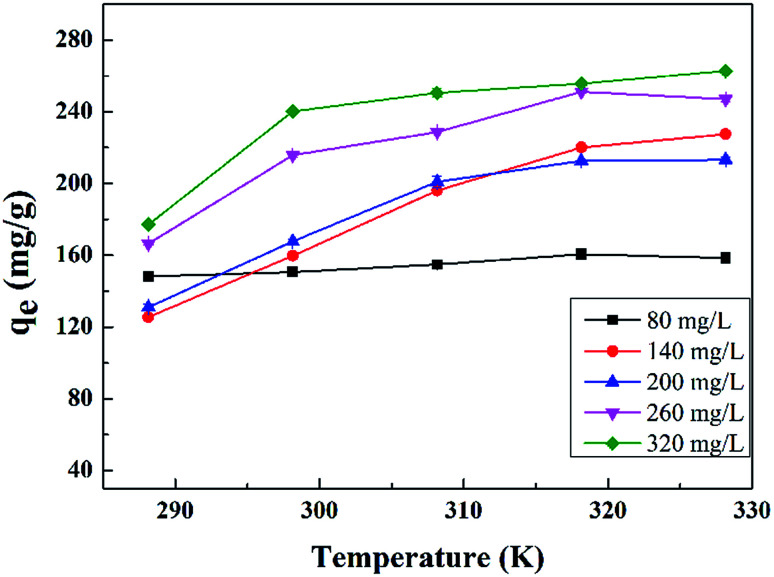
The adsorption of uranium on the GPNB-BT at different temperatures and initial uranium concentrations are presented in Fig. 7. The impact of temperature on the adsorption capacity increased slightly with the temperature increasing from 288.15 K to 328.15 K, which suggested that the adsorption process was endothermic. Considering the factors of energy consumption and adsorption capacity, the temperature of 298.15 K was chosen as the optimum temperature for the adsorption of uranium by the GPNB-BT.
Fig. 7. Effect of temperature on the adsorption capacity of GPNB-BT for uranium (temperature: 288.15–328.15 K, adsorbent dose: 0.02 g, pH: 5.5, volume of solution: 50 mL, initial uranium concentration: 80–320 mg L−1, contact time: 12 h).
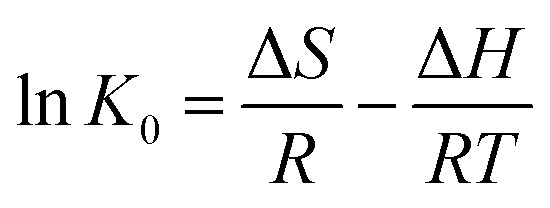
In order to further evaluate the effect of temperature on the adsorption, the thermodynamic parameters for uranium adsorption were calculated by the following equations.32
 |
13 |
| ΔG = ΔH − TΔS | 14 |
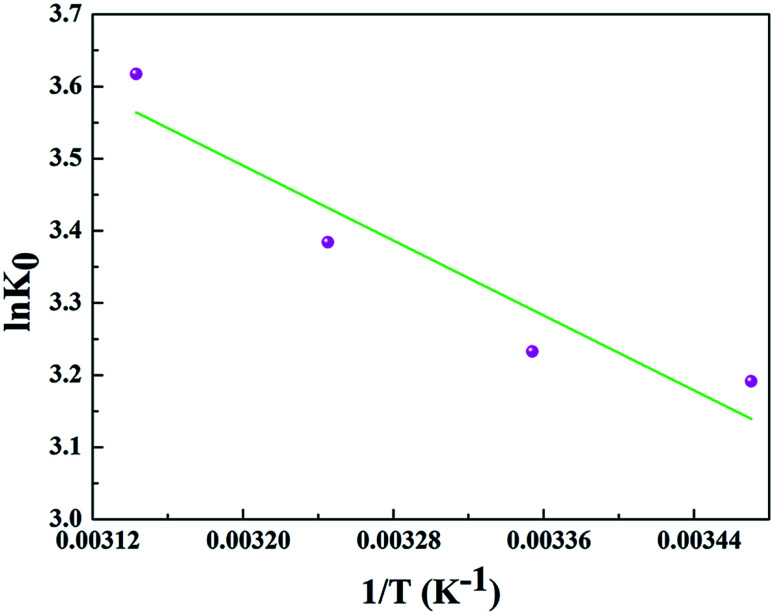
where ΔH, ΔS, and ΔG, respectively, represent the enthalpy change (kJ mol−1), entropy change [J (mol K) −1], and Gibbs free energy change (kJ mol−1) in a given process; and K0 and R stand for the distribution coefficient and ideal gas constant [8.314 J (mol K)−1], respectively. The values of enthalpy (ΔH) and entropy (ΔS) were calculated from the slope and intercept of a plot of 1n K0versus 1/T and the results are represented in Table 4 and Fig. 8.
Thermodynamic parameters for the uranium adsorption on GPNB-BT.
| T (K) | ΔH (kJ mol−1) | ΔS [J (mol K)−1] | ΔG (kJ mol−1) |
|---|---|---|---|
| 288.15 | 10.790 | 63.546 | −7.646 |
| 298.15 | 10.790 | 63.546 | −8.013 |
| 308.15 | 10.790 | 63.546 | −8.670 |
| 318.15 | 10.790 | 63.546 | −9.569 |
Fig. 8. Relationship between 1/T and ln K0 for the adsorption of uranium on GPNB-BT.
The positive value of ΔH (10.790 kJ mol−1) and negative values of ΔG suggested that the adsorption process of uranium on GPNB-BT was endothermic and spontaneous. Furthermore, the positive value of ΔS [63.546 J (mol K)−1] implied the increased randomness at the solid/solution interface during the adsorption of uranium by GPNB-BT. The endothermic adsorption nature might due to the desolvation of the uranyl ions and activation of the surface of GPNB-BT.33
3.1.6. Effect of co-existing cations
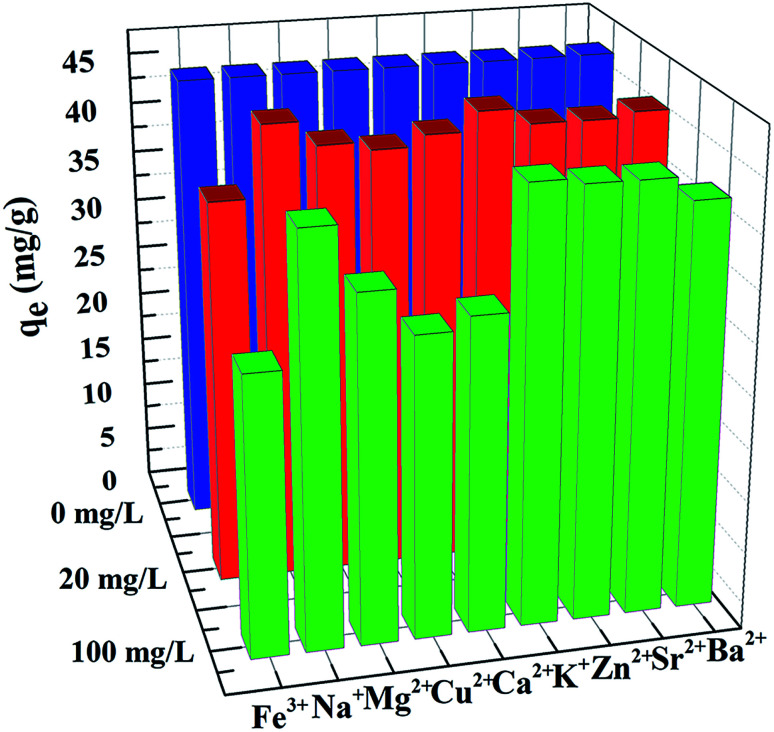
Because of the existence of various metal ions in natural seawater,34,35 the influence of co-existing cations in solution, such as Fe3+, Na+, Mg2+, Cu2+, Ca2+, K+, Zn2+, Sr2+, and Ba2+ on uranium adsorption was also investigated. The results are shown in Fig. 9, where it can be seen that the uranium adsorption was almost unchanged when Na+, K+, Zn2+, Sr2+, and Ba2+ co-existed in solution. However, when Fe3+, Mg2+, Cu2+, and Ca2+ co-existed in solution in the concentration range of 20–100 mg L−1, they caused a decrease in the removal of uranium. It is well known that the binding of Mg2+ and Ca2+ with the active sites limits the sorption of other metals, since particularly both these divalent cations are present in the solution. Fe3+ and Cu2+ were considered as the most potent inhibitors as they compete strongly for adsorption sites with uranium ions, resulting in a substantial reduction of uranium removal.36,37
Fig. 9. Effect of co-existing cations on the uranium adsorption (initial uranium concentration: 20 mg L−1, adsorbent dose: 0.02 g, pH: 5.5, volume of solution: 50 mL, temperature: 298.15 K, contact time: 12 h).
3.1.7. Reusability of the adsorbent
It is necessary to investigate the reusability of GPNB-BT for practical applications. Adsorption experiments were thus performed, specifically at pH: 5.5, adsorbent dose: 0.02 g, volume of solution: 50 mL, temperature: 298.15 K, contact time: 12 h, initial uranium concentration: 80 mg L−1. Different eluents were used to regenerate GPNB-BT after the adsorption of uranium and HCl was found to have the highest removal rate, as shown in Fig. 10a. Therefore, HCl was chosen as the eluent for the further studies. It can be seen in Fig. 10b that the removal rate was highest at pH = 1 and 2, but considering the regeneration efficiency and the stability of GPNB-BT, pH = 2 was selected as the optimum pH for the regeneration. After uranium adsorption, the GPNB-BT was regenerated with 50 mL of HCl solution at pH = 2 for 24 h. Then, the regenerated GPNB-BT was reused to adsorb uranium. This regeneration–reuse process was repeated for five cycles. The results of the regeneration–reuse process of the GPNB-BT are illustrated in Fig. 10c. Clearly, the regeneration rate for uranium did not decrease significantly after five cycles. Overall, the GPNB-BT demonstrated a good reusability of the adsorbent for uranium removal.
Fig. 10. (a) Effect of different eluents to regenerate GPNB-BT after the adsorption of uranium; (b) effect of pH to regenerate GPNB-BT after the adsorption of uranium; (c) recycling of GPNB-BT in the removal of uranium.
3.1.8. Adsorption of uranium in simulated seawater
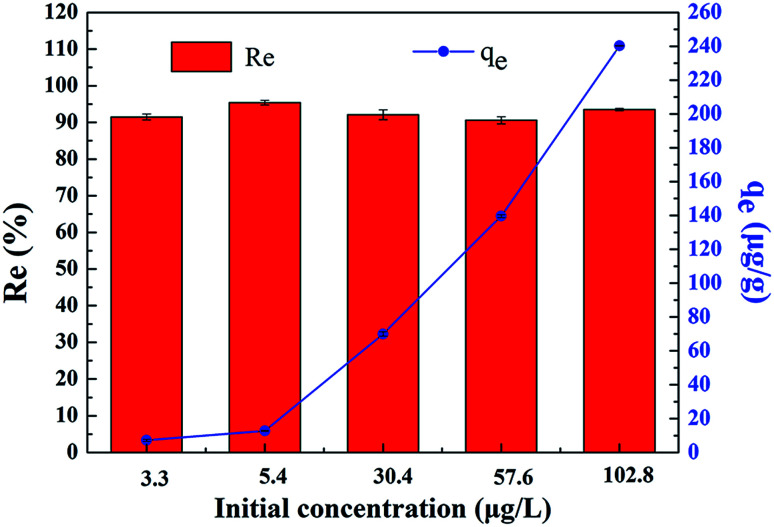
With superior adsorption/desorption properties and adsorption capacity of uranium at high concentration, in order to investigate further whether GPNB-BT is suitable for the extraction of uranium from seawater, the adsorption test of GPNB-BT for uranium at trace concentration was conducted. The simulated seawater was prepared according to a previous study,38 and it was found that uranium was still effectively adsorbed onto GPNB-BT not only at an initial concentration of 102.8 μg L−1 but also at an extremely low concentration of 3.3 μg L−1. In Fig. 11, it can be seen that the removal efficiency was above 90% from an initial concentration in the range 3.3 to 102.8 μg L−1. The adsorption capacity of GPNB-BT for uranium was 7.2 μg g−1 even at an extremely low initial concentration of 3.3 μg L−1 in the simulated seawater, which is the same as the uranium content in seawater for 24 h.39 It is clear that GPNB-BT showed excellent performance for uranium extraction from simulated seawater. Based on the merits of the nanofiber structure and the excellent adsorption property of the GPNB-BT, it is reasonable for us to predict that GPNB-BT can be widely applied in uranium uptake from real seawater.
Fig. 11. Adsorption of low concentration uranium by GPNB-BT in simulated seawater (adsorbent dose: 0.02 g, volume of solution: 50 mL, temperature: 298.15 K, contact time: 12 h).
3.2. Characteristics of GPNB-BT
3.2.1. Surface morphology and hydrophilic property
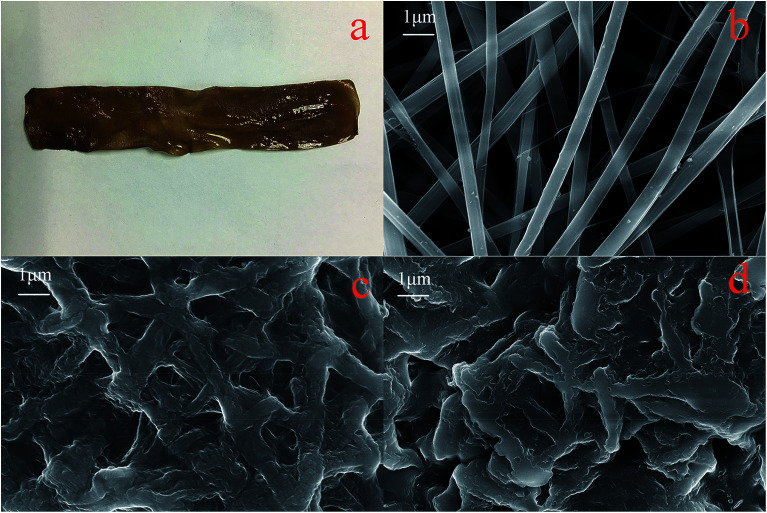
A digital photo of GPNB-BT is shown in Fig. 12a and the SEM images of the surface morphology of the GPNB, GPNB-BT before and after adsorption are demonstrated in Fig. 12b–d (7.0 k). It is shown that the GPNB-BT looks like a kelp in appearance, with a very small density and excellent floating performance, which can help avoid agglomeration and precipitation in aqueous solution. The average diameter of the fiber of the GPNB was 480 nm, while that of the GPNB-BT before and after adsorption was 1–2 μm. Clearly, the average diameter of fibers of GPNB-BT increased after crosslinking with BT and with the adsorption of uranium(vi). In addition, the calculated specific surface areas of GPNB and GPNB-BT were 123.84 m2 g−1 and 19.12 m2 g−1, respectively. The reason for the change in the fiber diameter is mainly that the tannin molecules were immobilized on the fibers, and the fibers absorb water and swell, resulting in an increase in the fiber diameter and a decrease in the pore size in the network structure of the fiber band. Compared with Fig. 12c and d presents a greater roughness and more protrusions, which may result from the adsorption of uranium(vi) onto the GPNB-BT. However, the change in shape of GPNB-BT was not obvious before and after adsorption, which means that the adsorbent was relatively stable in the adsorption process.40
Fig. 12. Digital photo of GPNB-BT (a), SEM images of GPNB (b), GPNB-BT before and after the adsorption of uranium (c) and (d).
Contact angle tests were carried out to investigate the hydrophilicity of GPNB-BT. The contact angle of GPNB-BT was 19 ± 1.71° compared to pure PVA (62 ± 1.19°), which revealed the existence of plenty of hydrophilic functional groups in GPNB-BT.41 Therefore, the GPNB-BT exhibits excellent hydrophilic property and has good advantages in the adsorption process.
3.2.2. FTIR analysis
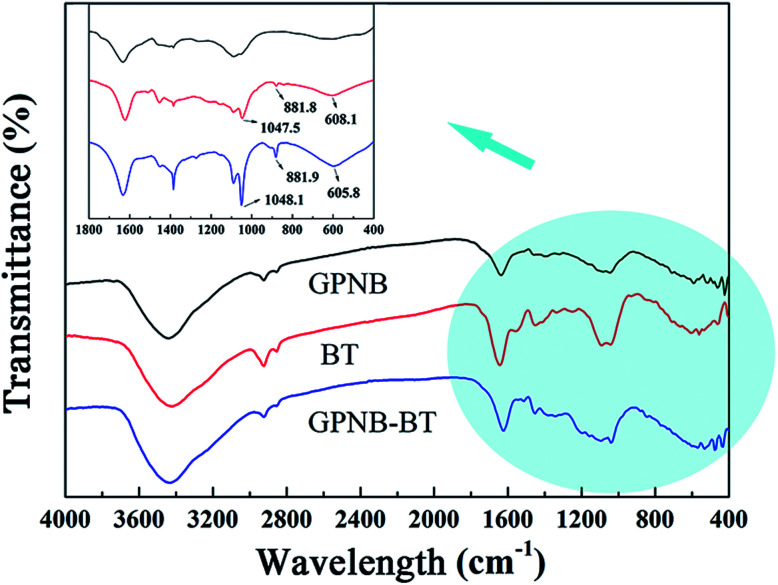
The FTIR spectra of GPNB, BT, and GPNB-BT at 400–4000 cm−1 are shown in Fig. 13. In order to display clearly the characteristic absorption peaks of the FTIR spectra, the FTIR spectra at 400–1800 cm−1 were amplified. The peaks of GPNB-BT at 3445, 2918, 1354, and 1042 cm−1 were assigned to the stretching vibration of N–H and/or O–H, CH2, C–N, and C–O, respectively.42 The peaks at 1047.5 cm−1 of the FTIR spectra were assigned to C–O–C stretching in methoxyl groups of BT,43 which can be found at 1048.1 cm−1 in the FTIR spectra of GPNB-BT. Meanwhile, the characteristic absorption bands appearing at 608.1 cm−1 belonged to the out-of-plane bending vibration of C–H on the aromatic rings of BT, which can also be seen at 605.8 cm−1 in the FTIR spectra of GTNB-BT.44 The peaks at 881.8 cm−1 of BT and 881.9 m−1 of GPNB-BT were identified to another characteristic absorption peak of BT.45 Therefore, the result reveals that the BT had been successfully loaded onto GPNB.
Fig. 13. FTIR spectra of GPNB, BT, and GPNB-BT.
3.2.3. XPS analysis
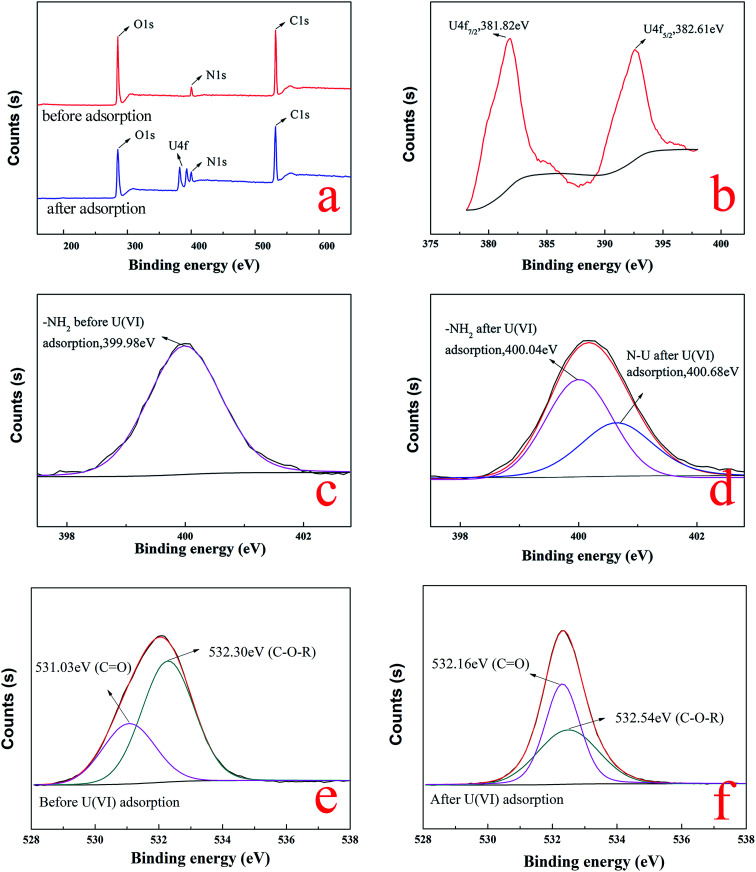
The chemical composition and corresponding chemical state of the GPNB-BT before and after the adsorption of uranium were investigated by XPS, and the typical XPS spectra are shown in Fig. 14. Clearly, the main elements of C, N, and O on GPNB-BT were detected in the wide-scan XPS spectra before uranium adsorption, but, as expected, a new peak of uranium was found on GPNB-BT after the adsorption of uranium. Furthermore, the binding energies for U 4f5/2 of the GPNB-BT were around 382.61 eV, while those for U 4f7/2 were around 381.82 eV, which suggests that the uranium adsorption on the GPNB-BT was only in the form of hexavalent uranium(vi).46 Moreover, the N 1s spectrum before adsorption was found around 399.98 eV, which can be in good agreement with the –NH2 of gelatin; whereas the peak of –NH2 was transferred to a higher binding energy around 400.68 eV after the adsorption of uranium, which indicated that –NH2 species might be involved in the binding of uranium(vi) ions.47 Moreover, it can be found in Fig. 14e that the XPS O 1s spectrum of GPNB-BT can be divided into two overlapping peaks at 531.03 eV and 532.30 eV, assigned to the C O of carboxyl and C–O–R of methoxyl groups on BT,48,49 respectively. After the adsorption of uranium, the two peaks of C O and C–O–R were significantly shifted to 532.16 eV and 532.54 eV, as shown in Fig. 14f, which illustrated that the carboxyl of gelatin and methoxyl groups of BT were also involved in the adsorption process. The results of the XPS analysis confirmed that not only the BT but also gelatin was involved in uranium adsorption.
Fig. 14. XPS spectrum of (a) GPNB-BT before and after adsorption; (b) the U4f of GPNB-BT after adsorption; (c) high-resolution XPS spectra of N for GPNB-BT before adsorption; (d) high-resolution XPS spectra of N for GPNB-BT after adsorption; (e) high-resolution XPS spectra of O for GPNB-BT before adsorption; (f) high-resolution XPS spectra of O for GPNB-BT after adsorption.
3.2.4. EDX measurement
Energy dispersive X-ray measurements (EDX) of GPNB-BT particles before and after the adsorption of uranium are shown in Fig. 15 and Table 5. It was found that the element peaks of C, N, and O appeared in the EDX spectra of GPNB-BT before the adsorption of uranium, while a new peak of U appeared in the spectra of GPNB-BT in Fig. 15, for which the weight of U was about 2.08% as shown in the elements content of EDX in Table 5 after adsorption, which confirmed that U existed on the GPNB-BT after the adsorption of uranium.
Fig. 15. EDX images of (a) GPNB-BT before the adsorption of uranium, (b) GPNB-BT after the adsorption of uranium.
Elemental content of EDX of GPNB-BT after adsorption.
| Element | Weight% | Atomic% |
|---|---|---|
| C | 34.34 | 39.82 |
| N | 37.94 | 37.74 |
| O | 25.63 | 22.32 |
| U | 2.08 | 0.12 |
3.3. Mechanism analysis
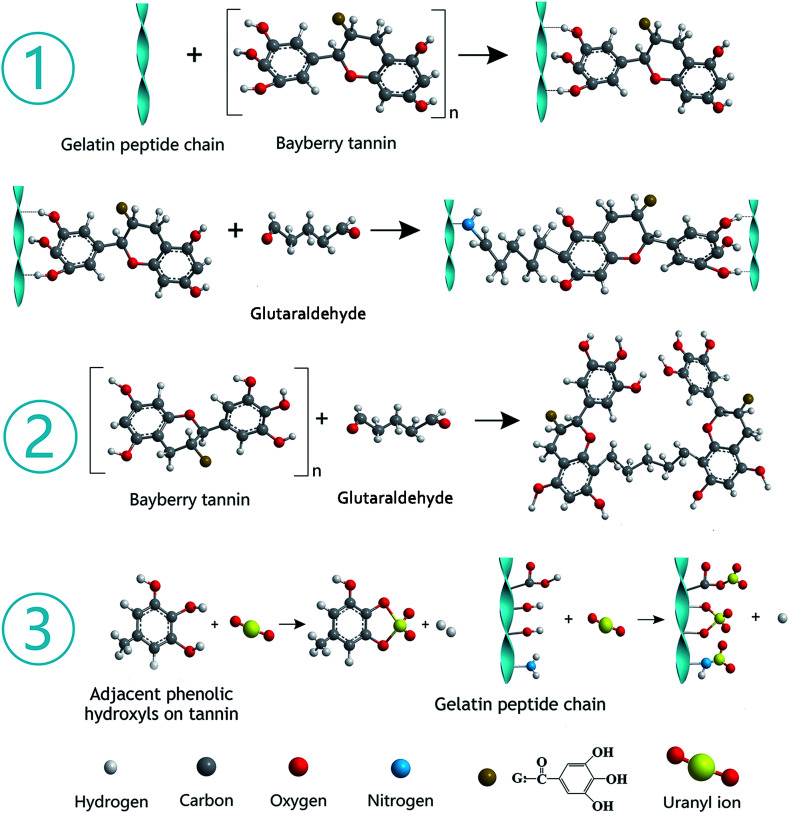
The gelatin was hydrolyzed from collagen, which contains abundant functional groups, such as –OH, –COOH, and –NH2. BT represents polyphenols derived from the barks of bayberry plants and belong to condensed tannins with highly nucleophilic sites (C-6 and C-8 of A ring) in molecules. The synthesis mechanism diagram of GPNB-BT is shown in Fig. 16 ① and ②. The phenolic hydroxyl groups of BT are combined with the peptide chain of gelatin by hydrogen bonding. The phenolic hydroxyl groups of BT and –NH2 on the peptide chain are combined by a covalent bond through a Mannich reaction, when the bifunctional crosslinking agent of glutaraldehyde is added (Fig. 16 ①).50 Furthermore, the tannin molecules can also be crosslinked and agglomerated themselves by glutaraldehyde to become larger, and implanted in the pores of GPNB such that they can hardly be removed from the GPNB fibers (Fig. 16 ②). Meanwhile, it was also proved by experiment that GPNB-BT could really withstand water extraction and no leaked BT was detected in all the adsorption experiments.
Fig. 16. Reaction mechanism diagram of GPNB-BT synthesis and uranium removal.
The reaction mechanism diagram of uranium removal by GPNB-BT is shown in Fig. 16 ③. The uranium can react with –OH, –COOH, and –NH2 of gelatin fiber and the phenolic hydroxyl groups of GPNB-BT. However, compared with functional groups of GPNB, such as –OH, –COOH, and –NH2, the phenolic hydroxyl groups of BT loaded on GPNB will have a higher complexing ability with uranium, due to the fact that a stable five-membered ring can be formed between adjacent phenolic hydroxyl and uranium. Furthermore the porosity and high specific surface area of GPNB-BT, which show good mass-transfer performance, can greatly improve the adsorption ability of the GPNB-BT for uranium, compared with other tannin-immobilized fiber adsorbents.
3.4. Comparison of various adsorbents
There are several advantages and properties of the GPNB-BT, including: (1) GPNB-BT possesses excellent hydrophilic and floating performance to promote the adsorption of uranium; (2) GPNB-BT has superfine nano-fibers and abundant pores, more tannins immobilized, and more active sites to bind uranium than other materials; (3) GPNB-BT is like a kelp in shape and shows an excellent regeneration–reuse performance, which is good for recycling in seawater; (4) the nanometer fiber band avoids the problem that the nanofibers materials tend to agglomerate in aqueous solution. A comparison of the adsorption capacities of different adsorbents for uranium is shown in Table 6. All of these factors suggest that GPNB-BT will have good potential application in the removal of uranium from seawater.
Comparison of the adsorption capacity of various adsorbents for uranium.
4. Conclusions
In this study, GPNB-BT was synthesized by electrostatic spinning and crosslinking and employed to remove uranium from simulated seawater. The performance of GPNB-BT in the removal of uranium(vi) was evaluated. Batch experiments of the GPNB-BT adsorbent revealed that the pH of the solution has a great impact on the adsorption of uranium(vi). The maximum adsorption capacity (254.8 mg g−1) was obtained at a solution pH value of 5.5, adsorbent dosage of 0.02 g, contact time of 12 h, and temperature of 298.15 K. In addition, the adsorption kinetics and isotherms were well fitted by the pseudo-second-order kinetics model and Langmuir isotherm model, respectively. The adsorption process was spontaneous, endothermic, and increased randomness. Furthermore, the GPNB-BT performed with good reusability, stability, and ultrahigh removal efficiency (above 90%) of trace uranium in the simulated seawater. The maximum adsorption capacity of uranium was 7.2 μg g−1 even at an extremely low initial concentration of 3 μg L−1 in the simulated seawater for 24 h.
Conflicts of interest
There are no conflicts to declare.
Supplementary Material
Acknowledgments
The authors want to thank the technology support of Engineering Research Center of Biomass Materials, Ministry of Education, Southwest University of Science and Technology, and State Key Laboratory of NBC Protection for Civilian. This work was sponsored by Longshan academic talent research support plan of Southwest University of Science and Technology (18LZX315).
Electronic supplementary information (ESI) available. See DOI: 10.1039/c8ra09297d
References
- Monreal M. J. Diaconescu P. L. Nat. Chem. 2010;2:424. doi: 10.1038/nchem.642. [DOI] [PubMed] [Google Scholar]
- Das S. Brown S. Mayes R. T. Janke C. J. Chem. Eng. J. 2016;298:125–135. doi: 10.1016/j.cej.2016.04.013. [DOI] [Google Scholar]
- Li J. Q. Gong L. L. Feng X. F. Chem. Eng. J. 2017;316:154–159. doi: 10.1016/j.cej.2017.01.046. [DOI] [Google Scholar]
- Koh M. Yoo J. Yong P. Bae D. Park K. Ind. Eng. Chem. Res. 2006;45:5308–5313. doi: 10.1021/ie050992n. [DOI] [Google Scholar]
- Santos E. A. Ladeira A. C. Environ. Sci. Technol. 2011;45:3591–3597. doi: 10.1021/es2002056. [DOI] [PubMed] [Google Scholar]
- Ang K. L. Li D. Nikoloski A. N. Miner. Eng. 2018;123:8–15. doi: 10.1016/j.mineng.2018.04.017. [DOI] [Google Scholar]
- Xie S. B. Zhang C. Zhou X. H. Yang J. Zhang X. J. J. Environ. Radioact. 2009;100:162–166. doi: 10.1016/j.jenvrad.2008.09.008. [DOI] [PubMed] [Google Scholar]
- Zhou J. Zhu W. Yu J. Zhang H. Zhang Y. Appl. Surf. Sci. 2018;435:920–927. doi: 10.1016/j.apsusc.2017.11.108. [DOI] [Google Scholar]
- Bailey S. E. Olin T. J. Bricka R. M. Adrian D. D. Water Res. 1999;33:2469–2479. doi: 10.1016/S0043-1354(98)00475-8. [DOI] [Google Scholar]
- Gajowiak A. Majdan M. Drozdzal K. Przem. Chem. 2009;88:190–196. [Google Scholar]
- Zhuravlev I. Zakutevsky O. Psareva T. Kanibolotsky V. Strelko V. J. Radioanal. Nucl. Chem. 2002;254:85–89. doi: 10.1023/A:1020893515049. [DOI] [Google Scholar]
- Oshita K. Oshima M. Gao Y. Lee K. H. Motomizu S. Anal. Chim. Acta. 2003;480:239–249. doi: 10.1016/S0003-2670(03)00020-5. [DOI] [Google Scholar]
- Choi J. Park J. W. Geosci. J. 2005;9:53–61. doi: 10.1007/BF02910554. [DOI] [Google Scholar]
- Anirudhan T. S. Suchithra P. S. Appl. Clay Sci. 2008;42:214–223. doi: 10.1016/j.clay.2007.12.002. [DOI] [Google Scholar]
- Chibata I. Tosa T. Mori T. Watanabe T. Sakata N. Enzyme Microb. Technol. 1986;8:130–136. doi: 10.1016/0141-0229(86)90099-2. [DOI] [Google Scholar]
- Sakaguchi T. Nakajima A. Sep. Sci. 1987;22:1609–1623. doi: 10.1080/01496398708058421. [DOI] [Google Scholar]
- Nakajima A. Sakaguchi T. J. Chem. Technol. Biotechnol. 1987;40:223–232. doi: 10.1002/jctb.280400402. [DOI] [PubMed] [Google Scholar]
- Zhou J. Indian J. Chem. Technol. 2018;25:361–367. [Google Scholar]
- Yang D. Li Y. Nie J. Carbohydr. Polym. 2007;69:538–543. doi: 10.1016/j.carbpol.2007.01.008. [DOI] [Google Scholar]
- Okhawilai M. Rangkupan R. Kanokpanont S. Damrongsakkul S. Int. J. Biol. Macromol. 2010;46:544–550. doi: 10.1016/j.ijbiomac.2010.02.008. [DOI] [PubMed] [Google Scholar]
- Ju J. Kang W. Deng N. Li L. Zhao Y. Ma X. Microporous Mesoporous Mater. 2017;239:416–425. doi: 10.1016/j.micromeso.2016.10.024. [DOI] [Google Scholar]
- Yu J. Guo M. Muhammad F. Wang A. Zhang F. Carbon. 2014;69:502–514. doi: 10.1016/j.carbon.2013.12.058. [DOI] [Google Scholar]
- Li W. Liu Q. Liu J. Appl. Surf. Sci. 2017;403:378–388. doi: 10.1016/j.apsusc.2017.01.104. [DOI] [Google Scholar]
- Tan L. Liu Q. Jing X. Chem. Eng. J. 2015;273:307–315. doi: 10.1016/j.cej.2015.01.110. [DOI] [Google Scholar]
- Zhu J. Liu Q. Li Z. Liu J. Zhang H. J. Hazard. Mater. 2018;353:9–17. doi: 10.1016/j.jhazmat.2018.03.042. [DOI] [PubMed] [Google Scholar]
- Ngah W. S. Fatinathan S. J. Environ. Manage. 2010;91:958–969. doi: 10.1016/j.jenvman.2009.12.003. [DOI] [PubMed] [Google Scholar]
- Sikder M. T. Tanaka S. Saito T. J. Environ. Chem. Eng. 2014;2:370–376. doi: 10.1016/j.jece.2014.01.009. [DOI] [Google Scholar]
- Zhou L. Jin J. Liu Z. Liang X. Shang C. J. Hazard. Mater. 2011;185:1045–1052. doi: 10.1016/j.jhazmat.2010.10.012. [DOI] [PubMed] [Google Scholar]
- Tomar V. Prasad S. Kumar D. Adsorptive removal of fluoride from water samples using Zr–Mn composite material. Microchem. J. 2013;111:116–124. doi: 10.1016/j.microc.2013.04.007. [DOI] [Google Scholar]
- Sivakami M. S. Gomathi T. Venkatesan J. Jeong H. S. Kim S. K. Sudha P. N. Int. J. Biol. Macromol. 2013;57:204–212. doi: 10.1016/j.ijbiomac.2013.03.005. [DOI] [PubMed] [Google Scholar]
- Bai C. Zhang M. Li B. J. Hazard. Mater. 2015;300:368–377. doi: 10.1016/j.jhazmat.2015.07.020. [DOI] [PubMed] [Google Scholar]
- Zulfikar M. A. Afrita S. Wahyuningrum D. Ledyastuti M. Environmental Nanotechnology, Monitoring & Management. 2016;6:64–75. [Google Scholar]
- Song Q. Ma L. Liu J. J. Colloid Interface Sci. 2012;386:291–299. doi: 10.1016/j.jcis.2012.07.070. [DOI] [PubMed] [Google Scholar]
- Li R. Rong C. Qi L. J. Hazard. Mater. 2017;338:167–176. doi: 10.1016/j.jhazmat.2017.04.075. [DOI] [PubMed] [Google Scholar]
- Huang G. Li W. Liu Q. Liu J. Y. New J. Chem. 2017;42:168–176. doi: 10.1039/C7NJ03243A. [DOI] [Google Scholar]
- Yakout S. M. Rizk M. A. Desalin. Water Treat. 2013;53:1917–1922. doi: 10.1080/19443994.2013.860625. [DOI] [Google Scholar]
- Yang P. Liu Q. Liu J. J. Mater. Chem. A. 2018;5:17933–17942. doi: 10.1039/C6TA10022H. [DOI] [Google Scholar]
- Gunathilake C. Jaroniec M. Gorka J. Dai S. J. Mater. Chem. A. 2015;3:11650–11659. doi: 10.1039/C5TA02863A. [DOI] [Google Scholar]
- Xie X. Tian Y. Qin Z. Yu Q. Wei H. Wang D. Li X. Wang X. Sci. Rep. 2017;7:1. doi: 10.1038/s41598-016-0028-x. [DOI] [PMC free article] [PubMed] [Google Scholar]
- Zhang Y. Lin X. Hu S. Zhang X. Luo X. RSC Adv. 2016;6:73959–73973. doi: 10.1039/C6RA11112B. [DOI] [Google Scholar]
- Mani M. P. Jaganathan S. K. Bioinspired, Biomimetic Nanobiomater. 2018;7:213–218. doi: 10.1680/jbibn.17.00029. [DOI] [Google Scholar]
- Zhao W. Lin X. Qin Y. Cai H. Chen Y. Luo X. J. Radioanal. Nucl. Chem. 2017;314:1853–1864. doi: 10.1007/s10967-017-5559-5. [DOI] [Google Scholar]
- Teng B. Jian X. Gao Y. Chen W. J. Cleaner Prod. 2016;112:972–979. doi: 10.1016/j.jclepro.2015.09.005. [DOI] [Google Scholar]
- Liu F. Wang Z. Li G. Desalin. Water Treat. 2014;52:7172–7179. doi: 10.1080/19443994.2013.831787. [DOI] [Google Scholar]
- Falcao L. Araujo M. E. M. J. Cult. Herit. 2013;14:499–508. doi: 10.1016/j.culher.2012.11.003. [DOI] [Google Scholar]
- Wu L. Lin X. Zhou X. Luo X. Appl. Surf. Sci. 2016;384:466–479. doi: 10.1016/j.apsusc.2016.05.056. [DOI] [Google Scholar]
- Yang D. Wang X. Song G. Sci. Bull. 2017;62:1609–1618. doi: 10.1016/j.scib.2017.10.018. [DOI] [PubMed] [Google Scholar]
- Yu J. Luo X. Liu B. J. Mater. Chem. A. 2018;6:15359–15370. doi: 10.1039/C8TA05000G. [DOI] [Google Scholar]
- Li B. Ma L. Tian Y. J. Hazard. Mater. 2014;271:41–49. doi: 10.1016/j.jhazmat.2014.01.060. [DOI] [PubMed] [Google Scholar]
- Pena C. Caba K. D. L. Eceiza A. Ruseckaite R. Mondragon I. Bioresour. Technol. 2010;101:6836–6842. doi: 10.1016/j.biortech.2010.03.112. [DOI] [PubMed] [Google Scholar]
- Cheng Y. M. Sun X. Liao X. P. Shi B. Chin. J. Chem. Eng. 2011;19:592–597. doi: 10.1016/S1004-9541(11)60027-X. [DOI] [Google Scholar]
- Liao X. P. Ma H. W. Wang R. Shi B. J. Membr. Sci. 2004;243:235–241. doi: 10.1016/j.memsci.2004.06.025. [DOI] [Google Scholar]
- Sun X. Huang X. Liao X. P. J. Hazard. Mater. 2010;179:295–302. doi: 10.1016/j.jhazmat.2010.03.002. [DOI] [PubMed] [Google Scholar]
Associated Data
This section collects any data citations, data availability statements, or supplementary materials included in this article.


