Abstract
In this study, a glycolipid type of biosurfactant (BS) was produced, its characteristics were evaluated and several flooding tests were conducted in a micromodel to investigate its potential for enhancing oil recovery. A rhamnolipid BS producer strain was identified as a bacterium belonging to the genus Pseudomonas aeruginosa. This BS showed good stability at temperatures of 40–121 °C, pH values of 3–10 and salinity up to 10% (w/v) NaCl which is important in Microbial Enhanced Oil Recovery (MEOR). The rhamnolipid decreased the surface tension of water from 72 to 28.1 mN m−1 with a critical micelle concentration of 120 ppm. Thin layer chromatography, FTIR spectroscopy, 1H-NMR and 13C-NMR spectroscopy revealed the glycolipid structure of the BS. Response surface methodology was applied to optimize BS production. Several micromodel flooding tests were conducted to study the capability of the produced rhamnolipid in enhanced oil recovery for the first time. An oil recovery factor of 43% was obtained at 120 ppm of BS solution whereas the recovery factor obtained for water flooding was 16%. Contact angle measurements showed that BS solutions altered the wettability of a glass surface from oil wet to a strongly water wet state. Also the results illustrated that all BS solutions were impressive in microbial enhanced oil recovery (MEOR) and using the produced BS a considerable amount of trapped oil can be extracted due to interfacial tension reduction, wettability alteration towards water wet conditions and improving the mobility ratio.
In this study, a glycolipid type of biosurfactant (BS) was produced, its characteristics were evaluated and several flooding tests were conducted in a micromodel to investigate its potential for enhancing oil recovery.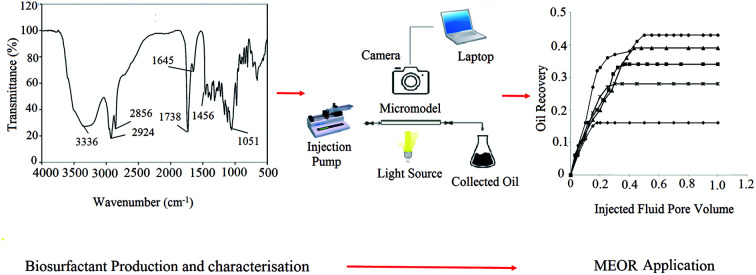
1. Introduction
In recent years, industry has been obliged to use biodegradable compounds rather than their chemical counterparts due to global environmental issues. Biosurfactants (BS) are known as natural surfactants produced by bacteria, fungi, and yeast.1 BS has many advantages compared to chemically synthesized surfactants such as high biodegradability, low toxicity, production from renewable sources and stable activity under harsh environmental conditions. They can be used in the food, agricultural, pharmaceutical, oil and petrochemical industries.2–4
Rhamnolipids, a class of glycolipid-containing BS, are mainly produced by Pseudomonas aeruginosa. Their structure is a combination of a polar head group and a hydrophobic tail. This kind of surfactant has one or two l-rhamnose moieties linked to one or two β-hydroxy fatty acids. Their production yield is higher than other biosurfactants such as lipopeptides (surfactin, etc). So, rhamnolipids are the most promising candidates for the mass production due to their great physicochemical properties, high production yield and metabolizing various carbon sources.5,6 Despite their abundant advantageous over synthetic surfactant and their wide application in different industries, rhamnolipids could not compete with synthetic surfactants due to high production costs.7,8
Low productivity of biomaterials is always one of the main bottlenecks for future commercial applications. So, the scientists try to increase the yield of bio-products by the methods such as gene manipulation of the microorganism and culture condition optimization. Since the economic production is one of the most concerns in BS production, selection of optimal growth conditions is unavoidable.
Almost 10–30% of the total production cost is dedicated to raw materials. Therefore, using low-cost raw material, such as plant derived oils is necessary.9 A classic design requires more experimental runs for estimation of variables and their effects. Response surface methodology (RSM) is one of the best methods for the design of experiments and optimization. It considers simultaneous variations in independent parameters and then the system response can be estimated using statistical techniques.2
Biosurfactants accumulate at a two-phase interface and reduce surface and interfacial tension. Such characteristics make them good alternatives for applications in microbial enhanced oil recovery (MEOR).9–11 Conventional enhanced oil recovery (EOR) technologies can only extract a maximum of 50% of trapped oils in the oil fields; therefore, most of the oil is left in the ground.12,13 MEOR has been developed as an alternative technology for secondary and tertiary methods for extracting more oil from reservoirs. MEOR has its own limitations and difficulties. For instance, its applications are limited because of high cost of production, which is almost 50 times that of chemical surfactants.14,15
The present study investigates the production of rhamnolipid BS using a new indigenous strain of Pseudomonas aeruginosa. Characterization of the produced BS was performed by TLC, FTIR and NMR. Kinetics of bacterial growth and BS production has been conducted as well as determination of CMC value and testing the BS stability at different temperatures, salinity and pH values. Culture condition has been optimized by Design Expert software. As a final step, the effectiveness of produced BS in heavy oil recovery enhancement and its ability to release trapped oil was evaluated for the first time using micromodel tests.
2. Materials and methods
2.1. Microorganism and growth medium
Samples were gathered from urban waste at the Kahrizak site in the south of Tehran as described in the previous work of authors.16 Briefly, the samples were inoculated in nutrient broth medium and incubated on a rotary shaker. After serial dilution of the cultures, they were spread on nutrient agar plates and single colonies were obtained and purified. The ability of purified colonies to produce BS was determined by the oil spreading test and measurement of the medium surface tension. Among the 140 purified colonies, seven bacteria with the best surface activity were selected. All these bacteria were identified by PCR followed by gene sequencing. The results were submitted to and accepted by the National Center for Biotechnology Information (NCBI). One of them was identified as Pseudomonas aeruginosa HAK01 (accession no. KP100523) and was used to produce the BS in this research.16 It was initially pre-cultured in nutrient broth at 30 °C and 200 rpm for 16 h. A 2% inoculation was transferred from this culture to the following production medium (g L−1): sunflower oil (20), yeast extract (1), NaNO3 (3), MgSO4·7H2O (0.25) and KH2PO4 (0.25).3
It is worthy to note that using inexpensive substrates for culture media can reduce the operating costs of BS production. The cost of sugar-type sources, such as glucose, is much higher than plant oils. Therefore, by using sunflower oil in this research expensive costs of BS production can be avoided.
2.2. Extraction and purification of surface active molecules
BS production experiments were carried out in shaker flasks. The BS was separated from the culture broth by acid precipitation followed by solvent extraction as reported in previous works.16,17 Briefly, after fermentation, bacterial cells were removed from the culture broth by centrifugation (7000 × g; 4 °C; 15 min). The cell-free supernatant was then acidified to pH 2 using 6 mol L−1 HCl and kept at 4 °C overnight to precipitate the BS. Then, the crude BS was separated by high speed centrifugation of the acidified supernatant (12 000 × g; 4 °C; 20 min). For further purification, the crude BS was extracted three times using ethyl acetate. After extraction the solvent was evaporated in an oven and the concentrated residue was used as purified BS.16,17
2.3. Physical and surface activity properties
Surface tension (ST), Interfacial tension (IFT), critical micelle concentration (CMC), the oil spreading test (OST) and emulsification activity (E24%) were applied to investigate the surface-active properties of the BS. The surface tension CMC of the extracted BS and IFT values between BS solutions and crude oil were determined at 25 °C (Lauda TE3; Germany) using the ring method. ST and IFT values were measure three times to ensure the accuracy of obtained results.
The oil spreading test measures the diameter of the displaced clear zone caused when a drop of a BS-containing solution is put on the oil–water surface.18,19 The standard procedure of oil spreading test was performed to determine the level of BS activity.20 OST is also a reliable way to evaluate the concentration of BS. For OST, 50 ml of distilled water was added to a Petri dish 10 cm in diameter. Then 15 μl of crude oil was put onto the surface of the water to form a thin oil layer. Next, 10 μl of the test solution was dropped onto the surface of the oil. A clear zone appeared and its diameter was measured. All the diameters in the test series were divided into the maximum diameter and expressed separately as a dimensionless diameter. All tests were conducted at room temperature.15 The emulsification activity of the BS was measured according to Cooper and Goldenberg.21 A mixture of 3 ml n-hexane and 2 ml of culture broth free of cells was vortexed for 2 min at high speed and the emulsification index (E24) was measured after 24 h. This measure was calculated by dividing the emulsion layer height by the total height and multiplying by 100.
2.4. Characterization
The extracted BS was then investigated for its chemical structure by thin layer chromatography (TLC), Fourier transform infrared spectroscopy (FTIR) and nuclear magnetic resonance (NMR) spectroscopy.
2.4.1. TLC
Initial characterization of the BS was evaluated using TLC. A portion of the crude BS was separated on a silica gel plate using CHCl3 : CH3OH : H2O (70 : 10 : 0.5, v/v/v) as the developing solvent system with a color developing reagents (iodine and anthrone). After development, one plate was put into a jar saturated with iodine vapor to identify lipids as yellow spots. Another plate was sprayed evenly using anthrone reagent (1 g anthrone in 5 ml sulfuric acid mixed with 95 ml ethanol) to identify glycolipid BS as blue-green spots.22
2.4.2. FTIR
FTIR is one of the best methods to determine the types of functional groups and chemical bonds in the structure of an unknown compound.16 After milling 15–20 mg of dried BS with 200 mg of KBr and compressing it into a thin pellet, the FTIR spectrum of the BS was recorded by FTIR spectrophotometer (PerkinElmer Frontier; USA) at 400–4000 cm−1.
2.4.3. NMR
The BS was subjected to further analysis with NMR. The 1H and 13C spectra were measured at 25 °C using a Bruker JNM-A500 spectrometer (Germany) equipped with a triple-resonance (1H, 13C, 15N) inverse probe with 5 mm in diameter tubes containing 600 μl of sample, with deuterated chloroform as a solvent. A total of 128 scans were collected (90° pulse, 7.3 μs; 3 s saturation pulse; 3 s relaxation delay; 4.679 s acquisition time; 65,536 data points). A 1 Hz exponential line-broadening filter was applied before Fourier transformation, and a baseline correction was performed on the spectra before integration using Bruker software (Topspin 2.0).
2.5. Thermal properties and stability investigation
The extracted BS was evaluated for its stability in different harsh conditions of temperature, pH and salinity. BS stability under extreme environmental condition is vital for industrial applications such as enhanced oil recovery under severe conditions in crude oil reservoirs. The surface activity of 0.2 g L−1 BS solution was evaluated using the oil displacement technique. To study the effect of pH, the pH of the solution was adjusted from 3 to 10 using HCl (6 mol L−1) or NaOH (6 mol L−1) and oil spreading tests were carried out.
To assess the thermal stability, the solution was kept at a constant temperature of 40–90 °C for 60 min and at 121 °C in an autoclave for 20 min, then cooled to room temperature and an OST was conducted. To determine the effect of changes in salinity on BS surface activity, different concentrations of NaCl (up to 10% w/v) were prepared, an OST was conducted and the dimensionless diameter of the clear zone was determined in each case. Note that, in each test series, all the diameters were divided into the maximum diameter and expressed as a dimensionless diameter that was figured versus pH, temperature and salinity, separately. All tests were conducted at room temperature.
Thermal gravimetric analysis (TGA) is a method used to characterize materials. This technique measures the amount and change rate in the mass of a sample as a function of time or increasing temperature (at a constant heating rate) and determines the thermal stability and compositional characteristics of a material. The TGA of the extracted BS was conducted using a Netzsch TG 209F1 Iris system (Germany). About 10 mg of the sample was placed onto a platinum pan and its weight loss recorded at a heating rate of 10 °C min−1 from 30–500 °C. The test was performed under nitrogen atmosphere.
2.6. Optimization of BS production using RSM
The classic method of optimization does not assure the optimal values of selected variables in BS production. Application of an optimal design eliminates classic designs from consideration; therefore, a statistical optimization strategy based on RSM was applied. This is a statistical-mathematical method for analyzing the effects of independent parameters on the response of a system.
Components of culture media and environmental conditions have great influence on the amount of produced BS. Therefore, the optimization could be performed using mathematical and statistical tools to maximize the production yield and lower production cost. For optimization of growth culture and to determine the optimal conditions for maximum production of BS, a central composite design (CCD) was applied. Three factors in five levels were considered as shown in Table 1. The effect of the selected variables on BS yield and their interactions were assessed using Design-Expert software version 7.1.4. A total of 18 experiments using a CCD were conducted with 6 axial points, 8 factorial points and 4 central points.
Quantitative values for the parameter levels.
| Factor | Code | Unit | Level | ||||
|---|---|---|---|---|---|---|---|
| −α = −2 | −1 | 0 | 1 | +α = 2 | |||
| Carbon source concentration | A | (g L−1) | 10 | 15 | 20 | 25 | 30 |
| Inoculation | B | (% v/v) | 1 | 2 | 3 | 4 | 5 |
| Salinity | C | (% w/v) | 0 | 2.5 | 5 | 7.5 | 10 |
2.7. Oil recovery experiments
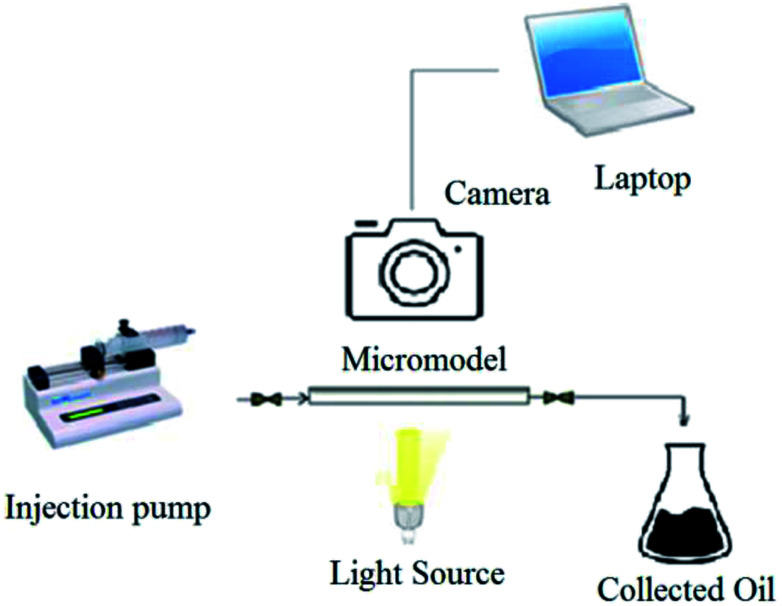
As a consequence, in this research, the effect of produced rhamnolipid on the oil recovery is investigated by micromodel flooding tests. Several solutions with different concentrations of produced rhamnolipid were prepared and injected into the micromodel as a porous medium to evaluate the performance of produced BS in enhanced oil recovery process. It is noticeable that experiments were carried out at ambient temperature and pressure. In order to avoid gravity effect, the micromodel was positioned horizontally in all of conducted experiments. At first, the micromodel was made oil-wet by the general procedure.23 Before solution injection, the micromodel was washed completely with toluene. It is essential for removal of any dirt and extra material inside the micromodel. After that, the model was saturated with heavy oil. Then the solution was injected at flow rate of 0.05 ml h−1, that simulates fluid velocity in the oil reservoirs which is almost 1.2 ft per day.24 The used crude oil sample in this investigation was supplied from north Azadegan field in Iran with API of 19.5, total acid number (TAN) of 0.46 mg KOH/mg oil and asphaltene content of 10.12 wt% and viscosity of 242 cP at 25 °C. During the solution injection, process pictures were taken every two minutes with a camera (Canon EOS 7D) connected to the computer. The micromodel setup has been demonstrated in Fig. 1. Visual observation of phase displacement behavior is possible in a glass micromodel, and ultimate oil recovery percentage was calculated after analyzing of taken pictures by Photoshop software.
Fig. 1. Schematic of used micromodel setup.
2.8. Contact angle measurement
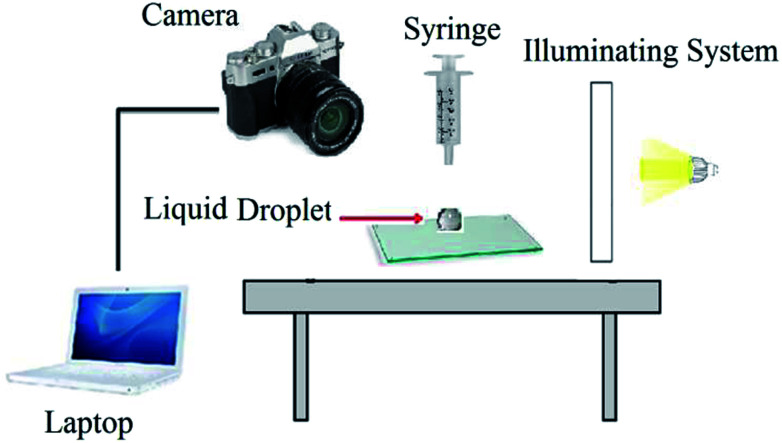
Contact angle measurement is one of the conventional methods to study the wetting characteristic of a solid surface. A schematic of used setup is shown in Fig. 2.
Fig. 2. Schematic setup for contact angle measurement.
The tests were performed on small glass surfaces. (4 × 3 × 0.3 cm), and samples were oil wetted initially.23 Then, to investigate the effects of injected solutions on the wettability of oil wet glass surface, the contact angles were measured at regular time intervals. A drop of the BS solution was placed on the oil wet glass surface and the images were taken every two minutes. The variations of contact angle with time were investigated for wettability alteration study.
2.9. Viscosity test
In this research, the viscosities of solutions were measured using a Brookfield viscometer (NDJ-4; China) at ambient temperature.
3. Results and discussion
3.1. Kinetics study
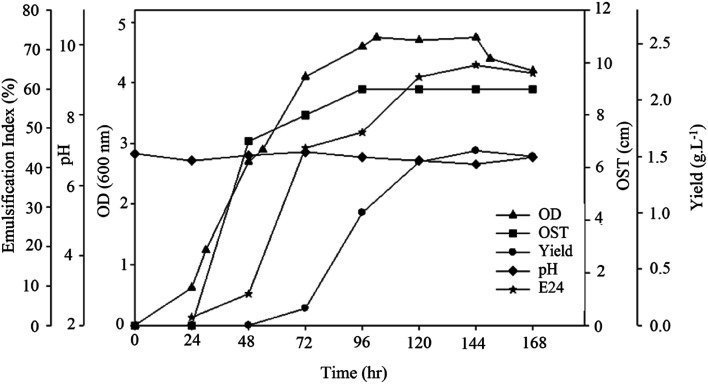
In order to obtain insight into bacterial growth and BS production, the strain was grown on sunflower oil medium and its kinetic parameters were evaluated. The samples were retrieved to measure pH, optical density, diameter of the clear zone (OST) and E24 and BS yield. The results are shown in Fig. 3. The BS yield began to increase 48 h after bacterial growth and reached its maximum of 1.55 g L−1 after 144 h of growth. The decrease in BS yield after this point may have been the result of a lack of nutrients in the medium.
Fig. 3. Kinetics of bacterial growth and BS production.
The diameter of clear zone (OST) increased immediately after BS production. This diameter reached its maximum at 96 h. A similar increase in emulsification activity was noted with the increase in BS production. The higher emulsification index values indicate that the extracted BS showed higher emulsification activity.22 The culture pH changed only slightly, which shows there was no acidic or basic material in the culture.
3.2. Structural characterization of BS
3.2.1. TLC analysis
Primary characterization of the BS was carried out using TLC. After development, the plate that was in contact with iodine vapor showed yellow spots, indicating the presence of polar lipids. Treatment with anthrone solution revealed the presence of rhamnose with characteristic blue/green spots. This suggests a glycolipid structure for the produced BS.
3.2.2. FTIR analysis
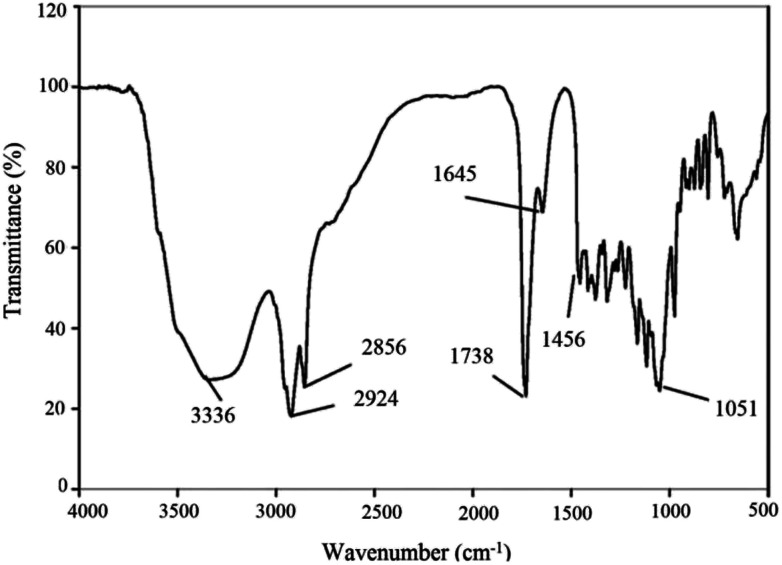
Fig. 4 shows the FTIR results.
Fig. 4. FTIR spectrum profile of dried BS produced by Pseudomonas aeruginosa HAK01.
The infrared spectra of purified BS indicated a broad peak at 3336 cm−1 characteristic of the –OH functional group because of H bonding, which indicates the presence of polysaccharides. The sharp bands at 2856 and 2924 cm−1 indicate the presence of C–H bands (CH2–CH3) in the hydrocarbon chain. Absorption around 1738 cm−1 and a weak peak at 1456 cm−1 represent ester carbonyl groups (C O in COOH). The stretching peak observed at 1645 cm−1 is related to ester compounds. The absorption peak around 1051 cm−1 is assigned to C–O–C in the rhamnose molecule in the BS. The absence of bands around 1550, 3420 and 3245 cm−1 demonstrates the absence of N–H bonds, confirming the absence of amino acids (which are present in lipopeptide-type BS). These results taken together prove that the BS has a rhamnolipid structure with rhamnose rings and long hydrocarbon chains.
3.2.3. NMR analysis
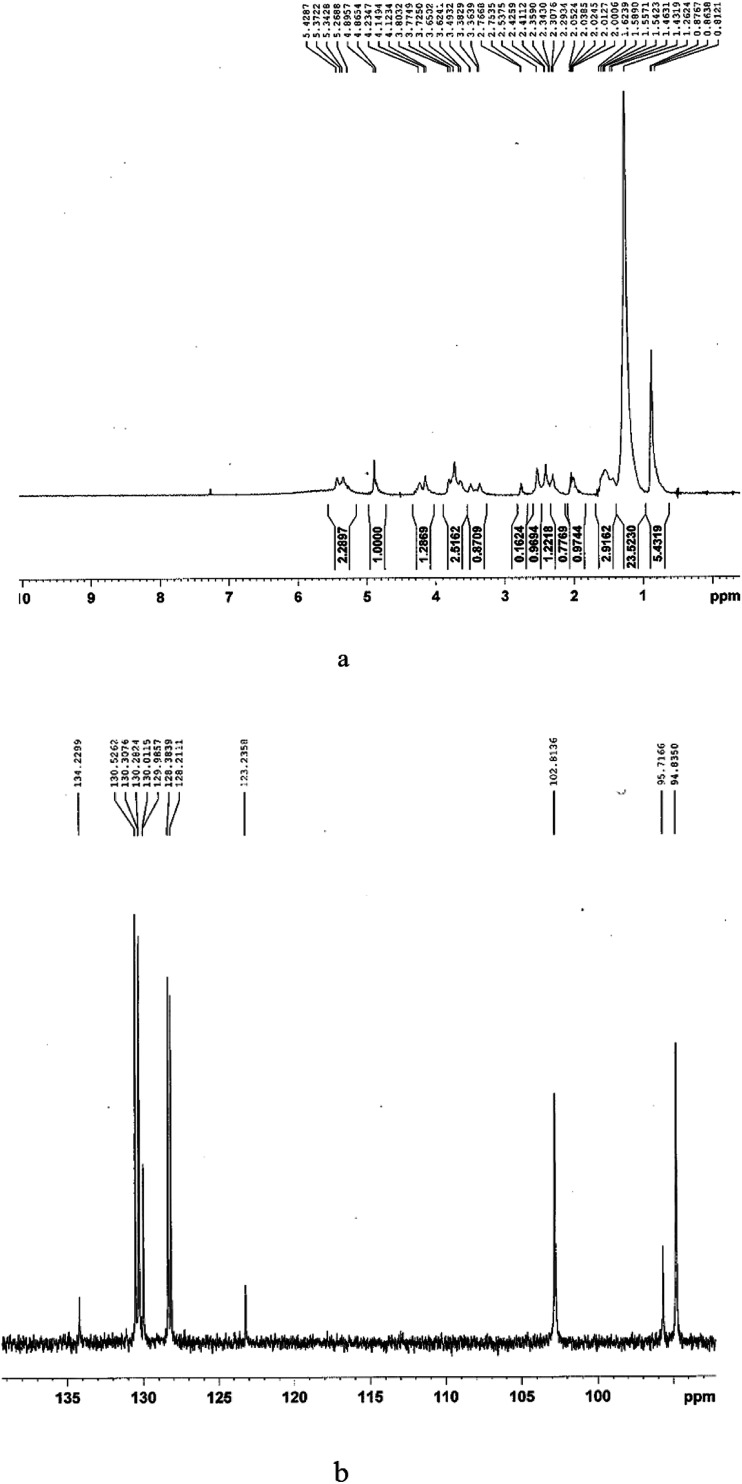
The NMR results are plotted in Fig. 5. The presence of long hydrocarbon chains and rhamnose rings is detected by the appearance of the characteristic chemical shifts in the 0.8–1.4 and 3.3–5.5 ppm regions, respectively. The presence of characteristic chemical shifts in the 3.3–5.5 ppm region is an indication of rhamnose rings in rhamnolipids. The characteristic chemical shifts in 1H NMR analysis were observed at 0.8767 ppm for the methyl group (–CH3), 1.2624 ppm for the long hydrocarbon chains (–CH2)n–, 2.5375 ppm for –CH2–COO–, 3.3639 ppm for –CH–OH (rhamnose moiety), 4.1234 ppm for –O–CH–, 5.2688 ppm for –CH–O–C– (rhamnose moiety) and 5.3722 ppm for –COO–CH–. The signals at 3.4932 ppm and 4.8654 revealed the presence of sugar moiety in the structure of the BS.
Fig. 5. (a) 1H-NMR; (b) 13C-NMR test results for extracted BS.
In 13CNMR analysis, the chemical shifts were at 95.7166 ppm, which is characteristic of RL1 (l-rhamnosyl-β-hydroxydecanoyl-β-hydroxydecanoate) and 102.8136 and 94.8350 ppm, which are characteristic of RL2 (l-rhamnosyl-l-rhamnosyl-β-hydroxydecanoyl-β-hydroxydecanoate). The results indicate that the rhamnolipid consisted of RL1 (mono rhamnolipid) and RL2 (di rhamnolipid), which are two major types of rhamnolipids.
3.3. Thermal properties and stability analysis
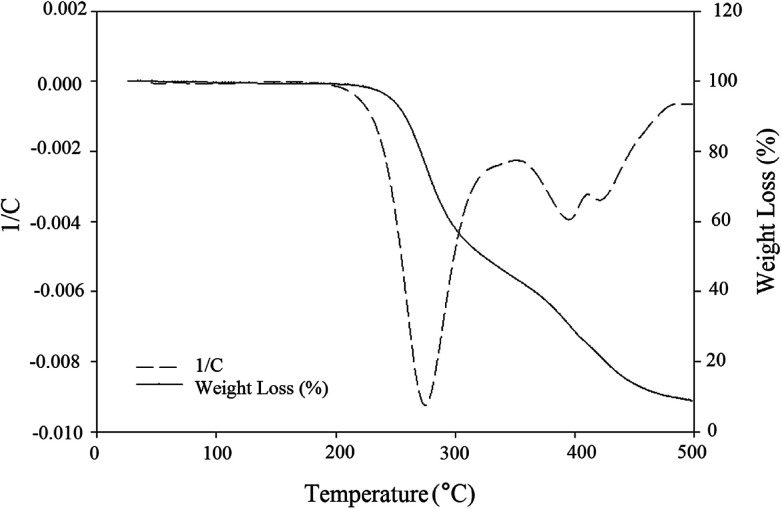
As oil reservoirs possess harsh condition of salinity, temperature and pH, high stability of produced BS under these environmental conditions is necessary to achieve good effectiveness in MEOR. In other words, thermal stability of the BS is an important characteristic for commercial applications. As can be seen in Fig. 6, a constant slope to 200 °C denotes the absence of trapped moisture molecules in the structure of the BS and indicates that the BS was truly anhydrous. There are three major steps in weight loss at temperatures more than 200 °C and the DTG curve demonstrates that the maximum change of weight occurs at 280 °C and 380 °C for first and second steps of degradation, respectively. At the first step of degradation, about 60 percent weight loss was observed from 240 °C to 340 °C. This is related to decomposition of rhamnose structure. This is followed by the second major step, weight loss of 10 percent at 360 to 390 °C. The last major weight loss, almost 12 percent, occurs from 410 °C to 470 °C and is attributed to decomposition of hydrocarbon chain. Other weight losses are related to decomposition of the unstable components of the BS.
Fig. 6. TGA-DTG graph for extracted BS.
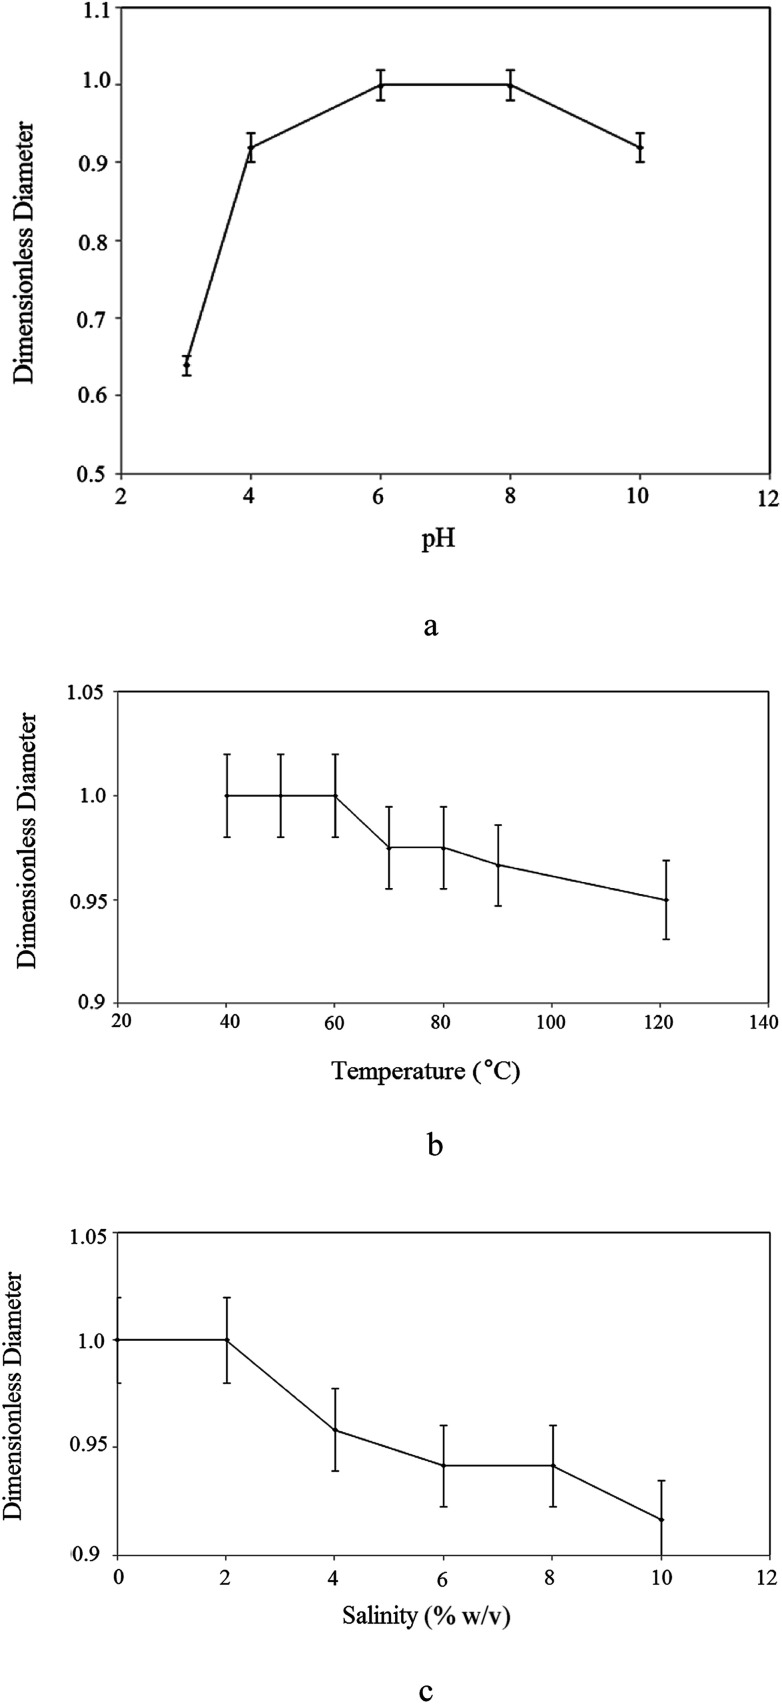
Fig. 7 shows the effect of environmental parameters on the surface activity of the BS. Fig. 7(a) shows the variation in dimensionless diameter versus the pH of the BS solution. As solution acidity increased, the dimensionless diameter decreased. This occurs because when rhamnolipid is precipitated under extremely acidic conditions, its structure is distorted and its ability to reduce surface tension is lost. Except under severe acidic conditions the dimensionless diameter of the clear zone remained almost constant, indicating that the surface tension of the culture supernatant was stable for a wide pH range.
Fig. 7. Influence of: (a) pH; (b) temperature; (c) salinity on the stability of produced rhamnolipid.
Fig. 7(b) plots the results versus temperature, confirming the thermal stability of the BS. The dimensionless diameter of the clear zone is nearly constant irrespective of the variation in temperature, proving that the rhamnolipid is thermostable over a wide range of temperatures (40–121 °C) and that high temperature conditions caused no detrimental effects on BS activity.
The stability of the extracted rhamnolipid for different concentrations of sodium chloride is shown in Fig. 7(c). BS surface activity was stable up to 10% (w/v) NaCl and then a slight decrease occurred. It is clear from the figure that, at the maximum NaCl concentration of 10% (w/v), the BS maintained almost 90% of its surface activity.
The results indicate that the BS was stable and functional under extreme temperatures (40 to 121 °C), sodium chloride concentrations and at a wide range of pH values. Therefore, it can withstand severe conditions of oil reservoirs that is very crucial in MEOR. Good stability and performance of BS at high temperature and salinity is attributed to presence of carboxylate group in its structure. Carboxylate unit raises the long-term stability of BS at high temperature and salinity and a lot of energy is required for its thermal decomposition. Additionally, compounds with hydrophilic structure are stable in high salinity mediums. Also, the presence of rhamnose moiety with several hydroxyl groups in BS structure leads to its high solubility in water.
Morikawa et al.19 found that the displaced area in oil displacement test is directly proportional to the concentration of BS in solution. OST showed that the high BS concentrations in the culture resulted in low surface tension values and confirmed that it is a reliable approach for measuring BS production and surface activity.19 Abbasi et al.25 conducted this test and measured the diameter of the clear zone as a measure of surface activity of the rhamnolipid. Any change in clear zone diameter indicated a change in BS stability. The advantages of the oil displacement method are that it is quick and easy, requires a small amount of sample and does not require special equipment.19
3.4. Surface activity
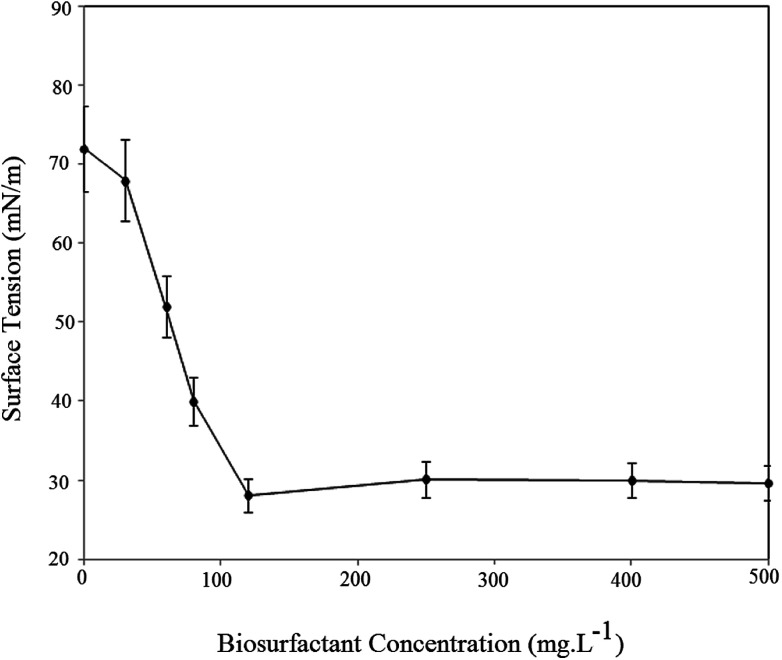
The surface activity of the BS was investigated as the CMC value and a decrease in surface tension. CMC is the lowest concentration of BS needed to form micelles. Above the CMC further addition of BS will not reduce surface tension of the solution. Fig. 8 plots the surface tension of the BS solution at different concentrations.
Fig. 8. Surface tension changes and CMC value of rhamnolipid produced by HAK01.
As seen, increasing the BS concentration decreased the air/water surface tension up to the CMC, after which the BS concentration had no effect on solution surface tension. The data indicates that the CMC for BS was 120 ppm, which corresponds to a surface tension of 28.1 mN m−1. For better understanding Table 2 compares CMC value, yield and ST for rhamnolipids and surfactin in recent literature.
CMC values of different rhamnolipids.
| Strain type | P. aeruginosa HAK01 | P. aeruginosa KVD-HR42 | P. aeruginosa DR1 | P. aeruginosa PBS | B. subtilis B30 | B. subtilis BS-37 |
| BS type | Rhamnolipid | Rhamnolipid | Rhamnolipid | Rhamnolipid | Surfactin | Surfactin |
| CMC (ppm) | 120 | 100 | 80 | — | — | 20 |
| Yield (g L−1) | 2.07 | 5.90 | 1.8 | 2.65 | 0.3 | 0.585 |
| ST (mN m−1) | 28.1 | 30.14 | 30 | 23.76 | 26.63 | 28 |
| Ref. | This research | 2 | 26 | 27 | 11 | 28 |
CMC values of rhamnolipids are considerably less than conventional chemical surfactants such as SDS (CMC 2200 ppm),29 and its values for rhamnolipids ranges between 50 and 200 ppm. Higher CMC values mean that more amount of surfactant is needed to decrease surface tension. Thus less BS is necessary to reach a maximum decrease in ST, and this is one of the reasons that make BS more useful compared to chemical surfactants. In addition, their production yield is generally more than other biosurfactants such as surfactin.5,6
3.5. Process optimization
3.5.1. Statistical modeling
Table 3 lists the experimental design and results. The experimental results were fitted to a modified quadratic polynomial model, the regression coefficients calculated and fitted to the following quadratic model:
| BS production yield (g L−1) = 0.50534 + 0.098409A − 0.178785B − 0.16909C + 0.0205AB − 0.0042AC − 0.031BC − 0.00297A2 + 0.018109C2 | 1 |
A, B and C denote the actual sunflower oil concentration (g L−1), inoculation (% v/v) and salinity (% w/v), respectively.
Experimental design, factors and production yield as the response.
| Run no. | Factor | Response | ||
|---|---|---|---|---|
| Carbon source concentration (g L−1) | Inoculation (% v/v) | Salinity (% w/v) | Yield (g L−1) | |
| 1 | 15 | 4 | 7.5 | 0.29 |
| 2 | 20 | 5 | 5.0 | 0.67 |
| 3 | 20 | 3 | 5.0 | 0.70 |
| 4 | 25 | 2 | 2.5 | 1.00 |
| 5 | 20 | 1 | 5.0 | 0.58 |
| 6 | 20 | 3 | 10.0 | 0.39 |
| 7 | 25 | 4 | 7.5 | 0.44 |
| 8 | 25 | 2 | 7.5 | 0.29 |
| 9 | 15 | 4 | 2.5 | 1.10 |
| 10 | 20 | 3 | 5.0 | 0.69 |
| 11 | 20 | 3 | 0.0 | 1.85 |
| 12 | 20 | 3 | 5.0 | 0.73 |
| 13 | 10 | 3 | 5.0 | 0.18 |
| 14 | 25 | 4 | 2.5 | 1.78 |
| 15 | 30 | 3 | 5.0 | 0.56 |
| 16 | 20 | 3 | 5.0 | 0.70 |
| 17 | 15 | 2 | 2.5 | 1.05 |
| 18 | 15 | 2 | 7.5 | 0.23 |
The effect of B2 was not considered because of its high p-value. Analysis of variance (ANOVA) at a p-value < 0.05 was performed to evaluate the effect of process variables on BS yield as the response of the system.
3.5.2. Statistical analysis
Table 4 shows the results of ANOVA for the effect of process variables on BS yield. The p-value (<0.0001), lack of fit (0.0018) and high R2 value (0.9587) indicate that the modified quadratic model correlated well with the experimental values.
Results of ANOVA for fitted statistical model.
| Source | Sum of squares | DOF | Mean square | F-Value | p-Value |
|---|---|---|---|---|---|
| Prob > F | |||||
| Model | 3.71 | 8 | 0.46 | 26.15 | <0.0001 |
| A: sunflower oil concentration | 0.16 | 1 | 0.16 | 9.03 | 0.0148 |
| B: inoculation | 0.093 | 1 | 0.093 | 5.25 | 0.0477 |
| C: salinity | 2.72 | 1 | 2.72 | 153.61 | <0.0001 |
| AB | 0.084 | 1 | 0.084 | 4.74 | 0.0574 |
| AC | 0.022 | 1 | 0.022 | 1.24 | 0.2936 |
| BC | 0.048 | 1 | 0.048 | 2.71 | 0.1341 |
| A 2 | 0.13 | 1 | 0.13 | 7.57 | 0.0225 |
| C 2 | 0.31 | 1 | 0.31 | 17.55 | 0.0023 |
| Residual | 0.16 | 9 | 0.018 | ||
| (R2 = 0.9587) |
The p-value indicates that the model was significant at a 95% probability level. Variables with p-values of ≤0.05 were considered significant. Factor C, salinity, had the greatest effect on response.
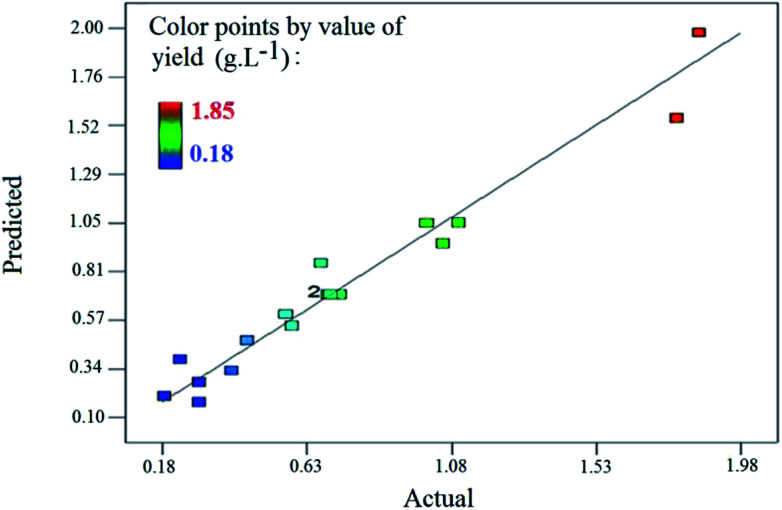
Fig. 9 plots the results predicted by the model versus the actual results. Most of the points occurred around the 45 line, meaning that there was good conformity between the experimental data and values predicted by the model.
Fig. 9. Predicted values by the model vs. actual values obtained by the experiments.
3.5.3. Effective parameters interaction
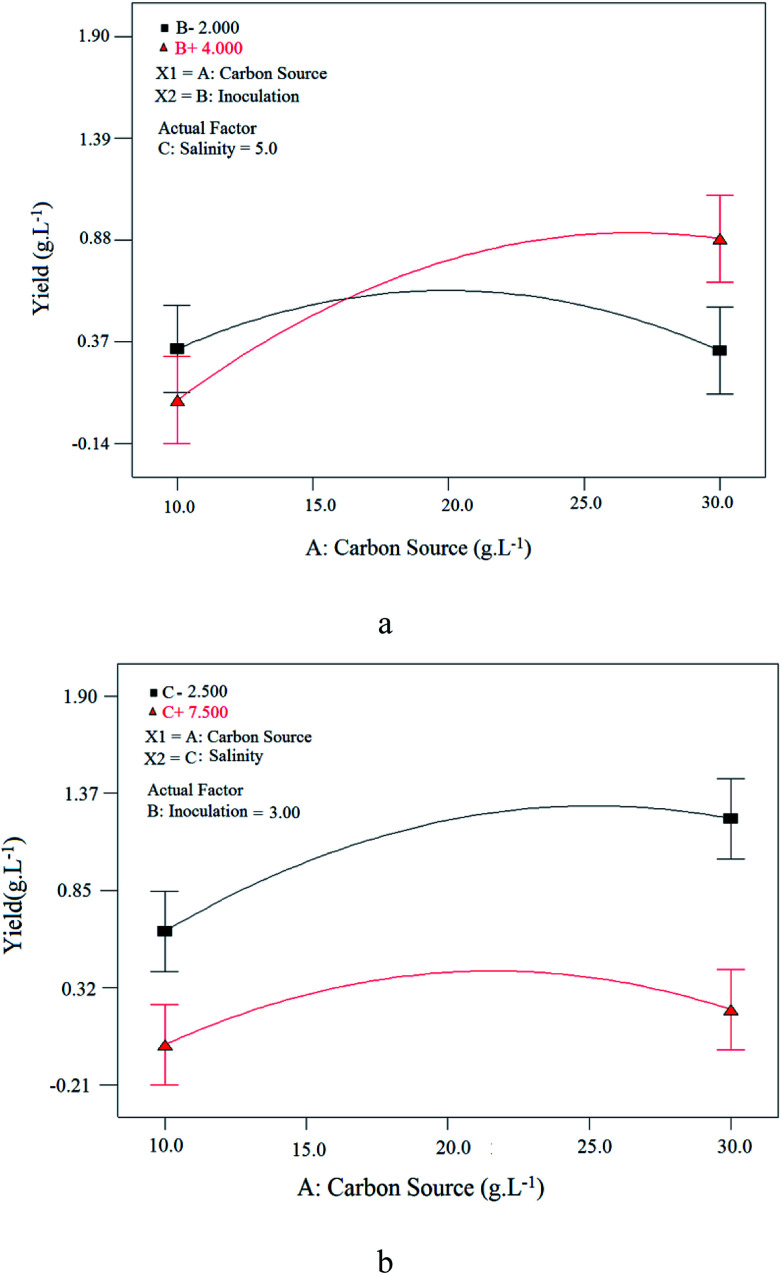
As it can be observed in Fig. 10(a), by increasing the carbon source, BS yield increases, passes through a maximum and then decreases gradually. However, at lower amount of inoculation, less carbon concentration is required to achieve maximum BS production. In other words, the optimum carbon concentration will be less in the case of lower amount of inoculation. Fig. 10(b) demonstrates the interaction effect of carbon source and salinity on BS yield. Considering this figure more BS yield was achieved at lower salinities (2.5% w/v).
Fig. 10. Interaction of: (a) carbon source and inoculation parameters at constant salinity value; (b) carbon source and salinity parameters at constant inoculation value.
Generally speaking, strains isolated from high salinity medium, such as sea water, have a good stability in environment with high salinities, but for strains isolated from environmental with no or low salinity, salinity has a bad effect on the growth of the strain, and therefore on the BS production yield. In this research, since this strain is isolated from urban waste, its growth is sensitive to salinity and salty environment has the bad effect on the BS production, so that higher production occurs at lower salinities.
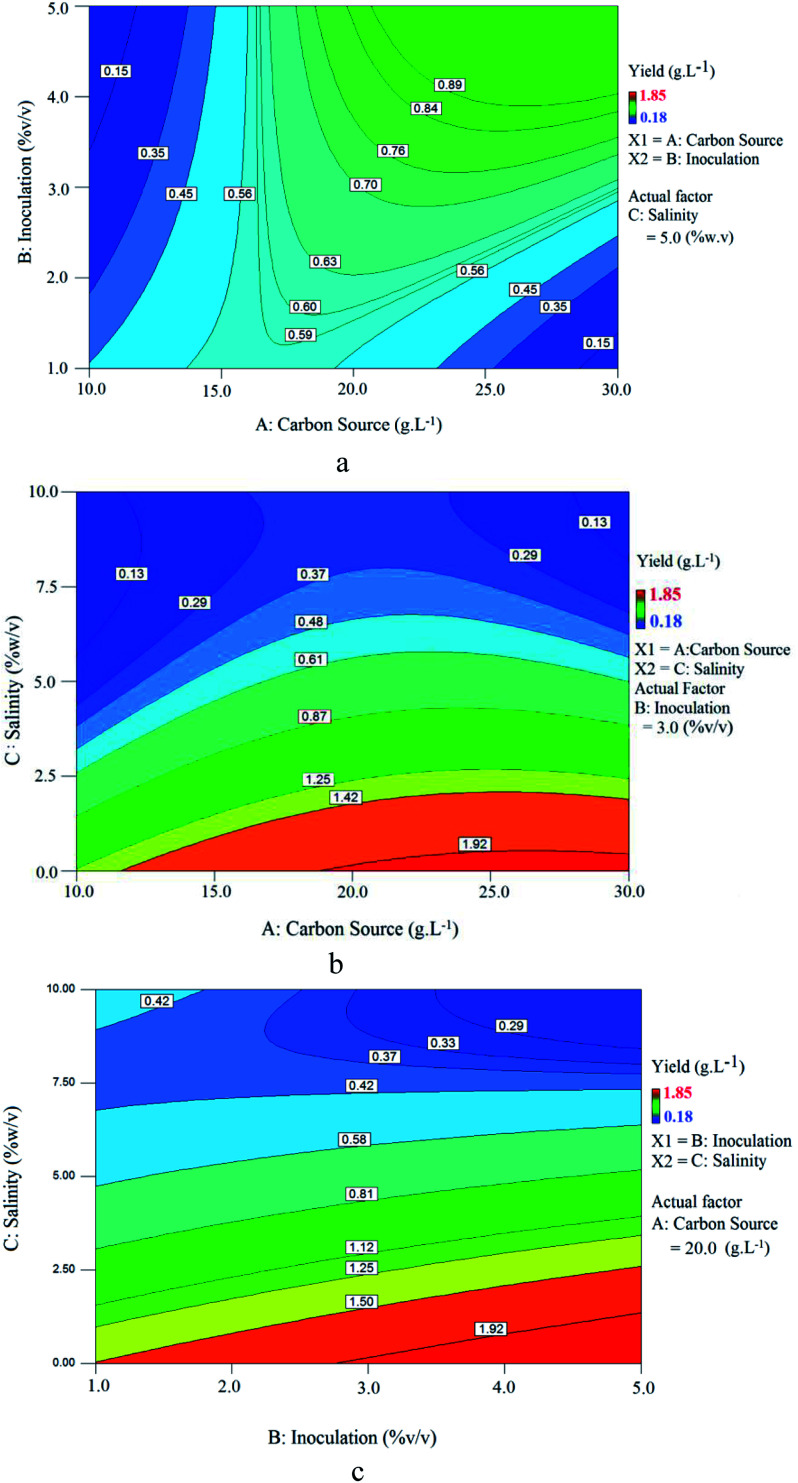
Fig. 11 shows contour plots of the relationship between variables. Fig. 11(a) shows the effect of carbon source (sunflower oil) concentration and inoculation at 5% (w/v) constant salinity, where by increasing carbon source, BS yield increases, reaches a maximum and then decreases gradually. This trend indicates that there is an optimum range for carbon source concentration/inoculation ratio at which BS yield will be maximized. Above this value, an increase in carbon source concentration decreased the BS yield. Values below this optimum range denote an insufficient carbon source as a nutrient for microorganisms, lowering BS yield. Values above this optimum range provide too much carbon source for microorganisms, resulting in excessive osmotic pressure.
Fig. 11. Contour plot of BS yield at constant: (a) salinity (5% w/v); (b) inoculation (3% v/v); (c) carbon source concentration (20 g L−1).
The relationship between carbon source concentration and salinity at 3% (v/v) constant inoculation for BS yield is presented in Fig. 11(b). As seen, as the carbon source concentration increased and salinity decreased, BS yield increased. Increasing the carbon source concentration at a constant inoculation rate provides more nutrients to microorganisms for growth and BS production.
Fig. 11(c) shows the influence of inoculation and salinity at a constant carbon source concentration (20 g L−1). It is clear that increasing the inoculation and decreasing salinity, increased BS yield. Increasing the inoculation at a constant carbon source concentration provided more microorganisms for growth and BS production. Fig. 11(b) and (c) revealed that the microorganism is sensitive to salinity and maximum production will occur at low culture salinity. This is consistent with the results obtained from Fig. 10(b).
3.5.4. Confirmation experiment
The maximum production yield of 1.94 (g L−1) was predicted by the model at the optimum sunflower oil concentration (22.90 g L−1), inoculation (2.77% v/v) and salinity (0.19% w/v). Confirmation testing was performed in triplicate to validate the model at the optimal points. The average value was 2.07 g L−1, about 8% deviation compared to the predicted yield of 1.94 g L−1. The minimum and maximum values at the 95% confidence interval were 1.67 and 2.21, respectively.
3.6. Performance study of produced BS in enhanced oil recovery
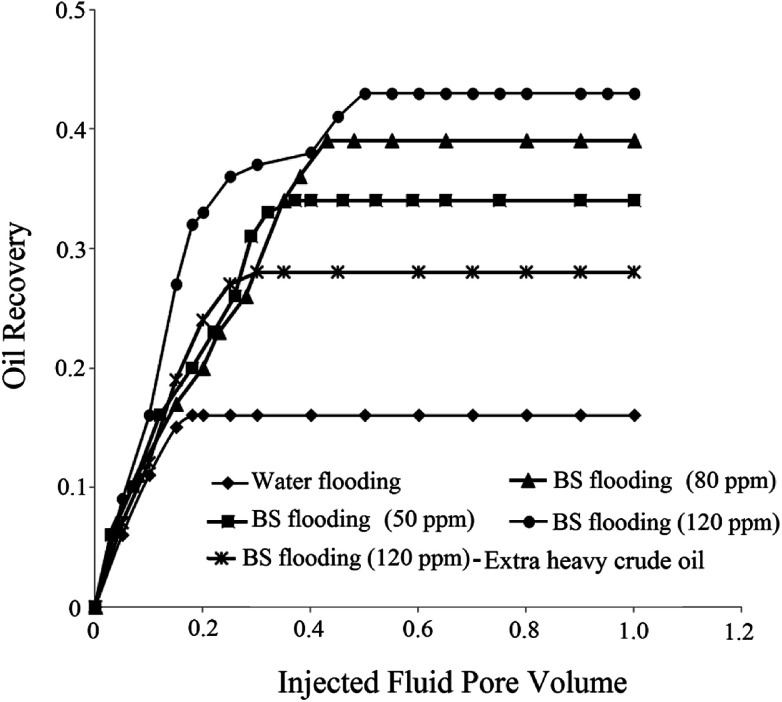
Using primary and secondary methods of oil recovery, considerable amount of oil remains in the reservoir due to its high viscosity and IFT. BS molecules mobilize oil trapped in the reservoir by reducing IFT and capillary forces and changing the wettability of solid rock to more water wet state. Consequently, oil recovery from the reservoir enhances. For analyzing the effectiveness of BS role in oil recovery, three micromodel tests were performed at different BS concentrations and the obtained results were compared to those of water flooding as a commercial process. Also for comparison of obtained results, one flooding test was conducted with BS solution (120 ppm) using extra heavy crude oil (API = 15). For more detailed investigation, the results of all flooding experiments are summarized in Fig. 12, in which the oil recovery factor is plotted vs. pore volume (PV) of the injected fluid.
Fig. 12. Oil recovery factor versus injected fluid pore volume.
As observed in Fig. 12, the ultimate oil recovery of 16% was achieved in water flooding. By increasing the BS concentration in the injected fluid, more ultimate oil recovery is achieved until reaches remarkable value of 43% for 120 ppm BS concentration in solution. The worth mentioning point is that more PV of the injected fluid is required at higher BS concentration to reach ultimate oil recovery. By comparing water and BS flooding results, it is obvious that all BS solutions have a positive effect on oil recovery.
The breakthrough time of water flooding is very low, almost 0.18 injected fluid pore volume, but using rhamnolipid concentration of 120 ppm delays the breakthrough time to an injected pore volume of 0.4 with 38% oil recovery at this point. Considerably enough, in the case of water flooding, the final oil recovery is equal to that at the breakthrough time and no more oil is extracted after the breakthrough time. However, upon the injection of the BS solution as a displacing fluid, the final oil recovery (43%) was a little more than that at the breakthrough time (38%), indicating that even more oil was extracted after the breakthrough time and the final oil recovery factor was improved. Briefly speaking, considering Fig. 12, the impressive role of the produced BS in oil recovery enhancement is highlighted. For extra heavy crude oil, the obtained result showed 28% ultimate oil recovery that is lower than corresponding test with the first crude oil sample (43%). Since new crude oil sample (API of 15) is heavier than the first one (API of 19.5), therefore lower oil recovery was achieved in this experiment. It means that less area of micromodel was swept by BS solution and less amount of oil was extracted. Obtained oil recovery for extra heavy crude oil (28%) is also lower than 34% oil recovery by 50 ppm BS solution for heavy crude oil. For this reason MEOR methods usually are not applied for reservoirs with extra heavy crude oil and thermal methods are one of the most conventional choices for these reservoirs. The results of flooding tests are summarized in Table 5.
Results of micromodel flooding tests.
| Factor | Distilled water | BS solution (ppm) | |||
|---|---|---|---|---|---|
| Crude oil API = 15 | Crude oil API = 19.5 | ||||
| 120 | 50 | 80 | 120 | ||
| BT time (PV) | 0.18 | 0.26 | 0.29 | 0.37 | 0.4 |
| BT time (minute) | 51 | 69 | 77 | 98 | 106 |
| Oil recovery at BT time (%) | 16 | 27 | 31 | 36 | 38 |
| Ultimate oil recovery (%) | 16 | 28 | 34 | 38 | 43 |
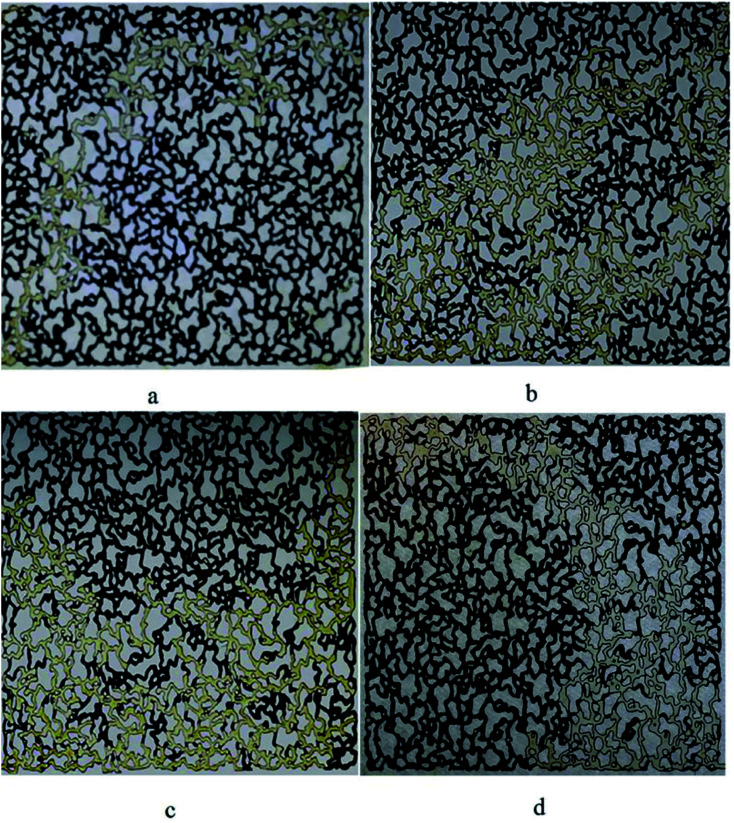
The difference in the ultimate oil recovery of the flooding tests is illustrated macroscopically in Fig. 13. All the pictures demonstrate the flow pattern at about one pore volume of the injected fluid.
Fig. 13. Oil displacement (a) water flooding (b) BS solution flooding (50 ppm) (c) BS solution flooding (120 ppm) and (d) BS solution flooding (120 ppm) with extra heavy crude oil (API = 15).
As it is clearly observed in Fig. 13(a), the injected water contacts with a small volume of the trapped oil. Therefore, the ultimate oil recovery is not noticeable. When a 50 ppm BS solution was injected into the micromodel, Fig. 13(b), the fluid got in touch with more oil to better sweep the oil and the ultimate oil recovery increased dramatically to 34%, compared to 16% for water flooding. Increasing the BS concentration to 120 ppm caused the injected fluid to come in contact with more volume of trapped oil, as observed in Fig. 13(c) and the final oil recovery was increased. As it is obvious in Fig. 13(d), less area has been swept by injected solution comparing to Fig. 13(b) and (c), and lower oil recovery factor is obtained.
For mechanistic investigation, several microscopic pictures were taken to study the effect of BS solution on wettability alteration of the porous medium. Additionally, viscosity and IFT tests were performed. The results of IFT, viscosity and contact angle tests are summarized in Table 6.
Results of oil recovery tests.
| Factor | BS solution (ppm) | ||
|---|---|---|---|
| 50 | 80 | 120 | |
| Initial contact angle (°) | 119 | 112 | 106 |
| Final contact angle (°) | 21 | 15 | 7 |
| Contact angle change (%) | 82.3 | 86.6 | 93.4 |
| Viscosity (cP) | 1.3 | 1.5 | 1.8 |
| Viscosity change (%) | 30 | 50 | 80 |
| IFT (mN m−1) | 6.36 | 4.05 | 2.52 |
| IFT change | 77 | 85 | 91 |
| Capillary number (×104) | 1.05 | 1.98 | 3.81 |
| Capillary number ratio (compared to water flooding) | 5.53 | 10.42 | 20.05 |
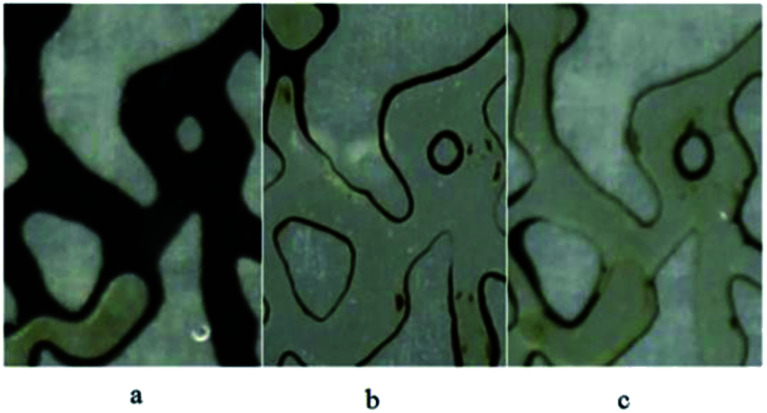
To study the effect of BS solution on wettability alteration, several microscopic pictures were taken (Fig. 14), indicating the injected fluid behavior in the porous medium after 1 pore volume injection. As it is obvious in Fig. 14(a), most of oil (API = 19.5) is unswept and the thickness of the oil layer in the wall is considerable, which is attributed to the oil-wet property of the medium. Briefly speaking, water could not change the wettability of the walls and throats to more water wet conditions. Fig. 14(b) and (c) show the distribution of the oil and injected BS solution fluid in the micromodel. As it is clear, most of the oil is swept and the thickness of the remaining oil layer decreased noticeably; especially in Fig. 14(c), which corresponds the injection of 120 ppm BS solution. This can be considered as one of the reasons for more oil recovery compared to water flooding. Fig. 14(b) and (c) show the high capability of rhamnolipid to change the wettability from oil wet to water wet condition.
Fig. 14. Wettability alteration of medium after injection of (a) distilled water (b) BS solution (50 ppm) (c) BS solution (120 ppm).
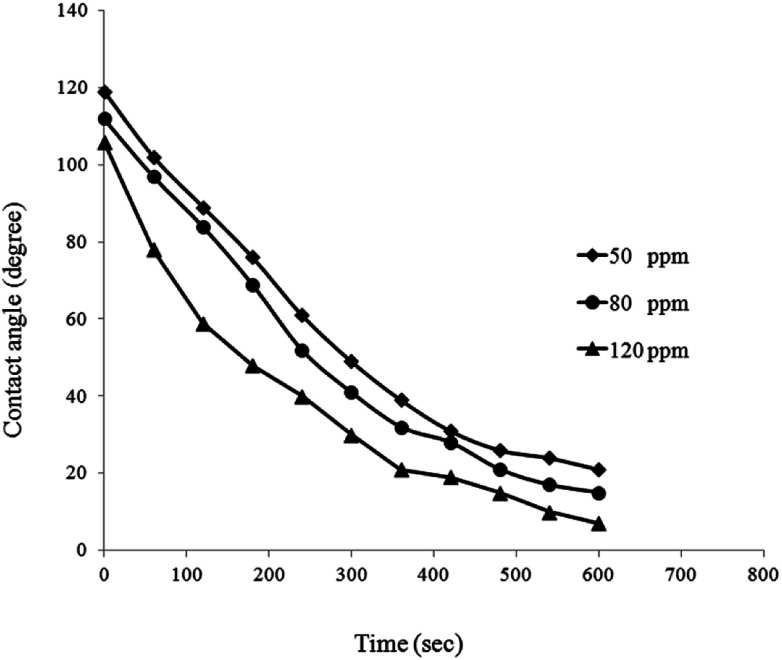
For better evaluation of BS effect on wettability alteration of the porous medium, measured contact angle values are plotted versus time (Fig. 15). As it can be seen, a similar trend is observed in contact angle reduction of all BS solutions. Contact angle values just after putting the droplet on the surface, proves that the glass surface is oil wet. For all of BS solutions contact angle decreased to a low value within a small period of time resulting alteration of oil wet state to strongly water wet state (Fig. 16), especially for 120 ppm concentration that the droplet almost totally spread out on the glass surface (final contact angle of 7°), confirms very strong water wet surface.
Fig. 15. Effect of BS solutions on contact angle of an oil-wet quartz surface.
Fig. 16. Contact angle measurement on the glass surface for BS solution (left) 50 ppm and (right) 120 ppm.
Al-Sulaimani et al.30 produced surfactin type BS from Bacillus subtilis W19 isolated from oil contaminated samples. Their researches showed that 0.25% (w/v) BS solution altered the wettability of the surface from oil wet to water wet by decreasing contact angle from 70.6° to 25.32°. Datta et al.31 reported the reduction of contact angle from 69.6° to 28.63 by BS solution. Comparing obtained results with other mentioned data clearly proves that produced rhamnolipid has a great ability to change the wettability of glass surface to strongly water wet state. The reason behind of this fact is the hydrophobic interactions between the tails of BS and adsorbed organic components of crude oil on the surface of porous medium.11
The viscosity values of the injected fluids are given in Table 6. The mobility ratio is defined as the mobility of the injected fluid to that of the displaced oil. Lower viscosity of the injected fluid will lead to poor mobility control and result in low oil recoveries. As observed, the viscosity of the solution increases with increasing BS concentration, resulting better mobility ratio.
The measured IFT values are also given in Table 6. As it can be observed, IFT value of 27.1 mN m−1 was measured between crude oil and distilled water, but low IFT value of 2.52 mN m−1 was obtained for 120 ppm BS solution. With increasing BS concentration in the solution, more BS molecules adsorb at the oil–aqueous phase interface and lower the IFT until reaching a minimum value at CMC point. The polarity of BS head group is strongly depends on the molecular structure. Presence of components such as oxygen and hydroxyl groups increases the head group polarity of the surfactants that will lead to significant interaction with water molecules. A carboxylate group along with several hydroxyl group present in the structure of produced rhamnolipid, make it high polar to have strong interactions with water molecules. Additionally, heteroatoms such as oxygen are dominant in acidic components present in crude oil. Crude oils with TAN value more than 0.5 mg KOH per g oil are considered as acidic crude oils.32 Thus, crude oil sample used in this research with TAN value of 0.46 mg KOH per g oil is classified nearly as an acidic type. As a result, low IFT values were reached due to good synergistic effect between BS and crude oil. For better evaluation, IFT values obtained in this research are compared with the data reported in the literature (Table 7).
IFT values of different BS.
IFT plays a key role in oil recovery. High IFT value between water and oil leads to high capillary forces, which hold the oil in the porous medium and prevent it from flowing, and thereby ultimate oil recovery remains low. The ratio of viscous to capillary forces is defined as dimensionless capillary number:35
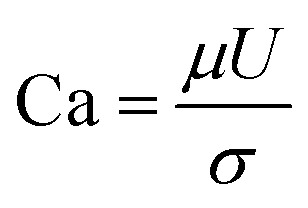 |
2 |
where U and μ are the velocity and viscosity of the injected fluid, respectively. σ is the IFT between injected fluid and the crude oil. Referring to Table 6, the ratio of capillary number in BS flooding to water flooding is 5.53 and 20.05 for BS solution of 50 ppm and 120 ppm, respectively. This proves the great effect of BS on lowering capillary forces. The capillary number value is related to the amount of residual oil trapped in the porous medium after flooding.
BS solution flooding decreases the IFT between two phases, results in lower capillary forces in pores and throats. Therefore, the capillary number increases which in turn reduces the residual oil saturation and ultimate oil recovery will be increased.
The obtained data from the micromodel tests indicate that the produced BS is efficient in oil displacement and considering its stability in harsh conditions, it can be considered as a good alternative for MEOR application.
4. Conclusion
The produced BS was found to be of the rhamnolipid type after structure analysis by TLC, FTIR and NMR analysis. It showed significant stability under extreme conditions of temperature (40–121 °C), pH (3–10) and salinity up to 10% (w/v), which is very important in enhanced oil recovery applications. Its surface activity was determined by measurement of surface tension, CMC and the emulsification index (E24). The CMC for the BS was 120 ppm, which corresponded to a surface tension of 28.1 mN m−1. The CCD confirmed the optimal growth conditions for the microorganism to maximize BS yield. Interpretation of results as a modified model and 2D plots demonstrated that the microorganism is very sensitive to salinity during BS production. The maximum BS yield was recorded at very low salinity. The model was found to be suitable for describing the response of the system as the experimental data was in good conformity with the values predicted by the model. The R2 (0.9587) and p-value (<0.0001) of the model were significant. The model was validated by a confirmation test at the predicted optimum points. The value predicted by the model (1.94 g L−1) was compared with the experimental value (2.07 g L−1) and showed about 8% deviation. The oil recovery activity of the produced BS was studied in comparison with water. The results proved that BS solutions acted impressively in flooding experiments. In case of BS solution injections, injected fluid contacted with more trapped oil and more oil was extracted comparing with water flooding test. Also the ultimate oil recovery increased at higher concentrations of BS solution and more pore volume of fluid was injected to reach this final recovery. Ultimate recovery obtained with water and BS concentration of 120 ppm, as CMC point, were 16% and 43%, respectively. Contact angle measurements confirmed the wettability alteration of glass surface from oil wet to strongly water wet state. IFT reduction, wettability alteration towards water wet condition and improving the mobility ratio considered as the mechanisms for increasing oil recovery. Good stability in harsh conditions and obtained results from micromodel experiments indicated that the rhamnolipid produced by the native strain of Pseudomonas aeruginosa HAK01 has a good capability for MEOR applications.
Conflicts of interest
There are no conflicts to declare.
Supplementary Material
References
- Bazsefidpar S. Mokhtarani B. Panahi R. Hajfarajollah H. Overproduction of rhamnolipid by fed-batch cultivation of Pseudomonas aeruginosa in a lab-scale fermenter under tight DO control. Biodegradation. 2019;30:59–69. doi: 10.1007/s10532-018-09866-3. [DOI] [PubMed] [Google Scholar]
- Deepika K. V. Kalam S. Sridhar P. R. Podile A. R. Bramhachari P. V. Optimization of rhamnolipid biosurfactant production by mangrove sediment bacterium Pseudomonas aeruginosa KVD-HR42 using response surface methodology. Biocatal. Agric. Biotechnol. 2016;5:38–47. doi: 10.1016/j.bcab.2015.11.006. [DOI] [Google Scholar]
- Hajfarajollah H. Mehvari S. Habibian M. Mokhtarani B. Noghabi K. A. Rhamnolipid biosurfactant adsorption on a plasma-treated polypropylene surface to induce antimicrobial and antiadhesive properties. RSC Adv. 2015;5:33089–33097. doi: 10.1039/C5RA01233C. [DOI] [Google Scholar]
- Anvari S. Hajfarajollah H. Mokhtarani B. Noghabi K. A. Physiochemical and thermodynamic characterization of lipopeptide biosurfactant secreted by Bacillus tequilensis HK01. RSC Adv. 2015;5:91836–91845. doi: 10.1039/C5RA17275F. [DOI] [Google Scholar]
- Geetha S. J. Banat I. M. Joshi S. J. Biosurfactants: production and potential applications in microbial enhanced oil recovery (MEOR) Biocatal. Agric. Biotechnol. 2018;14:23–32. doi: 10.1016/j.bcab.2018.01.010. [DOI] [Google Scholar]
- Rikalović M. G. Vrvić M. M. Karadžić I. M. Rhamnolipid biosurfactant from Pseudomonas aeruginosa, from discovery to application in contemporary technology. J. Serb. Chem. Soc. 2015;80:279–304. doi: 10.2298/JSC140627096R. [DOI] [Google Scholar]
- Moslemizadeh A. Shirmardi Dezaki A. Shadizadeh S. R. Mechanistic understanding of chemical flooding in swelling porous media using a bio-based nonionic surfactant. J. Mol. Liq. 2017;229:76–88. doi: 10.1016/j.molliq.2016.12.036. [DOI] [Google Scholar]
- Varjani S. J. Upasani V. N. Carbon spectrum utilization by an indigenous strain of Pseudomonas aeruginosa NCIM 5514: production, characterization and surface active properties of biosurfactant. Bioresour. Technol. 2016;221:510–516. doi: 10.1016/j.biortech.2016.09.080. [DOI] [PubMed] [Google Scholar]
- Mukherjee S. Das P. Sen R. Towards commercial production of microbial surfactants. Trends Biotechnol. 2006;24(11):509–515. doi: 10.1016/j.tibtech.2006.09.005. [DOI] [PubMed] [Google Scholar]
- Al-Bahry S. N. Al-Wahaibi Y. M. Elshafie A. E. Al-Bemani A. S. Joshi S. J. Al-Makhmari H. S. Al-Sulaimani H. S. Biosurfactant production by Bacillus subtilis B20 using date molasses and its possible application in enhanced oil recovery. Int. Biodeterior. Biodegrad. 2013;81:141–146. doi: 10.1016/j.ibiod.2012.01.006. [DOI] [Google Scholar]
- Al-Wahaibi Y. Joshi S. Al-Bahry S. Elshafie A. Al-Bemani A. Shibulal B. Biosurfactant production by Bacillus subtilis B30 and its application in enhancing oil recovery. Colloids Surf., B. 2014;114:324–333. doi: 10.1016/j.colsurfb.2013.09.022. [DOI] [PubMed] [Google Scholar]
- Souayeh M., Al-Wahaibi Y., Al-Bahry S., Elshafie A., Al-Bemani A., Joshi S., Al-Hashmi A. and Mandhari M., Microbial Enhanced Oil Recovery at High Salinities using Biosurfactant at lower concentrations, SPE-169676-MS, 2014 [Google Scholar]
- Torres L. Moctezuma A. Avendaño J. R. Muñoz A. Gracida J. Comparison of bio- and synthetic surfactants for EOR. J. Pet. Sci. Eng. 2011;76:6–11. doi: 10.1016/j.petrol.2010.11.022. [DOI] [Google Scholar]
- Hemlata B. Selvin J. Tukaram K. Optimization of iron chelating biosurfactant production by Stenotrophomonas maltophilia NBS-11. Biocatal. Agric. Biotechnol. 2015;4:135–143. doi: 10.1016/j.bcab.2015.02.002. [DOI] [Google Scholar]
- Jain R. M. Mody K. Joshi N. Mishra A. Jha B. Effect of unconventional carbon sources on biosurfactant production and its application in bioremediation. Int. J. Biol. Macromol. 2013;62:52–58. doi: 10.1016/j.ijbiomac.2013.08.030. [DOI] [PubMed] [Google Scholar]
- Sharafi H. Abdoli M. Hajfarajollah H. et al., First Report of a Lipopeptide Biosurfactant from Thermophilic Bacterium Aneurinibacillus thermoaerophilus MK01 Newly Isolated from Municipal Landfill Site. Appl. Biochem. Biotechnol. 2014;173(5):1236–1249. doi: 10.1007/s12010-014-0928-9. [DOI] [PubMed] [Google Scholar]
- Hajfarajollah H. Mokhtarani B. Noghabi K. A. Newly antibacterial and antiadhesive lipopeptide biosurfactant secreted by a probiotic strain, Propionibacterium freudenreichii. Appl. Biochem. Biotechnol. 2014;174:2725–2740. doi: 10.1007/s12010-014-1221-7. [DOI] [PubMed] [Google Scholar]
- Youssef N. H. Duncan K. E. Nagle D. P. Savage K. N. Knapp R. M. McInerney M. J. Comparison of methods to detect biosurfactant production by diverse microorganisms. J. Microbiol. Methods. 2004;56:339–347. doi: 10.1016/j.mimet.2003.11.001. [DOI] [PubMed] [Google Scholar]
- Morikawa M. Hirata Y. Imanaka T. A study on the structure-function relationship of lipopeptide biosurfactants. Biochim. Biophys. Acta. 2000;1488:211–218. doi: 10.1016/S1388-1981(00)00124-4. [DOI] [PubMed] [Google Scholar]
- Banat I. M. Makkar R. S. Cameotra S. S. Potential commercial applications of microbial surfactants. Appl. Microbiol. Biotechnol. 2000;53(5):495–508. doi: 10.1007/s002530051648. [DOI] [PubMed] [Google Scholar]
- Cooper D. G. Goldenberg B. G. Surface-Active Agents from Two Bacillus Species. Appl. Environ. Microbiol. 1987;53(2):224–229. doi: 10.1128/aem.53.2.224-229.1987. [DOI] [PMC free article] [PubMed] [Google Scholar]
- Najafi A. R. Rahimpour M. R. Jahanmiri A. H. Roostaazad R. Arabian D. Soleimani M. Jamshidnejad Z. Interactive optimization of biosurfactant production by Paenibacillus alvei ARN63 isolated from an Iranian oil well. Colloids Surf., B. 2011;82:33–39. doi: 10.1016/j.colsurfb.2010.08.010. [DOI] [PubMed] [Google Scholar]
- Emami Meybodi H. Kharrat R. Nasehi Araghi M. Experimental Studying of Pore Morphology and Wettability Effects on Microscopic and Macroscopic Displacement Efficiency of Polymer Flooding. J. Pet. Sci. Eng. 2011;78:347–363. doi: 10.1016/j.petrol.2011.07.004. [DOI] [Google Scholar]
- Mohammadi S. Masihi M. Ghazanfari M. H. Characterizing the role of shale geometry and connate water saturation on performance of polymer flooding in heavy oil Reservoirs: experimental observations and numerical simulations. Transp. Porous Media. 2012;91:973–998. doi: 10.1007/s11242-011-9886-7. [DOI] [Google Scholar]
- Abbasi H. Hamedi M. M. Lotfabad T. B. Zahiri H. S. Sharafi H. Masoomi F. Moosavi-Movahedi A. A. Ortiz A. Amanlou M. Noghabi K. A. Biosurfactant-producing bacterium, Pseudomonas aeruginosa MA01 isolated from spoiled apples: physicochemical and structural characteristics of isolated biosurfactant. J. Biosci. Bioeng. 2012;113(2):211–219. doi: 10.1016/j.jbiosc.2011.10.002. [DOI] [PubMed] [Google Scholar]
- Reddy K. S. Yahya Khan M. Archana K. Reddy M. G. Hameeda B. Utilization of mango kernel oil for the rhamnolipid production by Pseudomonas aeruginosa DR1 towards its application as biocontrol agent. Bioresour. Technol. 2016;221:291–299. doi: 10.1016/j.biortech.2016.09.041. [DOI] [PubMed] [Google Scholar]
- Sharma R. Singh J. Verma N. Optimization of rhamnolipid production from Pseudomonas aeruginosa PBS towards application for microbial enhanced oil recovery. 3 Biotech. 2018;8:20–34. doi: 10.1007/s13205-017-1022-0. [DOI] [PMC free article] [PubMed] [Google Scholar]
- Liu Q. Lin J. Wang W. Huang H. Li S. Production of surfactin isoforms by Bacillus subtilis BS-37 and its applicability to enhanced oil recovery under laboratory conditions. Biochem. Eng. J. 2015;93:31–37. doi: 10.1016/j.bej.2014.08.023. [DOI] [Google Scholar]
- Zargartalebi M. Barati N. Kharrat R. Influences of hydrophilic and hydrophobic silica nanoparticles on anionic surfactant properties: Interfacial and adsorption behaviors. J. Pet. Sci. Eng. 2014;119:36–43. doi: 10.1016/j.petrol.2014.04.010. [DOI] [Google Scholar]
- Al-Sulaimani H. Al-Wahaibi Y. Al-Bahry S. N. Elshafie A. Al-Bemani A. Joshi S. Ayatollahi S. Residual Oil Recovery via Injection of Biosurfactant, Chemical Surfactant and Mixtures of both under Reservoir Condition: Induced Wettability and Interfacial Tension Effects. SPE Reservoir Eval. Eng. 2012;15:210–217. doi: 10.2118/158022-PA. [DOI] [Google Scholar]
- Datta P. Tiwari P. Pandey L. M. Isolation and Characterization of Biosurfactant Producing and Oil Degrading Bacillus subtilis MG495086 from Formation Water of Assam Oil Reservoir and Its Suitability for Enhanced Oil Recovery. Bioresour. Technol. 2018;270:439–448. doi: 10.1016/j.biortech.2018.09.047. [DOI] [PubMed] [Google Scholar]
- Hajibagheri F. Hashemi A. Lashkarbolooki M. Ayatollahi S. Investigating the synergic effects of chemical surfactant (SDBS) and biosurfactant produced by bacterium (Enterobacter cloacae) on IFT reduction and wettability alteration during MEOR process. J. Mol. Liq. 2018;256:277–285. doi: 10.1016/j.molliq.2018.02.020. [DOI] [Google Scholar]
- Zhao F. Shi R. Zhao J. Li G. Bai X. Han S. Zhang Y. Heterologous production of Pseudomonas aeruginosa rhamnolipid under anaerobic conditions for microbial enhanced oil recovery. J. Appl. Microbiol. 2015;118:379–389. doi: 10.1111/jam.12698. [DOI] [PubMed] [Google Scholar]
- Amani H. Study of enhanced oil recovery by rhamnolipids in a homogeneous 2D micromodel. J. Pet. Sci. Eng. 2015;128:212–219. doi: 10.1016/j.petrol.2015.02.030. [DOI] [Google Scholar]
- Howe A. M. Clarke A. Mitchell J. Staniland J. Hawkes L. Whalan C. Visualising surfactant enhanced oil recovery. Colloids Surf., A. 2015;480:449–461. doi: 10.1016/j.colsurfa.2014.08.032. [DOI] [Google Scholar]


