Abstract
Quartz crystal microbalance (QCM), surface acoustic wave (SAW)-Rayleigh and ZnO based SAW-Love sensors were fabricated and their sensitivity was comparatively analyzed for the quantification of Staphylococcus aureus (S. aureus). The SAW based sensors showed response magnitudes up to three times greater than that of the QCM sensor for the same mass loading of S. aureus. The ZnO nanoparticle-based SAW-Love sensor has a maximum mass loading sensitivity of 328.75 Hz ng−1. The SAW-Love sensor achieved a lower limit of detection of 2 × 10³ CFU mL−1 compared to the QCM counterpart (2 × 10⁵ to 2 × 10⁶ CFU mL−1) under the same conditions. The SAW-Love sensor could be used as a disposable chip in micro or ultra-trace accurate diagnosis methods.
Quartz crystal microbalance (QCM), surface acoustic wave (SAW)-Rayleigh and ZnO based SAW-Love sensors were fabricated and their sensitivity was comparatively analyzed for the quantification of Staphylococcus aureus (S. aureus).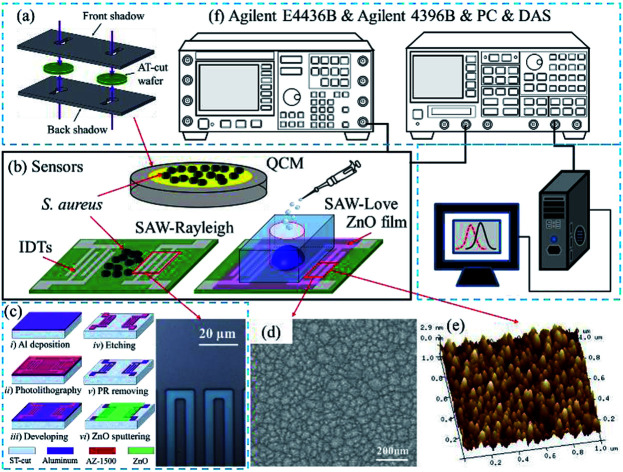
Staphylococcus aureus (S. aureus) is a common human pathogenic bacteria that has a strong potential to cause food poisoning and can cause a wide variety of diseases and infections in humans such as abscesses, pneumonia, meningitis, endocarditis and septicaemia.1–5 Infections caused by this bacteria are contagious and have emerged as being some of the most infectious worldwide.6,7 According to a report by the National Institutes of Health and the Center of Disease Control and Prevention in the United States, S. aureus infects 500 000 people yearly and can cause irreparable damage.4 Currently, S. aureus can be specifically identified by traditional microbiological laboratory procedures. Traditional and standard protocols for the detection and determination of bacteria are normally based on culture and plate counting of the colony,8 the polymerase chain reaction,9,10 ligase chain reaction,11 biochemical and metabolic tests,12 ELISA,13 and so forth. Although these methods are specific and sensitive, the limitations of the high costs, time consuming procedures, expensive laboratory facilities and complex procedures obstructs widespread use of these technologies for clinical diagnosis. Therefore, it is important to develop rapid, simple, low-cost, non-labor intensive and techniques for the detection of pathogenic bacteria to replace these traditional approaches.14,15 Biosensing technology is a rapid and reproducible approach for the detection of pathogens (S. aureus) or toxins and other biomolecules.16,17 Techniques such as surface plasmon resonance (SPR),18 fluorescence,19 quartz crystal microbalance (QCM) with dissipation tracking (QCM-D)14 and electrochemical20 methods have been developed for rapid detection of the S. aureus pathogen. Recently, numerous aptasensors21 have been developed with integrated nano-materials such as graphene oxide (GO), carbon nanotubes (CNTs), gold nanoparticles (AuNPs), and silver nanoparticles (AgNPs). Another novel technique, the surface acoustic wave (SAW) sensor was also developed and has attracted a significant amount of attention in the physical, chemical and biological fields owing to its high sensitivity and lower limit of detection (LoD).22 Current reports have mainly focused on investigating the sensing of bacteria and the sensitive mechanism that is based on organic polymers or a biofunctional group.23,24 However, a few studies have reported SAW sensors based on an inorganic metal oxide sensitive layer that have been used for detection of the S. aureus pathogen.
In the present preliminary study, we fabricated QCM, SAW-Rayleigh and ZnO nanoparticle-based SAW-Love sensors for sensing of the S. aureus pathogen and then comparatively evaluated the sensitivity. The ZnO nanoparticles layer was deposited on top of a SAW chip surface by radio-frequency magnetron sputtering. The sensing performance of the ZnO nanoparticle-based SAW-Love sensor was characterized, and good experimental results were obtained.
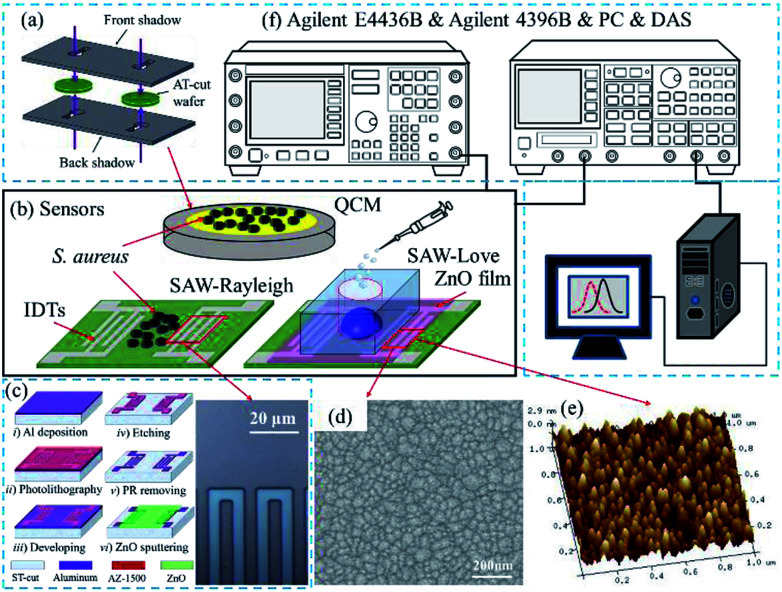
The SAW sensors were fabricated on a ST-cut quartz (42.75°) substrate and an Al thin film with a thickness of 100 nm was evaporated to form the interdigital transducer (IDT) electrodes. The IDT electrodes (Fig. 1c), which had a width of 5 μm were patterned using photo-lithography and wet-etching processes. The transmitting and receiving interdigital transducers (IDTs) consisted of 100 finger pairs with an aperture of 90λ, and the IDT center-to-center separation was 125λ. To fabricate the SAW-Love sensor, a ZnO thin film was deposited on top of the sensor surface by magnetron sputtering. The microstructure and surface morphology of the ZnO film was characterized with scanning electron microscopy (SEM) (Fig. 1d) and atomic force microscopy (AFM) (Fig. 1e), respectively. According to the SEM and AFM images, the ZnO surface presented a uniform granular structure. The particle size was about 30–40 nm, which is conducive to the sensitive adsorption of the measured substance. In order to maintain a minor resonant frequency drop and the excellent nanoparticles surface of the SAW-Love sensors, the prepared ZnO sensitive layer was controlled within a thickness of ∼1 μm.
Fig. 1. (a) QCM sensor fabrication. (b) QCM, SAW-Rayleigh and SAW-Love sensors. (c) Image of the IDTs for the fabricated SAW sensor. (d) SEM image of the ZnO film. (e) AFM image of the ZnO film. (f) Schematic diagram of the experimental setup.
In addition, the polydimethylsiloxane (PDMS) materials were packaged onto the ZnO surface for aqueous diagnostics. To fabricate the QCM sensor, a 100 nm thick Au film with a 2 nm Cr adhesion film was sputtered onto both sides of an AT-cut quartz substrate, which had a thickness of 167 μm and diameter of 14 mm. The circular electrodes of the QCM (Ø = 5.1 mm) were patterned using two baffle-plate masks as shown in Fig. 1a. The SAW-Rayleigh and SAW-Love sensors demonstrated resonance frequencies of approximately 157 and 155.9 MHz, respectively. On the other hand, the resonance frequency of the QCM sensor was around 9.95 MHz.
The sensing surface was purged with dry N2 before testing. The resonant frequency of the sensors with pure water was measured as a reference. S. aureus samples with concentrations ranging from 2 × 10³ to 2 × 10⁹ CFU mL−1 were added dropwise (per microliter) onto each sensitive area. For both the QCM and Rayleigh sensors, S. aureus staked-contacts with the QCM gold layer and the Rayleigh delay-line surfaces, respectively. For the Love wave sensors, adhesion or chemical bonding was found to exist between the surface proteins on S. aureus and the surface of the ZnO nanoparticles. The absolute mass sensitivities and relative sensitivities were then studied. The frequency spectra were measured after the liquid had been completely evaporated. Finally, a frequency spectrum analyzer (Agilent 4396B) was used to obtain the frequency signal (Fig. 1f) by stimulation of a signal generator (Agilent E4436B). The frequency changes can be calculated using a PC and a data acquisition system.
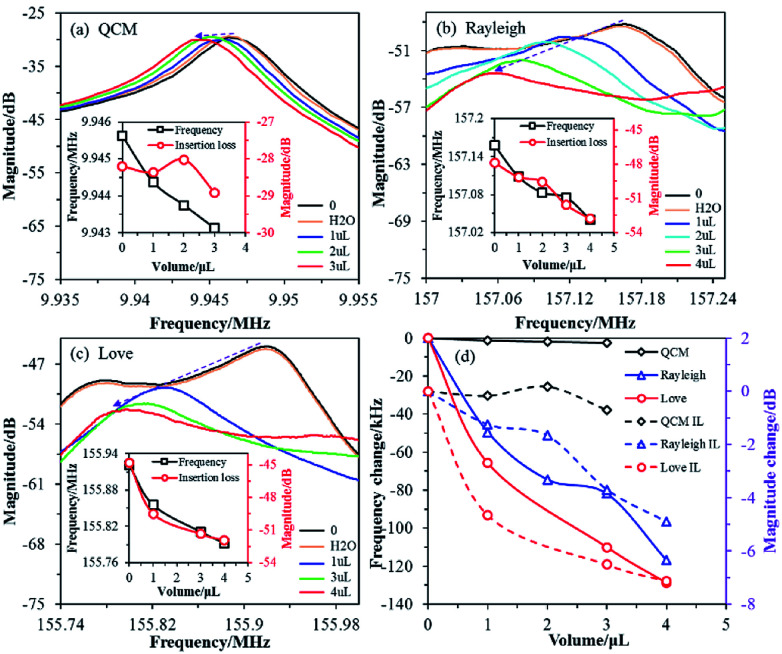
The QCM sensor was used to test three samples (2 × 10⁹ CFU mL−1 of S. aureus with different volumes: 1, 2 and 3 μL) and the results are shown in Fig. 2a. The initial resonant frequency value of the QCM sensor was 9.945625 MHz, and the resonant frequency values corresponding to the three volume parameters were 9.944375, 9.943750, and 9.943125 MHz, respectively. The corresponding resonant frequency changes were about 1.25, 1.875 and 2.5 kHz, respectively. The resonant frequency of the QCM decreases with an increasing sample volume (equivalent to increasing the mass of S. aureus), and the corresponding insertion loss does not change significantly.
Fig. 2. Frequency response magnitude for the sensors with differing amounts of S. aureus mass loading. (a) QCM. (b) SAW-Rayleigh. (c) SAW-Love. (d) Comparison of the frequency change for the three sensors.
The initial resonant frequency value of the SAW-Rayleigh sensor was 157.157500 MHz, and the resonant frequency values corresponding to 1, 2, 3 and 4 μL of 2 × 10⁹ CFU mL−1S. aureus were 157.108125, 157.083125, 157.075625, 157.040625 MHz, respectively, as shown in Fig. 2b. The corresponding frequency changes were 49.375, 74.375, 81.875 and 116.875 kHz, respectively. If the loading of S. aureus is increased, the resonant frequency of the Rayleigh wave decreases dramatically, and the corresponding amplitude gradually decreases. For the SAW-Love sensor in particular, the initial resonant frequency was measured at 155.921250 MHz. The responding magnitudes of the SAW-Love sensor varied between 65.75 and 128.75 kHz with S. aureus loading from 1 to 4 μL, as shown in Fig. 2c. As the sample volume increases, the resonant frequency of the SAW-Love wave gradually decreases, and the corresponding amplitude shows a further decreasing trend compared to that of the SAW-Rayleigh sensor.
Obviously, under the same sample conditions, the resonance frequency variation for the QCM sensor was much smaller than for the SAW-Rayleigh and SAW-Love wave sensors (Fig. 2d). One of main reasons for the trend observed between the QCM and SAW sensors was the operating frequency of the QCM based sensor was far less than for the SAW sensors. The QCM and SAW sensors have different acoustic propagation modes, the former is a vertical buck-wave mode, while the latter demonstrates a surface acoustic wave. The concept of QCM diagnosis using microspheres has been proven previously,25,26 however, the higher sensitivity of SAW based sensors is required for the detection of nano-scaled species (i.e., viruses or proteins). In addition, the attenuation of the insertion loss corresponding to the resonance frequency measured using the SAW-Love wave sensor under different loadings of S. aureus was larger than that measured for the SAW-Rayleigh, therefore it can be inferred that this result is closely related to differences in the structure and acoustic wave propagation modes.27 The tested results also proved that the SAW-Love wave sensor has a relatively good detection performance. The Love wave is a kind of SAW which propagates in a layered structure. This is different from the commonly used Rayleigh type SAW device, as the performance of a Love wave device depends on the guiding layer, rather than on the IDT and substrate characteristics. For a ZnO/ST-quartz sensor, the concentrated SAW (shear horizontal wave) retains a lower phase velocity in the ZnO guiding layer while the intrinsic Rayleigh wave maintains a faster propagation velocity in the substrate.28–30 A suitable ZnO guiding layer is the key to implementing a SAW-Love wave sensor with a high mass sensitivity.
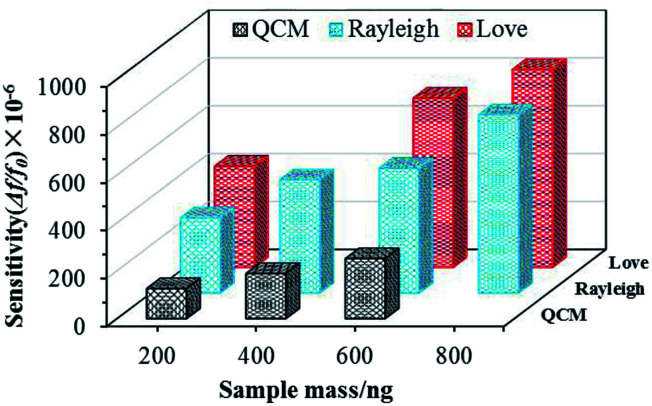
The mass sensitivity of a sensor can be defined as the frequency shift variation due to the mass (Δf/Δm). The amount of S. aureus in 1 μL was 2 × 10⁶, and the corresponding mass per microliter can be calculated as 200 ng. The respective sensitivity values were therefore obtained and was found to be approximately 328.75, 246.88 and 6.25 Hz ng−1 for the SAW-Love, SAW-Rayleigh and QCM sensors respectively. Fig. 3 shows the relative sensitivities (Δf/f0) for different mass loadings. Obviously, the sensitivity of the SAW-Love and SAW-Rayleigh sensors was much higher than that observed for the QCM. Overall, the SAW based sensors had a S. aureus mass loading sensitivity that was up to 30–50 times higher than that observed for the QCM counterpart. The relatively higher operating frequencies of the SAW based sensors enable their greater sensitivity towards the same amount of adsorbed analytes compared to the QCM counterpart. Furthermore, the confinement of more energy on the surface of the substrate, rather than in the bulk, makes the SAW based sensors more sensitive to any surface perturbations.31
Fig. 3. Comparison of the quantification mass sensitivity for S. aureus using three sensors.
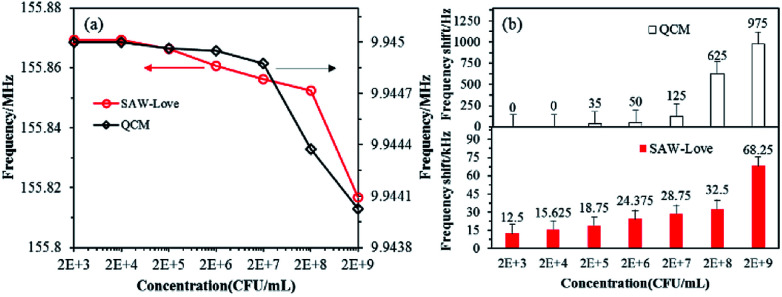
Further studies were carried out to comparatively analyze the LoD performance obtained from the developed QCM and ZnO nanoparticles-based SAW-Love sensors. The tendency for resonant frequency variation for the biosensors operating at various concentrations from 2 × 10³ to 2 × 10⁹ CFU mL−1 can be observed in Fig. 4a.
Fig. 4. QCM and SAW-Love sensors were used to quantify different concentrations of S. aureus samples. (a) Operating frequency response. (b) Comparison of frequency change for the two sensors.
The QCM sensor demonstrated a response to the sample at a higher concentration range of 2 × 10⁸ to 2 × 10⁹ CFU mL−1, while the SAW-Love wave sensor showed a sensitive response at a lower concentration range of 2 × 10³ CFU mL−1. It can easily be seen in Fig. 4b that the SAW-Love wave sensor has a significant detection limit of more than 12 kHz at 2 × 10³ CFU mL−1, while the QCM sensor had a detection limit of only 35 Hz at 2 × 10⁵ CFU mL−1. The SAW-Love sensor demonstrated a detection limit that was approximately five orders of magnitude lower for S. aureus concentration compared to that of the QCM sensor. The experimental results further confirmed that the QCM design limits its quantification sensitivity in a liquid media environment or lower concentrations of the species to be measured due to the intrinsic resonance frequency. The SAW-Love wave sensor has a high operating frequency and the higher sensitivity demonstrated for the measured substances in trace analysis indicates a great potential for application in biosensing.
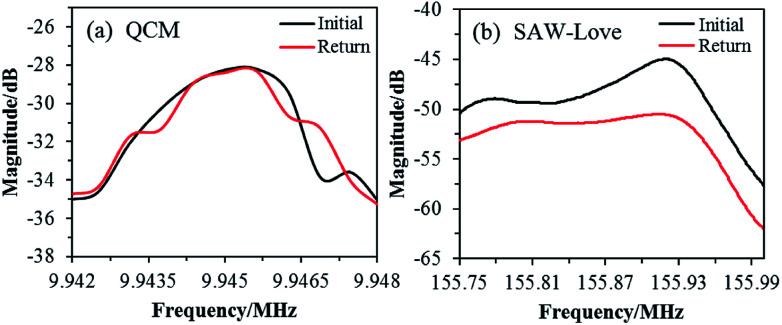
The recovery performance of the QCM and SAW-Love wave sensors was studied after diagnosis. Sensing chips were rinsed with aqueous ethanol (30%) for 3 min, soaked in pure water for 1 min, and then purged using dry N2 for 3 min. The resonant frequency spectra were measured for both and are shown in Fig. 5.
Fig. 5. Recovery characteristics of the operating frequency spectrum for the (a) QCM and (b) SAW-Love sensors.
The resonant frequency spectrum of the QCM sensor can be restored to the initial state after the cleaning treatment. However, the frequency spectrum of the SAW-Love sensor was different from the initial curve and this shows that it cannot be completely recovered. The main reason for the opposite recovery behaviors exhibited by the QCM and SAW-Love sensors is the different surface substrates. The contact electrode layer of the QCM sensor is a gold film (detection area), which does not have a sufficient adsorption and/or interaction with S. aureus. However, the ZnO nanoparticle sensitive membrane on the SAW sensor is in direct contact with S. aureus, and the nano-structures of ZnO can facilitate the adsorption of S. aureus, leading to incomplete desorption. In addition, it is easy to form physical and/or chemical adsorption between ZnO and microorganisms, which is not conducive to complete desorption. Although the frequency spectrum of the ZnO nanoparticle-based SAW-Love sensor was difficult to recover owing to its highly sensitive surface of a SAW delay line, SAW-Love chips can be used as disposable chips for nano or ultra-trace species diagnosis as they can be easily produced using micromachining.
In summary, QCM, SAW-Rayleigh and ZnO nanoparticle-based SAW-Love chips were microfabricated and their sensitivity and performance was comparatively analyzed for the quantification of S. aureus. The response of SAW sensors was more than three orders of magnitude greater compared with the QCM sensor for the same mass loading of S. aureus. The ZnO nanoparticle based SAW-Love sensor demonstrated the best mass loading sensitivity. In particular, the nano-structural ZnO substrate was proven to have potential for the irreversible absorption of S. aureus.
Conflicts of interest
There are no conflicts to declare.
Supplementary Material
Acknowledgments
This study was supported by the National Key R&D Program of China (2016YFB1200401-102E) to Y. J. Y.
Notes and references
- Gordon R. J. Lowy F. D. Clin. Infect. Dis. 2008;46:S350. doi: 10.1086/533591. [DOI] [PMC free article] [PubMed] [Google Scholar]
- Gelatti L. C. Bonamigo R. R. Becker A. P. Pa D. A. An. Bras. Dermatol. 2009;84:501. doi: 10.1590/S0365-05962009000500009. [DOI] [PubMed] [Google Scholar]
- Kamal R. M. Bayoumi M. A. Aal S. F. A. A. E. Food Control. 2013;33:49. doi: 10.1016/j.foodcont.2013.02.017. [DOI] [Google Scholar]
- Chang Y. C. Yang C. Y. Sun R. L. Cheng Y. F. Kao W. C. Yang P. C. Sci. Rep. 2013;3:1863. doi: 10.1038/srep01863. [DOI] [PMC free article] [PubMed] [Google Scholar]
- Tong S. Y. Davis J. S. Eichenberger E. Holland T. L. Fowler V. G. Clin. Microbiol. Rev. 2015;28:603. doi: 10.1128/CMR.00134-14. [DOI] [PMC free article] [PubMed] [Google Scholar]
- Ferreira J. S. Costa W. L. R. Cerqueira E. S. Carvalho J. S. Oliveira L. C. Almeida R. C. C. Food Control. 2014;37:395. doi: 10.1016/j.foodcont.2013.09.062. [DOI] [Google Scholar]
- Török E. Day N. Medicine. 2009;33:97. doi: 10.1383/medc.33.5.97.64964. [DOI] [Google Scholar]
- Witt A. Mason M. J. Burgess K. Flocke S. Zyzanski S. Breastfeed. Med. 2014;9:29. doi: 10.1089/bfm.2013.0012. [DOI] [PMC free article] [PubMed] [Google Scholar]
- Cheng J. C. Huang C. L. Lin C. C. Chen C. C. Chang Y. C. Chang S. S. Tseng C. P. Clin. Chem. 2006;52:1997. doi: 10.1373/clinchem.2006.069286. [DOI] [PubMed] [Google Scholar]
- Huang Z. G. Zheng X. Z. Guan J. Xiao S. N. Zhuo C. Pathogens. 2015;4:199. doi: 10.3390/pathogens4020199. [DOI] [PMC free article] [PubMed] [Google Scholar]
- Moore D. F. Curry J. I. J. Clin. Microbiol. 1998;36:1028. doi: 10.1128/jcm.36.4.1028-1031.1998. [DOI] [PMC free article] [PubMed] [Google Scholar]
- Pires J. Novais A. Peixe L. J. Clin. Microbiol. 2013;51:4281. doi: 10.1128/JCM.01634-13. [DOI] [PMC free article] [PubMed] [Google Scholar]
- Kuang H. Wang W. Xu L. Ma W. Liu L. Wang L. Xu C. Int. J. Environ. Res. Public Health. 2013;10:1598. doi: 10.3390/ijerph10041598. [DOI] [PMC free article] [PubMed] [Google Scholar]
- Guntupalli R. Sorokulova I. Olsen E. Globa L. Pustovyy O. Vodyanoy V. J. Vis. Exp. 2013;75:e50474. doi: 10.3791/50474. [DOI] [PMC free article] [PubMed] [Google Scholar]
- Zhang D. Liu Q. Biosens. Bioelectron. 2016;75:273. doi: 10.1016/j.bios.2015.08.037. [DOI] [PubMed] [Google Scholar]
- Mello L. D. Kubota L. T. Food Chem. 2002;77:237. doi: 10.1016/S0308-8146(02)00104-8. [DOI] [Google Scholar]
- Abbaspour A. Noori A. Analyst. 2012;137:1860. doi: 10.1039/C2AN15683K. [DOI] [PubMed] [Google Scholar]
- Balasubramanian S. Sorokulova I. B. Vodyanoy V. J. Simonian A. L. Biosens. Bioelectron. 2007;22:948. doi: 10.1016/j.bios.2006.04.003. [DOI] [PubMed] [Google Scholar]
- Berrettoni M. Tonelli D. Conti P. Marassi R. Trevisani M. Sens. Actuators, B. 2004;102:331. doi: 10.1016/j.snb.2004.04.022. [DOI] [Google Scholar]
- Su F. Y. Endo Y. Saiki H. Xing X. H. Ohmura N. Biosens. Bioelectron. 2007;22:2500. doi: 10.1016/j.bios.2006.09.033. [DOI] [PubMed] [Google Scholar]
- Vasilescu A. Marty J. L. Trends Anal. Chem. 2016;79:60. doi: 10.1016/j.trac.2015.11.024. [DOI] [Google Scholar]
- Xu Z. L. Yuan Y. J. Biosens. Bioelectron. 2018;99:500. doi: 10.1016/j.bios.2017.07.060. [DOI] [PubMed] [Google Scholar]
- Moll N. Pascal E. Dinh D. H. Pillot J. P. Bennetau B. Rebiere D. Déjous C. Biosens. Bioelectron. 2007;22:2145. doi: 10.1016/j.bios.2006.09.032. [DOI] [PubMed] [Google Scholar]
- Gammoudi I. Tarbague H. Othmane A. Moynet D. Rebière D. Kalfat R. Dejous C. Biosens. Bioelectron. 2010;26:1723. doi: 10.1016/j.bios.2010.07.118. [DOI] [PubMed] [Google Scholar]
- Yuan Y. J. van der Werff M. J. Chen H. Hirst E. R. Xu W. L. Bronlund J. E. Anal. Chem. 2007;79:9039. doi: 10.1021/ac701717m. [DOI] [PubMed] [Google Scholar]
- Yuan Y. J. Chen Q. Y. Li J. RSC Adv. 2016;6:40336. doi: 10.1039/C6RA04221J. [DOI] [Google Scholar]
- Han K. Yuan Y. J. IEEE Sens. J. 2014;14:2601. [Google Scholar]
- Du J. Harding G. L. Ogilvy J. A. Dencher P. R. Lake M. Sens. Actuators, A. 1996;56:211. doi: 10.1016/S0924-4247(96)01311-8. [DOI] [Google Scholar]
- Liu J. S. AIP Adv. 2014;4:077102. doi: 10.1063/1.4886773. [DOI] [Google Scholar]
- Liu J. S. Wang L. J. Sens. Actuators, B. 2014;204:50. doi: 10.1016/j.snb.2014.07.095. [DOI] [Google Scholar]
- Kabir K. M. Sabri Y. M. Kandjani A. E. Matthews G. I. Field M. Jones L. A. Bhargava S. K. Langmuir. 2015;31:8519. doi: 10.1021/acs.langmuir.5b01858. [DOI] [PubMed] [Google Scholar]


