Abstract
Human SETD7 methyltransferase (hSETD7) is involved in a wide range of physiological processes, and has been considered as a significant target to develop new drugs. (R)-PFI-2, one hSETD7 inhibitor, could bind to the pocket of substrates with potent (low nanomolar) activity and high selectivity, while its enantiomer (S)-PFI-2 showed 500-fold less activity in IC50 determination. Why do this pair of enantiomers, with nearly identical structures, exert tremendously different inhibitory activity? We performed a total of 900 ns long-timescale molecular dynamics (MD) simulations and 80 ps hybrid quantum mechanics/molecular mechanics (QM/MM) MD simulations to understand the molecular mechanism of the stereoselectivity of hSETD7. For each SAM/hSETD7/PFI-2 system, we characterized and compared the residual fluctuation of hSETD7, and generated molecular interaction fingerprints (IFP) to exemplify the propensities of SAM/hSETD7-inhibitor interactions. Based on the QM/MM MD, we accurately captured the difference of hydrogen bonds between the SAM/hSETD7/(R)-PFI-2 and SAM/hSETD7/(S)-PFI-2 systems. Especially the strength of the hydrogen bond between G336 and two inhibitors, which determines the stability of the post-SET loop. The energy barrier for (S)-PFI-2 was much bigger than (R)-PFI-2 from global minimum to bioactive conformation as the potential energy surface scanning (PES) showed. Moreover, by estimating the binding affinity and phylogenetic tree analysis, we discovered 16 hotspots were essential for binding both enantiomers but the specific mode of interaction between these hotspots and enantiomorphs is different. Our findings reveal the effect of chirality on the inhibition activity of hSETD7 in detail, and provide valuable information for hSETD7 structure-based drug development.
This work clearly reveals the interaction of SAM/hSET7/(R/S)-PFI-2 systems, and confirms that the different bioactive energy barriers of (R)-PFI-2 and (S)-PFI-2 lead to the tremendously different inhibitory activities between these two antipodes.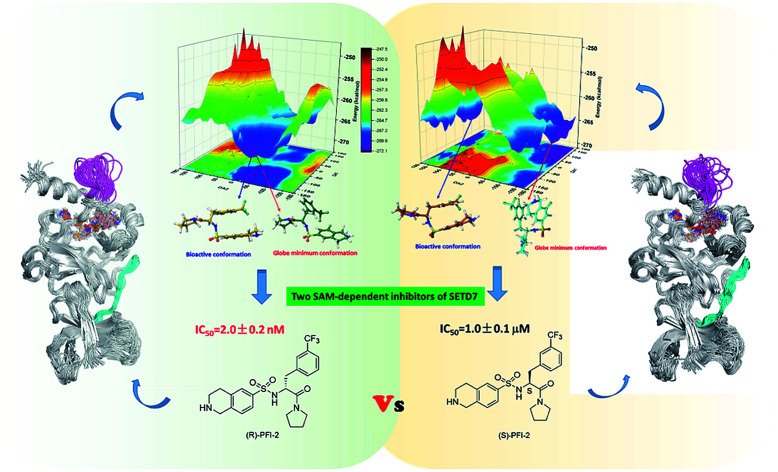
Introduction
The SET domain-containing proteins have a common domain which methylates their substrates by using the cofactor S-adenosyl-l-methionine (SAM) to support the methyl. Human SET domain-containing lysine methyltransferase 7 (hSETD7) specifically monomethylates Lys-4 of histone (H3K4) which plays a crucial function in the epigenetic regulation of gene transcription activation. Recently, hSETD7 has been reported as having multiple non-histone targets, such as DNA methyltransferase 1 (DNMT1), Foxo3, Rb, SATAT3, Tat, TAF10, p53 Mypt, ER and Pdx1.1–7 Those substrate relating to broad molecular pathways involved in metabolism, inflammation and cancer, which makes hSETD7 a vital protein for cellular function. Abnormal alteration of hSETD7 will cause many types of diseases.8 For example, SETD7 may be considered as a new target for the treatment of chronic inflammation, cardiovascular defects, oncogenesis and so on.9 Small molecules targeting hSETD7 to interrupt its implicated signaling pathways are considered as an effective method to treat diseases involving hSETD7.10 Among those small inhibitors of hSETD7, the vast majority are SAM-competitive or specifically target the SAM-binding pocket. However, those inhibitors displayed poor selectivity towards hSETD7, as there are numerous SAM-depended methyltransferases in human body. Comparing the SAM-binding site, the peptide-binding site of hSETD7 has the ability to recognize consensus sequences to specifically bind substrate proteins from other countless proteins in cells as reported in Raymond C Trievel's work.11 Based on this binding site, developing selective inhibitors of hSETD7 is possible. The artificially synthesized molecule (R)-PFI-2 was discovered as the first potent, selective and cell-active inhibitor of hSETD7 by high throughput screening (HTS) of a small molecule library from Pfizer in Dalia Barsyte-Lovejoy and co-workers' work.8 Moreover, they also synthesized (S)-PFI-2 as a negative control with 500-fold less potency for cell-based studies. Yuzhe Niu et al. explored the activity of PFI-2 enantiomers against hSETD7,12 however their models with missing cofactor SAM might be not suitable to explore the stereoselectivity mechanism of hSETD7 to these two enantiomers. As both enantiomers were SAM-dependent inhibitors of SETD7 ((R)-PFI-2 and (S)-PFI-2 bind to hSETD7 only in the presence of SAM), which had been identified by Biacore experiments in Dalia Barsyte-Lovejoy's work. Until now, the mechanism concerning ligand stereoselectivity that makes these two enantiomers display significant differences in the activity of hSETD7, has never been mentioned and explored reasonably. It is often difficult to obtain accurate information of physicochemical contributions underlying hSETD7 inhibitors' binding characteristics from static crystal structures or ligand-based structure–activity relationship analysis, as hSETD7 and its inhibitors play physiological functions in dynamic conformations instead of in static states in cells.
In this present work, we employed molecular docking, hybrid quantum mechanics/molecular mechanics (QM/MM) method and long-timescale molecular dynamics (MD) simulations on atomic level to study how two enantiomers of isoquinolinesulfonamide bind to the hSETD7 enzyme and exert tremendous different biological activity. We chose the crystal structure (PDB: 4JLG) SETD7 in complex with inhibitor (R)-PFI-2 and S-adenosyl-methionine (SAM) as the starting point of MD simulations of SAM/hSETD7/(R)-PFI-2 system. Meanwhile, we docked (S)-PFI-2 into the same binding site of (R)-PFI-2 and optimized the complex structure of (S)-PFI-2/hSETD7/SAM to establish SAM/hSETD7/(S)-PFI-2 system before MD simulations. Then, a total of 900 ns long-timescale molecular dynamics (MD) simulations (150 ns each case, 6 cases) and 80 ps hybrid quantum mechanics/molecular mechanics (QM/MM) MD simulations were performed. Based on our MD calculations, interaction fingerprint calculations (IFP) analysis, hydrogen distribution calculation, the potential energy surface scanning (PES), QM/MM-GBSA calculations of binding free energy, and phylogenetic tree analysis were performed to explore the detail of (R/S)-PFI-2/STED7/SAM interaction, and investigate the mechanism concerning ligand stereoselectivity that made these two SAM-dependent enantiomers displaying significant differences in the activity of hSETD7. These results could shed light on the understanding of the mechanism of the stereoselectivity of hSETD7 methyltransferase and provide theoretical support or further design of new potent STED7 inhibitors.
Materials and methods
Atomic model preparation and docking protocol
As lack of crystal structure of (S)-PFI-2/hSETD7/SAM complex, we docked the inhibitor (S)-PFI-2 into its enantiomer (R)-PFI-2 binding site using the flexible ligand docking protocol in Glide dock-XP mode.13 Firstly, we download the crystal structure (R)-PFI-2/hSETD7/SAM (PDB ID code: 4JLG) and repaired the crystal structure with adding missing side chains of residues and other missing atoms and kept all the crystal water molecules. In the receptor grid generation step, a cubic box with 20 × 20 × 20 Å3 size was centered basing on the mass center of the original co-crystal ligand (R)-PFI-2 with default parameter. Inhibitor (R)-PFI-2 was spilt from the crystal structure (PDB: 4JLG) for docking success testing that the top-scoring pose should be within 2.0 Å in root-mean-square (RMSD) value referring the conformation of crystal structure.14 (S)-PFI-2 was build based on (R)-PFI-2 with the Maestro 2015-2.15 Both molecules' geometry of structures were optimized using ligand preparation model with OPLS_2005 force field in the Schrödinger 2015-2. Lastly, the two inhibitors were docked with the highest precision mode in Glide 6.6. Five poses out of 25 000 per enantiomer were submitted in post-docking energy minimization. The RMSD value of (R)-PFI-2 between the docked pose with the best docking score −10.913 kcal mol−1 and the RMSD value referred to crystal pose was very small, only 0.337 Å (Fig. S1†), which implicated this dock process was enough reliable. For inhibitor (S)-PFI-2, the best docking score is −9.006 kcal mol−1 and its related pose was saved into complex structure (Fig. S2†) for MD study.
Classical molecular dynamics simulation
All-atom MD simulations were performed using Amber14,16 employing explicit model with periodic boundary conditions. Each case was repeated three times (each 150 ns) starting with the same structure but at different initial velocities. The time step was 2.0 fs and a sum of 900 ns MD simulations have been run in this study. All small molecules including two enantiomers (S)-PFI-2, (R)-PFI-2 and co-factor SAM were submitted to the Gaussian 09 D 01 program17 to calculate the electrostatic potential at the HF/6-31+G* level. Then, the electrostatic potential was fitted to RESP charge18 by antechamber package.19 The FF14SB and GAFF force field parameter set were chosen for enzyme hSETD7 and three different compounds ((S)-PFI-2, (R)-PFI-2 and SAM) respectively. Both (R)-PFI-2/hSETD7/SAM and (S)-PFI-2/hSETD7/SAM systems were solvated in TIP3P water molecules in a truncated octahedron periodic box, then neutralized by adding 19 Na+ cations. The SHAKE algorithm20 was applied to all hydrogen atoms and the Particle Mesh Ewald (PME) method21 was chosen to compute the long-range electrostatic interactions with cut-off of 8 Å. The dynamics were propagated using Langevin dynamics with Langevin damping coefficient of 2 ps−1 at constant temperature and pressure (NPT ensemble) of 300 K and 1 atm. The information about trajectory was saved each 2 ps for data mining in MD production state. All the calculation and analysis were computed on in-house workstation with three GeForce GTX 980 GPUs and one CPU i7-8700K with six cores.
QM/MM MD simulations
Each truncated octahedron system from above molecular dynamics simulations was partitioned into QM and MM subsystems. For the QM region, including the residues the residues 335–337, 266–268 and the inhibitors, was treated with PM6 which was a semi-empirical quantum chemistry method based on the Hartree–Fock formalism. Considering the QM methods was still expensive with a large system, we only use the data of run-1 from MD for QM calculation. Except for the QM region, all the rest parts were using the same molecular force field as previous classical molecular dynamics simulations. The cutoff distances of electrostatic and van der Waals interactions were 20 Å. The prepared systems from last frame of the MD were first minimized by the QM/MM calculations. Then, 40 ps QM/MM MD simulations were performed with time step of 2 fs for (R)-PFI-2/hSETD7/SAM and (S)-PFI-2/hSETD7/SAM, respectively. The Beeman algorithm to integrate the Newton equations of motion, as well as the Berendsen thermostat method22 to control the system temperature at 300 K. The 40 000 frames of the 40 ps were submitted to the data analysis process. All QM/MM MD calculations were performed with Amber 14 and Gaussian 09 D 01.17
Interaction fingerprint calculations (IFP)
The interaction fingerprint (IFP) between hSETD7/SAM and inhibitors were calculated by IChem software.23 Firstly, the final 1000 snapshots from final 50 ns MD simulation were extracted and then submitted to IChem, which can encode the protein–ligand interaction fingerprint (IFP) from the protein–ligand coordinates.24 IFP have been calculated for over 1000 protein–ligand complexes, which enabling a broad comparison of relationships between binding site pairwise similarities. Both antipode–SETD7 complexes in our study displayed only two different types of interactions: hydrophobic contact and polar interaction. The hydrophobic contacts containing the hydrophobic interaction of alkanes and also including the interaction of aromatic rings such as the edge-to-face and face-to-faces. Whilst the polar interaction incorporates hydrogen bond and ionic bond. We used the default parameters of IChem to calculate IFP in this work.
Hydrogen distribution calculation
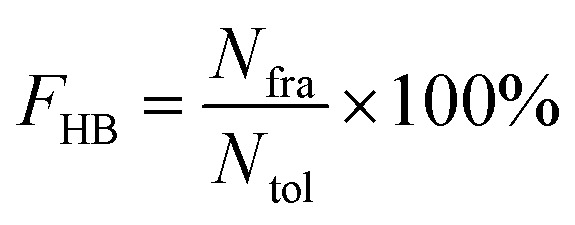
All hydrogen bonds were defined as that angle cutoff for hydrogen bonds were over 135° and distance cutoff for hydrogen bonds were no more than 3.5 Å. As reported in this literature, the percentage of a hydrogen bond in MD runs was computed as:
 |
1 |
Here, FHB the fraction of every specific hydrogen bond was calculated within range 0–100%. Nfra meant the number of frames that one specified hydrogen bond emerged. Ntol was the total figure of collected frames in 100–150 ns.
Potential energy surfaces scanning
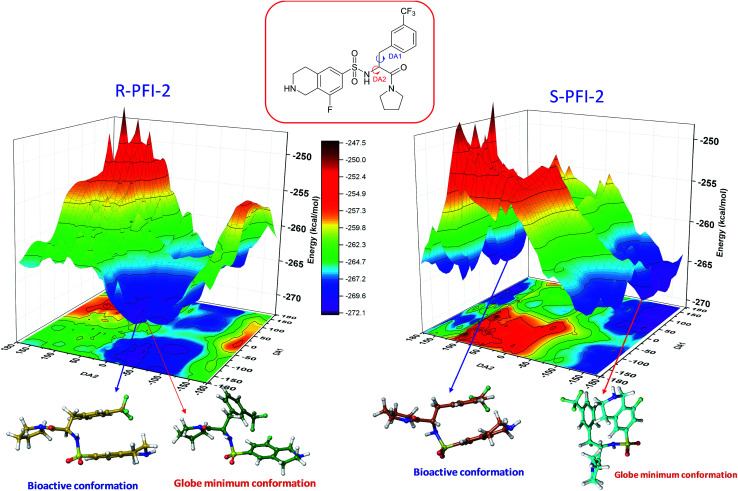
In order to figure out the energy barrier of this enantiomers between the bioactive conformation and global minimum, in the present work we have calculated the three-dimensional potential energy surfaces (PES) scanning using the QM methods. As the energy surface scan based on QM methods were very expensive, we only use the data from run-1 for PES scanning calculation. Firstly, the bioactive conformations (bound states) of both enantiomers were extract from the QM/MM MD process. All the bounded structures can be classified into one ensemble as the RMSD value is within 2.0 Å Fig. S3.† Then, the representative structures (Fig. 4's orange and yellow structure) were selected as the starting point for scanning the potential energy surface. The total energy was calculated as a function of a two-dimensional grid of 1369 points, constructed by varying the dihedral angles DA1 and DA2 ranging from −180° to 180° with a step of 10°. And each step followed by a geometry optimization to avoid unreasonable structures. To reduce the cost of calculation, the PES scanning was performed by Semi-Empirical Method PM6 using the Gaussian 09 D 01 software.17
Fig. 4. Potential energy surface (PES) obtained along DA1 and DA2 dihedral angles. B structures stand for the bioactive conformation. M structures stand for globe minimum.
QM/MM-GBSA calculations of binding free energy
The method of QM/MM-GBSA get great success to investigate the interaction of inhibitors binding to targets as reported in everywhere.25–27 Here, the hybrid method of semi-empirical Hamiltonian PM6 and MM-GBSA was chosen to calculate binding free energies between hSETD7 and PFI-2 enantiomers to detect the hidden information behind the stereoselectivity of hSETD7. 200 frames collected from the final 40 ps of QM/MM MD trajectory with an interval of 200 fs were used for calculating the binding energies. The binding free energies ΔGbind was calculated as follows:
| ΔH = ΔEQM/MM + ΔGsol | 2 |
| ΔEQM/MM = ΔEinternal + ΔEele + ΔEvdw | 3 |
| ΔGsol = ΔGnonpol + ΔGpol | 4 |
| ΔGbind = ΔH − TΔS = ΔEinternal + ΔEele + ΔEvdw + ΔGnonpol + ΔGpol − TΔS | 5 |
In eqn (2)–(5), the enthalpy part, as the sum of the EQM/MM and ΔGpol, was calculated by the QM/MM method. Residues 335–337, 266–268 and antipodes, a total of 152 atoms (Fig. 3), were treated at the QM level using the semi-empirical PM6 Hamiltonian approach, while all the rest of systems was characterized at the MM level. −TΔS, ΔEQM/MM and ΔGsol were equal to the conformational entropy upon binding, the changes of the gas phase QM/MM energy and solvation free energy, respectively. In eqn (4), ΔEQM/MM was the term including ΔEinternal (dihedral, angel and bond energies), electrostatic energies ΔEele and van der Waals (VDW) interaction ΔEvdw. In eqn (5), ΔGsol was calculated as sum of the nonpolar (ΔGnonpol) and polar (ΔGpol) contribution. The nonpolar part of ΔGsol was estimated from the solvent accessible surface area (SASA) with γ = 0.0072 kcal mol−1 Å−2 for the surface tension. The polar part of ΔGsol was calculated by solving the linearized Poisson–Boltzmann equation. The entropy changes on inhibitor binding was calculated by using a normal-mode analysis at the MM level. The conformational entropy change (−TΔS) on ligand binding was computed with the NMODE program in AmberTools 15 package.28
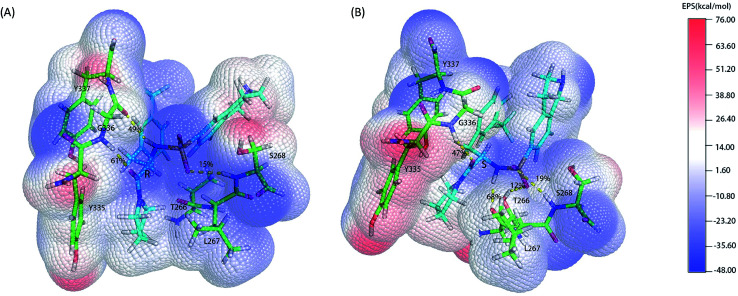
Fig. 3. Electrostatic potential surfaces of QM region. The electrostatic potential is measured in eV, with range as shown in the corresponding color bar. Hydrogen bonds are displayed by yellow dashes. (A). (R)-PFI-2 and the key residues of binding site. (B). (S)-PFI-2 and the key residues of binding site.
Phylogenetic tree analysis
The Energy data from above QM/MM-GBSA calculation was submitted into the process of phylogenetic tree analysis. Energy contributions of 247 residues (from 117 to 363 and including co-factor SAM) to both antipodes rendered a two-dimensional vector. The phylogenetic tree of residues contributing to (R)-PFI-2 and (S)-PFI-2 in hSETD7's MORN 3 and SET domain were produced with the statistical analysis package R-3.3.1 as our previous work descripted.29,30
Results and discussion
Classical MD simulation
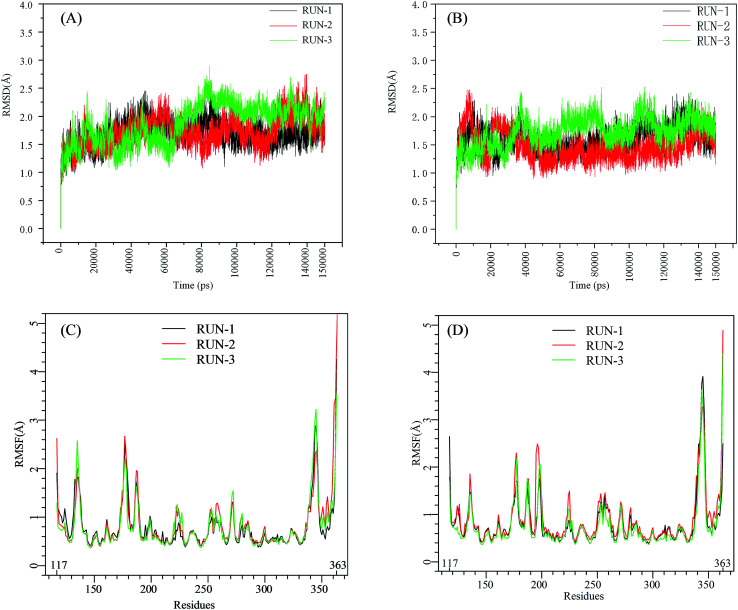
The initial structures of PFI-2/SETD7/SAM that had been prepared in the similar way as our previous work,29,30 displayed in Fig. S2,† were submitted to workflow of classical MD simulation. To explore the dynamics stability of all the complexes during the MD simulations, structural and energetic properties were monitored during the molecular dynamics simulation of both systems. Root mean square deviations (RMSD) of the hSETD7 protein backbone atoms relative to their starting structures during the MD simulation were plotted as Fig. 1(A) and (B). Three independent 150 ns long classical MD runs were performed with different initial speeds for each system. As no large leap value detected in time related RMSD analysis, all systems are equilibrated well during the simulation time.
Fig. 1. RMSD and RMSF plots for (R/S)-PFI-2/SETD7/SAM systems. Black, red, green: trajectories of three independent MD simulations (run-1, run-2, run-3). (A) and (B) are the RMSD plots of (R)-PFI-2/SETD7/SAM system and (S)-PFI-2/SETD7/SAM system, respectively. (C) and (D) are the RMSF plots of (R)-PFI-2/SETD7/SAM system and (S)-PFI-2/SETD7/SAM system, respectively.
To determine the flexibility of residues, the overall root-mean-square fluctuation (RMSF) of the alpha carbon (Cα) was calculated along six MD trajectories from (R)-PFI-2/hSETD7/SAM and (S)-PFI-2/hSETD7/SAM systems. Fig. 1(C) and (D) illustrate the difference of residues' flexibility between two systems, and the peaks in the RMSF figures represent the degree of residues' flexibility. The RMSF plots looks similar to each other on the whole as the only difference is the absolute configuration of the inhibitor. However, we found that two regions still exit large difference with carefully checking. Residues 190–200 are apparently more flexible in (S)-PFI-2/hSETD7/SAM systems in which the RMSF values are 2-fold comparing in (R)-PFI-2 bounded systems. The other position is residues 340–350 belonging to the post-SET loop, which displayed lower RMSF value in (R)-PFI-2/hSETD7/SAM systems than in (S)-PFI-2 bounded systems. The above two mentioned parts were colored in the dynamics ensembles as displayed in Fig. S4.† As the post-SET loop directly involving in constructing the binding site, the flexibility change of this region may relate to the difference of affinity between these two enantiomers.
Interaction fingerprint (IFP)
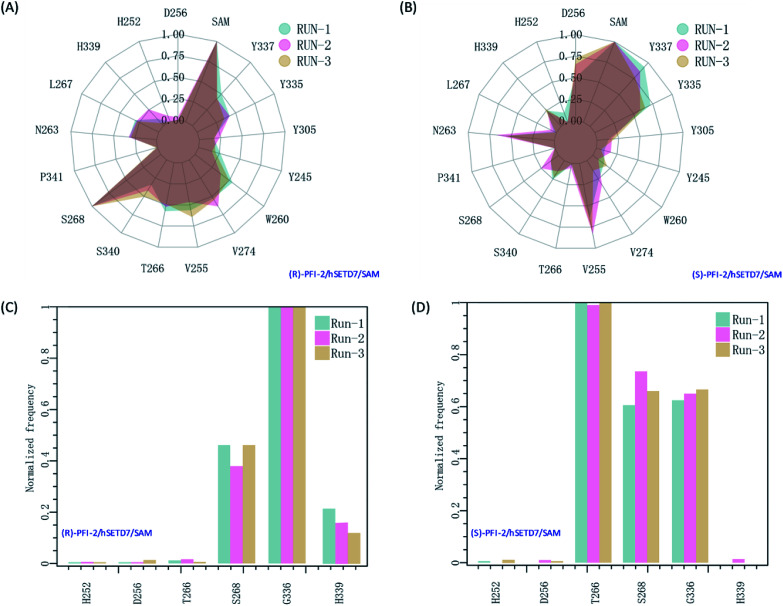
It is interesting to investigate the inhibitor stereoselectivity of the hSETD7 protein and illuminate how the stereochemical arrangement of 3-trifluoromethyl-benzyl group at chiral carbon determines the enantiomers' enormous activity difference, in which (R)-PFI-2 (IC50 ≈ 2 nM) are 500-fold more active than (S)-PFI-2 (IC50 ≈ 1 μM).8,31–34 To illustrate how each antipode interacts with hSETD7, we generated the interaction fingerprints (IFP) based on the 1000 frames from the final 50 ns MD simulation. As shown in Fig. 2, both inhibitors interact with D256, SAM, Y337, Y335, Y305, Y245, W260, V274, V255, T266, S268, P340, S268, P341, N263, L267, H339 and H252. It is obvious that both inhibitors form strong hydrophobic interactions with the co-factor S-adenosyl-l-methionine (SAM). When we investigated the interaction mode between (R/S)-RFI-2 and SAM in the dynamics structure from our all-atom MD simulation, we found the average distance between the pyrrolidine moiety of both enantiomers and the methyl group of SAM is under 5 Å at the most of time (Fig. S5†). This interaction can explain why (R)-PFI-2 is a SAM-dependent inhibitor, which has been proved by the surface plasmon resonance (SPR) experiments in Dalia Barsyte-Lovejoy's works.8 Besides SAM, residue S268, S340, T266, V255, V274, W260, and Y337 with frequency > 0.50 are mainly contributor of hydrophobic interaction in the binding mode of (R)-PFI-2 (Fig. 2(A)). While for (S)-PFI-2, these residues are D256, N263, V255, Y335 and Y337 (Fig. 2(B)). All of these hydrophobic interactions are essential for stabilizing the structure of ternary-system, especially for stabilizing the post-SET loop (residues 334–350) which was missing in many crystal structures of hSETD7.8,31–34
Fig. 2. The interaction fingerprints of the enantiomeric inhibitors with SETD7/SAM. (A) and (B) are the normalized frequency of hydrophobic interactions in the last 50 ns for (R)-PIF-2/hSETD7/SAM and (S)-PIF-2/hSETD7/SAM system, respectively. (C) and (D) are the normalized frequency of hydrogen bonds or ionic bonds in the last 50 ns for (R)-PIF-2/hSETD7/SAM and (S)-PIF-2/hSETD7/SAM system, respectively. Cyan, magenta, and bright-orange areas represent the three different MD simulations presented in this work.
In addition, polar interaction is also important to stabilize structure or to improve activity of the inhibitor. The IFP analysis has suggested that the polar interaction between this pair of enantiomers and residue G336 on post-SET loop are requisite for keeping the binding state of both enantiomers (Fig. 2(C) and (D)). Moreover, S268 plays an important role in the polar interaction with two enantiomers. This residue's strength of polar interaction is opposite to its strength of hydrophobic interaction, when comparing the IFP maps. T266 has displayed strong polar interaction (Fig. 2(D)) in the binding mode of (S)-PFI-2, despite its weak hydrophobic interaction. It always forms a hydrogen bond with the sulfonyl of (S)-PFI-2 as displayed in Table 1. However, T266 displayed very weak polar interaction to bind (R)-PFI-2 (Fig. 2(C)). On the other hand, the contributions from the residues G336 and H339 which are located in the post-SET loop in SAM/hSETD7/(S)-PFI-2 system are smaller than that in SAM/hSETD7/(S)-PFI-2 system, which result in the post-SET loop more flexible in (S)-PFI-2/hSETD7/SAM system than in (R)-PFI-2/hSETD7/SAM system. All the differences are caused by the chiral center of PFI-2. As the configurations of chemical groups on the chiral center of (R)-PFI-2 and (S)-PFI-2 are different, the residues near the groups of the enantiomer are induced to change the orientation of those residues' side chains to bind the inhibitors.
Hydrogen bonds observed between PFI-2 and key residues of hSETD7a.
| Donor | DonorH | Acceptor | Frac | AvgDist | AvgAng |
|---|---|---|---|---|---|
| (R)-PFI-2 | |||||
| GLY336@N | GLY336@H | LIG@O1 | 0.61 | 2.832 | 159.9947 |
| SER268@N | SER268@H | LIG@O2 | 0.15 | 2.915 | 161.7102 |
| LIG@N2 | LIG@H16 | GLY336@O | 0.49 | 2.886 | 147.302 |
| (S)-PFI-2 | |||||
| GLY336@N | GLY336@H | LIG@O1 | 0.47 | 2.872 | 155.8762 |
| SER268@N | SER268@H | LIG@O2 | 0.19 | 2.889 | 149.7309 |
| THR266@OG1 | THR266@HG1 | LIG@O3 | 0.12 | 2.832 | 156.0332 |
| LIG@N2 | LIG@H16 | THR266@O | 0.68 | 2.873 | 162.9637 |
Angle cutoff for hydrogen bonds >135°, distance cutoff for hydrogen bonds (D–H–A) <3.5 Å.
Hydrogen bonds analysis based on QM/MM MD simulations
As the classical MD just described the interactions between atoms using a force filed as a simple potential energy function,35 it lacked the information of electronic structure of molecules. However, the descriptions of electronic structure are very important when involving the hydrogen bonds' forming and breaking. In order to more accurately investigate the hydrogen bond for insight into the stereoselectivity of hSETD7 methyltransferase to the (R/S)-PFI-2, we used the hybrid quantum mechanics/molecular mechanics (QM/MM) MD simulations that had been successfully applied in many researches.25–27 In this study, the QM regions were displayed in Fig. 3, where the average surface of electrostatic potential (EPS) was plotted. The range of electrostatic potential was from −48.00 to −76.00 kcal mol−1 mapping in the blue-white-red color bar. There are lacking very high positive electrostatic potential in (R/S)-PFI-2 comparing with adjacent residues as showed in electrical potential surfaces Fig. 3(A) and (B). The sulfonamide group is the main negative electrostatic potential region of PFI-2, which is directly connecting the chiral carbon. This part plays an important role in the hydrogen bond and polar interaction between PFI-2 and residues of binding site. The hydrogen bonds between the inhibitor and its related residues are displayed in Fig. 3 and Table 1. Notably, the hydrogen bond between residue GLY336 and inhibitor is obviously different. There are two H bonds between (R)-PFI-2 and residue GLY336, while only one for (S)-PFI-2 and GLY336. As GLY336 located in the post-SET loop, more and stronger H-bonds between the residue and inhibitor will make the loop more stable. This can explain why the post-SET loop of (S)-PFI-2 bound system displays more flexible in above RMSF plots. The hydrogen bond (LIG@N2→THR266@O) are the most stable in (S)-PFI-2 bound system, but this H-bond is almost not presenting between the residue THR266 and (R)-PFI-2. As the residue THR266 located in the tail part of β17 (ref. 31) which is opposite side to post-SET loop in the binding cleft, the affinity of (S)-PFI-2 is less depended on the post-SET loop comparing with (R)-PFI-2.
Potential energy surface scanning
Spatial configuration has a fundamental influence on the biological and chemical properties of inhibitors. It is very important to illustrate the relation between the conformational energy barrier of these enantiomers and their bioactivity. By scanning the potential energy surface as showed in Fig. 4, the energy barrier (Table 2) of (R)-PFI-2 is 1.56 kcal mol−1, which is far small than that of (S)-PFI-2 from global minimum to bioactive conformation. It means (S)-PFI-2 access to its bioactive conformational ensemble more difficult than (R)-PFI-2, this may directly contribute to the tremendous different inhibitory activity between two enantiomers.
Bioactive energy barriera.
| (R)-PFI-2 | DA1 (°) | DA2 (°) | Energy (kcal mol−1) |
|---|---|---|---|
| Minimum conformation | −109.143 | −36.74 | −272.07 |
| Bioactive conformation | −169.143 | −46.74 | −270.51 |
| ΔEbarrier | 1.56 |
DA1 = 41H–12C–20N–50H; DA2 = 40H–11C–12C–20N. All the labels of PFI-(2) displayed in ESI Fig. S6.
| (S)-PFI-2 | DA1 (°) | DA2 (°) | Energy (kcal mol−1) |
|---|---|---|---|
| Minimum conformation | 132.42 | −141.75 | −270.58 |
| Bioactive conformation | 132.42 | 168.25 | −263.79 |
| ΔEbarrier | 6.79 |
Estimation of binding affinity
Considering the importance of electronic structure of molecules in hydrogen bonding and polar interactions, QM/MM-GBSA was used to calculate the binding free energies with frames collected from the 40 ps of QM/MM MD trajectory. In the calculation of QM/MM-GBSA, the same QM region as QM/MM MD simulation was used. Each calculated energy component and related experiment data are list in Table 3. The predicted binding free energies were −11.69 and −6.25 kcal mol−1 in (R)-PFI-2/hSETD7/SAM and (S)-PFI-2/hSETD7/SAM system, respectively. ΔEvdw, ΔEele, and ΔGnonpol primarily contributed to the binding of two antipodes with hSETD7/SAM, while the polar solvent energy (ΔEpol) impeded the binding. Although both IC50 and KD can represent affinity of a ligand to its receptor, the dissociation constant KD is a thermodynamic constant which is a more appropriate choice to accurately determine the binding free energy.36 Based on this, we convert the binding free energy to the dissociation constant KD 2.98 nM, which is very closed to the experimental value 4.2 nM in (R)-PFI-2 bound system. The above result indicates that the theoretical calculation in this research work is reliable as the calculated binding affinities agree with related experimental values.
Estimation of binding affinity of antipodes to hSETD7/SAM with QM/MM-GBSA method (unit, kcal mol−1)a.
| Component | (R)-PFI-2 | (S)-PFI-2 |
|---|---|---|
| ΔEvdw | −37.8282 ± 2.9011 | −35.9261 ± 2.9906 |
| ΔEele | −27.5558 ± 3.8818 | −26.4493 ± 3.9708 |
| ΔGnonpol | −6.8594 ± 0.2221 | −6.1644 ± 0.2901 |
| ΔGpol | 40.6085 ± 2.9286 | 38.6015 ± 3.2797 |
| −TΔS | 19.9388 ± 6.6670 | 23.6860 ± 4.4071 |
| ΔGbind | −11.6947 ± 3.4291 | −6.2529 ± 3.2903 |
| K D | 2.98 nM | 2.77 × 10⁴ nM |
| K D(exp) | 4.2 ± 0.2 nM | NA |
| IC50(exp) | 2.0 ± 0.2 nM | 1.0 ± 0.1 mM |
ΔEele the electrostatic interaction energies. ΔEvdw the vander Waals interaction energies. ΔEpol the polar solvation free energy. ΔEnonpol the nonpolar olvation free energy. −TΔS the enthalpic contribution to binding in temperature 300 K. ΔGbind the total binding energy. KD this term calculated from ΔGbind = RT ln KD with R = 1.9858775 × 10⁻³ kcal K−1mol−1KD(exp) the experimental dissociation constant was determined from Biacore SPR studies. But there is no KD(exp) for (S)-PFI-2.
Phylogenetic tree analysis of residues' contribution
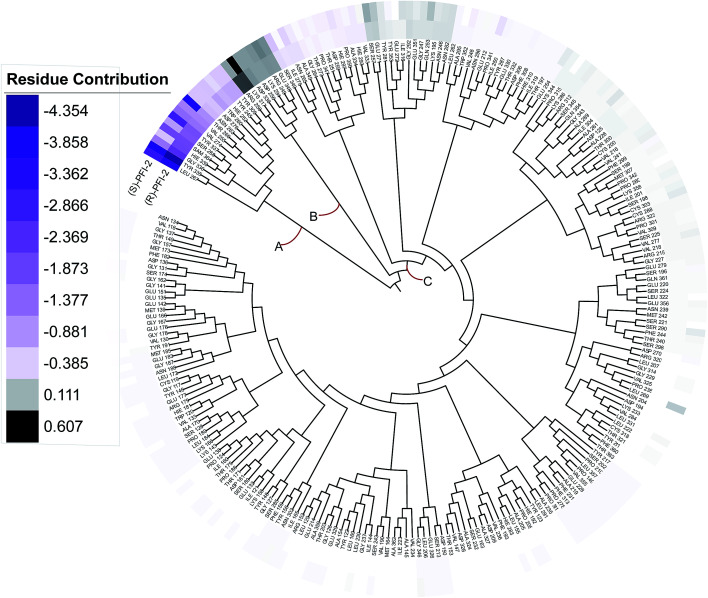
In order to overall characterize the contribution of each residue to the interaction between hSETD7/SAM system and PFI-2, we generated a phylogenetic tree to identify hot spots from 247 residues (including the cofactor SAM) according to binding energy decomposition. Three clusters of residues were discovered as in Fig. 5. Residues favoring (R)-PFI-2 or (S)-PFI-2 binding were colored in purple. The highest contribution (−4.354 kcal mol−1) of the residue TYR325 was in dark violet. The lower contribution of residues faded gradually towards white which equaled zero in energy contribution. While, the residues hindering (S)-PFI-2 or (R)-PFI-2 binding were colored in gray. The most unfavorable residues were colored in black (LYS317 0.607 kcal mol−1 in (S)-PFI-2/hSETD7/SAM system) and the color of the lower faded gradually towards white too. Obviously, the residue with the most favoring PFI-2 binding energy is much bigger in absolute value than the most impeding the binding.
Fig. 5. A phylogenetic tree of energy contribution for residues 117–363 of SETD7 and co-factor SAM.
As displayed in Fig. 5, energy contribution of set A (LEU267, TYR335, GLY336, HIE339, SAM364, SER268, TYR337, VAL274, VAL255, THR266, ASN263, ASP276, TRP260, HIE252, TYR245, TYR305 and cofactor SAM) is consistently higher than set B and C, which indicated that the group A playing an important role to interact with (R)-PFI-2 or (S)-PFI-2. Residues from set B were against to binding both (R)-PFI-2 and (S)-PFI-2. The group C is the largest cluster, in which most of residues are far away from PFI-2 and display weak favorable or unfavorable contributions for binding PFI-2. Notably, the residues of cluster A directly construct the inhibitor-binding pocket that all those residues are within 5 Å of the two inhibitors, as displayed in Fig. S7 (see ESI†), and the energy contribution sum of cluster A was the major part of the total energy (90.46% for (R)-PFI-2/hSETD7/SAM system, 89.18% for (S)-PFI-2/hSETD7/SAM system). The cofactor SAM also present in set A, which suggest that SAM/hSETD7 system will be more favorable to bound PFI-2 than simple hSETD7 system. This conclusion is consisted with the report that (R)-PFI-2 is a SAM dependent inhibitor. Residue TYR335 is the highest contributor for binding (R)-PFI-2 (−4.354 kcal mol−1) and (S)-PFI-2 (−3.744 kcal mol−1). This residue also located in post-SET loop and its aromatic ring together with LEU267, TYR305 and TYR245 constructed the hydrophobic channel, which occupied by the methyl of SAM and the pyrrolidine moiety of PFI-2 (Fig. S8†). Although residues THR266 and GLY336 are also presenting in group A, but the degree of contribution is difference. THR266 showed obviously stronger interaction with (S)-PFI-2 (−3.56 kcal mol−1) than with (R)-PFI-2 (−0.93 kcal mol−1).
On the contrary, residue GLY336 display higher contribution in binding (R)-PFI-2 (−2.30 kcal mol−1) than (S)-PFI-2 (−1.25 kcal mol−1). The different energy contributions of those residues are consisted with the above hydrogen bonds analysis, which make the (R)-PFI-2 interact with GLY336 closely and make post-SET loop more stable. Together, these 16 hotspots are essential for this of pair of enantiomers binding in the substrate-binding site, but the different interacting mode of these residues directly decide the binding ability of each enantiomer.
Conclusions
In our atom structural details report, various computational approaches were integrated to explore the molecular stereoselectivity of hSETD7 methyltransferase to the two enantiomeric inhibitors. The calculated binding affinity of (R)-PFI-2 by QM/MM-GBSA method were in good agreement with experiments. We discovered that both inhibitors are favoring with the same 16 hotspots analyzed in the phylogenetic tree of energy contribution. These 16 residues constituted the substrate-binding pocket and made these two enantiomeric inhibitors binding stably. However, the interaction mode of (R/S)-PFI-2 are obviously different as interaction fingerprint presented. While different binding modes induced conformation change of post-SET loop to fit the inhibitors. In addition, the hydrogen bonds analysis from QM/MM MD simulations revealed that different hydrogen bond network effect the flexibility of post-SET loop, which had also been detected in the RMSF analysis of the six MD trajectories. Moreover, based the potential energy surface scanning of inhibitors, (S)-PFI-2 would cost to more energy to cross the energy barrier into the bioactive conformations than (R)-PFI-2. Thus, the different bioactive energy barriers for these two enantiomeric inhibitors can help to discriminate their efficacy. These findings provide new insights into the issue of ligand stereoselectivity of hSETD7 and will be helpful for the design of new hSETD7 targeted drugs. For example, this analysis suggests that modifying the sulfonamide part to substituted boric acid may be a start point for the covalent inhibitor designing of hSETD7. This structural modification does not disrupt the interacting mode of RFI-2 (R) and the substituted boric acid may be covalent bonding the side chain of SER268 based on the interaction fingerprint calculation and hydrogen bonds analysis.
Conflicts of interest
There are no conflicts to declare.
Supplementary Material
Acknowledgments
This research was conducted by using the computational resources of the School of Pharmaceutical Sciences and the College of Chemistry and Chemical Engineering, Xiamen University. This work was supported by the National Natural Science Foundation of China (No. 81773600), the Natural Science Foundation of Fujian Province of China (No. 2018J01132), and the Fundamental Research Funds for the Central Universities (No. 20720180051) to M. F.
Electronic supplementary information (ESI) available. See DOI: 10.1039/c9ra00190e
References
- Chuikov S. Kurash J. K. Wilson J. R. Xiao B. Nature. 2004;432:353–360. doi: 10.1038/nature03117. [DOI] [PubMed] [Google Scholar]
- Kouskouti A. Scheer E. Staub A. Tora L. Talianidis I. Mol. Cell. 2004;14:175–182. doi: 10.1016/S1097-2765(04)00182-0. [DOI] [PubMed] [Google Scholar]
- Dhayalan A. Kudithipudi S. Rathert P. Jeltsch A. Chem. Biol. 2011;18:111–120. doi: 10.1016/j.chembiol.2010.11.014. [DOI] [PubMed] [Google Scholar]
- Keating S. El-Osta A. Epigenetics. 2013;8:361–372. doi: 10.4161/epi.24234. [DOI] [PMC free article] [PubMed] [Google Scholar]
- Subramanian K. Jia D. Kapoor-Vazirani P. Powell D. R. Collins R. E. Sharma D. Peng J. Cheng X. Vertino P. M. Mol. Cell. 2008;30:336–347. doi: 10.1016/j.molcel.2008.03.022. [DOI] [PMC free article] [PubMed] [Google Scholar]
- Wang J. Hevi S. Kurash J. K. Lei H. Gay F. Bajko J. Su H. Sun W. Chang H. Xu G. Nat. Genet. 2009;41:125–129. doi: 10.1038/ng.268. [DOI] [PubMed] [Google Scholar]
- Pagans S. Kauder S. E. Kaehlcke K. Sakane N. Schroeder S. Dormeyer W. Trievel R. C. Verdin E. Schnolzer M. Ott M. Cell Host Microbe. 2010;7:234–244. doi: 10.1016/j.chom.2010.02.005. [DOI] [PMC free article] [PubMed] [Google Scholar]
- Barsyte-Lovejoy D. Li F. Oudhoff M. J. Tatlock J. H. Dong A. Zeng H. Wu H. Freeman S. A. Schapira M. Senisterra G. A. Proc. Natl. Acad. Sci. U. S. A. 2014;111:12853–12858. doi: 10.1073/pnas.1407358111. [DOI] [PMC free article] [PubMed] [Google Scholar]
- He S. Owen D. R. Jelinsky S. A. Lin L.-L. Sci. Rep. 2015;5:14368. doi: 10.1038/srep14368. [DOI] [PMC free article] [PubMed] [Google Scholar]
- Lenstra D. C. Damen E. Leenders R. G. Blaauw R. H. Rutjes F. P. Wegert A. Mecinovic J. ChemMedChem. 2018:1405–1413. doi: 10.1002/cmdc.201800242. [DOI] [PubMed] [Google Scholar]
- Couture J.-F. Collazo E. Hauk G. Trievel R. C. Nat. Struct. Mol. Biol. 2006;13:140–146. doi: 10.1038/nsmb1045. [DOI] [PubMed] [Google Scholar]
- Niu Y. Shi D. Li L. Guo J. Liu H. Yao X. Sci. Rep. 2017;7:46547–46557. doi: 10.1038/srep46547. [DOI] [PMC free article] [PubMed] [Google Scholar]
- Myrianthopoulos V. Cartron P. F. Liutkevičiūtė Z. Klimašauskas S. Matulis D. Bronner C. Martinet N. Mikros E. Eur. J. Med. Chem. 2016;114:390–396. doi: 10.1016/j.ejmech.2016.02.043. [DOI] [PubMed] [Google Scholar]
- Lang P. T., Moustakas D. T., Brozell S. R., Carrascal N., Mukherjee S., Balius T. E., Rizzo R. C. and Kuntz I. D., DOCK 6.6 User's Manual, 2013, http://dock.compbio.ucsf.edu/DOCK_6/dock6_manual.htm
- Schrödinger Release 2015-2, Maestro, Schrödinger, LLC, New York, NY, 2015 [Google Scholar]
- Case D., Babin V., Berryman J., Betz R., Cai Q., Cerutti D., Cheatham III T., Darden T., Duke R. and Gohlke H., AMBER 2014, University of California, San Francisco, CA, USA, 2014 [Google Scholar]
- Frisch M., Trucks G., Schlegel H. B., Scuseria G., Robb M., Cheeseman J., Scalmani G., Barone V., Mennucci B. and Petersson G., Gaussian, Inc., Wallingford CT, 2009 [Google Scholar]
- Bayly C. I. Cieplak P. Cornell W. Kollman P. A. J. Phys. Chem. 1993;97:10269–10280. doi: 10.1021/j100142a004. [DOI] [Google Scholar]
- Wang J. Wang W. Kollman P. A. Case D. A. J. Am. Chem. Soc. 2001;222:U403. [Google Scholar]
- Forester T. R. Smith W. J. Comput. Chem. 1998;19:102–111. doi: 10.1002/(SICI)1096-987X(19980115)19:1<102::AID-JCC9>3.0.CO;2-T. [DOI] [Google Scholar]
- Darden T. York D. Pedersen L. J. Chem. Phys. 1993;98:10089–10092. doi: 10.1063/1.464397. [DOI] [Google Scholar]
- Berendsen H. J. Postma J. v. van Gunsteren W. F. DiNola A. Haak J. J. Chem. Phys. 1984;81:3684–3690. doi: 10.1063/1.448118. [DOI] [Google Scholar]
- Desaphy J. r. m. Raimbaud E. Ducrot P. Rognan D. J. Chem. Inf. Model. 2013;53:623–637. doi: 10.1021/ci300566n. [DOI] [PubMed] [Google Scholar]
- Desaphy J. r. m. Rognan D. J. Chem. Inf. Model. 2014;54:1908–1918. doi: 10.1021/ci500282c. [DOI] [PubMed] [Google Scholar]
- Chen J. Wang J. Zhang Q. Chen K. Zhu W. J. Biomol. Struct. Dyn. 2015;33:2606–2618. doi: 10.1080/07391102.2014.1003146. [DOI] [PubMed] [Google Scholar]
- Hu H. Elstner M. Hermans J. Proteins: Struct., Funct., Bioinf. 2003;50:451–463. doi: 10.1002/prot.10279. [DOI] [PubMed] [Google Scholar]
- Wu R. Wang S. Zhou N. Cao Z. Zhang Y. J. Am. Chem. Soc. 2010;132:9471–9479. doi: 10.1021/ja103932d. [DOI] [PMC free article] [PubMed] [Google Scholar]
- Case D., Berryman J., Betz R., Cerutti D., Cheatham III T., Darden T., Duke R., Giese T., Gohlke H. and Goetz A., AMBER 2015, University of California, San Francisco, CA, USA, 2015 [Google Scholar]
- Tang B. Li B. Qian Y. Ao M. Guo K. Fang M. Wu Z. RSC Adv. 2017;7:17193–17201. doi: 10.1039/C6RA27740C. [DOI] [Google Scholar]
- Tang B. Li B. Li B. Li Z. Qin J. Zhou X. Qiu Y. Wu Z. Fang M. RSC Adv. 2017;7:39185–39196. doi: 10.1039/C7RA05959K. [DOI] [Google Scholar]
- Xiao B. Chun J. Wilson J. R. Walker P. A. Nature. 2003;421:652–656. doi: 10.1038/nature01378. [DOI] [PubMed] [Google Scholar]
- Meng F. Cheng S. Ding H. Liu S. Liu Y. Zhu K. Chen S. Lu J. Xie Y. Li L. J. Med. Chem. 2015;58:8166–8181. doi: 10.1021/acs.jmedchem.5b01154. [DOI] [PubMed] [Google Scholar]
- Del Rizzo P. A. Couture J.-F. Dirk L. M. Strunk B. S. Roiko M. S. Brunzelle J. S. Houtz R. L. Trievel R. C. J. Biol. Chem. 2010;285:31849–31858. doi: 10.1074/jbc.M110.114587. [DOI] [PMC free article] [PubMed] [Google Scholar]
- Horowitz S. Dirk L. M. Yesselman J. D. Nimtz J. S. Adhikari U. Mehl R. A. Scheiner S. Houtz R. L. Al-Hashimi H. M. Trievel R. C. J. Am. Chem. Soc. 2013;135:15536–15548. doi: 10.1021/ja407140k. [DOI] [PubMed] [Google Scholar]
- Mackerell A. D. J. Comput. Chem. 2004;25:1584–1604. doi: 10.1002/jcc.20082. [DOI] [PubMed] [Google Scholar]
- Yung-Chi C. Prusoff W. H. Biochem. Pharmacol. 1973;22:3099–3108. doi: 10.1016/0006-2952(73)90196-2. [DOI] [PubMed] [Google Scholar]
Associated Data
This section collects any data citations, data availability statements, or supplementary materials included in this article.


