Abstract
A series of gas-separation polyamide-poly(dimethylsiloxane) (PA-PDMS) membranes containing PDMS groups were synthesized through the polycondensation reaction. The structural characteristics of polymers were evaluated by 1H-NMR spectroscopy (NMR), Fourier-transform infrared spectroscopy (FTIR) and UV-vis absorption spectroscopy. The permeability and selectivity behavior was studied at different temperatures (25–55 °C) and pressures (1.0–3.0 atm), using various gases, such as H2, O2, CO2, CH4, and N2. The effect of chemical structure, PDMS content, operating pressure and temperature on gas permeability was explored and discussed. Gas-permeation measurements showed that polyamides containing PDMS groups exhibited different separation performance. The PA-PDMS-20 membrane with 20 wt% PDMS exhibited the highest selectivity (CO2/N2 = 41.84 and O2/N2 = 7.01) at 35 °C and 3.0 atm while CO2 and O2 permeability was 29.29 barrer and 4.91 barrer, respectively.
PA-PDMS membranes were synthesized by polycondensation reaction and the gas permeability was found to increase with an increase of PPG content, with the gas permeability of PA-PDMS-20 membrane reaching 29.29 at 35 °C and 3.0 atm.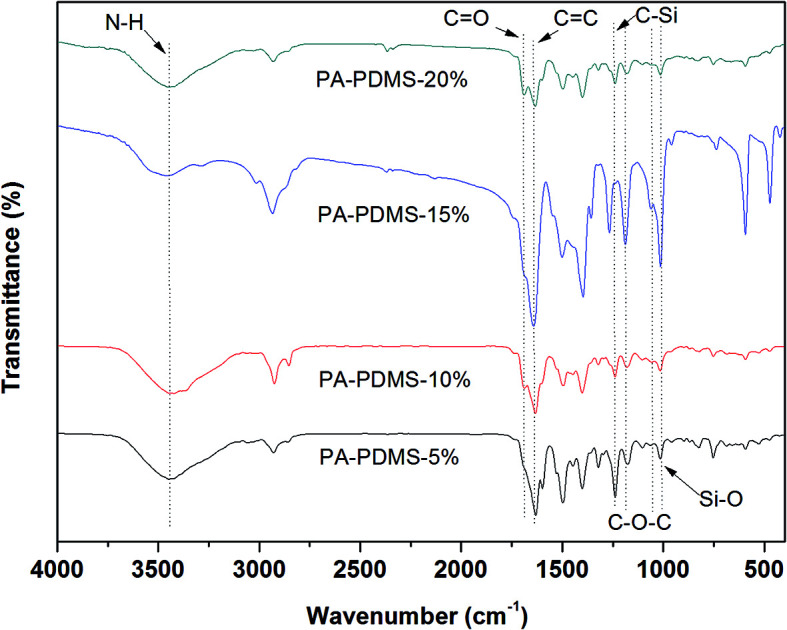
1. Introduction
Membrane-based gas separation techniques are of great interest due to their flexibility, low energy consumption, high reliability, and lower operating costs.1–3 Compared with other membrane materials, polymeric membranes have the advantages of easy fraction, low production cost, and excellent physical and mechanical properties.4–6 Polymer membranes have been used in CO2 recovery during oil recovery, oxygen and nitrogen separation from air, and natural gas sweetening.7–9 Among them, polyamide (PA) is considered as excellent material for gas separation.10–12 For example, Parthasarathi et al. have evaluated the gas transport properties for PAs containing a fluorinated biphenyl moiety.13 PA-I having a tert-butyl group showed the highest permeability CO2 (P = 42.60 barrer) and CO2/N2 selectivity (α = 20.29). PA membranes have also been indicated by Zhu et al. to have 12.26 barrer for CO2 permeability at 25 °C and 1 bar.14 In a similar manner, José Luis et al. reported that PAs containing a dibenzobarrelene pendant group show the lowest CO2 permeability (P = 2.96 barrer) and CO2/N2 selectivity (α = 8.4), and the highest CO2 permeability (P = 9.66 barrer) and CO2/N2 selectivity (α = 13.6).15 In another important work, R. Sulub-Sulub et al. synthesized and characterized a series of polyimide containing tert-butyl moieties. The DPt-TMPD membrane showed better performance in terms of selectivity CO2 permeability (2035 barrer).16 The above-mentioned comparison of copolymers demonstrates that polyamide is an excellent material for gas separation. Polydimethylsiloxane (PDMS) is a flexible rubbery polymer with a high free volume for gas transport. A very high permeability is hence expected for membranes prepared from PDMS. In order to enhance gas permeability, several approaches, including crosslinking or grafting of PDMS onto the polymer have been successfully applied. For instance, Yang et al. synthesized and characterized a series of SBS-PDMS crosslinked membranes.17 The CH4 permeability of SBS-c-PDMS-co-PMHS-70 sample has notably enhanced to 443.6 barrer at 25 °C and 1 bar as compared to 37.6 barrer over the pure SBS membrane. Hyelim et al. studied the crosslinked polyimide polydimethylsiloxane (PI-PDMS) copolymer membranes. These crosslinked copolymers exhibited excellent thermochemical stability and CO2 separation performance (PCO2 of 799 barrer and CO2/N2 permselectivity of 15.7).18
Based on the above design considerations, a series of PAs containing PDMS group were synthesized in the present work via polycondensation towards enhancing gas permeability. After FTIR, 1H NMR, and UV-visible absorption spectra characterizations, the single-gas (H2, O2, CO2, CH4, and N2) permeation properties of the membranes were evaluated at 25 °C and 1.0 atm. In addition, the effect of PDMS content on single-gas separation properties of membranes was extensively discussed. The gas permeability of the optimum PA-PDMS-20 membrane was further explored in a wide temperature (25–55 °C) and pressure (1.0–3.0 atm) range.
2. Experimental
2.1. Materials
All chemicals and reagents were used without further purification. 4,4′-Oxybis (benzoic acid) (OBA, 98%) were purchased from Meryer Chemical Technology Co., Ltd., China. Poly(dimethylsiloxane)bis(aminokyl) terminated (PDMS, Mw = 2000 g mol−1) was obtained from Aladdin (China). 4,4′-(9-Fluorenylidene)dianiline (9FDA) was synthesized according to the reported procedure.19N,N-Dimethylformamide (DMF), N,N-dimethylacetamide (DMAc), triphenyl phosphite (TPP, 99%), pyridine (Py, 99%) and calcium chloride were supplied by Tianjin Reagent Co., Ltd., China. Cylinders of CO2, CH4 and N2 gases (99.9%) were purchased from Gas Production Plant, Taiyuan, China.
2.2. Synthesis of PA-PDMS copolymers
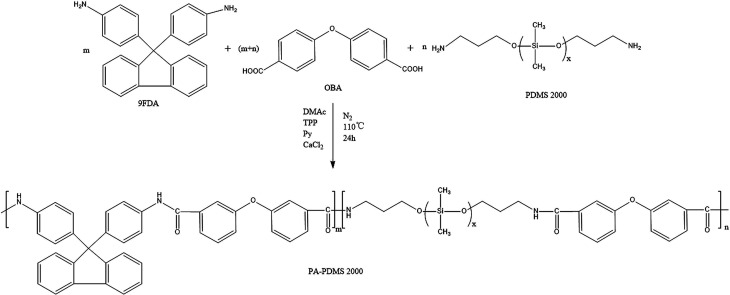
Polyamide-poly(dimethylsiloxane)s containing PDMS groups (PA-PDMS-x, x: weight content (wt%) of PDMS) are successfully synthesized via condensation copolymerization as shown in Scheme 1. A typical procedure for the synthesis of PA-PDMS-20 has as follows: a mixture of OBA (0.294 g, 1.14 mmol), 9FDA (0.368 g, 1.05 mmol), PDMS (0.166 g, 0.09 mmol), 1.4 mL of Py, TPP (1.4 mL, 5.34 mmol), 5 mL of DMAc and calcium chloride (0.36 g) were taken in a 100 mL round-bottom flask equipped with a reflux condenser and a nitrogen inlet. The reaction mixture was heated at 120 °C for 36 h under continuous stirring. Afterwards, it was poured slowly into 150 mL methanol to obtain the crude products. Finally, the crude products were filtered and washed several times with methanol followed by hot and cold deionized water to remove the adsorbed solvent and residual CaCl2. The final products were dried in a vacuum oven at 60 °C for 24 h. A series of PA-PDMS-x (as show in Scheme 1) were successfully synthesized using the same procedure as described for synthesis of PA-PDMS-10. The reaction conditions and properties of copolymer are listed in Table 1.
Scheme 1. Synthesis of PA-PDMS copolymers.
Yield, inherent viscosity, density and fractional free volume (FFV) of PA-PDMS copolymers.
| Polymer | Monomer feed (g) | Yield (%) | η inh (dL g−1) | ρ (g mL−1) | FFV | ||
|---|---|---|---|---|---|---|---|
| OBA | 9FDA | PDMS | |||||
| PA-PDMS-5 | 0.294 | 0.393 | 0.036 | 96.3 | 4.694 | 1.114 | 0.212 |
| PA-PDMS-10 | 0.294 | 0.386 | 0.076 | 95.5 | 4.332 | 1.119 | 0.207 |
| PA-PDMS-15 | 0.294 | 0.378 | 0.118 | 97.1 | 4.018 | 1.125 | 0.203 |
| PA-PDMS-20 | 0.294 | 0.368 | 0.166 | 95.8 | 4.676 | 1.130 | 0.197 |
2.3. Preparation of PA-PDMS copolymer membranes
PA-PDMS-x (0.2 g) was dissolved in DMAc (25 mL) to obtain an 8% solution. The solution was placed on a flat glass plate and dried in oven at 80 °C for 24 h to obtain a thin (50–70 μm thick), transparent and tough membrane.
2.4. Characterization
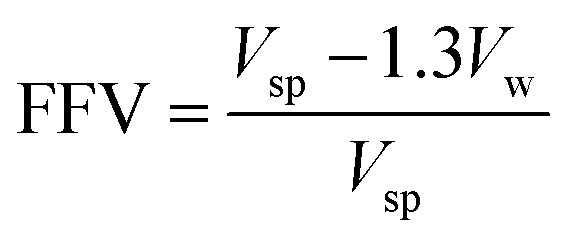
FTIR measurements were recorded on a Bruker TENSOR II FTIR spectrometer (Germany) in the range of 4000–400 cm−1. 1H NMR spectra were performed on a 400 MHz Bruker AVANCE IIITM NMR spectrometer (Germany) using DMSO-d6 as solvent at room temperature. The solubility of each polymer was tested by dissolving 20 mg of polymer in 1 mL of different solvents, followed by continuous stirring for 24 h at room temperature. Inherent viscosities (ηinh) were determined using an Ubbelohde viscometer (JC522-1835, China) at 30 ± 0.1 °C with NMP as solvent at a concentration of 0.5 g dL−1. UV-visible absorption spectra of the polymers were recorded on a Metash UV-8000A spectrometer (China) using DMF as solvent in a wavelength range of 200–600 nm. The density (ρ) of the PA-PDMS copolymers was estimated in a density gradient column (Techne Corp) based on aqueous calcium nitrate solutions, between 1.0 and 1.3 (g mL−1) at 25 °C. The fractional free volume (FFV) was calculated by the following eqn (1):20
 |
1 |
where Vsp is the specific volume (Vsp = 1/ρ) and Vw is the van der Waals volume determined using Bondi's group contribution method.15 In the case of copolymers, Vw was estimated by Vw = x1Vw1 + x2Vw2, where x1 and x2 are the molar fractions of the polyamide segments and PPG segments, respectively; Vw1 and Vw2 are the van der Waals volumes for the two segments, respectively. Mechanical properties of the membranes were measured using a Shimadzu Autograph AGS-X 500 N tensile testing instrument with a strain rate of 5% min−1 at room temperature. The rectangular specimens were fabricated with an initial width of 8 mm, gauge length of 30 mm and thickness of 30–50 lm.
2.5. Gas permeability measurements
Gas permeability of the membranes was performed using a gas permeability device (VAC-V2, Labthink Instruments Company, China). Gas permeation properties of the membranes were determined using five gases, i.e. CO2, CH4 and N2, at a feed pressure of 1.0 atm and different temperatures (25–55 °C). The permeability (P) of each gas was calculated by the eqn (2):21
 |
2 |
where P is the gas permeability (barrer) (1 barrer = 1 × 10⁻¹⁰ cm3 (STP) cm (cm−2 s−1 cmHg−1)); ΔP is the trans-membrane pressure difference (Pa); A is the effective membrane area (cm2), T is the operating temperature (K); l is the membrane thickness (cm); V is the downstream volume (cm3) and dp/dt is the rate of the pressure rise under the steady state.
Lag method using the following equation:
| D = L2/6θ | 3 |
where D is the diffusion coefficient (108 cm2 s−1), L is the membrane thickness, and θ is the time lag, which is given by the intercept of the asymptotic line of time–pressure curve to the time axis.
The S value was calculated by using equation:
| S = P/D | 4 |
where S is the solubility coefficient (103 cm3 STP cm−3 cmHg−1).
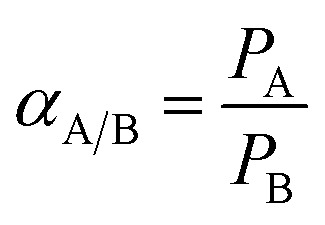
The ideal selectivity (α) of one penetrant (A) over another (B) is given by:
 |
5 |
3. Results and discussion
3.1. Synthesis and characterization of PA-PDMS copolymers
The PA-PDMS copolymers were synthesized by polycondensation reaction as illustrated in Scheme 1. The density and FFV values of polymers were summarized in Table 1. The density values of PA-PDMS copolymers were in the range of 1.114–1.130 g mL−1, while their FFV values varied from 0.197 to 0.212. As expected, the FFV values of the PA-PDMS copolymers gradually decreased with the increase of PDMS content, due to the cracks of polymer chains filled with the flexible PDMS soft segments.
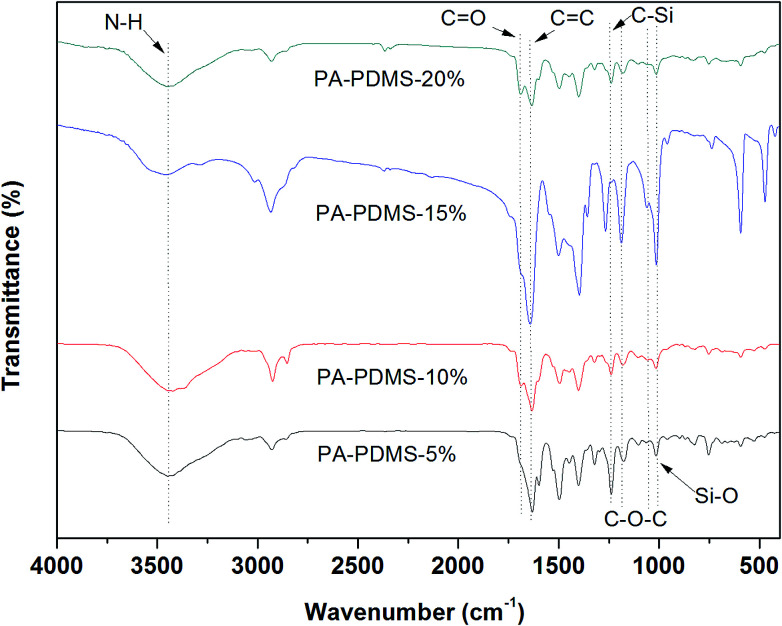
The chemical structure of the PA-PDMS-x samples was confirmed based on the FTIR spectra in Fig. 1. The bands at 1635, 1184, and 1163 cm−1 belong to aromatic C C stretching vibration,22 C–O–C stretching vibration of OBA, respectively. On the other hand, the swing at 1251 cm−1 and 1009 cm−1 can be attributed to –Si–O–Si– and –Si(CH3)2–O– in PDMS. The N–H and C O stretching vibrations from amide groups were observed approximately at 3442 and 1668 cm−1, respectively.
Fig. 1. FTIR spectra of PA-PDMS copolymers.
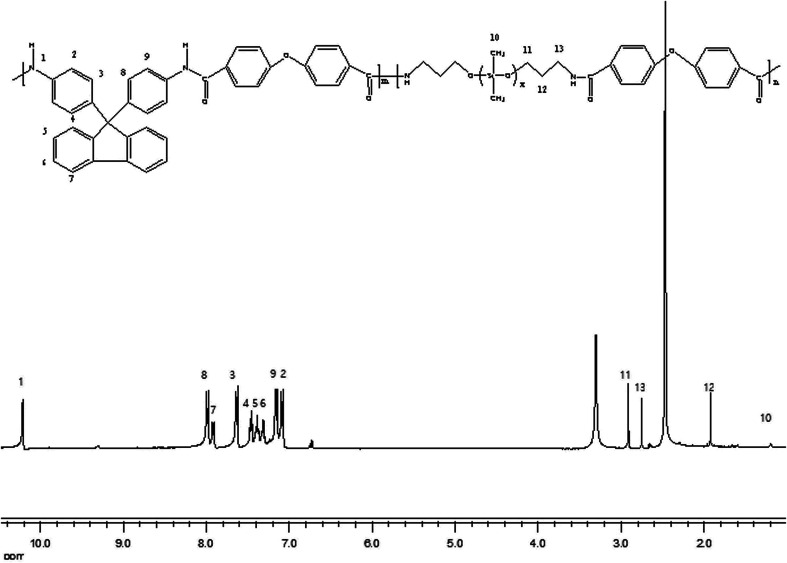
The chemical structure of the PA-PDMS-5 was further examined by 1H NMR with DMSO-d6 as the solvent. The 1H-NMR spectra of PA-PDMS-5 sample is shown in Fig. 2. A group of peaks at 7.0–8.1 ppm are due to the aromatic protons of benzene ring.23 The peaks at 1.2 ppm are assigned to 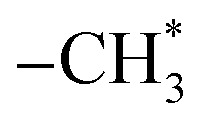 groups protons of PDMS.24 In addition, the peak at 10.2 ppm is originated by amide group proton, indicating the successful synthesis of PA-PDMS copolymers. The mechanical properties of the membranes were measured at room temperature (Table 2). The membranes samples of PA-PDMS-x showed higher tensile strength (18–23 MPa) and lower strain (30–51%). These data indicate these membranes are strong and tough enough to be applied as membrane for gas separation.
Fig. 2. 1H NMR spectra of PA-PDMS-10.
Mechanical properties of PA-PDMS-x membranes.
| Polymer | Tensile strength (MPa) | Elongation at break (%) |
|---|---|---|
| PA | 22 | 36 |
| PA-PDMS-5 | 23 | 30 |
| PA-PDMS-10 | 21 | 44 |
| PA-PDMS-15 | 25 | 26 |
| PA-PDMS-20 | 18 | 51 |
3.2. UV-vis absorption analysis
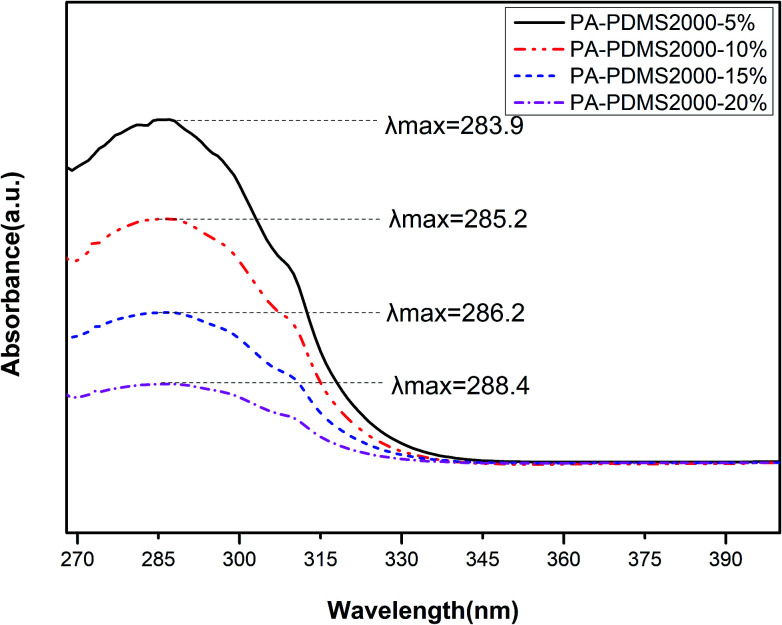
UV-vis absorption spectrum is a useful method to analyze molecular interactions.25 UV-vis absorption bands of PA-PDMS copolymers were performed in DMF solvent at room temperature and the results are presented in Fig. 3. As shown in Fig. 3, polymers exhibited similar absorption bands between 268 and 340 nm, indicating that the center of absorption bands is related to intramolecular and intermolecular charge-transfer interactions. Furthermore, the maximum absorption band (λmax) of PA-PDMS copolymers tend to red-shifted towards higher wavelength with the increase in PDMS content. The short absorption band is generally found in the intramolecular charge-transfer complexes, whereas the intermolecular charge-transfer occurs in the long absorption band.26 The following order, in relation to λmax values, was obtained: PA-PDMS-5 < PA-PDMS-10 < PA-PDMS-15 < PA-PDMS-20. Therefore, the order of the intermolecular interaction strength of polymers is PA-PDMS-5 < PA-PDMS-10 < PA-PDMS-15 < PA-PDMS-20. The strong intermolecular interaction resulted in the reduction of the distance between polymer chains, and hence to a decrease of FFV values. Obviously, the order of λmax values is opposite to that of FFV values.
Fig. 3. UV-vis absorption bands of PA-PDMS copolymers.
3.3. Effect of PDMS groups on gas permeability
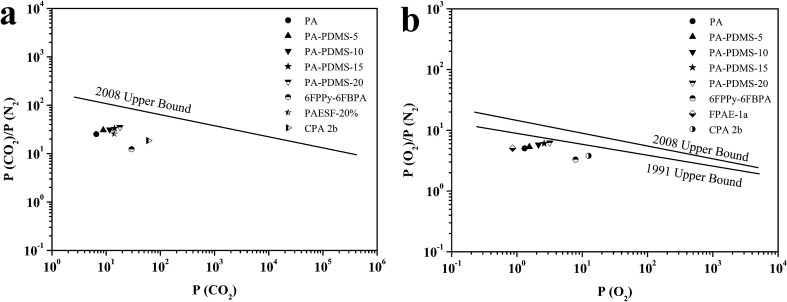
Permeation measurements were carried out using pure H2, O2, CO2, N2 and CH4 at different pressures and temperatures. To investigate the effect of PDMS groups on gas permeability, a series of polyamide-poly(dimethylsiloxane)s containing PDMS groups were fabricated. The permeability of all gases at different PDMS contents is shown in Table 3. We can see that the gas permeability of the membrane increased with the increase of PDMS content, which is due to the high flexibility of –O–Si–O– bonds of PDMS. As the PDMS content increases from 5% to 20%, an increase in the CO2 permeability was observed for the PA-PDMS-x membranes. For instance, PA-PDMS-20 membrane exhibits a permeability of 18.02 barrer at 25 °C and 1.0 atm, which is much higher than that of PA-PDMS-5 membrane (8.87 barrer). A similar permeability behavior was observed for the rest gases (H2, O2, N2, CH4). The selectivity of PA-PDMS-x membranes in relation to relevant gas-pairs is listed in Table 4. As shown in Table 4, the selectivity increases monotonously with increasing PDMS content. The PA-PDMS-20 membrane exhibits higher selectivity for the CO2/N2 (35.33) and O2/N2 (6.25) gas-pairs. This can be explained by kinetic diameter that the easier diffusion of CO2 and O2, due to their lower kinetic diameter (H2 2.89 Å, CO2 3.3 Å, O2 3.46 Å, N2 3.64 Å, and CH4 3.8 Å). The permselectivity for the relevant gas pairs, CO2/N2 and O2/N2versus P(CO2) and P(O2) of PA-PDMS-x membranes are plotted in the Robeson permeability/selectivity trade-off plots, as shown in Fig. 4. The fabricated PA-PDMS-x membranes exhibited very promising results, for CO2/N2 gas pairs, the data point of PA-PDMS-20 was close to the Robeson line in 2008 and for O2/N2 gas pairs which was close to the Robeson line in 1991.27–30
Gas permeability of PA-PDMS copolymer membranes at 25 °C and 1.0 atma.
| Polymer | P(H2) | P(CO2) | P(O2) | P(CH4) | P(N2) |
|---|---|---|---|---|---|
| PA | 8.09 ± 0.19 | 6.58 ± 0.11 | 1.31 ± 0.03 | 0.32 ± 0.05 | 0.26 ± 0.01 |
| PA-PDMS-5 | 10.53 ± 0.38 | 8.87 ± 0.42 | 1.55 ± 0.11 | 0.37 ± 0.08 | 0.29 ± 0.01 |
| PA-PDMS-10 | 13.92 ± 0.21 | 11.65 ± 0.51 | 2.14 ± 0.09 | 0.45 ± 0.03 | 0.37 ± 0.05 |
| PA-PDMS-15 | 17.67 ± 0.59 | 14.31 ± 0.72 | 2.61 ± 0.06 | 0.53 ± 0.01 | 0.43 ± 0.02 |
| PA-PDMS-20 | 22.14 ± 0.93 | 18.02 ± 0.86 | 3.19 ± 0.15 | 0.66 ± 0.12 | 0.51 ± 0.09 |
Gas permeability (P) in barrer. 1 barrer = 10−10 cm3 (STP) cm−1 cm−2 s−1 cmHg−1.
Selectivity of PA-PDMS copolymer membranes at 25 °C and 1.0 atm.
| Polymer | α(H2/N2) | α(H2/CH4) | α(CO2/N2) | α(CO2/CH4) | α(O2/N2) |
|---|---|---|---|---|---|
| PA | 31.16 ± 1.91 | 25.28 ± 1.02 | 25.31 ± 0.98 | 20.56 ± 1.29 | 5.04 ± 0.21 |
| PA-PDMS-5 | 36.31 ± 1.35 | 28.46 ± 1.82 | 30.57± 1.24 | 23.97 ± 0.98 | 5.35 ± 0.25 |
| PA-PDMS-10 | 37.62 ± 0.97 | 30.93 ± 1.34 | 31.47 ± 1.11 | 25.89 ± 1.51 | 5.78 ± 0.23 |
| PA-PDMS-15 | 40.09 ± 1.58 | 33.34 ± 1.26 | 33.28 ± 1.23 | 27.00 ± 1.37 | 6.07 ± 0.22 |
| PA-PDMS-20 | 43.41 ± 1.46 | 33.55 ± 1.08 | 35.33 ± 1.16 | 27.30 ± 1.12 | 6.25 ± 0.23 |
Fig. 4. Permeability selectivity trade-off map for (a) CO2/N2 separation and (b) O2/N2 separation.
3.4. Effect of operating temperature
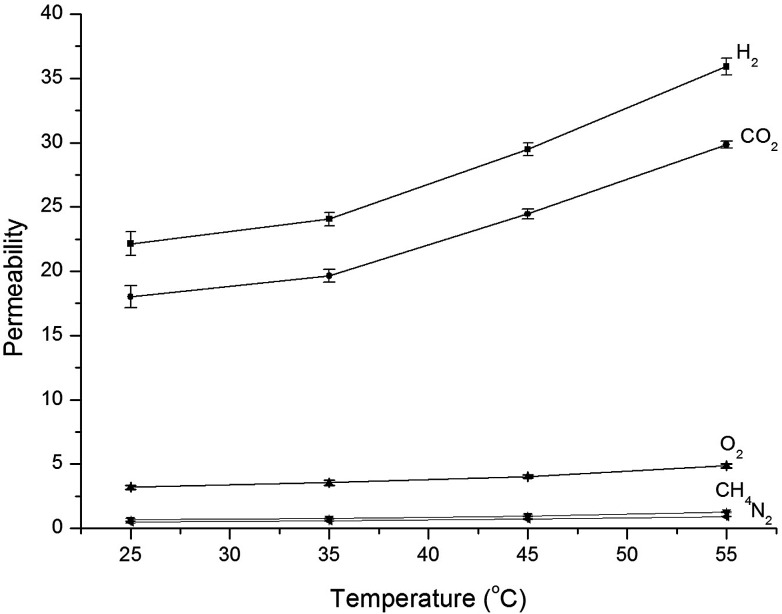
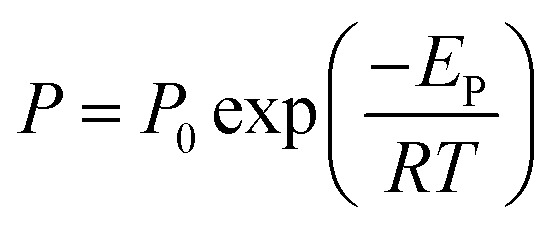
The temperature dependence of gas permeability and selectivity of PA-PDMS-20 was investigated in the temperature range of 25–55 °C at a constant pressure of 1.0 atm. The PA-PDMS-20 membrane was selected for further investigation, since it exhibited the best separation performance. The corresponding results are presented in Fig. 5. As shown in Fig. 5, the permeability of PA-PDMS-20 gradually increased with the increase of operating temperature. For instance, the CO2 gas permeability has increased by ca. 40%, i.e. from 18.02 to 29.83 barrer (Table 5). This results are in accordance to Arrhenius eqn (4):
 |
6 |
where P is gas permeability coefficient; P0 is the pre-exponential coefficients R is 8.314 J mol−1 K−1; EP is the apparent activation energy for permeation process; and T is the absolute temperature (K). The improvement in gas permeability was mainly attributed to the following reasons: (i) the thermodynamic energy of gas molecules is increased with temperature, resulted in an increase of jumping frequency; (ii) the mobility between polymer chains is increased with temperature increase, resulted to an increase of fractional free volume and molecules transport.
Fig. 5. Gas permeability of PA-PDMS-20 at different temperatures.
Permeation activation energy (EP) of PA-PDMS-20 membrane.
| Polymer | E P (kJ mol−1) | ||||
|---|---|---|---|---|---|
| CO2 | H2 | O2 | N2 | CH4 | |
| RPA-PPG (20%) | 11.29 | 13.37 | 13.99 | 16.31 | 17.97 |
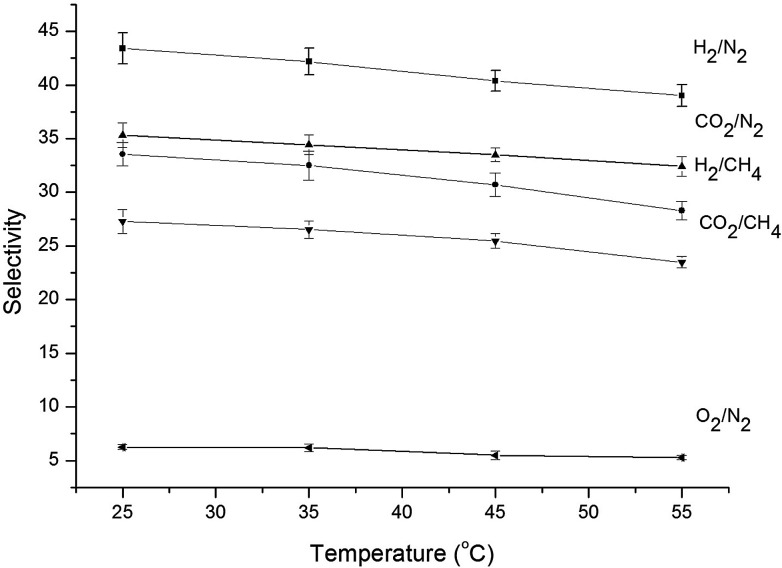
The selectivity of PA-PDMS-20 membrane gradually decreased with the increase of temperature as shown in Fig. 6. The permeation activation energy (EP) of PA-PDMS-20 membrane for H2, O2, CO2, CH4 and N2 is shown in Table 5. As illustrated in Table 5, the order of permeation activation energy was EP(CO2) < EP(H2) < EP(O2) < EP(N2) < EP(CH4). This order is exactly opposite to the permeability coefficient: P(CO2) > P(H2) > P(O2) > P(N2) > P(CH4). Gas penetrant with higher permeation activation energy led to an enhanced permeability with the increase in operating temperature, which in turn resulted in a decreased selectivity.31
Fig. 6. Gas selectivity of PA-PDMS-20 at different temperatures.
3.5. Effect of operating pressure
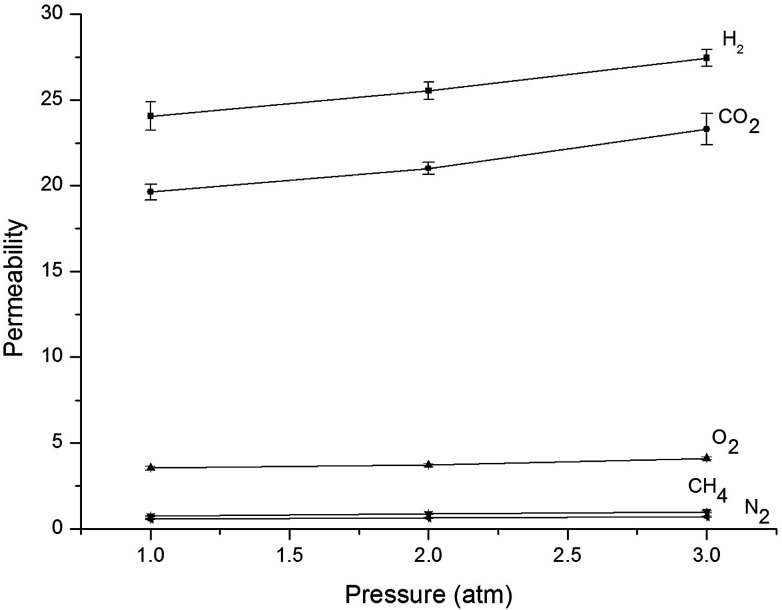
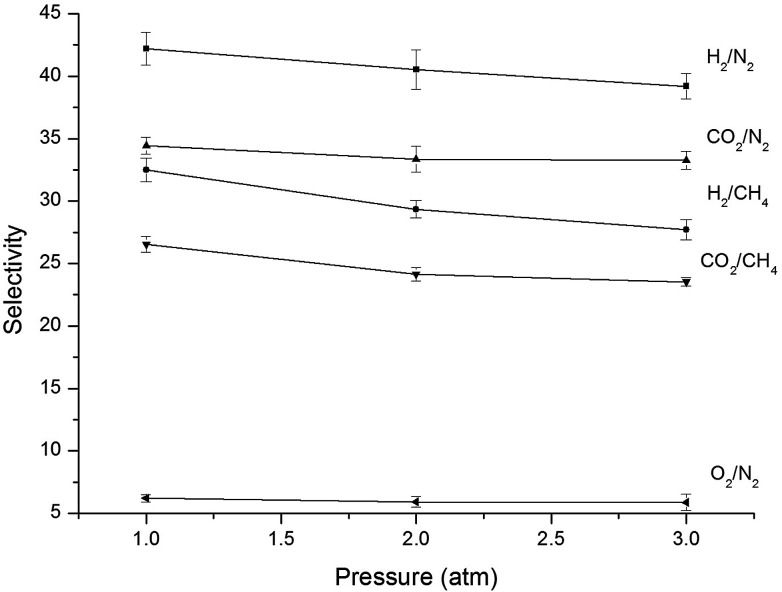
The impact of pressure was assessed by employing H2, O2, CO2, CH4, and N2 at 35 °C in a pressure range of 1.0–3.0 atm [Fig. 7]. It is evident that the permeability of all gases (H2, O2, CO2, CH4, N2) increases with pressure. This phenomenon was observed for glassy materials at high pressure, where the contribution of the Langmuir region to the overall permeability diminishes and gas permeability approaches a constant value associated with simple dissolution (Henry's law) transport.32 Koros and Paul suggested the immobilization theory for the correlation between pressure and solubility and diffusivity coefficients. This model indicates in general that the CO2 and CH4 diffusivity coefficients increased with pressure whereas their solubility coefficients decreased upon increasing pressure.33,34 The diffusion coefficients at different pressures obtained in the present work are shown in Table 6. As shown in Fig. 7 and Table 6, the N2 and CO2 permeability of PA-PDMS-20 membrane increased by about 11.4 and 33.0%, respectively, by increasing the pressure from 1.0 to 3.0 atm. On the other hand, the diffusion coefficient declined by about 38.7% and 25% for CO2 and N2, respectively, by increasing the pressure from 1.0 to 3.0 atm. A similar behaviour was observed for the rest gases. Fig. 8 shows the effect of pressure on ideal selectivity at 35 °C, which is increased upon pressure increase. This is because gas penetrants with smaller diameter offer higher permeability upon pressure increase, which consequently leads to a higher selectivity.
Fig. 7. Gas permeability of PA-PDMS-20 at different pressures.
The effects of pressure on diffusivity coefficient and solubility coefficient of PA-PDMS-20.
| Pressure (atm) | Diffusion coefficienta | Solubility coefficientb | ||||||||
|---|---|---|---|---|---|---|---|---|---|---|
| H2 | CO2 | O2 | CH4 | N2 | H2 | CO2 | O2 | CH4 | N2 | |
| 1.0 | 6.04 | 4.10 | 1.65 | 0.32 | 0.27 | 3.98 | 4.79 | 2.15 | 2.31 | 2.11 |
| 2.0 | 7.66 | 5.37 | 2.27 | 0.39 | 0.31 | 3.72 | 4.62 | 1.88 | 2.23 | 2.03 |
| 3.0 | 9.19 | 6.69 | 2.85 | 0.45 | 0.36 | 3.68 | 4.38 | 1.72 | 2.20 | 1.94 |
Diffusivity coefficient, 108 cm2 s−1.
Solubility coefficient, 103 cm3 STP cm−3 cmHg−1.
Fig. 8. Gas selectivity of PA-PDMS-20 at different pressures.
4. Conclusions
In summary, a series of copolymers with different PDMS content were synthesized though polycondensation reaction. The chemical structure of PA-PDMSs was characterized by FTIR and 1H NMR. The gas permeability of PA-PDMSs was investigated in a wide temperature and pressure range. CO2 permeability gradually increased upon increasing operating temperature and PDMS content, while CO2/N2 selectivity progressively decreased. The best performance was obtained for PA-PDMS-20, which showed the highest selectivity (CO2/N2 = 41.84 and O2/N2 = 7.01) at 35 °C and 3 atm, accompanied by CO2 and O2 permeability values as high as 29.29 and 4.91 barrer, respectively.
Conflicts of interest
There are no conflicts to declare.
Supplementary Material
References
- Bernardo P. D. E. Golemme G. Ind. Eng. Chem. Res. 2009;48:4638. doi: 10.1021/ie8019032. [DOI] [Google Scholar]
- Gin D. L. Noble R. D. Science. 2011;332:674. doi: 10.1126/science.1203771. [DOI] [PubMed] [Google Scholar]
- Mondal A. Mandal B. J. Membr. Sci. 2014;460:126. doi: 10.1016/j.memsci.2014.02.040. [DOI] [Google Scholar]
- Carta M. Croad M. Malpass-Evans R. Jansen J. C. Bernardo P. Clarizia G. Friess K. Lan M. McKeown N. B. Adv. Mater. 2014;26:3526. doi: 10.1002/adma.201305783. [DOI] [PMC free article] [PubMed] [Google Scholar]
- Wiegand J. R. Smith Z. P. Liu Q. Patterson C. T. Freeman B. D. Guo R. J. Mater. Chem. A. 2014;2:13309. doi: 10.1039/C4TA02303J. [DOI] [Google Scholar]
- Budd P. M. McKeown N. B. Polym. Chem. 2010;1:63. doi: 10.1039/B9PY00319C. [DOI] [Google Scholar]
- Álvaro A. Ramírez-Santos M. Bozorg B. Addis V. Piccialli C. Castel E. F. J. Membr. Sci. 2018;566:346. doi: 10.1016/j.memsci.2018.08.024. [DOI] [Google Scholar]
- He Z. Y. Yuan R. H. Zhang Y. Wang W. D. Gao J. F. Chen C. H. Wu H. Liu X. J. Zhan Z. L. Ind. Eng. Chem. Res. 2017;56:14604. doi: 10.1021/acs.iecr.7b02758. [DOI] [Google Scholar]
- Zhang C. L. Fu L. X. Tian Z. K. Cao B. Li P. J. Membr. Sci. 2018;556:277. doi: 10.1016/j.memsci.2018.04.013. [DOI] [Google Scholar]
- Ding X. L. Tan F. F. Zhao H. Y. Hua M. M. Wang M. X. Xin Q. P. Zhang Y. Z. J. Membr. Sci. 2019;570:53. doi: 10.1016/j.memsci.2018.10.033. [DOI] [Google Scholar]
- Awad A. Aljundi I. H. Korean J. Chem. Eng. 2018;35:1700. doi: 10.1007/s11814-018-0079-8. [DOI] [Google Scholar]
- Ma X. H. Yao Z. K. Yang Z. Guo H. Xu Z. L. Tang C. Y. Y. Environ. Sci. Technol. Lett. 2018;5:123. doi: 10.1021/acs.estlett.8b00016. [DOI] [Google Scholar]
- Parthasarathi B. Debaditya B. Susanta B. Sep. Purif. Technol. 2013;104:138. doi: 10.1016/j.seppur.2012.11.007. [DOI] [Google Scholar]
- Zhu T. Y. Yang X. He X. Q. Zheng Y. Y. Luo J. J. High Perform. Polym. 2018;30:821. doi: 10.1177/0954008317732121. [DOI] [Google Scholar]
- José L. S. G. José M. P. F. María I. L. B. Manuel A. V. Des. Monomers Polym. 2015;18:350. doi: 10.1080/15685551.2015.1012624. [DOI] [Google Scholar]
- Sulub-Sulub R. Loría-Bastarrachea M. I. Vázquez-Torres H. Santiago-García J. L. Aguilar-Vega M. J. Membr. Sci. 2018;563:134. doi: 10.1016/j.memsci.2018.05.054. [DOI] [PMC free article] [PubMed] [Google Scholar]
- Yang X. Zhu T. Y. Xu Z. X. Shan H. Q. Luo J. J. React. Funct. Polym. 2018;124:48. doi: 10.1016/j.reactfunctpolym.2018.01.009. [DOI] [Google Scholar]
- You H. Hossaina I. Kim T. H. RSC Adv. 2018;8:1328. doi: 10.1039/C7RA10949K. [DOI] [PMC free article] [PubMed] [Google Scholar]
- Biolley N. Gregoire M. Pascal T. Sillicn B. Polymer. 1991;32:3256. doi: 10.1016/0032-3861(91)90150-H. [DOI] [Google Scholar]
- Luo S. J. Stevens K. A. Park J. S. Moon J. Liu Q. Freeman B. D. Guo R. L. ACS Appl. Mater. Interfaces. 2016;8:2306. doi: 10.1021/acsami.5b11355. [DOI] [PubMed] [Google Scholar]
- Kammakakam I. Nam S. Kim T. H. RSC Adv. 2016;6:31083. doi: 10.1039/C6RA00735J. [DOI] [Google Scholar]
- Sanders D. F. Smith Z. P. Guo R. L. Robeson L. M. McGrath J. E. Paul D. R. Freeman B. D. Polymer. 2013;54:4729. doi: 10.1016/j.polymer.2013.05.075. [DOI] [Google Scholar]
- Bisoi S. Mandal A. K. Padmanabhan V. Banerjee S. J. Membr. Sci. 2017;522:77. doi: 10.1016/j.memsci.2016.09.007. [DOI] [Google Scholar]
- Luo J. J. Zhu T. Y. Song Y. H. Si Z. Q. Polymer. 2017;127:52. doi: 10.1016/j.polymer.2017.08.060. [DOI] [Google Scholar]
- Garca M. G. Marchese J. Ochoa N. A. J. Appl. Polym. Sci. 2017;134:4682. [Google Scholar]
- Masatoshi H. Masakatsu K. Itaru M. Rikio Y. Eur. Polym. J. 1989;25:349. doi: 10.1016/0014-3057(89)90148-1. [DOI] [Google Scholar]
- Xu Z. K. Dannenberg C. Springer J. Banerjee U. Maier G. J. Membr. Sci. 2002;205:23. doi: 10.1016/S0376-7388(02)00045-5. [DOI] [Google Scholar]
- Luo J. J. Guo R. Q. Zhang M. Li J. P. High Perform. Polym. 2016;28:1005. doi: 10.1177/0954008315620287. [DOI] [Google Scholar]
- Tkachenko I. M. Belov N. A. Yakovlev Y. V. Vakuliuk P. V. Shekera O. V. Yampolskii Y. P. Shevchenko V. V. Mater. Chem. Phys. 2016;183:279. doi: 10.1016/j.matchemphys.2016.08.028. [DOI] [Google Scholar]
- Santiago-Garciaa J. L. Pérez-Franciscoa J. M. Zolotukhinb M. G. Vázquez-Torresc H. Aguilar-Vegaa M. González-Díaz M. O. J. Membr. Sci. 2017;522:333. doi: 10.1016/j.memsci.2016.09.035. [DOI] [Google Scholar]
- Wang S. Liu Y. Huang S. Wu H. Li Y. Tian Z. Jiang Z. J. Membr. Sci. 2014;460:62. doi: 10.1016/j.memsci.2014.02.036. [DOI] [Google Scholar]
- Khan M. M. Filiz V. Bengtson G. Shishatskiy S. Rahman M. M. Lillepaerg J. Abetz V. J. Membr. Sci. 2013;436:109. doi: 10.1016/j.memsci.2013.02.032. [DOI] [Google Scholar]
- Xing R. Winston H. W. S. J. Taiwan Inst. Chem. Eng. 2009;40:654. doi: 10.1016/j.jtice.2009.05.004. [DOI] [Google Scholar]
- Koros W. J. Paul D. R. Rocha A. A. J. Polym. Sci., Part B: Polym. Phys. 1976;14:687. [Google Scholar]


