Abstract
Sn-aminoclay (SnAC)-templated Fe3O4 nanocomposites (SnAC–Fe3O4) were prepared through a facile approach. The morphology and macro-architecture of the fabricated SnAC–Fe3O4 nanocomposites were characterized by different techniques. A constructed meso/macro-porous structure arising from the homogeneous dispersion of Fe3O4 NPs on the SnAC surface owing to inherent NH3+ functional groups provides new conductive channels for high-efficiency electron transport and ion diffusion. After annealing under argon (Ar) gas, most of SnAC layered structure can be converted to SnO2; this carbonization allows for formation of a protective shell preventing direct interaction of the inner SnO2 and Fe3O4 NPs with the electrolyte. Additionally, the post-annealing formation of Fe–O–C and Sn–O–C bonds enhances the connection of Fe3O4 NPs and SnAC, resulting in improved electrical conductivity, specific capacities, capacity retention, and long-term stability of the nanocomposites. Resultantly, electrochemical measurement exhibits high initial discharge/charge capacities of 980 mA h g−1 and 830 mA h g−1 at 100 mA g−1 in the first cycle and maintains 710 mA h g−1 after 100 cycles, which corresponds to a capacity retention of ∼89%. The cycling performance at 100 mA g−1 is remarkably improved when compared with control SnAC. These outstanding results represent a new direction for development of anode materials without any binder or additive.
Sn-aminoclay (SnAC)/Fe3O4 NPs – a promising hybrid electrode to offer great electrochemical performance with a high initial discharge of 980 mA h g−1 and good capacity retention of 89% after 100 cycles.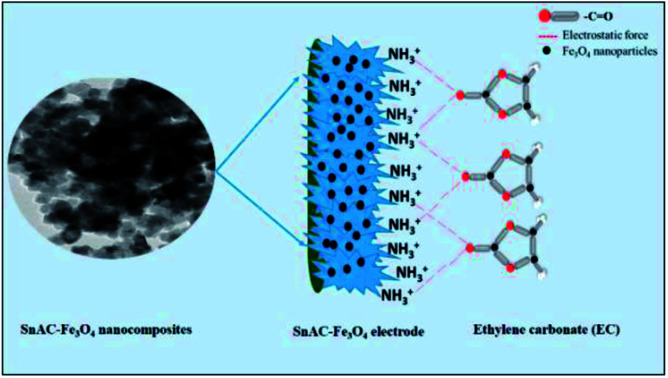
Introduction
Lithium-ion batteries (LIBs), thanks to their high specific energy density, long lifespan, and environmental benignity, are considered to be the dominant energy storage systems among the many employed in portable electronics and electric vehicles. However, the continuous surge necessary to satisfy the ever-increasing demand for high-performance, long-life, and low-cost power systems cannot be supplied by traditional graphitic carbon-based anodes. Therefore, worldwide efforts have been devoted to the search for alternative anode materials that can deliver improved energy density and safety. Specifically, remarkably improved charge/discharge rate capability in LIBs requires new nanomaterials and suitable nanostructures.
Transition metal oxides (TMOs) have been investigated and fabricated in various morphologies in efforts to replace graphite for LIBs. Among the TMOs, magnetite nanoparticles (Fe3O4 NPs) have attracted much attention in the field of electrochemical materials owing to particular advantages including high abundance, environmental benignity, low cost, biocompatibility, low toxicity, high electronic conductivity as well as high storage capacity (926 mA g h−1).1 However, Fe3O4 NPs, like other TMOs, have drawbacks arising from the aggregation and huge volume expansion due to the strong anisotropic dipolar interactions and the mechanism of the structural changes of both active materials and electrodes during the charge/discharge process.1–3 These issues cause cracking, fracture, and pulverization of NPs, leading to loss of their dispersibility and specific properties, rapid capacity decay as well as instability of the solid electrolyte interface (SEI). Hybridization between carbonaceous materials (with their high electrical conductivity and large surface area) and TMOs (with their high capacity density) is an effective approach to address those challenges in mitigating adverse mechanical effects and enhancing electrochemical performance. In recent years, a large number of studies following this strategy have been reported; however, carbonaceous materials still show limitations in the synthesis processes, which unfortunately are rather complicated and require expensive, special equipment and non-eco-friendly solvents.4 Furthermore, the scarcity of functional groups on the surface of carbonaceous materials for direct immobilization of TMOs has resulted in unstable supports. So, although the development and discovery of new materials has been much reported, further improvements to cycle stability, electrochemical performance, and the contact between electrode materials and the electrolyte are required.
Aminoclay (AC) is a layered material that is widely utilized in many different applications ranging from the environment to biology, catalysis, pharmaceutics and, especially, energy, owing to its unique and unprecedented physical, chemical, optical, magnetic and mechanical properties.5,6 In a report on the application of AC, Datta et al. showed that AC polymer nanocomposites significantly enhanced mechanical properties, ionic conductivity, gas barrier properties, and the reduction of thermal expansion.5 Besides, other interesting features of AC compared with other materials are its simple fabrication and low-toxicity under room temperature via a series of studies on AC's utilization in DNA transformation materials, gene expression, and assembly guest biomolecules.7–9 With its flexible layered structure that contains a large number of surface amino functional groups, in polar solvents, namely water, protonation of these inherent amino groups helps full delamination of layers within AC, which causes their uniform dispersion in water. More importantly, with its large number of such amino-functional groups, AC is considered to be an attractive candidate for supporting of the stabilization of metal nanoparticles. Some previous studies have pointed out that the interaction between metal nanoparticles on the AC matrix is so strong that not even metal nanoparticles can be separated from the AC.10,11
Unfortunately, to this day, although AC possesses many outstanding features are promising to replace traditional materials; namely, carbon material in energy applications, it has not been studied in detail and widely in any specific energy application. With flexible layered structure and outstanding ability in supporting of the stabilization of metal nanoparticles, this can lead to facilitate easy penetration of ions and electrons into material structure. In addition, it supports in regulating huge volume change, as well as the formation of stable SEI film on the surface, and effectively prevents the aggregation of nanoparticles. Actually, this research is the first time to describe in detail AC application as anode material for LIBs. A novel architecture of an improved anode electrode for lithium-ion batteries (LIBs) was developed from AC and Fe3O4 NPs, the AC functioning as an effective matrix in which the Fe3O4 nanoparticles can be anchored. The organic group of the organtrialkoxysilane and cationic metal precursor of Sn2+ were selected for synthesis of the AC, without addition of any acid/base catalyst at room temperature. Owing to the functional groups on the SnAC surface in aqueous solution, the Fe3O4 NPs, as synthesized by the co-precipitation method, were uniformly dispersed on the SnAC layers without aggregation.12,13 Then, SnAC–Fe3O4 nanocomposites were annealed under Ar gas at 500 °C in order to improve the crystallinity of the Fe3O4 phase and to convert most of the SnAC architecture to crystalline SnO2, which enhanced its specific capacity and conductivity in LIBs. After the annealing treatment, the formation of Fe–O–C bonds between the Fe3O4 NPs and SnAC imparted synergistic effects to the novel hybrid structure with inter-networks and excellent stability.
Results and discussion
Results
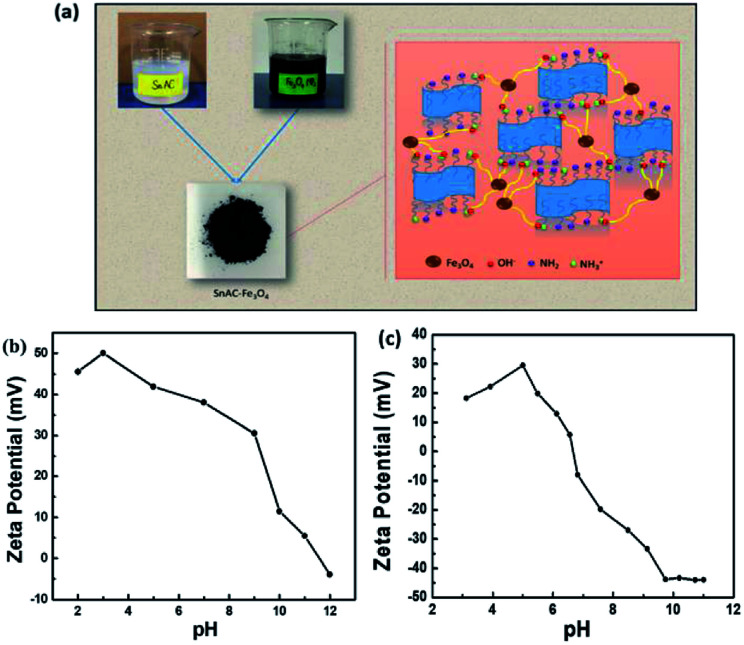
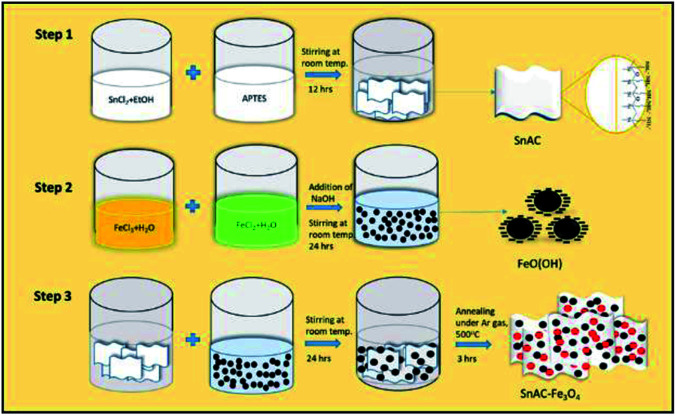
The annealed SnAC–Fe3O4 nanocomposites were fabricated by a simple process based on a combination of the normal synthesis method for SnAC and the co-precipitation method for Fe3O4 NPs. In step 1, SnAC was synthesized successfully, showing high dispersibility in DI water. The zeta potential (ζ) measurement indicated that the SnAC was positively charged with a wide pH range of 2 to 11, owing for protonation of NH3+ functional groups on the surface of the SnAC-layered structure (Fig. 1b). Notably, in the aqueous solution, SnAC presented the high ζ potential value of +45.53 mV. In step 2, Fe3O4 NPs were formed by chemical reaction, showing a negative charge owing to the many hydroxyl groups on the particle surfaces under the high-pH condition. The ζ potential values also were evident at pH 9 (−33.34 mV) and pH 11 (−43.92 mV), respectively (Fig. 1c). At pH 10, the ζ potential value of the SnAC–Fe3O4 NPs was-32.80 mV. A change in the ζ potential value was clearly observed when compared with those in the initial samples (SnAC at pH 10: +5.3 mV; Fe3O4 NPs at pH 10: −43.75 mV) under the same condition. Based on these results, we can tentatively conclude that the uniform dispersion and strong interaction of the Fe3O4 NPs with the SnAC surface was due to the electrostatic force and chemical linkage in step 3. Especially, after the annealing process under Ar gas at 500 °C, most of the SnAC structure was transformed to the SnO2 phase within the SnAC–Fe3O4 nano-architecture, which remarkably enhanced the specific capacity and electrode stability and facilitated the electron transfer, all of which would make for improved LIB performance (Fig. 2).
Fig. 1. (a) Schematic illustration of fabrication of SnAC–Fe3O4 nanocomposites; (b and c) ζ potentials of SnAC and Fe3O4 NPs under different pH conditions.
Fig. 2. Schematic diagram of synthesis steps for SnAC–Fe3O4 nanocomposites.
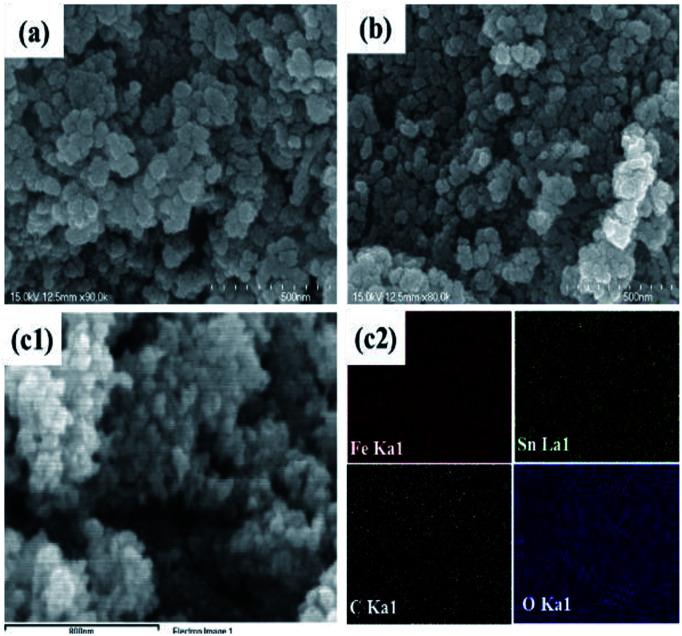
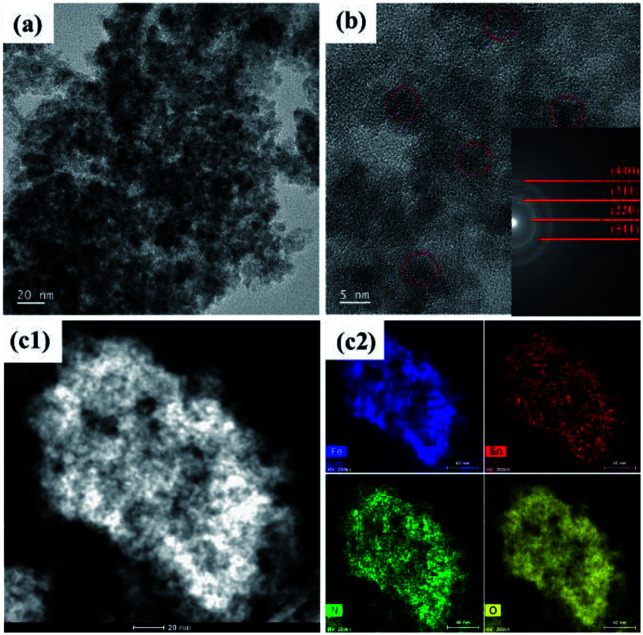
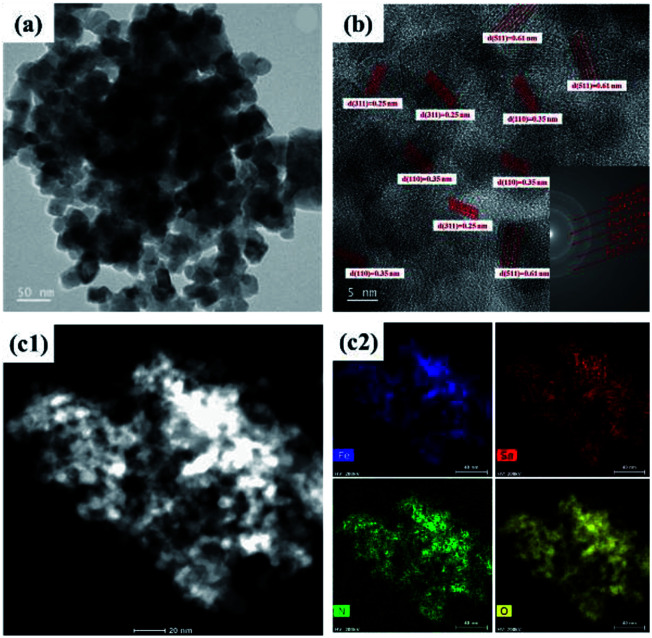
The morphologies of the SnAC–Fe3O4 nanocomposites before and after the annealing process were investigated by SEM and TEM. In the SEM images, the uniform distribution of the Fe3O4 NPs, without aggregation, was clearly apparent. Most of the Fe3O4 NPs were spherical in shape, with an average size ranging from 5 nm to 10 nm. The NPs' uniform distribution, as confirmed by elemental mapping of the Fe, Sn, O, and Si (Fig. 3–5), indicated the co-existence of Fe3O4 NPs and SnAC in this hybrid architecture. The structure of SnAC–Fe3O4 was further analyzed via TEM images (Fig. 4 and 5). For the pre-annealing SnAC–Fe3O4 nanocomposites, Fe3O4 formation was observed, though, the crystalline phase was not yet clear. By contrast, for the post-annealed SnAC–Fe3O4, the nanocrystallites of Fe3O4 could be easily observed. For two of the samples, the bright circular rings in the selected area electron diffraction (SAED) patterns indicated the presence of the cubic phase of Fe3O4. Especially, in the annealed SnAC–Fe3O4, the SAED patterns also showed the existence of orthorhombic-phase SnO2. The obtained images agreed with the high-resolution TEM images for the existence of the lattice fringes of Fe3O4 and SnO2 in the hybrid structure with interplanar distances of 0.61 nm, and 0.25 nm, corresponding to the d(511), and d(311) lattice planes of Fe3O4, respectively, and the d spacing of 0.35 nm corresponding to the (110) plane of SnO2.14–17
Fig. 3. (a and b) Scanning electron microscopy (SEM) images; (c) energy-dispersive X-ray spectrometry (EDX) analysis of SnAC–Fe3O4 nanocomposites after annealing process under Ar gas.
Fig. 4. (a and b) Transmission electron microscopy (TEM) images and selected area electron diffraction (SAED) patterns, and (c) EDX analysis of SnAC–Fe3O4 nanocomposites before annealing process under Ar gas.
Fig. 5. (a and b) Transmission electron microscopy (TEM) images and selected area electron diffraction (SAED) patterns, (c) EDX analysis of SnAC–Fe3O4 nanocomposites after annealing under Ar gas.
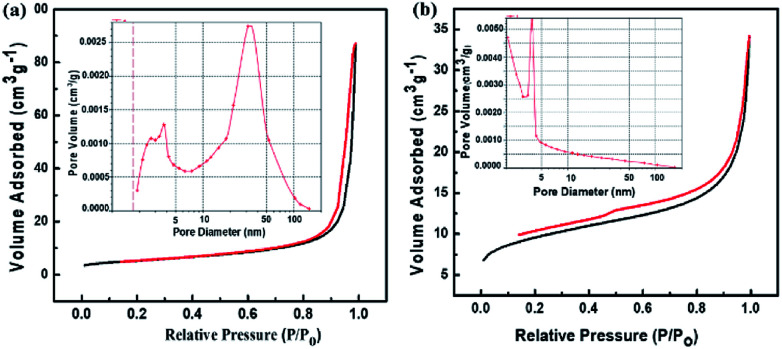
In order to further investigate the morphologies of the synthesized architecture, the N2 adsorption/desorption was measured for both the annealed SnAC–Fe3O4 and annealed SnAC. The obtained results clearly exhibited typical II hysteresis loops in the 0–1 relative range, as characteristic of the different pore sizes (Fig. 6). The significant hysteresis characteristics of the nitrogen adsorption–desorption isotherms indicated the existence of a meso/macroporous architecture. The surface areas of the annealed SnAC–Fe3O4 and annealed SnAC were determined to be 18.7 m2 g−1 and 33.42 m2 g−1 by Brunauer–Emmett–Teller (BET) calculations, respectively. The curves of the pore-size distributions represented the pore sizes in the 5–10 nm range for the annealed SnAC. Contrastingly, the annealed SnAC–Fe3O4 nanocomposites showed a broader pore-size distribution, up to 24 nm, with an average pore volume up to 0.112 cm3 g−1. The change in hysteresis and pore-size distribution was attributed to the presence of Fe3O4 NPs in the tailored pore structure of the nanocomposites. This stemmed from the integration between the two-dimensional (SnAC) and zero-dimensional (Fe3O4 NPs) architectures within a single material. In combination with the SEM and TEM analysis results, we could conclude that the annealed SnAC–Fe3O4 existed in a porous structure. It was determined to be a unique morphology that can greatly facilitate electrolyte accessibility and fast diffusion of Li-ions and electrons during lithium storage.
Fig. 6. N2 adsorption–desorption isothermal curves of: (a) SnAC–Fe3O4 and (b) SnAC after annealing process under Ar gas. The insets indicate the pore-size distributions.
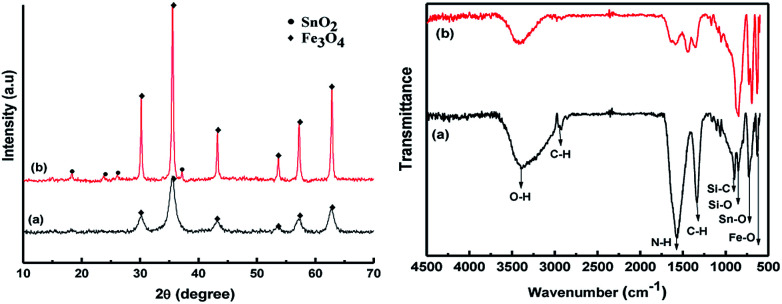
These results are consistent with the broad peaks in the powder XRD patterns for the samples before and after annealing (Fig. 7). The diffraction patterns have six main peaks around 2θ = 30.1°, 35.5°, 43.2°, 53.5°, 57°, and 62.8° corresponding to the refection from d(220), d(311), d(400), d(422), d(511), and d(440) for the Fe3O4 crystal (JCPDS card. no. 79-0418), respectively.18 However, low diffraction intensity and weak peaks were observed for the sample without annealing, because the crystallization of the Fe3O4 phase was rather low and unstable; especially, the peak intensities also can be involved in variations in the scattering intensity of the crystal components and their arrangement in the lattice, and meanwhile, a narrow shape and clear peaks were found after annealing under Ar gas. It was clear that the annealing process possibly facilitates more effective crystallization and contributes to the stabilization of this hybrid structure. In addition, the presence of some low-angle peaks in the post-annealing SnO2–Fe3O4 was ascribed to tetragonal SnO2. It is noted that the weight ratio of SnO2 and Fe3O4 within this hybrid structure can be calculated by peak area in XRD measurement. According to that, this ratio was about 1 : 12 (ASnO2 = 326.52, AFe3O4 = 2670.23).
Fig. 7. X-ray diffraction (XRD) and Fourier-transform infrared spectrophotometry (FT-IR) spectra for SnAC–Fe3O4: (a) before and (b) after annealing process under Ar gas.
Fourier-transform infrared spectroscopy (FTIR) and XPS were performed to confirm the surface functional groups and to determine the presence of new bindings for the synthetic materials. According to the obtained FTIR results, the strong absorption band of the samples at around 3398 cm−1 before and after annealing corresponded to the O–H stretching of water molecules adsorbed on the material. The peak bands located at 2923 cm−1 and 1342 cm−1 were considered to be the stretching and bending vibrations of C–H. In addition, the absorption band at 1573 cm−1 was related to the N–H vibration of the NH2 groups in SnAC. Moreover, the sharp peaks at 892 cm−1, 854 cm−1, and 721 cm−1 were attributed to Si–C, Si–O, and Sn–O in the SnAC structure, respectively. Notably, the band at 632 cm−1 was assigned to Fe–O in the Fe3O4 molecules. For the annealed SnAC–Fe3O4 nanocomposites, it was observed that the intensity of some of the major peaks in the SnAC structure, such as O–H, C–H, N–H, and Si–C, were significantly reduced. This was attributed to the degradation of water molecules and organic pendants in the SnAC structure during the annealing process. As expected, the sharp peaks of Sn–O, Si–O, and Fe–O were remarkably increased.19,20
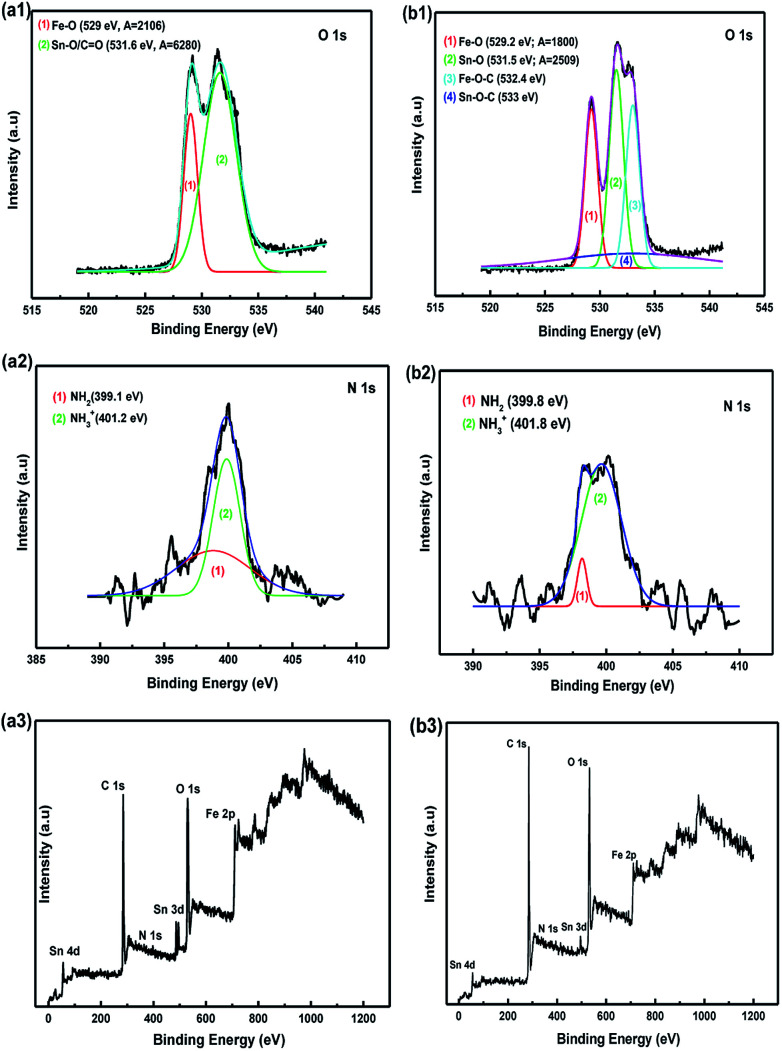
The XPS spectra indicated the presence of the SnO2 phase with major peaks at Sn 3d, 4d, and 3p (see Fig. S1†). The binding energy peaks at 486.7 eV and 495.6 eV corresponded to the Sn 3d5/2 and Sn 3d3/2 spin–orbit peaks of the SnO2 and Sn–O bonds in SnAC, respectively. The presence of Fe3O4 was confirmed by the two peaks at 710 and 725 eV corresponding to Fe 2p3/2 and Fe 2p1/2 of Fe3O4, respectively.21,22 The O 1s spectra of the SnAC–Fe3O4 sample before and after annealing are plotted (Fig. 8a1 and b1). The peak at 529 eV in both two samples was ascribed to the Fe–O bonds in the Fe3O4 NPs. The peak at about 531.6 eV could be ascribed to the Sn–O or C O bonds. Under the annealing treatment, the SnAC–Fe3O4 nanocomposites showed new two bonds at 532.4 eV and 533 eV, which were assigned to the Fe–O–C and Sn–O–C bonds owing to the strong deposition of the Fe3O4 NPs onto SnAC and the carbonization of SnAC structure.1,23,24 These bonds were clearly confirmed by the decreased relative intensity of the Fe–O peaks and Sn–O/or C O peaks, coupled with the strong decreasing of peak area (from A = 2106 to 1800 for Fe–O, and from A = 6280 to 2059 for Sn–O) after annealing relative to those of the SnAC–Fe3O4 nanocomposites before annealing. The carbonization of most of the SnAC structure led to the coordination of TMOs with the inherent carbon source on the SnAC surface, which formed stronger new bonds among the SnO2 NPs, Fe3O4 NPs, and SnAC. The advantages of these new bonds were reported by Zubir and Tian: the formation of synergistic effects within the architecture as well as the promotion of electrochemical properties such as conductibility and electrode stability, as the unique features of the newly emerged.1,24 The Gaussian fit of the N 1s spectrum revealed the two different peaks at binding energies of 399.8 eV and 401.8 eV, corresponding to the amine (–NH2) and NH3+ groups, respectively (Fig. 8a2 and b2). This is similar to the XPS spectra of the synthetic materials arising from aminoclay previously reported for detection of the presence of the NH3+ functional groups.25–28 In addition, it is seen that the intensity of two peaks was unlike with the sample before annealing process, particularly for NH3+ peak. It is suggested that SnAC surface was carbonated with the degradation of amino groups, as well as partial removal of hydroxyl group on their surface for de-protonation of NH3+ groups, compared to the initial sample. Together with that, the presence of –NH2 peak became clearer, although their intensity was rather low. Interestingly, these results are completely associated with the previous FT-IR finding.
Fig. 8. X-ray photoelectron spectroscopy (XPS) plots of SnAC–Fe3O4 nanocomposites (a1–a3) before, and (b1–b3) after annealing process under Ar gas.
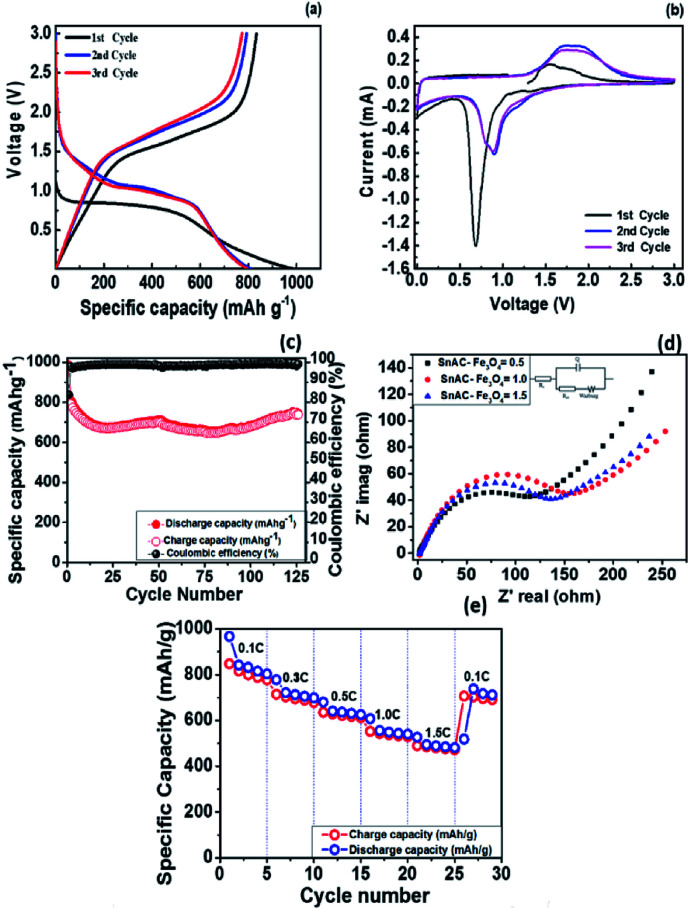
Next, the voltage profiles of the SnAC–Fe3O4 nanocomposites at the SnAC ratio of 0.5 were systematically evaluated by galvanostatic discharge and charge measurements for the initial three cycles at the current rate of 100 mA g−1 in the voltage range of 0.01–3.0 V, as plotted (Fig. 9a). It can be seen that these SnAC–Fe3O4 nanocomposite electrodes delivered a very high lithium storage capacity of 980 mA h g−1 during the initial discharge process, and that a reversible capacity of 830 mA h g−1 was achieved, as correspondent to a coulombic efficiency (CE) of about 84%. Also, the initial discharge and charge capacities of the (1.0 and 1.5) SnAC–Fe3O4 nanocomposite electrodes were as high as 1100 mA h g−1 and 1300 mA h g−1, respectively, which could be observed of cycling performance plotted (Fig. S2a and b†). The CE was determined to be about 83% for both of the two SnAC mass ratios. For the sample at the ratio of 0.5, the irreversible capacity of about 150 mA h g−1 was attributed to the decomposition of the electrolyte on the surface of the electrodes, which resulted in SEI formation and a ubiquitous chemical reaction among heterogeneous atoms. It was noted that the CE values for all three electrodes were very high, compared with most traditional electrodes (range: 60–75%). This enhancement could have been due to the unique properties of the structure and functional groups on the surfaces of the electrode materials, which had arisen from the combination of the Fe3O4 NPs and the SnAC matrix. The CE of the third cycle was increased by approximately 99% and sustained thereafter.
Fig. 9. (a) Galvanostatic charge/discharge profiles for initial three cycles at scan rate of 0.2 mV s−1 (b) Cyclic voltammetry curves, (c) cycling performance at current density of 100 mA g−1, and (d) Nyquist plots over frequency range of 100 kHz to 0.01 Hz for SnAC–Fe3O4 (0.5) nanocomposites, (e) rate capability of SnAC–Fe3O4 (0.5) nanocomposites.
The voltammogram (CV) curves of the SnAC–Fe3O4 at the ratio of 0.5 were measured under voltages ranging from 0.01 to 3.0 versus Li+/Li at a scan rate of 0.2 mV s−1 (Fig. 9b). In the first discharge cycle, a broad cathodic peak at around 0.68 V could be observed, which was attributed mainly to the irreversible formation of SEI film on the surface of the SnO2 and Fe3O4 due to the irreversible reaction with electrolyte (Li+ + e− + electrolyte → SEI). After the first cycle, the curves were more consistent.2,19,29 For the 2nd and 3rd cycles, this broad reduction peak became broader and positively right-shifted to around 0.90 V, which was ascribed to the conversion of Fe3O4 to Fe and of SnO2 to SnOx (Fe3O4 + 8Li+ + 8e− ↔ 3FeO + 4Li2O, SnO2 + 4Li+ + 4e− ↔ Sn + 2Li2O, Sn + xLi+ + xe− ↔ LixSn).30 In the oxidation scans, wide peaks at around 1.55 V and 1.82 V might have corresponded to the reversible oxidation of Fe0 to Fe3+ as well as the transition of Li2O to SnOx. More importantly, the gradual decrease in the reduction peaks occurring during the subsequent cycles reflected not only the slow decrease in capacity during the charge/discharge process but also the formation of a stable SEI film involving the overlapping of peaks in various cycles.22
To highlight the superiority of the synthesized electrodes for anode materials, we tested the cycling performance of all three at various SnAC mass ratios. The obtained results are plotted (Fig. 9c, S2a and b†). After 100 cycles, the SnACFe3O4 nanocomposite electrodes retained reversible capacities of 710 mA h g−1, 550 mA h g−1, and 500 mA h g−1, corresponding to 89%, 63% and 50% of the values in the second cycle, respectively. The sample at the ratio of 0.5 clearly presented the most promising results. Additionally, as indicated in Fig. 9c, S2a and b† better stability in electrical performance was observed over the course of the repeated charge/discharge process at this ratio. It is noted that the capacity values of SnAC–Fe3O4 nanocomposite electrode were somewhat fluctuated (Fig. 9c). It showed an initial drop in capacity up to 10 cycles. According to previous reports, this is a common phenomenon arising from tradition metal oxide electrodes for LIBs.31–33 Such a capacity fluctuation is considered to be closely related to the complex surface chemistry and electrochemical behavior of SnAC and Fe3O4 NPs at the interface of the electrolyte and electrode. The decrease of capacity begins from surface side reactions, in particular, the formation of the instability SEI film and the electrolyte decomposition at first cycles. Also, the pulverization of original NPs and the formation of new metal nanoparticles, namely Sn NPs during Li insertion/extraction process lead to loss of electrical connectivity between neighboring particles.34 Whereas, after 50 cycles, it seems to be decreased in capacity and a bit increased again. The increase of capacity is due to the activation and establish processes of the Li-ion diffusion paths in the electrode structure. Besides, the formation of in situ small Sn NPs is cause for the reversible conversion reaction, SnO2 + 4Li+ + 4e− → 2Li2O + Sn in the SnAC–Fe3O4 nanocomposite, which is usually reported to be irreversible in most previous reports. By contrast, as seen in Fig. S2c,† the cycling profiles of the pure-SnAC-based anode showed high initial charge/discharge capacities of about 1200 and 1650 mA h g−1, which yielded a CE of ∼73%. However, this value deteriorated significantly after just 15 cycles, and losing 25% of the initial reversible capacity. The capacity retention after the 30th cycle, moreover, was much inferior to that of the SnAC–Fe3O4 nanocomposites. Besides, the CE value of the pure-SnAC electrode reached only 70% in the first cycle, and immediately after 10 cycles, it had increased to only about 92%.
In order to clarify the differenced in electrochemical performance and electrode kinetics among the SnAC–Fe3O4 nanocomposites at the various mass ratios, electrochemical impedance spectroscopy (EIS) was carried out at frequencies ranging from 100 to 0.01 Hz after 5 cycles, and it was fitted using a model inserted (Fig. 9d). Each Nyquist plot obtained for the SnAC–Fe3O4 nanocomposites at the various mass ratios (Fig. 9d) indicated the common features of a single depressed semicircle in the high-medium frequency region and was followed by a straight line in the low frequency region, respectively. The single semicircle was assigned to the combination of the surface film resistance (Rsf) and charge-transfer resistance (Rct), and W was the Warburg impedance indicated by the straight line reflected the ionic diffusion. Evidently, the diameter of the single semicircle of the SnAC–Fe3O4 nanocomposites at the ratios of 1 and 1.5 was much higher than that of SnAC–Fe3O4 at the ratio of 0.5. For instance, the surface film resistances (Rsf) were ∼1.5 Ω, ∼2.1 Ω, and ∼1.7 Ω for SnAC–Fe3O4 with ratios of 0.5, 1.0, and 1.5, respectively. The charge transfer resistances (Rct) were ∼162.8 Ω and ∼154.9 Ω for SnAC–Fe3O4 nanocomposite with ratios of 1.0 and 1.5, respectively, while SnAC–Fe3O4 nanocomposite with ratios of 0.5 was ∼122.8 Ω. It means that the SnAC–Fe3O4 nanocomposite electrode at the ratio of 0.5 possessed the lowest contact and charge-transfer impedances, which fact could facilitate faster electron transport owing to the favorable dispersed state, a more stable SEI film as well as an active electrode surface with NH3+ groups during the electrochemical lithium insertion/extraction reaction resulting in significant improvement in the rate performance. It was observed that the low-frequency tails for the three samples also were different, which could be compared qualitatively with the mass-transfer kinetics in the electrode materials via the low-frequency slope angle. Indeed, the slope angle was ∼46° for the SnAC–Fe3O4 nanocomposite electrode at the ratio of 0.5, the highest value among the electrodes (∼35° at ratio of 1; ∼29° at ratio of 1.5), and the steeper low-frequency tail showed higher Li-ion diffusivity, higher electrical conductivity and a more rapid charge-transfer process in the electrode material.
To analyse fast recharge characteristic for the best electrode showing good cyclability as well as the lowest resistance, rate cyclic performance was also conducted as shown (Fig. 9e). The SnAC–Fe3O4 (0.5) electrode exhibited an outstanding rate capability. It delivered specific capacities of 848 mA h g−1 at 100 mA g−1, 715 mA h g−1 at 300 mA g−1, 636 mA h g−1 at 500 mA g−1, 552 mA h g−1 at 1 A g−1, and 490 mA h g−1 at 1.5 A g−1, which correspond to capacity retentions of 100%, 84%, 75%, 65.15%, and 58%, respectively. When the current density returned to 100 mA g−1, the charge capacity was recovered to 706 mA h g−1, demonstrating a capacity restoration of 83% and indicating high reversibility with structural stability. The stable cyclability and high rate capability of the SnAC–Fe3O4 (0.5) electrode can be attributed to the formation of a thin and stable SEI layer along with a stable contact with the current collector, leading to better reaction kinetics at the electrode surface.
Discussion
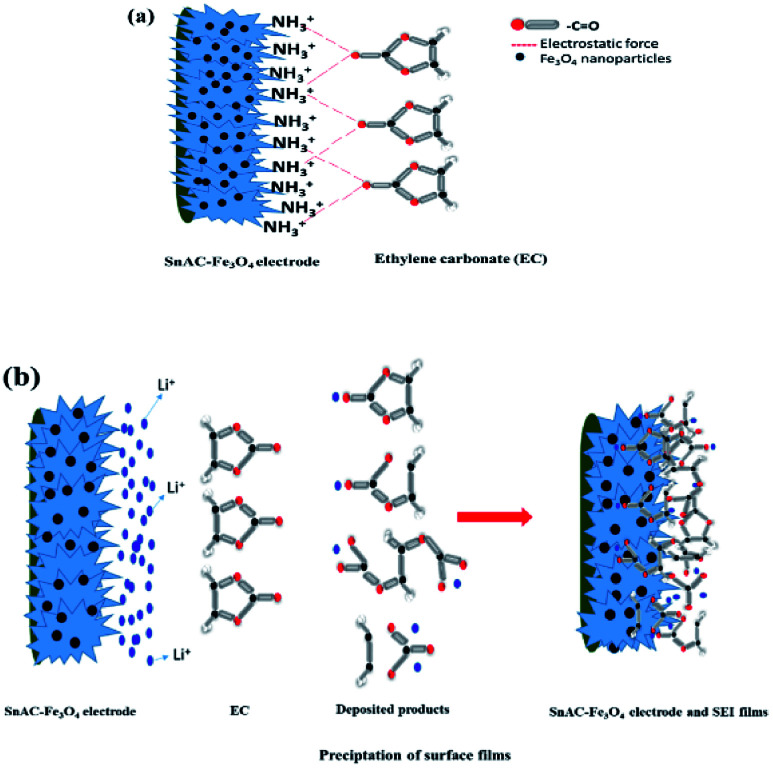
The main paragraph text follows directly on here. During the operation of the LIBs, the adsorption of electrolyte, the side reactions at the solid–liquid interface as well as the exposed surface area of the electrode with electrolyte are the crucial factors in maintaining specific capacity and performance. When the electrode materials show high electrolyte accessibility, minimization in mass transfer, electron transformation, and ion dispersion are possible. The electrolyte of Li-ion batteries contains large amounts of organic solvents such as ethylene carbonate (EC), diethyl carbonate (DEC), and ethylmethyl carbonate (EMC) with both high-dielectric and low-viscosity ingredients.35 With high polarity and dielectric constant, it has a high binding energy with Li+ ions. This high binding energy is useful for formation of the SEI on the anode; however, this leads to loss of Li+ for side reactions on the surface electrode, which causes capacity fading and low CE and DEC. A uniform layered structure and the presence of NH3+ functional groups within the electrode architecture can offer a higher affinity to C O groups in EC and DEC for reduced interaction among EC, DEC and Li+ (Fig. 10). Leung and Budzien et al. demonstrated that EC and DEC decomposition are more inclined in the presence of oxygen hydroxyl termination, with the result that the NH3+ groups can minimize the decomposition in the electrolyte.36 A high affinity with EC and DEC and its decomposition products help to control the stability of chemically and mechanically stable SEI, offering an ideal SEI film with restrained dendrite growth and surface roughening and also reducing unexpected side reactions at the SEI/electrolyte interface. In the present study, after annealing under Ar gas, almost all of the NH3+ groups had been removed, though the IR results indicated the existence of a small portion of this group on the surface of Fe3O4–SnAC nanocomposites. This also was demonstrated by the CV curves of the Fe3O4–SnAC nanocomposites electrode, as discussed above. It was noteworthy that after the first cycle, the curves of voltage–current almost overlapped, which indicated that a stable SEI film had formed on the electrode surface and at the interfaces of the Fe3O4 and SnO2 NPs. This stability led to effective prevention of direct exposure among the Fe3O4 NPs, SnO2 NPs and electrolyte, as well as great protection for the Fe3O4, and SnO2 NPs from volume expansion and structural changes during the charge/discharge process. Additionally, the dispersion and high interaction between the electrode and electrolyte owing to their inherent functional groups enhanced the wettability in the above electrode, resulting in enhanced distribution, and transport of electrons/Li-ions and the stable, superior reversibility of the SnAC–Fe3O4 nanocomposites.
Fig. 10. (a) Schematic illustration of interaction between SnAC–Fe3O4 electrodes and EC; (b) schematic representation of SEI formation on electrode surface.
The high electrochemical performance of the SnAC–Fe3O4 nanocomposites, compared with SnAC can be attributed to the unique hybrid design arising from the uniform dispersion of Fe3O4 NPs (zero-dimensional nanomaterials (0D NMs)) on the surface SnAC (two-dimensional nanomaterials (2D NMs)) as well as the carbonization of the SnAC structure during annealing treatment. Firstly, in this structure, the SnAC matrix is the major factor improving conductivity and ion/electron transportability; specifically, it facilitates easy penetration of ions and their subsequent reaction with active materials. Secondly, SnAC also facilitates the accommodation of huge volume change, as well as the formation of stable SEI film on the surface of active materials, and effectively prevents the aggregation of Fe3O4 NPs. Thirdly, the strong interaction between the Fe3O4 NPs and SnAC matrix owing to the inherent NH3+ functional groups on the SnAC surface is the key to the obtained synergistic effects and the promotion of the efficacious electrochemical properties. Fourthly and finally, the constructed macro-porous architecture in this hybrid design provides additional conductive channels for high-efficiency electron transport and ion diffusion, which can shorten the pathway and facilitate movement as well as contact with the ions' electroactive surfaces, resulting in enhanced kinetics and CE. Based on the obtained cycling performance results for various mass ratios of SnAC in the SnAC–Fe3O4 nanocomposites, the performance values of the nanocomposites were remarkably changed. To explain that, it can be considered that at the ratio of 0.5, the correspondingly small amount of SnAC is enough to prevent Fe3O4 NPs from severe aggregation and formation of large clusters, and guarantees structural integrity during the charge/discharge process under mechanical stress from the cell assembly and huge tension. It seems to the issue of limited electron and ion transport have addressed, herein, the SnAC matrix and Fe3O4 NPs with a suitable ratio act to be an effective hybrid architecture with high conductivity, great structural flexibility, and negligible potential barrier under repeated charge/discharge process. By contrast, a too-large amount of SnAC (ratios of 1 and 1.5) can lead to increased electrode thickness, which tends to prevent electron and ion transport and to limit mass transfer into the electrolyte. On the other hand, after annealing treatment in Ar gas, the carbonization of the SnAC structure leads to the formation of the SnO2 phase, which is an ideal active material (similar to Fe3O4 NPs) for improved electrochemical performance. Furthermore, carbonized SnAC enables the formation of a protective shell, which assists the prevention of inner SnO2 from direct interaction with the electrolyte.
Finally, as evidenced in the XPS data, the formation of Fe–O–C and Sn–O–C chemical bonds after annealing treatment enhances the connection of Fe3O4 NPs and SnAC, leading thereby to improved electrical conductivity, specific capacities, capacity retention and long-term stability of the SnAC–Fe3O4 nanocomposites. Instead of the presence of weak interactions such as hydrogen bonds, van der Waals force or electrostatic force, the formation of new bonds can protect the active materials from their own detachment and loss during charge/discharge process, which result corresponds to the data obtained by Tian and Zubir.1,24 These authors found that the presence of strong interfacial interactions brings out a positive effect on the hybrid architecture. The facile electronic transport and strong attachment of NPs to the matrix surface leads to easy binding/difficult dissociation characteristics and facilitates fast electron hopping, thus promoting reversible lithiation and delithiation of NPs at the higher specific current. Furthermore, as the peak intensity of Sn–O–C and Fe–O–C increases, the annealing process assists to remove some oxygen containing functional groups (C O, Sn–O, Fe–O), which action considered to enhance electron transfer and cycling stability in SnAC–Fe3O4 nanocomposites.
To further confirm the advantages of this promising electrode, a rough comparison of the previous reports in the literature for Fe3O4-based electrodes is provided in Table 1. It can easily be observed that even when the average discharge capacity at the first cycle was 980 mA h g−1, which is lower than the capacity of pure-Fe3O4 NPs and other potential materials. However, the synthesis electrode in our report displayed the highest CE value, approximately 84%, which was increased to ∼99% thereafter. Furthermore, it is noteworthy that, after the repeated charge/discharge process, a discharge capacity of 710 mA h g−1 could be resumed and maintained for 100 cycles. Apparently, these outstanding results show the high potential for the development of an advanced anode material that can attain higher energy and power density and offers ease of fabrication and enhanced safety as well.
Comparison of electrical performances of anode materials based on Fe3O4 NPs in LIB applications.
| Electrode | Potential range (V) | Current density (mA g−1) | Initial coulombic efficiency (%) | Discharge capacitance (mAh g−1) | Capacity retention/cycling | Ref. |
|---|---|---|---|---|---|---|
| Bare Fe3O4 NPs | 0.01–3.0 | 100 | 82 | 832 | 27% (34) | 37 |
| CNT/Fe3O4 | 0.02–3.0 | 100 | 68 | 1035 | 63.4% (145) | 38 |
| G/Fe3O4 | 0.01–3.0 | 100 | 78 | 1060 | 98% (85) | 37 |
| Fe3O4/C core–shell | 0.01–3.0 | 0.1C | 71.7 | 807 | 49% (100) | 39 |
| Carbon nanorods/Fe3O4 | 0.005–3.0 | 1C | 2085 | 40% (100) | 40 | |
| SnO2–Fe3O4@C | 0.005–3.00 | 100 | 69.9 | 1131.8 | 75.4% (50) | 41 |
| C-Fe3O4 nanospindles | 80 | ∼1000 | 70.1% (80) | 42 | ||
| SnAC–Fe3O4 | 0.01–3.0 | 100 | 84 | 980 | 89% (100) | This work |
Experimental
Chemicals
Tin(ii) chloride dihydrate (SnCl2·2H2O, MW = 225.65, 98%), APTES (3-aminopropyltriethoxysilane, H2N(CH2)3Si(OC2H5)3, MW = 21.37, ≥98%), iron(iii) chloride hexahydrate (FeCl3·6H2O), iron(ii) chloride tetrahydrate (FeCl2·4H2O), and NaOH pellets (sodium hydroxide, MW = 40, reagents chemicals) were obtained from Daejung Company (Gyeonggi-do, Korea), and bulk ethanol (EtOH) (MW = 46.06, 99.5%, 18 L) was acquired from Samchun Pure Chemicals (Gyeonggi-do, Korea). Additionally, double distilled (DI) water was obtained from Milli-Q® (resistance = 18.2 MΩ cm at 25 °C).
Preparation of Sn-aminoclay (SnAC)–Fe3O4 nanocomposites
In step 1, SnAC was synthesized via a simple method available in the literature.9 Briefly, a mixture of 4.5 g SnCl2·2H2O and 100 mL EtOH was prepared in a 500 mL glass beaker and fully dissolved within 15 min. APTES was added dropwise and stirred overnight at room temperature to obtain an aqueous dispersion of white precipitate. The white precipitate was separated by centrifugation and washed three times with EtOH prior drying at 60 °C for 24 hours.
In step 2, briefly, an aqueous solution (40 mL) of FeCl2·4H2O (0.7 g) and (1.9 g) FeCl3·6H2O was prepared and stirred for 30 min, giving rise to a homogeneous mixture. To this, an appropriate amount of NaOH (10 M) solution was continuously added. The mixture was stirred for a further 24 hours at room temperature to obtain black-precipitate Fe3O4 NPs.
In step 3, after dissolving SnAC (0.5 g, 1.0 g, and 1.5 g) in DI-water (40 mL), Fe3O4 NPs were added. The resulting mixture was continuously stirred for 24 hours. The black precipitate was separated and washed three times with EtOH and DI-water to remove impurities, and then the final product was oven-dried at 60 °C for 24 hours. The dried solids were powdered using a mortar and pestle. Then, the end product was annealed at 500 °C for 3 hours under Ar gas.
Materials characterization
The samples' X-ray diffraction (XRD) patterns were acquired with a RIGAKU, D/MAX-2500 powder diffractometer equipped with a Cu Kα radiation source (λ = 1.541 Å) operating at 40 kV and 300 mA. The structure and surface characteristics of the samples were investigated under transmission electron microscopy (TEM, 200 kV, Tecnai F20, Philips) and scanning electron microscopy (SEM-4700) equipped with an energy-dispersive X-ray spectrometer (EDX). The morphological analysis results, chemical compositions and binding energies were confirmed by Fourier transform infrared spectrophotometry (FT-IR, 4100, Jasco, Japan) and X-ray photoelectron spectroscopy (XPS, K-alpha, Thermo VG Scientific). Fourier-transform infrared spectrophotometry (FT-IR, 4100, Jasco, Japan) was utilized to examine the vibration peaks of the SnAC–Fe3O4 nanocomposites before and after the annealing process. The Brunauer–Emmett–Teller (BET) surface area and average pore diameter were obtained from N2 adsorption/desorption isotherms using a fully automatic physisorption analyzer (ASAP 2020, Tristar). Also, the zeta potentials of the SnAC sample, Fe3O4 NPs, and SnAC–Fe3O4 nanocomposites were obtained by dynamic laser-light scattering (DLS, Zeta PALS).
Electrochemical measurement
Electrochemical performance was investigated using CR2032 coin cells that had been assembled in an Ar-filled glove box. The working electrode was fabricated by mixing 70 wt% active material (SnAC–Fe3O4 0.5, 1.0, and 1.5, pure SnAC), 15 wt% carbon black as a conductive medium and a 15 wt% polyvinylidene fluoride (PVDF) binder in N-methyl-2-pyrrolidone (NMP) to form a slurry. The resultant slurry was uniformly cast on Cu foil with a doctor blade, and subsequently dried at 70 °C in a vacuum oven overnight. The mass loading of the active material was typically 0.7–1.0 mg cm−2. The electrochemical properties of the electrodes were characterized at room temperature. Li foil was used as the counter electrode; polyethylene (PE) was used as separator; the electrolyte was 1.0 M LiPF6 in a 1 : 1 v/v mixture of ethylene carbonate (EC) and diethyl carbonate (DEC). A cyclability test was performed on a Nanocycler V1.34 system in the 0.01–3.0 V voltage range. Cyclic voltammetry testing and electrochemical impedance spectroscopic (EIS) analysis were performed using a ZIVE MP1 station in the 0.01–3.0 V voltage range versus Li/Li+. All of the calculations were based on the mass of the active material of the anode.
Conclusions
In summary, this work demonstrates the structural and morphological relationships of SnAC–Fe3O4 nanocomposites at various SnAC mass ratios. These homogeneously dispersed and aggregation-less Fe3O4 NPs on the SnAC matrix are promising candidates for anode material in LIBs. After annealing treatment, carbonization of the SnAC structure leads to the formation of a SnO2 phase along with new chemical bonds among SnO2, the Fe3O4 NPs, and SnAC. Moreover, the great affinity between the electrode and electrolyte owing to the remaining NH3+ functional groups on the electrode surface leads to the formation of a stable macro-architecture. The constructed macro-architecture offers unique electrochemical properties due to its physical and chemical merits and surface properties as well as the synergistic effects of both components. More importantly, this structure can withstand the huge stresses caused by Fe3O4 expansion/extraction and preserve the structural integrity of the electrode over the course of repeated charge/discharge process. As a result, the nanocomposite electrodes exhibited a high reversible specific capacity of 710 mA h g−1 in the 100th cycle at 100 mA g−1, corresponding to a high electrochemical performance of 89%.
Conflicts of interest
There are no conflicts to declare.
Supplementary Material
Acknowledgments
This work was supported by the Basic Science Research Program through the National Research Foundation of Korea funded by the Ministry of Education (NRF-2017R1D1A1A09000642) and also by the Korea Institute of Energy Technology Evaluation and Planning (KETEP) and the Ministry of Trade, Industry and Energy (MOTIE) of the Republic of Korea (No. 20162010104190).
Electronic supplementary information (ESI) available. See DOI: 10.1039/c9ra00424f
Notes and references
- Zubir N. A. Yacou C. Motuzas J. Zhang X. Diniz da Costa J. C. Sci. Rep. 2014;4:4594. doi: 10.1038/srep04594. [DOI] [PMC free article] [PubMed] [Google Scholar]
- Ji L. Tan Z. Kuykendall T. R. Aloni S. Xun S. Lin E. Battaglia V. Zhang Y. Phys. Chem. Chem. Phys. 2011;13:7170–7177. doi: 10.1039/C1CP20455F. [DOI] [PubMed] [Google Scholar]
- Lian P. Liang S. Zhu X. Yang W. Wang H. Electrochim. Acta. 2011;58:81–88. doi: 10.1016/j.electacta.2011.08.088. [DOI] [Google Scholar]
- Hua Y. Yang Q. R. Mab J. Choub S. L. Zhua M. Lia Y. Electrochim. Acta. 2015;186:271–276. doi: 10.1016/j.electacta.2015.10.185. [DOI] [Google Scholar]
- Datta K. K. R. Achari A. Eswaramoorthy M. J. Mater. Chem. 2013;1:6707–6718. doi: 10.1039/C3TA00100H. [DOI] [Google Scholar]
- Narayanamoorthy B. Balaji S. Appl. Clay Sci. 2015;104:66–73. doi: 10.1016/j.clay.2014.11.007. [DOI] [Google Scholar]
- Patil A. J. Mann S. J. Mater. Chem. 2008;18:4605–4615. doi: 10.1039/B805653F. [DOI] [Google Scholar]
- Patil A. J. Li M. Dujardin E. Mann S. Nano Lett. 2007;7:2660–2665. doi: 10.1021/nl071052q. [DOI] [PubMed] [Google Scholar]
- Bui V. K. H. Park D. Lee Y. C. Chem. Eng. J. 2018;336:757–772. doi: 10.1016/j.cej.2017.12.052. [DOI] [Google Scholar]
- Lee Y. C. Lee K. Hwang Y. Andersen H. R. Kim B. Lee S. Y. Choi M. H. Park J. Y. Han Y. K. Oh Y. K. Huh Y. S. Chlorella sp. KR-1. RSC Adv. 2014;4:4122–4127. doi: 10.1039/C3RA46602G. [DOI] [Google Scholar]
- Datta K. K. R. Eswaramoorthy M. Rao C. N. R. J. Mater. Chem. 2007;17:613–615. doi: 10.1039/B617198B. [DOI] [Google Scholar]
- Kim B. Bui V. K. H. Farooq W. Jeon S. G. Oh Y. K. Lee Y. C. Energies. 2018;11:1359. doi: 10.3390/en11061359. [DOI] [Google Scholar]
- Bui V. K. H. Pham T. N. Lee Y. C. J. Nanosci. Nanotechnol. 2019;19:1069–1073. doi: 10.1166/jnn.2019.15942. [DOI] [PubMed] [Google Scholar]
- Pang D. W. P. Yuan F. W. Chang Y. C. Li G. A. Tuan H. Y. Nanoscale. 2012;4:4562–4570. doi: 10.1039/C2NR30915G. [DOI] [PubMed] [Google Scholar]
- Wang Y. Zhang H. Hu R. Liu J. van Ree T. Wang H. Yang L. Zhu M. J. Alloys Compd. 2017;693:1174–1179. doi: 10.1016/j.jallcom.2016.10.082. [DOI] [Google Scholar]
- Hong Y. J. Son M. Y. Kang Y. C. Adv. Mater. 2013;25:2279–2283. doi: 10.1002/adma.201204506. [DOI] [PubMed] [Google Scholar]
- Park G. D. Kang Y. C. Nano Res. 2018;11:1301–1312. doi: 10.1007/s12274-017-1744-7. [DOI] [Google Scholar]
- Xie W. Li S. Wang S. Xue S. Liu Z. Jiang X. He D. ACS Appl. Mater. Interfaces. 2014;6:20334–20339. doi: 10.1021/am505829v. [DOI] [PubMed] [Google Scholar]
- Wang Y. Luo Z. Hong R. Mater. Lett. 2011;65:3241–3244. doi: 10.1016/j.matlet.2011.06.106. [DOI] [Google Scholar]
- Wang T. Liu M. Ji Q. Wang Y. RSC Adv. 2015;5:103433–103438. doi: 10.1039/C5RA21828D. [DOI] [Google Scholar]
- Jiang Y. Jiang Z. J. Yang L. Cheng S. Liu M. J. Mater. Chem. A. 2015;3:11847–11856. doi: 10.1039/C5TA01848J. [DOI] [Google Scholar]
- Yang Y. Li J. Chen D. Zhao J. ACS Appl. Mater. Interfaces. 2016;8:26730–26739. doi: 10.1021/acsami.6b07990. [DOI] [PubMed] [Google Scholar]
- Huang W. Xiao X. Engelbrekt C. Zhang M. Li S. Ulstrup J. Ci L. Feng J. Si P. Chi Q. Mater. Chem. Front. 2017;1:1185–1193. doi: 10.1039/C6QM00252H. [DOI] [Google Scholar]
- Tian R. Zhang Y. Chen Z. Duan H. Xu B. Guo Y. Kang H. Li H. Liu H. Sci. Rep. 2016;6:19195. doi: 10.1038/srep19195. [DOI] [PMC free article] [PubMed] [Google Scholar]
- Ederer J. Janos P. Ecorchard P. Tolasz J. Stengl V. Benes H. Perchacz M. Georgievski O. P. RSC Adv. 2017;7:12464–12473. doi: 10.1039/C6RA28745J. [DOI] [Google Scholar]
- Rethinasabapathy M. Kang S. M. Lee I. Lee G. W. Hwang S. K. Roh C. Huh Y. S. Ind. Eng. Chem. Res. 2018;57:13731–13741. doi: 10.1021/acs.iecr.8b02764. [DOI] [Google Scholar]
- Wang R. Jing G. Lv B. J. Water Process Eng. 2017;18:134–143. doi: 10.1016/j.jwpe.2017.05.013. [DOI] [Google Scholar]
- Choe S. R. Haldorai Y. Jang S. C. Rethinasabapathy M. Lee Y. C. Han Y. K. Jun Y. S. Roh C. Huh Y. S. Environ. Technol. Innovation. 2018;9:285–293. doi: 10.1016/j.eti.2017.12.008. [DOI] [Google Scholar]
- He C. Wu S. Zhao N. Shi C. Liu E. Li J. ACS Nano. 2013;7:4459–4469. doi: 10.1021/nn401059h. [DOI] [PubMed] [Google Scholar]
- Huang B. Li X. Pei Y. Li S. Cao X. Massé R. C. Cao G. Small. 2016;12:1945–1955. doi: 10.1002/smll.201503419. [DOI] [PubMed] [Google Scholar]
- Park S. K. Park G. D. Kang Y. C. Nanoscale. 2018;10:11150–11157. doi: 10.1039/C8NR02686F. [DOI] [PubMed] [Google Scholar]
- Guo S. Feng Y. Ding W. Li X. Yang L. Yao J. J. Solid State Electrochem. 2019;23:1–7. doi: 10.1007/s10008-018-4101-1. [DOI] [Google Scholar]
- Dou Y. Xu J. Ruan B. Liu Q. Pan Y. Sun Z. Dou S. X. Adv. Energy Mater. 2016;6:1501835. doi: 10.1002/aenm.201501835. [DOI] [Google Scholar]
- Lian P. Zhu X. Liang S. Li Z. Yang W. Wang H. Electrochim. Acta. 2011;56:4532–4539. doi: 10.1016/j.electacta.2011.01.126. [DOI] [Google Scholar]
- Wang A. Kadam S. Li H. Shi S. Qi Y. npj Comput. Mater. 2018;4:15. doi: 10.1038/s41524-018-0064-0. [DOI] [Google Scholar]
- Leung K. Budzien J. L. Phys. Chem. Chem. Phys. 2010;12:6583–6586. doi: 10.1039/B925853A. [DOI] [PubMed] [Google Scholar]
- Lian P. Zhu X. Xiang H. Li Z. Yang W. Wang H. Electrochim. Acta. 2010;56:834–840. doi: 10.1016/j.electacta.2010.09.086. [DOI] [Google Scholar]
- He Y. Huang L. Cai J. S. Zheng X. M. Sun S. G. Electrochim. Acta. 2010;55:1140–1144. doi: 10.1016/j.electacta.2009.10.014. [DOI] [Google Scholar]
- Liu H. Wang G. Wang J. Wexler D. Electrochem. Commun. 2008;10:1879–1882. doi: 10.1016/j.elecom.2008.09.036. [DOI] [Google Scholar]
- Zhu T. Chen J. S. Lou X. W. J. Phys. Chem. C. 2011;115:9814–9820. doi: 10.1021/jp2013754. [DOI] [Google Scholar]
- Chai X. Shi C. Liu E. Li J. Zhao N. He C. Appl. Surf. Sci. 2016;361:1–10. doi: 10.1016/j.apsusc.2015.11.169. [DOI] [Google Scholar]
- Zhang W. M. Wu X. L. Hu J. S. Guo Y. G. Wan L. J. Adv. Funct. Mater. 2008;18:3941–3946. doi: 10.1002/adfm.200801386. [DOI] [Google Scholar]
Associated Data
This section collects any data citations, data availability statements, or supplementary materials included in this article.


