Abstract
Alkali/surfactant/polymer (ASP) flooding wastewater is commonly produced in enhanced oil extraction processes and needs to be properly treated prior to reuse due to the potential threat of formation damage. Ultrafiltration (UF) is an effective technique for treating ASP flooding wastewater to meet the requirements for reinjection water. Membrane fouling is the major challenge to UF application. In this study, the operating parameters were modified to research their effects on membrane fouling in a UF pilot study in Daqing, China. The effects of trans-membrane pressure (TMP), cross-flow velocity (CFV), concentration factor (CF) and temperature on membrane flux were systematically investigated, and optimal operating conditions were established by an orthogonal experiment. A temperature of 22 °C, TMP of 2.12 bar, CFV of 3.00 m s−1 and CF of 5 were the most feasible operating conditions for the membrane types and raw water quality parameters in the study. The quality of the permeate met the water quality standards for injection to oilfield low-permeability layers. The results could provide a reference and guidance for practical operations. To learn more about the influences of the operating parameters, a model including external and internal pollution factors was developed based on the Hagen–Poiseuille equation and classical membrane fouling theory. The operating parameters had a more significant effect on external pollution than on internal pollution. The fouling on the membrane surface was much affected by TMP and CFV.
Ultrafiltration (UF) is an effective technique for treating ASP flooding wastewater to meet the requirements for reinjection water.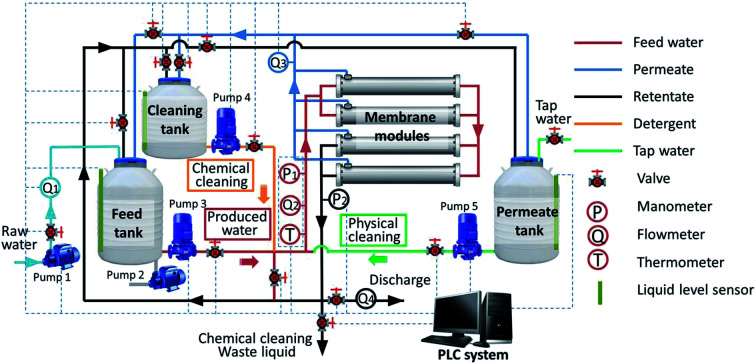
1. Introduction
Petroleum is an important fossil fuel and limited resource. With the gradual increase in crude oil demand, enhanced oil recovery (EOR) methods have been widely used after water flooding in Chinese oilfields in recent years.1,2 Chemical flooding EOR techniques play a vital role in the Chinese oil industry and include polymer flooding, chemical combination flooding and foam flooding.3 Alkali/surfactant/polymer (ASP) flooding is more efficient than any other chemical flooding technique3 and has been widely tested and implemented commercially in China.4–6 ASP flooding can efficiently increase oil recovery, but the water produced from this technique is complex and difficult to dispose of, which is one of the limitations of the ASP flooding technique.3,7 Given the large amount of ASP flooding wastewater and the limitations governing wastewater discharge, an appropriate solution is to reuse this wastewater after treatment. The reuse of ASP flooding wastewater can improve economic feasibility and save water resources.8
ASP flooding wastewater is generally characterized by a pH of 10.0–11.0, a high concentration of polymers and a high concentration of total dissolved solids.9 Flooding wastewater treated by conventional treatments, such as gravity settling,10 air flotation,11–13 de-emulsification,14–16 coagulation17,18 and biotechnology,19–21 does not meet the standards for reuse.22 Therefore, advanced treatment needs to be implemented. Membrane separation processes, especially ultrafiltration (UF) processes, are considered superior technologies for the advanced treatment of ASP flooding wastewater. UF has a high oil removal efficiency, low energy cost, no chemical additives, small space occupancy and compact design compared to conventional treatment methods.22 However, one of the major challenges in the application of UF in the treatment of ASP flooding wastewater is the decline in permeate flux as a result of membrane fouling.23
Optimizing the operating conditions, a process control method, is a membrane fouling countermeasure for the treatment of produced water. Changing the operational parameters can effectively alleviate membrane fouling and improve the permeate quality. Many studies have investigated operating conditions.24–28 Seyed Shahabadi and Reyhani29 investigated the main and interaction effects of temperature, trans-membrane pressure (TMP), and cross-flow velocity (CFV) on permeate flux, fouling resistance, and total organic carbon (TOC) rejection. Amin Reyhani and Hossein Mashhadi Meighani30 investigated the effects of temperature, TMP, CFV, and back-pulse time on the amount of permeate flux and proposed optimum conditions. Although the optimization of operating conditions can alleviate membrane fouling to some extent, membrane fouling is still inevitable during the filtration process. The membrane fouling mechanism is always an interesting aspect to researchers, and fouling models are useful tools for explaining such mechanisms. Most studies have utilized models to explain the different fouling mechanisms for different contaminants or properties,31–33 while few studies have used models to explain the effects of operating parameters on membrane fouling.
The present study focuses on the effects of operating parameters on membrane fouling in ASP flooding wastewater treatment. In this study, a pilot-scale UF system with hydrophilic PVDF membranes was established. The water yield of the pilot system was much larger than that in lab-scale experiments, and the results were closer to the practical situation. The effects of TMP, CFV, concentration factor (CF) and temperature on membrane flux were investigated, and optimal operating conditions for certain membrane types and raw water quality parameters were established by an orthogonal experiment. To further explain the mechanism by which the operating parameters affect membrane fouling, a UF fouling model for the UF of ASP flooding wastewater was established in this study. The model is based on classical membrane fouling theory, Hermia's model,34 and hydrodynamic theory from the perspective of membrane structure, the Hagen–Poiseuille equation, which includes internal and external pollution factors. The test data for optimizing the operating parameters were used to simulate the factors and assess the model under such operating conditions. The effects of the operating parameters on membrane fouling were identified by comparing the internal and external pollution factors.
2. Materials and methods
2.1. Experimental setup
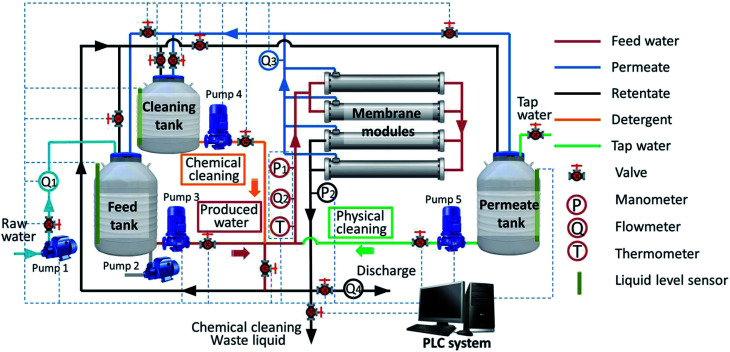
A pilot-scale UF system was installed at Daqing Water Group Company Limited in Daqing (China), and the schematic of the experimental setup is shown in Fig. 1. The system primarily consisted of tanks, pumps, membrane modules, valves, meters (manometers and flowmeters) and a programmable logical controller (PLC) system. The tubular hydrophilic poly(vinylidene fluoride) (PVDF) UF membranes used in the system were fabricated in our laboratory. The effective area of one membrane module was 0.192 m2 with a membrane pore size of 25–40 nm. As shown in Fig. 1, every module included two membrane elements and four groups of two modules each operating in parallel. The total membrane filtration area was 1.567 m2. The raw water in the feed tank was traditionally treated water from the 106-station experimental base of Daqing Water Group Company Limited. The conventional treatment processes used to treat produced water in the 106-station experimental base are air flotation, biological contact oxidation, coagulation–flotation, advanced oxidation and two-stage sand filtration in sequence, as shown in Fig. 2. The raw water quality parameters are presented in Table 1. The aeration pump (Pump 2) in the tank was used to evenly mix the feed water and maintain homogeneity during the experiment.
Fig. 1. Schematic of the experimental system.
Fig. 2. Treatment process for ASP flooding wastewater at the 106-station experimental base.
Composition of raw water.
| Component | Concentration (mg L−1) |
|---|---|
| Median particle diameter (μm) | 1–10 |
| Oil | 3–10 |
| Suspended solid | 40–75 |
| TOC | 900–1400 |
| Anionic polyacrylamide (APAM) | 800–1200 |
| Surfactant | 1–10 |
| pH | 9–12 |
| Carbonate | 2500–4500 |
| Bicarbonate | 500–1000 |
2.2. Experimental procedures
All experiments were performed under constant pressure. First, the effects of the operating parameters on membrane flux were investigated, and the pilot UF system was operated in recycle mode. Raw water for the same series (for example, the three tests studying the effect of TMP were in a series) was prepared and stored before the tests to ensure constant components of the feed water. The feed tank was filled with raw water by Pump 1 prior to the experiment, and there was no raw water refill during the experiment. Both the permeate and retentate were 100% recycled to the feed tank to keep the concentration and volume constant in the feed tank. When studying the effects of TMP, CFV and temperature on membrane flux, CF was set to 1 because the raw water was not concentrated. TMP and CFV were changed by adjusting the frequency of Pump 1 (a variable-frequency drive (VFD) pump) and the valves on the inlet and outlet pipelines of the membrane modules. The temperature was adjusted by a portable heater that could be placed in the feed tank. When studying the CF in a system, the raw water needs to be concentrated prior to experiments. The concentration process comprised discharging the permeate out of the system while maintaining a 100% return ratio of the retentate to the feed tank. During the concentration process, the volume of raw water remaining in the feed tank decreased and the contaminant concentration in the feed tank increased steadily with operation time. When the CF reached the required value, the process was terminated. Notably, the membranes had to be cleaned to recover the original flux after every experiment.
Then, orthogonal experiments were carried out to establish the optimal operating conditions for the UF system. The operation mode of this series of experiments was the same as described above. After the optimum values of the operating parameters were determined by the orthogonal experiments, a long-term continuous operation experiment was conducted to investigate the effectiveness of the UF system for treating the pretreated produced water. The continuous-operation mode was different from the recycle mode; all of the permeate flowed to the permeate tank, while the retentate was partially returned to the feed tank according to the CF required by the experiments. As the permeate flux gradually changed during the entire experiment, the retentate discharge was adjusted according to the permeate discharge to maintain a constant CF. The retentate discharge was adjusted by the PLC system.
2.3. Cleaning process
The fouled membranes were cleaned to recover the membrane flux after the experiment. After emptying the residual solution from the pipes, membrane modules and permeate tank, fresh tap water was placed into the permeate tank and circulated throughout the system. The membranes were physically cleaned at the highest possible CFV for 20 minutes as the retentate and permeate were recycled into the permeate tank. After physical cleaning, hydrochloric acid (HCl, pH = 2–3) was prepared in the cleaning tank and recycled through the membrane modules for 40 minutes, followed by tap water cleaning for 10 minutes, and prepared sodium ethylenediaminetetraacetate (Na2-EDTA, 4 mM) and sodium hypochlorite (NaClO, 5‰ wt) solutions were recycled through the UF membranes for 20 minutes. After chemical cleaning, the system was recycled with tap water for 20 minutes to rinse away the residual detergent. The membrane flux recovered to reach the initial flux.
2.4. Analytical method
The UF system was automatically controlled by a computer with a PLC system. Meter readings were monitored and recorded on the computer. The adjustment of valves was also controlled via the computer. The operating parameters in this study were obtained as follows (eqn (1)–(5)).
TMP was calculated as the average of the inlet and outlet pressures of the membrane module, which were obtained from the manometers mounted at both ends of the membrane module, while ignoring the pressure at the permeate outlet, which was atmospheric pressure.
 |
1 |
where Pin (bar) was read from manometer P1 and Pout (bar) was read from manometer P2, as shown in Fig. 1.
CFV was calculated by dividing the flow rate shown on flowmeter Q2 by the cross-sectional area of the tubular membrane, and the permeate flow could be ignored relative to the circulation flow.
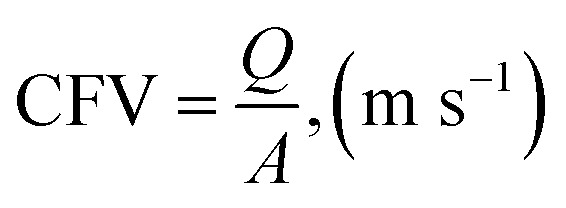 |
2 |
where Q is the inlet flow rate (m3 h−1) of the membrane module, which was read from flowmeter Q2, and A is the cross-sectional area (m2) of the tubular membrane.
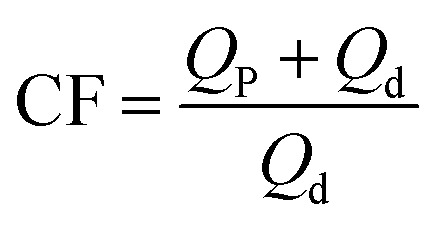
CF is the ratio of the concentration of the circulation fluid to that of the influent water in the UF apparatus. In continuous-operation mode, the CF can be changed by adjusting the ratio of retentate discharge to permeate water, as shown below.
 |
3 |
where Qp is the permeate flow (m3 s−1) and Qd is the retentate discharge flow (m3 s−1), which were read from flowmeters Q3 and Q4, respectively, as shown in Fig. 1.
The membrane flux J is the ratio of permeate flow to membrane area, as shown below.
 |
4 |
where Qp is the permeate flow (L h−1) through flowmeter Q3 and Am is the membrane area (m2). The units of membrane flux are abbreviated as LMH. To more clearly demonstrate the variation trend of membrane fouling, the normalized flux (J/J0) is adopted in this paper, where J0 is the clean water flux of the original membrane under the same operating conditions. When comparing the effects of CF or temperature on membrane flux, the flux per unit TMP (J/TMP) was used to indicate the extent of membrane fouling under different conditions and eliminate fluctuations in TMP during the experiments.
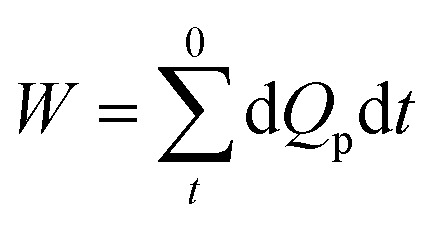
The accumulated water production (W) is the total permeate yield during the operation time.
 |
5 |
where dQp is the reading from flowmeter Q3, which can be approximately regarded as the average flow during the interval time (dt) recording on computer.
The oil and anionic polyacrylamide (APAM) contents were analysed by a UV spectrophotometer (UV2550, SHIMADZU, Japan).35–37 TOC values were obtained with a TOC analyser (TOCVCPH, SHIMADZU, Japan). The suspended solids (SS) content was analysed by a weight method: 100 mL of a water sample was passed through a 0.22 μm microfilter, and the retentate was dried in an oven at 103–105 °C until the retention weight did not change (≤0.4 mg).38 The median particle diameter was analysed by a ZETA nanometre particle size analyser (Nano S, Malvern, England).
2.5. Model development
The Hermia model,34 which is the classical membrane fouling model, indicates four different modes of membrane fouling: cake blocking of pores, transitory blocking of pores, standard blocking of pores, and complete membrane blocking of pores. According to the theory of the classical membrane fouling model, the present study summarized the reasons for UF membrane fouling from two aspects: one was internal pollution, which reduces the pore size of membranes, and the other was external pollution, which reduces the pore density on the membrane surface. The following assumptions were made in the above premise: (i) the pores of the UF membrane surface are homogeneously distributed groups of vertical capillaries, and their sizes can be described by the mean pore size; (ii) fluid flows through the pores in laminar flow;31 (iii) the membrane flux during membrane fouling in constant-pressure mode initially decreased rapidly, then gradually slowed and tended to be stable; this tendency followed a logarithmic function. Therefore, in the process of polluted water filtration, the mean pore size d and pore density N decreased linearly with the logarithm of the accumulated permeate volume Vq; (iv) the instantaneous pollution during the initial operation of UF was not taken into consideration.
Based on the above assumptions, in the process of polluted water filtration, the mean pore size d and pore density N can be expressed as follows:
| d = d0 − m ln Vq | 6 |
| N = N0 − n ln Vq | 7 |
where d0 is the original mean pore diameter (m), N0 is the original pore density (pore per m2), m and n are the reduction factors of pore diameter and pore density, respectively, and Vq is the accumulated permeate per unit membrane area (L).
Considering that when Vq = 0, d = d0 and N = N0, the curve can be shifted to the left by one unit to modify eqn (6) and (7) as follows:
| d = d0 − m ln(Vq + 1) | 8 |
| N = N0 − n ln(Vq + 1) | 9 |
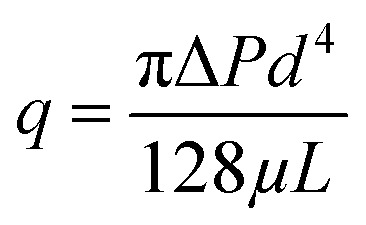
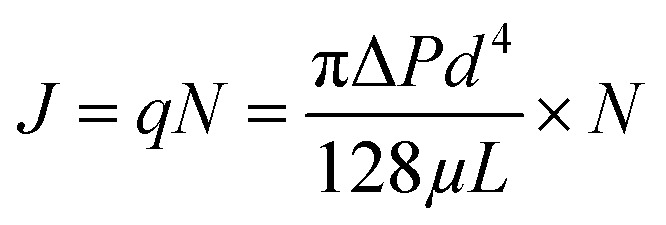
Based on hydrodynamic theory, the Hagen–Poiseuille equation (eqn (10)) can be used to calculate the membrane flux J (eqn (11)):
 |
10 |
 |
11 |
where q is the flux of one pore (m3 s−1), ΔP is the average TMP (Pa), μ is the viscosity of water (Pa s), and L is the effective thickness of the membrane.
Combining eqn (8), (9) and (11) yields the following:
 |
12 |
where J is the flux of permeate water per unit membrane area when the accumulated permeate volume is Vq.
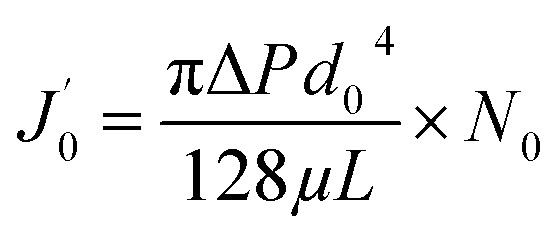
The original flux of the membrane for feed water can be expressed as follows:
 |
13 |
where 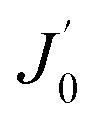 is not the clean water flux of the original membrane but rather the instantaneous initial flux when the fouling test starts, as mentioned in assumption (iv).
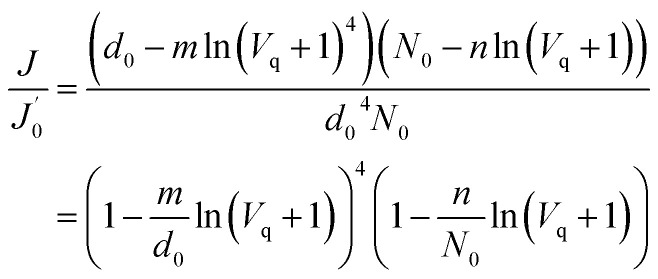
According to eqn (13), eqn (12) can be simplified as follows:
 |
14 |
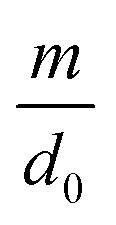
The model establishes the relationship between the membrane flux ratio and accumulated permeate per unit membrane area under a constant-pressure operation model. The terms 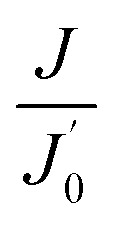 and Vq are substituted into eqn (14); then, the optimal values of
  and
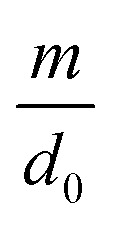
and 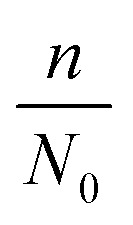 can be calculated by utilizing iterative computer software. The parameters to be determined in the model are called the internal pollution factor
  and external pollution factor
 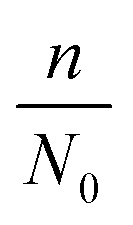 .
.
3. Results and discussion
3.1. Effects of operating parameters on membrane flux
3.1.1. Effect of TMP
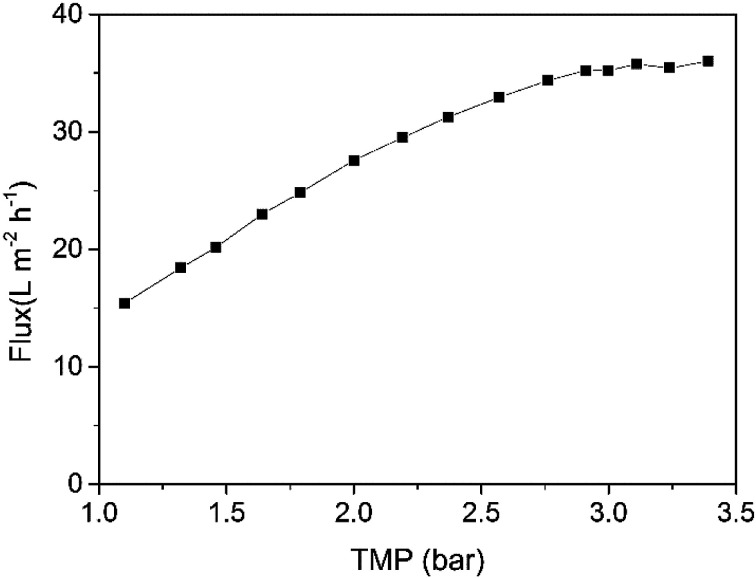
According to Section 2.2, the recycle mode was used here, and the CFV and temperature were 2.50 m s−1 and 18 ± 2 °C, respectively. First, the effect of TMP on membrane flux in a short time period was investigated by adjusting the TMP to different levels from low to high and recording the relatively stable flux value at every TMP. The stabilization time was as short as several minutes, during which the membrane fouling was mainly invariable. The average membrane fluxes at various TMPs are shown in Fig. 3. The membrane flux increased with increasing TMP up to approximately 3.00 bar in a near-linear relationship. Then, the membrane flux increased slightly and remained nearly stable at higher pressures. This result may be attributed to a gel-polarized layer, which is frequently observed during the membrane separation of bio-macromolecules.39 APAM in raw water is a polymer that can easily form a slimy layer on the membrane surface.40 Osmotic pressure caused by concentration polarization and the resistance of the gel layer depleted fractional pressure exerting on the membrane; consequently, the membrane flux cannot increase steadily and even decreases gradually due to extremely severe pollution in some waters.41
Fig. 3. Effect of TMP on instantaneous permeate flux (CF = 1, temperature = 18 ± 2 °C, CFV = 2.50 m s−1).
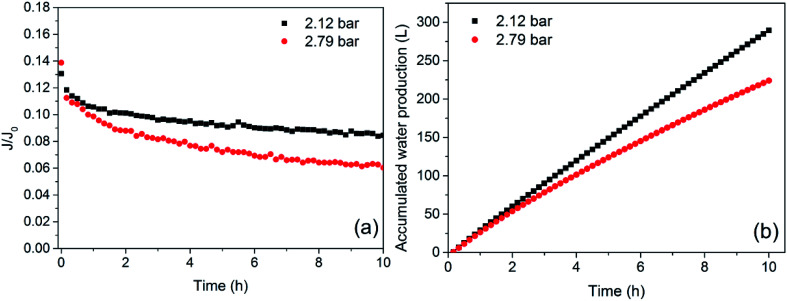
The membrane flux exhibited in Fig. 3 only indicates the instantaneous variation in TMP, while membrane fouling was a cumulative process. The evolution of membrane flux over a long time must be further investigated. In practical operation, water production is also highly important. The variations in normalized membrane flux and accumulated water production at different TMPs are shown in Fig. 4. The CFV was constant at 2.50 m s−1. The normalized membrane flux used in this study reflected the trend of membrane fouling and eliminated the influence of temperature fluctuations.
Fig. 4. Effect of TMP on permeate flux (a) and water production (b) (CF = 1, temperature = 18 ± 2 °C, CFV = 2.50 m s−1).
For all tests, rapid flux decay occurred during the first few hours and began to alleviate in the pseudo-steady stage due to the accumulation of APAM, oil and SS on the membrane surface and the subsequent formation of a gel layer. As shown in Fig. 4(a), the time required for the membrane flux to become stable was shortened at higher pressure (2.79 bar), and the steady-state flux was smaller. This result indicated that increased operating pressure not only accelerated the progress of membrane fouling but also resulted in more serious membrane fouling when the membrane flux was stable. From Fig. 4(b), the water production at lower pressure was greater than that at higher pressure. Although a larger absolute flux was generated at higher pressures in the initial stage, as shown in Fig. 3, greater membrane fouling occurred simultaneously and sharply reduced the flux, causing the mean flux to decrease, which was consistent with previous results.42 Additionally, the TMP should not be excessively low; such conditions would make the flux too small to meet the requirements for water production.
3.1.2. Effect of cross-flow velocity
CFV, the velocity of feed water flow on the membrane surface, is an important operating parameter of UF systems43,44 and can influence membrane fouling to a certain degree. For tubular UF membranes, which use horizontal flow, the change in CFV can be obtained by adjusting the cross-flow rate.
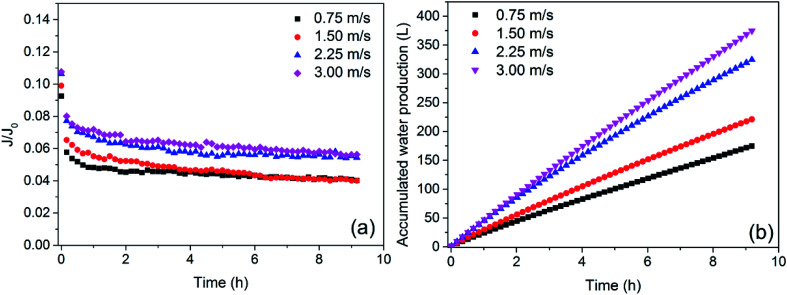
The variation in normalized membrane flux and the accumulated water production at different CFVs were acquired at a fixed TMP of 2.20 bar (Fig. 5). As depicted in Fig. 5(a), the membrane flux at steady state increased with increasing CFV from 0.75 m s−1 to 3.00 m s−1. This result indicated that improving CFV helped slow membrane fouling and increase flux. From Fig. 5(b), the trend in water production corresponded with the trend in membrane flux. A larger CFV improved water production during the same operation time. However, the increase rate of flux at each velocity increase was not the same. For example, when the flow increased from 0.75 m s−1 to 1.50 m s−1, the stabilized flux increased by 10% in the initial time (within the first 3 hours), but with continuing operation, the normalized flux decreased to the value at lower flow. When the CFV increased from 1.50 m s−1 to 2.25 m s−1, the stabilized flux increased by 19%. In addition, when the CFV increased from 2.25 m s−1 to 3.00 m s−1, the stabilized flux only increased by 6%. This result suggested that when water reaches a turbulent state in the tubular channel, membrane fouling can be reduced dramatically. Below this velocity, the fouling layer deposited on the surface of the membrane was not effectively weakened. Above this CFV, the increase in flux was not significant, and such conditions may lead to an unnecessary waste of energy because the intensity of turbulence was no longer the main factor limiting the membrane flux at this moment. To reduce membrane fouling and prolong the operation span of the UF system, the CFV should be set at a critical value to achieve the best efficiency.
Fig. 5. Effect of CFV on permeate flux (a) and water production (b) (CF = 1, temperature = 18 ± 2 °C, TMP = 2.20 bar).
3.1.3. Effect of concentration factor
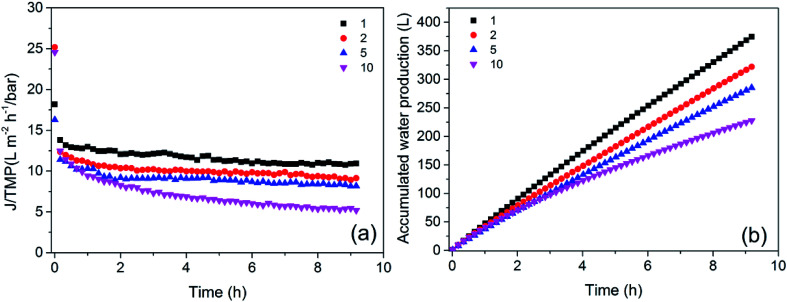
The CF is the ratio of the concentration of the circulation fluid to that of the influent water in an UF system and is directly related to the water production rate. The greater the CF is, the higher the water production rate becomes. At CFs of 1, 2, 5, and 10, the corresponding rates of water production were 0, 50%, 80% and 90%, respectively. The influence of CF on flux at the same TMP (2.20 bar) and CFV (3.00 m s−1) was investigated at four different CFs.
The flux variation at different CFs is presented in Fig. 6. The flux at steady state decreased with increasing CF, which implied that membrane fouling became more serious. Moreover, the flux declined faster with larger CFs because the viscosity of the concentrated feed water was higher and pollutants were more easily deposited on or in the membrane. In addition, when the CF increased from 2 to 5, the flux did not decrease significantly, but the water production rate increased from 50% to 80%. When the CF increased from 5 to 10, the flux decreased dramatically, but the water production rate only increased by 10%. Therefore, a CF of 5 was more appropriate for practical production.
Fig. 6. Effect of CF on permeate flux (a) and water production (b) (temperature = 18 ± 2 °C, TMP = 2.20 bar, CFV = 3.00 m s−1).
3.1.4. Effect of temperature
The feed water temperature can affect physicochemical properties and biological stability. Because the clean water flux increases with increasing temperature, the absolute flux per unit TMP was used instead of the normalized membrane flux to analyse the effect of temperature on membrane flux.
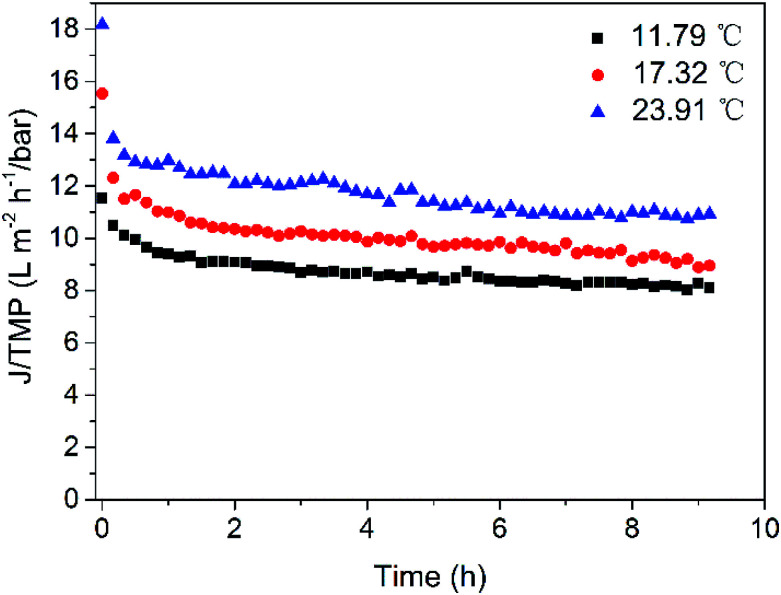
The influence of temperature on flux at the same TMP (2.12 bar) and CFV (2.25 m s−1) was investigated at 11.79, 17.32 and 23.9 °C (Fig. 7). The temperature of the feed water can only be adjusted within a small range due to the limitation of the apparatus. The flux showed a rising trend with increasing temperature, which was probably caused by the viscosity drop due to the temperature change and increased diffusion capacity of the feed water. As a result, the contaminants on the membrane surface can transfer to the bulk of the feed water faster, reducing the thickness of the boundary layer of concentration polarization and thus increasing membrane flux. The result indicates that higher temperature favoured the increase of flux of the UF system, and the temperature of ASP flooding wastewater is higher in practical production than that in the tests,7,45 the water production of UF membrane can be greater. In addition, the temperature of feed water should not exceed the range that the membrane can withstand to avoid membrane damage.
Fig. 7. Effect of temperature on permeate flux (CF = 1, TMP = 2.12 bar, CFV = 2.25 m s−1).
3.2. Orthogonal experiment to optimize operating parameters
In Section 3.1, the effects of TMP, CFV, CF and temperature were investigated, and based on the results, optimal operating conditions were selected for the system. The orthogonal experimental design (OED) method is a modern approach to characterizing and optimizing system performance in many research areas.46–48 OED is applied in this study to help optimize the operating conditions for the UF apparatus and provide a reference for practical applications. According to the research in the previous section, the influence factors were TMP, CFV and CF. Temperature was not included due to its high operation cost in actual production. Table 2 summarizes the influence factors and level values selected in this study.
Influence factors and levelsa.
| Levels | Parameters | ||
|---|---|---|---|
| Factor A | Factor B | Factor C | |
| Average TMP (bar) | Circulation flow (m s−1) | Concentration factor | |
| 1 | 1.67 | 0.75 | 1 |
| 2 | 2.12 | 1.50 | 2 |
| 3 | 2.79 | 2.25 | 5 |
| 4 | 3.47 | 3.00 | 10 |
For simplicity, the number of levels to be used in later descriptions is assigned to each value in the table.
The orthogonal array is described as La(bc), where L is the symbol of the orthogonal design, a is the number of trials, b is the number of levels and c is the maximum number of factors.49 The orthogonal array for the 16 trials selected for this study was L16(45), which matches the number of levels (4 levels) and 2 additional factors (Error 1 and Error 2) while also taking the unknown uncertainties into consideration. The two blank factors are added into the mathematical description to account for possible interactions of the original 3 factors as well as other possible sources of error and uncertainty.
For the OED method, the analysis of range (ANORA) was performed after collection of the experimental data. The results of OED calculations are summarized in Table 3 for the selected 16 trials. Underneath the experimental matrix and the corresponding measured average fluxes over 10 hours for the 16 trials, the matrix of calculated Ki and R values is shown. For example, the value K11 = 19.55 for Factor A is obtained by adding all average flux values for which Factor A = 1 and dividing the sum by the total number of values (4):K11 = (19.37 + 20.06 + 20.11 + 18.67)/4 = 19.55
Orthogonal test table.
| Experiment no. | Input | Output | ||||
|---|---|---|---|---|---|---|
| Factor A (bar) | Factor B (m s−1) | Factor C | Error 1 | Error 2 | Flux (LMH) | |
| 1 | 1 | 1 | 1 | 1 | 1 | 19.37 |
| 2 | 1 | 2 | 2 | 2 | 2 | 20.06 |
| 3 | 1 | 3 | 3 | 3 | 3 | 20.11 |
| 4 | 1 | 4 | 4 | 4 | 4 | 18.67 |
| 5 | 2 | 1 | 2 | 3 | 4 | 23.31 |
| 6 | 2 | 2 | 1 | 4 | 3 | 29.60 |
| 7 | 2 | 3 | 4 | 1 | 2 | 25.32 |
| 8 | 2 | 4 | 3 | 2 | 1 | 32.98 |
| 9 | 3 | 1 | 3 | 4 | 2 | 22.72 |
| 10 | 3 | 2 | 4 | 3 | 1 | 23.18 |
| 11 | 3 | 3 | 1 | 2 | 4 | 31.12 |
| 12 | 3 | 4 | 2 | 1 | 3 | 33.02 |
| 13 | 4 | 1 | 4 | 2 | 3 | 20.13 |
| 14 | 4 | 2 | 3 | 1 | 4 | 24.58 |
| 15 | 4 | 3 | 2 | 4 | 1 | 27.83 |
| 16 | 4 | 4 | 1 | 3 | 2 | 32.51 |
| k 1 | 19.55 | 21.38 | 28.15 | 25.57 | 25.84 | |
| k 2 | 27.80 | 24.36 | 26.06 | 26.07 | 25.15 | |
| k 3 | 27.51 | 26.10 | 25.10 | 24.77 | 25.71 | |
| k 4 | 26.26 | 29.30 | 21.83 | 24.70 | 24.42 | |
| R | 8.25 | 7.92 | 6.32 | 1.36 | 1.42 | |
To find the R value, the difference between the maximum and minimum K value was calculated for the 3 influence factors. For example, for Factor A, R1 = 27.80 − 19.55 = 8.25. Since the R values for Error 1 and 2 were very small compared to those of other factors, we concluded that the interactions between different factors (Error 1 and 2) were small and could be neglected in this study. Based on the R value, the factors were ordered by significance for average flux, and the order was A > B > C, corresponding to TMP > CFV > CF.
The optimum operating conditions of the UF apparatus correspond to the largest average flux. Table 3 indicates that for the average flux, K2 > K3 > K4 > K1 for Factor A, K4 > K3 > K2 > K1 for Factor B, and K1 > K2 > K3 > K4 for Factor C. This order was also consistent with the results presented in Section 3.1. For Factor A and Factor B, the optimum levels were those proposed above. For Factor C (CF), the optimum value should be 5, according to the rate of produced water in actual production. Therefore, the optimum operating conditions for the UF apparatus were a TMP of 2.12 bar, a CFV of 3.00 m s−1 and a CF of 5.
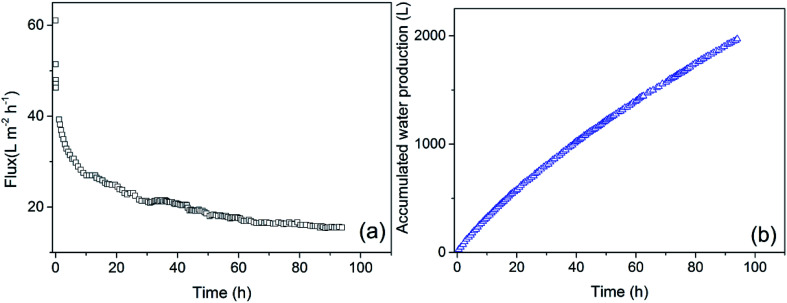
The UF system was operated under the optimal operating conditions to treat pretreated produced water (feed water) for a long time and to verify the effectiveness of the UF process. The temperature of the raw water was the ambient temperature, 22 °C, due to the large quantity of raw water.
Fig. 8 illustrates the variation in membrane flux and the accumulated water production of the UF system under the optimal operating conditions. The membrane flux declined dramatically at the initial state in all trials; the rate of decline gradually became stable, and the flux tended to be constant. After running for 30 hours, the instantaneous flux was 21.10 L (m2 h)−1 and the average flux was 27.09 L (m2 h)−1; after 60 hours, the instantaneous flux declined to 17.63 L (m2 h)−1 and the average flux was 23.32 L (m2 h)−1; after 90 hours operating, the instantaneous flux was 15.49 L (m2 h)−1 and the average flux was 21.04 L (m2 h)−1. With increasing operation time, the average flux of the UF apparatus tended to decline, which meant that the efficiency of water production decreased. In actual production, a proper membrane cleaning cycle has to be established to maintain a high efficiency of water production and meet the requirements for production. The decline in water production needs to be taken into consideration during membrane cleaning to ensure efficient water production.
Fig. 8. Changes in permeate flux (a) and water production (b) with time.
The quality of permeate was detected, including SS, oil, APAM, surfactant and TOC, which were the dominating contaminants of produced wastewater. The specific water quality of permeate water and pollutant removal rate are shown in Table 4. The content of SS was about 70 mg L−1 in the feed water, and it was lower than 1.0 mg L−1 in the permeate. The removal rate was above 95%, and the median particle diameter was smaller than 1 μm. The contents of oil were 7.2–4.1 mg L−1 and less than 1.0 mg L−1 in the feed water and permeate, respectively. About 90% of oil was removed. The content of APAM was 1200 mg L−1 in the feed water, and the UF system removed over 95% of APAM. In the permeate, the content of APAM was 30–60 mg L−1. The contents of surfactant were 3.5–2.0 mg L−1 and 0.5–1.0 mg L−1 in the feed water and permeate, respectively. The removal rate was about 60% and the value was much lower than others. Surfactant is an additional component of ASP flooding produced wastewater compared to polymer flooding produced wastewater. The surfactant used in the study was sodium dodecyl benzene sulfonate (SDBS), which is a small molecular organic and can pass through the UF membrane. Since inorganic and organic contaminants were present in the wastewater simultaneously, the existing form of surfactant changed. The surfactant in bound form, which binding with other contaminants in wastewater, can be removed by UF. But the single molecular of surfactant was not efficiently removed by UF membrane. Therefore, the removal effect for surfactant was not as great as for other pollutants. The average TOC of feed water was about 1200 mg L−1, and approximate 80% of TOC was removed by UF. The TOC of permeate was about 200 mg L−1. TOC is related to the concentration of oil and APAM in UF permeate. The results indicated that the UF membrane performed a high and steady removal of TSS, crude oil, APAM and TOC. The removal of surfactant was not as efficient as other target pollutants, but it can be removed in advanced treatment (nanofiltration or electrodialysis) subsequently. The quality of permeate met the main control indexes of oilfield reinjection water required in the SY/T 5329-2012 standard50 (a criterion of China Petroleum Industry) and could be feed water of advanced treatment.
Quality of permeate water and corresponding removal rate.
| Component | Concentration (mg L−1) | Removal rate |
|---|---|---|
| Suspended solid | <1.0 | >95% |
| Oil | <1.0 | 90% |
| APAM | 30–60 | 95% |
| Surfactant | 0.5–1.0 | 60% |
| TOC | 200 | 80% |
3.3. Model simulation and factor discussion
Based on hydrodynamic theory from the perspective of membrane structure, a UF fouling model including internal and external pollution factors was established.
The internal pollution factor 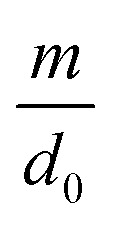 and external pollution factor
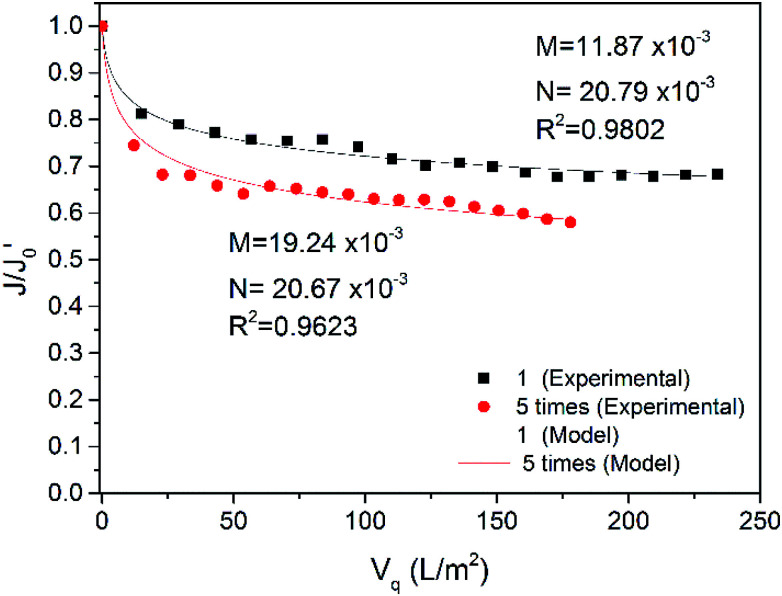
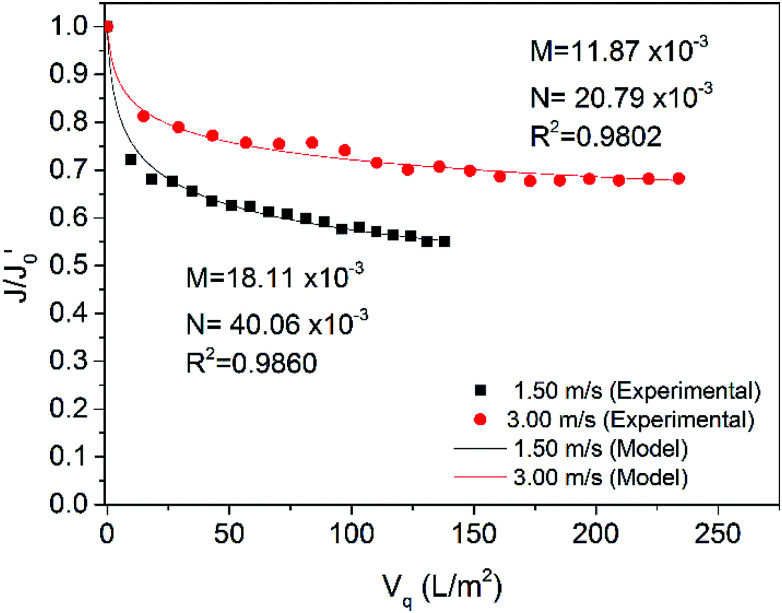
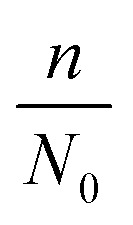
 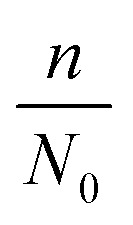 in this model can be influenced by many factors, such as the feed water quality and operating conditions. In this study, the feed water quality from the same source was considered consistent. However, the operating conditions were adjusted to change the fouling scenario. Five groups of data from tests with optimized operational parameters (2 from TMP tests, 2 from CFV tests and 1 from CF tests) were used to estimate the two factors. The curves of flux change with respect to accumulated permeate per unit membrane area under different conditions in 9 hours are illustrated in Fig. 9 to Fig. 11, and the values were compared with the analogous calculated results. The size of the two factors suggests which part of membrane fouling was influenced by the operational parameters. To simplify the equation of the model, the internal pollution factor
 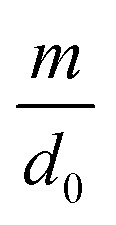 and external pollution factor
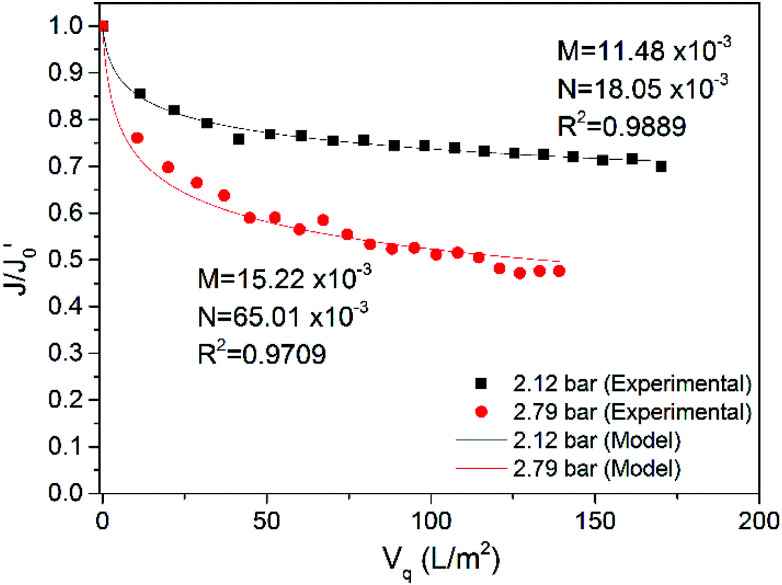
  are represented by M and N, respectively. From Fig. 9–11, the simulated results obtained from the established model approximate the experimental values, and the R-squared values were over 95% (R2 represents the goodness of fit, and the maximum value is 1). Therefore, the model in this study can fit the UF process of ASP flooding wastewater well.
Fig. 9. Comparison of model simulated values with experimental values (TMP = 2.12 bar, 2.79 bar, CFV = 2.50 m s−1, 18 ± 2 °C).
Fig. 11. Comparison of model simulated values with experimental values (CF = 1, 5; TMP = 2.2 bar, CFV = 3.00 m s−1, 18 ± 2 °C).
Fig. 10. Comparison of model simulated values with experimental values (TMP = 2.20 bar, CFV = 1.50 m s−1, 3.00 m s−1, 18 ± 2 °C).
The curves of flux rate with respect to accumulated permeate per unit membrane area at 2.12 bar and 2.79 bar are shown in Fig. 9, and the fitting curves and simulated values of the factors (M and N) are also presented. The R-squared values of the fitting curves at 2.12 bar and 2.79 bar are 0.9889 and 0.9709, respectively. When the TMP increased from 2.12 to 2.79 bar, both M and N became larger, indicating that more serious fouling occurred in and on the membrane at 2.79 bar, which is consistent with the conclusion from Section 3.1.1. The internal pollution factor M increased slightly, while the external pollution factor N increased by 3 times. This result implies that increasing TMP greatly increased fouling on the membrane surface. A higher TMP causes greater concentration polarization on the membrane surface.51 With increased operation time, the concentrated pollutants precipitated and formed a gel layer. The pressure exerted on the gel layer made the layer dense; the greater the pressure was, the denser the pollution layer.52 The resistance of the greater concentration polarization and the denser gel layer mainly caused the flux decrease. The internal pollution factor was also increased, which may be because the draw force from higher pressure not only made more water traverse the membrane but also caused more small pollutants to block the membrane pores. However, this process occurred before cake layer formation; the cake layer formed in a short time because of the presence of the polymer APAM in the ASP flooding wastewater. Thus, TMP affects internal pollution to a lesser degree.
Fig. 10 shows the experimental data for the CFV optimized tests at 1.50 m s−1 and 3.0 0m s−1 with the simulated results. The model also fit the data of the tests well, and both R2 were over 0.98. With increasing CFV, the internal and external factors both declined, which implied that increasing the CFV favoured the alleviation of fouling in and on the membrane. Due to the increased CFV, the turbulence became more severe, and the pollutants in the water could not easily deposit on the membrane and enter the membrane pores; thus, the pollution inside and outside the membrane was mitigated. Notably, the external pollution factor N was reduced by half. This reduction may be because more turbulent flow can improve the mass transfer process between the bulk and the concentration polarization layer and thin the concentration polarization layer and the gel layer. This result indicates that changes in CFV have a more significant influence on the pollution on the membrane surface.
Fig. 11 shows the flux rate change with respect to accumulated permeate per unit membrane area at CFs of 1 and 5. In this test, the CFV was 3.00 m s−1, and the TMP was 2.2 bar. The data for non-concentrated raw water (i.e., CF of 1) were also used in Fig. 10 in the curve of CFV at 3.00 m s−1 for comparison. The model also fit the data for 5-fold concentrated raw water well, and R2 was as high as 0.9801. When the CF reached 5, M became larger, and N was approximately the same. As there were more contaminants that could block the membrane pores in the concentrated feed water, the internal pollution was more serious. However, the internal pollution only increased slightly because the gel layer formed faster in the concentrated feed water to create a “secondary membrane” that rejected smaller pollutants; in contrast, the external pollution was approximately the same. This result may be because the CFV used in these tests was high enough to effectively keep the pollution layer from thickening in both feed waters.
4. Conclusion
Pilot studies on the UF of pretreated produced water were carried out, and the effects of some operating parameters on membrane flux were evaluated. The membrane flux increased with increasing TMP in the initial stage of UF, while a higher TMP caused more severe membrane fouling, leading to a sharp decline in subsequent operation. Increasing the CFV in a certain range could result in considerable improvement because of shear from turbulence on the membrane fouling layer. Moreover, a larger CF led to lower membrane flux, but the selection of an appropriate CF for the system also depended on the water production rate. Furthermore, temperature had a significant effect on membrane flux, but it is difficult to control the temperature of large water volumes in practical operation. Optimal operating conditions were determined by orthogonal experiments. Under the experimental conditions, the optimum parameters were as follows: average TMP of 2.12 bar, CFV of 3.00 m s−1, CF of 5 and temperature of the feed solution of 22 °C. The quality of the permeate met the standards for low-permeability-layer water injection. The results provide a reference and guidance for practical production.
A UF fouling model including internal and external pollution factors indicated that the factors in the model could imply the degree of membrane fouling and represent the pollution inside and outside the membrane. Distinguishing which part of membrane fouling was affected by the operating parameters is valuable for practical production design. The operating parameters had a more significant effect on external pollution than on internal pollution when treating ASP flooding wastewater. Finally, efforts should be made to avoid increasing internal pollution during the membrane treatment process because this form of pollution was more difficult to remove.
Conflicts of interest
There are no conflicts of interest to declare.
Supplementary Material
Acknowledgments
This study was supported by the National Natural Science Foundation of China (No. 51778443).
References
- Rellegadla S. Prajapat G. Agrawal A. Appl. Microbiol. Biotechnol. 2017;101:4387–4402. doi: 10.1007/s00253-017-8307-4. [DOI] [PubMed] [Google Scholar]
- Kamal M. S. Sultan A. S. Al-Mubaiyedh U. A. Hussein I. A. Polym. Rev. 2015;55:491–530. doi: 10.1080/15583724.2014.982821. [DOI] [Google Scholar]
- Zhu Y., presented in part at the SPE Asia Pacific Enhanced Oil Recovery Conference, Kuala Lumpur, Malaysia, 2015/8/11 [Google Scholar]
- Zhong X., Wang Y., Pu H., Li W., Yin S. and Ling K., presented in part at the SPE EOR Conference at Oil and Gas West Asia, Muscat, Oman, 2018/3/26 [Google Scholar]
- Guo H., Li Y., Li Y., Kong D., Li B. and Wang F., presented in part at the SPE Reservoir Characterisation and Simulation Conference and Exhibition, Abu Dhabi, UAE, 2017/5/5 [Google Scholar]
- Zhong H., Yang T., Yin H., Fu C. and Lu J., presented in part at the SPE Annual Technical Conference and Exhibition, Dallas, Texas, USA, 2018/9/24 [Google Scholar]
- Liu Y., Wang Z., Li X., Le X. and Wang X., presented in part at the SPE Middle East Health, Safety, Environment & Sustainable Development Conference and Exhibition, Doha, Qatar, 2014/9/22 [Google Scholar]
- Wang Z., Li J., Yu X., Wang M., Le X. and Yu T., presented in part at the SPE Annual Technical Conference and Exhibition, Dubai, UAE, 2016/9/26 [Google Scholar]
- Zhu Y. Yu S. Zhang B. Li J. Zhao D. Gu Z. Gong C. Liu G. Sci. Total Environ. 2018;642:988–998. doi: 10.1016/j.scitotenv.2018.06.145. [DOI] [PubMed] [Google Scholar]
- Zeevalkink J. A. Brunsmann J. J. Water Res. 1983;17:365–373. doi: 10.1016/0043-1354(83)90131-8. [DOI] [Google Scholar]
- El-Kayar A. Hussein M. Zatout A. A. Hosny A. Y. Amer A. A. Sep. Technol. 1993;3:25–31. doi: 10.1016/0956-9618(93)80003-A. [DOI] [Google Scholar]
- Thoma G. J. Bowen M. L. Hollensworth D. Sep. Purif. Technol. 1999;16:101–107. doi: 10.1016/S1383-5866(98)00115-4. [DOI] [Google Scholar]
- Younker J. M. Walsh M. E. J. Environ. Chem. Eng. 2014;2:692–697. doi: 10.1016/j.jece.2013.11.009. [DOI] [Google Scholar]
- Thompson D. G. Taylor A. S. Graham D. E. Colloids Surf. 1985;15:175–189. doi: 10.1016/0166-6622(85)80070-6. [DOI] [Google Scholar]
- Zhang H. Fang S. Ye C. Wang M. Cheng H. Wen H. Meng X. Sep. Purif. Technol. 2008;63:264–268. doi: 10.1016/j.seppur.2008.05.012. [DOI] [Google Scholar]
- Kukizaki M. Goto M. J. Membr. Sci. 2008;322:196–203. doi: 10.1016/j.memsci.2008.05.029. [DOI] [Google Scholar]
- Zouboulis A. I. Avranas A. Colloids Surf., A. 2000;172:153–161. doi: 10.1016/S0927-7757(00)00561-6. [DOI] [Google Scholar]
- Zhang Y. Gao B. Lu L. Yue Q. Wang Q. Jia Y. J. Pet. Sci. Eng. 2010;74:14–19. doi: 10.1016/j.petrol.2010.08.001. [DOI] [Google Scholar]
- Freire D. D. C. Cammarota M. C. Sant'anna G. L. Environ. Technol. 2001;22:1125–1135. doi: 10.1080/09593332208618203. [DOI] [PubMed] [Google Scholar]
- Sen R. Prog. Energy Combust. Sci. 2008;34:714–724. doi: 10.1016/j.pecs.2008.05.001. [DOI] [Google Scholar]
- Hou C. T. New Biotechnol. 2009;26:2–10. doi: 10.1016/j.nbt.2009.05.001. [DOI] [PubMed] [Google Scholar]
- Jimenez S. Mico M. M. Arnaldos M. Medina F. Contreras S. Chemosphere. 2018;192:186–208. doi: 10.1016/j.chemosphere.2017.10.139. [DOI] [PubMed] [Google Scholar]
- Shi H. He Y. Pan Y. Di H. Zeng G. Zhang L. Zhang C. J. Membr. Sci. 2016;506:60–70. doi: 10.1016/j.memsci.2016.01.053. [DOI] [Google Scholar]
- Hu B. Scott K. J. Membr. Sci. 2007;294:30–39. doi: 10.1016/j.memsci.2007.02.002. [DOI] [Google Scholar]
- Qiu Y. R. Zhong H. Zhang Q. X. Trans. Nonferrous Met. Soc. China. 2009;19:773–777. doi: 10.1016/S1003-6326(08)60348-9. [DOI] [Google Scholar]
- Salahi A. Gheshlaghi A. Mohammadi T. Madaeni S. S. Desalination. 2010;262:235–242. doi: 10.1016/j.desal.2010.06.021. [DOI] [Google Scholar]
- Guerra K. Pellegrino J. Drewes J. E. Sep. Purif. Technol. 2012;87:47–53. doi: 10.1016/j.seppur.2011.11.019. [DOI] [Google Scholar]
- Zhao S. Wang P. Wang C. Langer J. L. Abulikemu G. Sun X. Chem. Eng. J. 2013;219:419–428. doi: 10.1016/j.cej.2012.12.101. [DOI] [Google Scholar]
- Shahabadi S. M. S. Reyhani A. Sep. Purif. Technol. 2014;132:50–61. doi: 10.1016/j.seppur.2014.04.051. [DOI] [Google Scholar]
- Reyhani A. Meighani H. M. Desalin. Water Treat. 2016;57:19642–19654. doi: 10.1080/19443994.2015.1101714. [DOI] [Google Scholar]
- Wang L. Wang X. J. Membr. Sci. 2006;283:109–115. doi: 10.1016/j.memsci.2006.06.017. [DOI] [Google Scholar]
- Teychene B. Collet G. Gallard H. J. Membr. Sci. 2016;505:185–193. doi: 10.1016/j.memsci.2016.01.039. [DOI] [Google Scholar]
- Yao W. Wang Z. Song P. J. Membr. Sci. 2018;559:75–86. doi: 10.1016/j.memsci.2018.04.042. [DOI] [Google Scholar]
- Hermia J. Chem. Eng. Res. Des. 1982:183–187. [Google Scholar]
- Yi X. S. Shi W. X. Yu S. L. Li X. H. Sun N. He C. Desalination. 2011;274:7–12. doi: 10.1016/j.desal.2010.10.019. [DOI] [Google Scholar]
- Li Y. S. Yan L. Xiang C. B. Hong L. J. Desalination. 2006;196:76–83. doi: 10.1016/j.desal.2005.11.021. [DOI] [Google Scholar]
- Yi X. S. Shi W. X. Yu S. L. Ma C. Sun N. Wang S. Jin L. M. Sun L. P. J. Hazard. Mater. 2011;193:37–44. doi: 10.1016/j.jhazmat.2011.06.063. [DOI] [PubMed] [Google Scholar]
- Zhang B. Yu S. Zhu Y. Shi W. Zhang R. Li L. RSC Adv. 2016;6:62411–62419. doi: 10.1039/C6RA12292B. [DOI] [Google Scholar]
- Peeva P. D. Knoche T. Pieper T. Ulbricht M. Sep. Purif. Technol. 2012;92:83–92. doi: 10.1016/j.seppur.2012.03.013. [DOI] [Google Scholar]
- Zhang R. Shi W. Yu S. Wang W. Zhang Z. Zhang B. Li L. Bao X. Desalination. 2015;373:27–37. doi: 10.1016/j.desal.2015.07.006. [DOI] [Google Scholar]
- Sen R. Swaminathan T. Process Biochem. 2005;40:2953–2958. doi: 10.1016/j.procbio.2005.01.014. [DOI] [Google Scholar]
- Arnot T. C. Field R. W. Koltuniewicz A. B. J. Membr. Sci. 2000;169:1–15. doi: 10.1016/S0376-7388(99)00321-X. [DOI] [Google Scholar]
- Tanudjaja H. J. Tarabara V. V. Fane A. G. Chew J. W. J. Membr. Sci. 2017;530:11–19. doi: 10.1016/j.memsci.2017.02.011. [DOI] [Google Scholar]
- Chen Z. Xiao T. Hu D. Xu J. Li X. Jia F. Wang H. Gu F. Su H. Zhang Y. Water Res. 2018;135:288–301. doi: 10.1016/j.watres.2018.02.027. [DOI] [PubMed] [Google Scholar]
- Xu J. Ma C. Cao B. Bao J. Sun Y. Shi W. Yu S. Process Saf. Environ. Prot. 2016;104:564–570. doi: 10.1016/j.psep.2016.06.020. [DOI] [Google Scholar]
- Tang J. Gong G. Su H. Wu F. Herman C. Appl. Energy. 2016;169:696–708. doi: 10.1016/j.apenergy.2016.02.042. [DOI] [Google Scholar]
- Ji F. Liu C. Zhou H. Liu H. Liao Y. Bull. Eng. Geol. Environ. 2016;77:127–139. doi: 10.1007/s10064-016-0951-x. [DOI] [Google Scholar]
- Gui P. Huang X. Chen Y. Qian Y. Desalination. 2003;151:185–194. doi: 10.1016/S0011-9164(02)00997-9. [DOI] [Google Scholar]
- Winer B. J., Brown D. R. and Michels K. M., Statistical principles in experimental design, McGraw-Hill, New York, 1971 [Google Scholar]
- Lin Y. H., Zhang J. C., Zhang B. Y. and Tang Z. H., SY/T 5329-2012 Water quality standard and practice for analysis of oilfield injecting water in clastic reservoirs (in Chinese), National Energy Administration, China, 2012 [Google Scholar]
- Song L. J. Membr. Sci. 1998;144:173–185. doi: 10.1016/S0376-7388(98)00057-X. [DOI] [Google Scholar]
- Jørgensen M. K. Keiding K. Christensen M. L. J. Membr. Sci. 2014;455:152–161. doi: 10.1016/j.memsci.2013.12.052. [DOI] [Google Scholar]


